Asset Bubble.
Satellite Business in Indonesia.
Indonesian satellite operators.
Satellite service providers in Indonesia.
Foreign satellite operators in Indonesia + Client lists.
Corporate analysis.
Financial performance.
Key persons.
BBRI, Wells Fargo, inflation management, inflation targeting, liquidity effect, libor fixing, libor scandal, fake accounts, bond shedding, shrinking the asset bubble, taper tantrum, quantitative easing
Call Girls in New Ashok Nagar, (delhi) call me [9953056974] escort service 24X7
Asset Bubble, Bank Rakyat Indonesia, and Satellite Business in Indonesia
1. Asset Bubble, Bank Rakyat Indonesia, & Satellite Business in Indonesia
Serabdi Sakti
Jakarta, August 2017
Sando Sasako
Asset Bubble,
Bank Rakyat Indonesia
&
Satellite Business in Indonesia
http://bit.ly/1S2Ibr
http://bit.ly/2wFoK9a
2. How to order:
Kindly send your purchase order by
SMS/texting to
+62 851 0518 7118
+62 852 1035 6516
by mentioning your name, email, and mobile
phone number.
Upon receiving your order, we shall notify
you our bank account number and the name of
the account holder.
Please notify us regarding your successful
payment to our mobile number above.
Upon effectiveness of the fund received in
our bank, we shall email the link to download
the ebook you have ordered and paid.
The link to download shall expire in 24
hours.
Thank you.
Cara pemesanan:
Silahkan order buku ini melalui SMS ke
+62 851 0518 7118
+62 852 1035 6516
dengan menyebut nama, email, , dan nomor
telpon yang bisa dihubungi.
Setelah order pemesanan diterima, kami
akan mengirimkan nomor dan nama pemilik
rekening.
Harap memberikan konfirmasi terhadap
pembayaran melalui transfer bank.
Setelah dana tercatat efektif di rekening bank
kami, kami akan memberikan email berisi link
untuk men-download buku elektronik yang
telah dipesan.
Link untuk men-download akan expire
dalam waktu 24 jam.
Terima kasih.
+62 851 0518 7118
3. Asset Bubble, Bank Rakyat Indonesia, & Satellite Business in Indonesia
i
Contents
Contents ...................................................................................................................................... i
List of Tables ........................................................................................................................... vii
List of Figures........................................................................................................................... xi
Some Background.......................................................................................................................1
The Authentication and Authorisation....................................................................................2
How this report proceeds and gets distinguished....................................................................4
Asset Bubble...............................................................................................................................5
Excessive Liquidity.................................................................................................................7
Excessive Liquidity: The Aftermath.......................................................................................9
The Liquidity Effect..............................................................................................................11
The Limit of Excessive Debts...............................................................................................13
Inflation Management in Indonesia ..........................................................................................15
Market Liquidity in Indonesia ..............................................................................................17
Playing with Interest Rates ...................................................................................................19
The Money Markets in Indonesia .........................................................................................21
What To Do with Assets Bubbled?...........................................................................................23
The volatile sterling against the dollar and euro...................................................................25
The Special Drawing Rights.................................................................................................27
Yuan Internationalisation......................................................................................................29
How Soros broke the Bank of England ....................................................................................31
The Exchange Rate Mechanism ...........................................................................................33
Blaming the Bundesbank......................................................................................................35
The German’s Hyperinflation Experience............................................................................38
Thanking the Bundesbank ....................................................................................................39
The Gold Standard and Bretton Woods System ...................................................................41
The Inflation Targeting: The Germany Experience..............................................................42
The Inflation Targeting: The UK Experience.......................................................................44
The LIBOR Fixing....................................................................................................................46
The LIBOR Scandal..............................................................................................................49
The Magnitude of LIBOR Scandal.......................................................................................53
The Price of High Fines........................................................................................................56
Hundreds of trillions USD derivatives was exchanged daily ...............................................58
Central Banks: The Initiator and Keeper of Widespreading Asset Bubble Phenomena ..........60
How to Detect and Spot Asset Bubble..................................................................................63
Asset Bubble aka Accounting Frauds: The Causalities........................................................65
Asset Bubble aka Accounting Frauds: The Red Flags .........................................................66
The Asset Bubble of Wells Fargo.........................................................................................69
Shrinking the Asset Bubble ......................................................................................................73
The Demand..........................................................................................................................75
The Demand: To weaken, to stimulate, or to create .............................................................77
The Price...............................................................................................................................79
4. Sando Sasako
ii
BRI’s financial profile in briefs................................................................................................81
BRI’s Financial Highlights.......................................................................................................83
Cash Flow .............................................................................................................................86
Income Statement .................................................................................................................87
Balance Sheet........................................................................................................................88
Risk Management Policy..........................................................................................................90
Dividend Policy ........................................................................................................................91
Maturity Profile ........................................................................................................................92
Maturity of Fund Borrowings...............................................................................................95
Maturity of Loans .................................................................................................................96
Loan Profile ..............................................................................................................................97
Credit Risk Exposure..........................................................................................................103
Liability Profile.......................................................................................................................105
Financial Structure..............................................................................................................106
Third Party Funds Profile ...................................................................................................108
Bonds Issued.......................................................................................................................111
Financial Performance............................................................................................................112
The Total Assets .................................................................................................................112
Earning Assets ....................................................................................................................112
Third Party’s Funds ............................................................................................................113
Loans...................................................................................................................................113
Equity..................................................................................................................................114
Profit Making..........................................................................................................................115
Revenues.............................................................................................................................115
Operating Profit, Net ..........................................................................................................115
Earnings Before Tax...........................................................................................................116
Earnings After Tax .............................................................................................................116
Retained Earnings...............................................................................................................117
Profit Profile ...........................................................................................................................119
Stock Performance..................................................................................................................121
Market Capitalisation..........................................................................................................122
Share Price..........................................................................................................................122
Stock Trading......................................................................................................................123
Investors’ Preferences.........................................................................................................125
Financial Ratios ......................................................................................................................126
Stock price ratios ................................................................................................................126
Liquidity .............................................................................................................................128
Profitability.........................................................................................................................130
The Shareholders ....................................................................................................................134
5. Asset Bubble, Bank Rakyat Indonesia, & Satellite Business in Indonesia
iii
Subsidiaries.............................................................................................................................139
BRI Syariah.........................................................................................................................139
BRI Agro.............................................................................................................................140
BRI Remittance...................................................................................................................141
BRI Life ..............................................................................................................................142
BRI Finance ........................................................................................................................143
Associated Entities..................................................................................................................144
Transactions with Related Companies....................................................................................145
The Analysts ...........................................................................................................................151
Corporate Profile.....................................................................................................................152
Milestones...........................................................................................................................154
e-channels ...........................................................................................................................155
Branch and Regional Offices..............................................................................................155
Head Office.....................................................................................................................155
Special Branch Office.....................................................................................................155
Overseas Branch Offices ................................................................................................155
Regional Offices .............................................................................................................156
Office of Subsidiaries .........................................................................................................157
Banking Divisions...............................................................................................................158
Organisation Structure ............................................................................................................160
Management Profile................................................................................................................161
Board of Commissioners ....................................................................................................162
Andrinof Achir Chaniago ...............................................................................................167
(Mustafa Abubakar)........................................................................................................167
Gatot Trihargo.................................................................................................................168
Ahmad Fuad Rahmany ...................................................................................................168
(Ahmad Fuad).................................................................................................................169
Nicolaus Teguh Budi Harjanto .......................................................................................170
Adhyaksa Dault...............................................................................................................170
A. Sonny Keraf ...............................................................................................................171
Vincentius Sonny Loho ..................................................................................................171
Jeffry Jefta Wurangian....................................................................................................172
Mahmud..........................................................................................................................172
Secretary to the Board of Commissioners ..........................................................................174
Committees of BoC ............................................................................................................175
Nomination and Remuneration Committee (NRC) ........................................................175
Audit Committee.............................................................................................................175
Risk Management Monitoring Committee (RMOC)......................................................177
Integrated Governance Committee (KTKT)...................................................................178
Board of Directors ..............................................................................................................181
Suprajarto........................................................................................................................186
(Asmawi Syam) ..............................................................................................................186
Sunarso............................................................................................................................186
6. Sando Sasako
iv
Donsuwan Simatupang...................................................................................................187
Haru Koesmahargyo .......................................................................................................187
Kuswiyoto.......................................................................................................................188
Mohammad Irfan ............................................................................................................188
Priyastomo......................................................................................................................188
Randi Anto......................................................................................................................189
Sis Apik Wijayanto.........................................................................................................189
Susy Liestiowaty.............................................................................................................190
Indra Utoyo.....................................................................................................................190
(Zulhelfi Abidin).............................................................................................................190
Senior Executive Vice President (SEVP) Profiles..............................................................192
Irianto Sunardi ................................................................................................................192
Adi Setyanto and Bardiyono Wiyatmojo........................................................................192
(Saptono Siwi) ................................................................................................................192
Hexana Tri Sasongko......................................................................................................193
Supari..............................................................................................................................193
Agus Noorsanto ..............................................................................................................193
Corporate Secretary ............................................................................................................194
Investor Relations ...............................................................................................................194
Senior Executive Profiles ...................................................................................................195
Head, IT Planning & Development Division .................................................................195
Head, Investment Service Division ................................................................................195
Head, Risk Management Division..................................................................................195
Head, Corporate Development & Strategy Division......................................................195
Head, Outsourcing Management Division .....................................................................195
Head, International Business Division ...........................................................................195
Head, Micro Business Development 2 ...........................................................................195
Head, Micro Business Policy & Strategy Division ........................................................195
Head, Fixed Assets Management Property.....................................................................195
Head, Credit Risk & Analysis Division..........................................................................195
Head, SOE Business 1 Division .....................................................................................195
Head, Treasury Division.................................................................................................196
Head, Procurement Division...........................................................................................196
Head, Transaction Banking Division..............................................................................196
Head, SOE Business 2 Division .....................................................................................196
Head, Finance & Accounting Management Division.....................................................196
Head, Digital Banking Operation Division ....................................................................196
Head, Institutional Banking 2 Division ..........................................................................196
Head, Loan Program & Partnership Division.................................................................196
Head, General Business Division ...................................................................................196
Head, Agribusiness Division ..........................................................................................196
Head, Consumer Loan Division .....................................................................................196
Head, SME & Medium Business Division.....................................................................196
Head, Institutional Banking 1 Division ..........................................................................197
Head, Wealth Management Division..............................................................................197
Head, Restructuring & Recovery Credit Division..........................................................197
Head, Human Capital Services Division ........................................................................197
Head, Operation Center Division ...................................................................................197
7. Asset Bubble, Bank Rakyat Indonesia, & Satellite Business in Indonesia
v
Head, Corporate Secretary Division ...............................................................................197
Head, Credit Card Division ............................................................................................197
Head, Service & Contact Center Division......................................................................197
Head, Marketing Communication Division....................................................................197
Head, Satellite & Terrestrial Division ............................................................................197
Chief Learning Officer, BRI Corporate University........................................................197
Head, Human Capital Policy & Development Division.................................................197
Head of Regional Offices ...................................................................................................198
Head, Jakarta 3 Regional Office.....................................................................................198
Head, Jakarta 1 Regional Office.....................................................................................198
Head, Malang Regional Office .......................................................................................198
Head, Bandar Lampung Regional Office .......................................................................198
Head, Palembang Regional Office..................................................................................198
Head, Surabaya Regional Office ....................................................................................198
Head, Pekanbaru Regional Office ..................................................................................198
Head, Jakarta 2 Regional Office.....................................................................................198
Head, Jayapura Regional Office .....................................................................................198
Head, Aceh Regional Office...........................................................................................198
Head, Semarang Regional Office ...................................................................................198
Head, Medan Regional Office ........................................................................................198
Head, Yogyakarta Regional Office.................................................................................198
Head, Denpasar Regional Office ....................................................................................199
Head, Padang Regional Office........................................................................................199
Head, Manado Regional Office ......................................................................................199
Head, Bandung Regional Office.....................................................................................199
Head, Banjarmasin Regional Office...............................................................................199
Head, Makassar Regional Office....................................................................................199
Head, Special Branch Office ..............................................................................................200
Head of Inspection Offices .................................................................................................200
Inspector, Malang Regional Office.................................................................................200
Inspector, Bandar Lampung Regional Office.................................................................200
Inspector, Palembang Regional Office ...........................................................................200
Inspector, Surabaya Regional Office..............................................................................200
Inspector, Manado Regional Office................................................................................200
Regional Audit of KP, KCK, UKLN & PA Regional Office.........................................200
Inspector, Aceh Regional Office ....................................................................................200
Inspector, Semarang Regional Office.............................................................................200
Inspector, Medan Regional Office..................................................................................200
Inspector, Pekanbaru Regional Office............................................................................200
Inspector, Makassar Regional Office..............................................................................200
Inspector, Yogyakarta Regional Office ..........................................................................201
Inspector, Denpasar Regional Office..............................................................................201
Inspector, Jakarta 3 Regional Office...............................................................................201
Inspector, Jakarta 2 Regional Office...............................................................................201
Inspector, Banjarmasin Regional Office.........................................................................201
Inspector, Bandung Regional Office ..............................................................................201
Inspector, Padang Regional Office .................................................................................201
8. Sando Sasako
vi
Satellite Business in Indonesia ...............................................................................................202
Satellite Capability..............................................................................................................202
Satellite Users .....................................................................................................................203
Revenue Generators in Satellite Services Business........................................................205
Revenue Generation in Satellite Navigation Services Business.....................................207
Revenue Generation in Optical Data Services................................................................209
Satellite Business Value .....................................................................................................210
Satellites in Orbit ................................................................................................................214
The Crowded Space Junk ...............................................................................................215
Telkom 3 Satellite...........................................................................................................216
The Proton-M Briz-M satellite launcher.........................................................................218
The Crowded Satellites in the Sky .................................................................................220
Typical Satellite Orbits...................................................................................................226
Typical Satellite Networks .................................................................................................230
Advantages of HTS System............................................................................................232
Frequency Band Allocated for Satellite Services ...........................................................233
Indonesian Satellite Operators............................................................................................236
BRIsat .............................................................................................................................238
Palapa Satellites..............................................................................................................240
Providers of Satellite Services in Broadcasting and Tekecommunications........................242
Foreign Satellite Operators on Indonesian Sky with its client list......................................247
References...............................................................................................................................253
Additional Readings ...........................................................................................................256
Suggested Readings............................................................................................................257
Readings on Satellites.........................................................................................................258
Index .......................................................................................................................................259
9. Asset Bubble, Bank Rakyat Indonesia, & Satellite Business in Indonesia
vii
List of Tables
Table 1 – Assets of 4 SOE’s banks and BCA, April 2017 .........................................................1
Table 2 – Inflation in Indonesia: Target vs Realised, 2001-2018.............................................15
Table 3 – The IMF’s SDR currency basket composition, 1969-2016......................................27
Table 4 – The weights of the 5 currencies in the new SDR basket, effective 20161001 .........28
Table 5 – CFETS currency basket and weight, 20170101 .......................................................29
Table 6 – The currency basket of ECU and euro, 1979-1998 ..................................................31
Table 7 – USD contributor panel banks in LIBOR, September 2017 ......................................47
Table 8 – Name of companies involved in EIRD and YIRD cartels........................................53
Table 9 – The list of banks fined by the European Commission due to practising cartels
in interest rate derivatives of euro and yen (EIRD & YIRD) ................................54
Table 10 – FCA Benchmark Fines on LIBOR Fixing Scandal ................................................54
Table 11 – Progress reports on WFC settlements of claims, June 2016 – August 2017 ..........71
Table 12 – Financial profile of Bank Rakyat Indonesia by geographicals, 2015-2016
(Rp mn) ..................................................................................................................81
Table 13 – Financial profile of Bank Rakyat Indonesia by client types/segments, 2015-
2016 (Rp mn) .........................................................................................................82
Table 14 – BRI’s financial highlights, Dec. 2008 – Dec. 2013 (Million Rp except Par
Value).....................................................................................................................83
Table 15 – BRI’s financial highlights, 2012-2016 (Rp bn)......................................................85
Table 16 – Bank Rakyat Indonesia: Cash flow, December 2012 – December 2016 (IDR
mn).........................................................................................................................86
Table 17 – Bank Rakyat Indonesia: Income statement, December 2012 – December
2016 (IDR mn).......................................................................................................87
Table 18 – Bank Rakyat Indonesia: Balance sheet, December 2012 – December 2016
(IDR mn)................................................................................................................88
Table 19 – Fair value of financial assets and liabilities of Bank Rakyat Indonesia, 2015-
2016 (Rp mn) .........................................................................................................89
Table 20 – Maturity profile of financial assets and liabilities of Bank Rakyat Indonesia,
2015-2016 (Rp mn)................................................................................................93
Table 21 – Fund borrowings profile of Bank Rakyat Indonesia based on maturity and
currency, 2015-2016 ..............................................................................................95
Table 22 – Loan profile of Bank Rakyat Indonesia by maturity, currency, and parties
involved, 2015-2016 (Rp mn)................................................................................96
Table 23 – Loan profile of Bank Rakyat Indonesia by client segment, currency, and
parties involved, 2015-2016 (Rp mn) ....................................................................97
Table 24 – Loan profile of Bank Rakyat Indonesia by economic sectors, currency, and
parties involved, 2015-2016 (Rp mn) ....................................................................98
Table 25 – Loan profile of Bank Rakyat Indonesia by loan type, currency, and parties
involved, 2015-2016 (Rp mn)................................................................................99
Table 26 – Loan profile of Bank Rakyat Indonesia by currency, 2015-2016 (Rp mn)..........100
Table 27 – Net Open Positions of Bank Rakyat Indonesia, 2015-2016 (Rp mn)...................101
Table 28 – Loan provided by BRI to SOEs, 2015-2016.........................................................102
Table 29 – Credit risk exposure of Bank Rakyat Indonesia by regions, 2015-2016 (Rp
mn).......................................................................................................................103
Table 30 – Credit risk exposure of Bank Rakyat Indonesia by economic sectors, 2015-
2016 (Rp mn) .......................................................................................................104
Table 31 – Liability structure of Bank Rakyat Indonesia, 2012-2017q2 (Rp mn) .................105
Table 32 – Financial structure of Bank Rakyat Indonesia, December 2007 – December
2016......................................................................................................................106
Table 33 – Financial structure of Bank Rakyat Indonesia, 2012-2017q2 (%) .......................107
10. Sando Sasako
viii
Table 34 – Third-party funds structure in Bank Rakyat Indonesia, 2012-2017q2 (Rp mn)...108
Table 35 – Profile of fund borrowings in US dollar of Bank Rakyat Indonesia based on
loan types and lenders, 2016 (US$ mn)...............................................................109
Table 36 – The profile of bonds issued by Bank Rakyat Indonesia, 2003-2016....................111
Table 37 – The highest peak and lowest trough points of the assets of Bank Rakyat
Indonesia, January 2002 – April 2017 (monthly figures)....................................112
Table 38 – The highest peak and lowest trough points of productive assets of Bank
Rakyat Indonesia, January 2002 – April 2017 (monthly figures)........................113
Table 39 – The highest peak and lowest trough points of third parties funds of Bank
Rakyat Indonesia, January 2002 – April 2017 (monthly figures)........................113
Table 40 – The highest peak and lowest trough points of loans of Bank Rakyat
Indonesia, January 2002 – April 2017 (monthly figures)....................................114
Table 41 – The highest peak and lowest trough points of equity of Bank Rakyat
Indonesia, January 2002 – April 2017 (monthly figures)....................................114
Table 42 – The highest peak and lowest trough points of revenues of Bank Rakyat
Indonesia, January 2002 – April 2017 (monthly figures)....................................115
Table 43 – The highest peak and lowest trough points of net operating profit of Bank
Rakyat Indonesia, January 2002 – April 2017 (monthly figures)........................116
Table 44 – The highest peak and lowest trough points of earnings before tax (EBT) of
Bank Rakyat Indonesia, January 2002 – April 2017 (monthly figures) ..............116
Table 45 – The highest peak and lowest trough points of earnings after tax (EAT) of
Bank Rakyat Indonesia, January 2002 – April 2017 (monthly figures) ..............117
Table 46 – The highest peak and lowest trough points of retained earnings of Bank
Rakyat Indonesia, January 2002 – April 2017 (monthly figures)........................117
Table 47 – Equity structure of Bank Rakyat Indonesia, 2012-2017q2 (Rp mn)....................119
Table 48 – Earnings structure and building blocks of Bank Rakyat Indonesia, 2012-
2017q2 .................................................................................................................120
Table 49 – BRI’s stock performance, 2006 – Jan. 2014.........................................................121
Table 50 – The highest peak and lowest trough points of market capitalitasion of share
of Bank Rakyat Indonesia, 10 November 2003 – 18 July 2017: Daily value
and change ...........................................................................................................122
Table 51 – The highest peak and lowest trough points of close price of share of Bank
Rakyat Indonesia, adjusted afer split & dividends, 10 November 2003 – 18
July 2017: Daily value and change......................................................................122
Table 52 – The highest peak and lowest trough points of close price of share of Bank
Rakyat Indonesia, adjusted afer split, 10 November 2003 – 18 July 2017:
Daily value and change........................................................................................123
Table 53 – The highest peak and lowest trough points of trading volume of share of
Bank Rakyat Indonesia, 17 November 2003 – 18 July 2017: Daily value and
change ..................................................................................................................123
Table 54 – The highest peak and lowest trough points of trading value of share of Bank
Rakyat Indonesia, 10 November 2003 – 18 July 2017: Daily value and
change ..................................................................................................................124
Table 55 – The largest figures in stock trading volume, value, and their daily changes,
20031110-20170718 ............................................................................................124
Table 56 – Investors’ preferences on the shares of Bank Rakyat Indonesia, 20170630 ........125
Table 57 – Financial ratios of Bank Rakyat Indonesia, 2012-2016 .......................................126
Table 58 – Share valuation of Bank Rakyat Indonesia: Current and Forward, 20170731.....126
Table 59 – Price ratios of shares of Bank Rakyat Indonesia, compared with S&P 500,
2007-2016............................................................................................................127
Table 60 – Liquidity ratio of Bank Rakyat Indonesia, December 2007 – December 2016 ...128
11. Asset Bubble, Bank Rakyat Indonesia, & Satellite Business in Indonesia
ix
Table 61 – Cash flow ratios of Bank Rakyat Indonesia, December 2007 – December
2016......................................................................................................................129
Table 62 – Profitability of Bank Rakyat Indonesia, December 2007 – December 2016 .......130
Table 63 – Profit margin profile of Bank Rakyat Indonesia, December 2007 – December
2016......................................................................................................................131
Table 64 – Revenue profile of Bank Rakyat Indonesia, December 2007 – December
2016 (Rp mn) .......................................................................................................132
Table 65 – Revenue sustainability of Bank Rakyat Indonesia, December 2007 –
December 2016 ....................................................................................................133
Table 66 – Typical shareholders of Bank Rakyat Indonesia, 2015-2016...............................134
Table 67 – Institutional shareholders of Bank Rakyat Indonesia, 20161230-20170630........136
Table 68 – Institutional investors’ ownership on equity in Bank Rakyat Indonesia,
20170731..............................................................................................................137
Table 69 – Funds’ ownership on equity in Bank Rakyat Indonesia, 20170731 .....................138
Table 70 – BRI’s subsidiaries, 20161231...............................................................................139
Table 71 – The acquisition cost of BRI’s subsidiaries, 2015-2016........................................139
Table 72 – The milestones of BRI Syariah.............................................................................139
Table 73 – Some financial figures of BRI Syariah, 2015-2016..............................................139
Table 74 – The milestones of BRI Agro.................................................................................140
Table 75 – Some financial figures of BRI Agro, 2015-2016..................................................141
Table 76 – The milestones of BRI Remittance.......................................................................141
Table 77 – Some financial figures of BRI Remittance, 2015-2016........................................142
Table 78 – The milestones of BRI Life ..................................................................................142
Table 79 – Some financial figures of BRI Life, 2015-2016 ...................................................142
Table 80 – The milestones of BRI Finance ............................................................................143
Table 81 – Some financial figures of BRI Finance, 2015-2016 .............................................143
Table 82 – The investments of Bank Rakyat Indonesia (associated companies) by cost
method, 2014-2016 ..............................................................................................144
Table 83 – Transactions of Bank Rakyat Indonesia with related parties by transaction
types, 2015-2016..................................................................................................145
Table 84 – BRI’s non-financial investments, 2016 ................................................................145
Table 85 – Material commitments of Bank Rakyat Indonesia on capital expenditures,
2015-2016 ............................................................................................................146
Table 86 – Typical transactions between Bank Rakyat Indonesia with affiliated parties ......146
Table 87 – Transactions of Bank Rakyat Indonesia with related parties by institutions’
name and transaction types, 2015-2016...............................................................148
Table 88 – The registered analysts of Bank Rakyat Indonesia, 2016.....................................151
Table 89 – The e-channels of Bank Rakyat Indonesia, 2012-2016........................................155
Table 90 – The typical offices of Bank Rakyat Indonesia, 2012-2016 ..................................155
Table 91 – The typical offices of Bank Rakyat Indonesia by province, 2016........................156
Table 92 – Concurrent positions of Commissioners of Bank Rakyat Indonesia,
20161231..............................................................................................................162
Table 93 – The commissioners of Bank Rakyat Indonesia: Supervised region and
Committees Membership, 20161231...................................................................163
Table 94 – The commissioners of Bank Rakyat Indonesia: Risk Management
Certification, 20161231 .......................................................................................164
Table 95 – The commissioners of Bank Rakyat Indonesia: Overseas Education,
Training, and Conferences, 2016.........................................................................165
Table 96 – The commissioners of Bank Rakyat Indonesia: Domestic Education,
Training, and Conferences, 2016.........................................................................166
Table 97 – The Board of Directors of Bank Rakyat Indonesia, 2015-2017 ...........................181
12. Sando Sasako
x
Table 98 – Area supervised by commissioners and directors of Bank Rakyat Indonesia,
20161231 .............................................................................................................182
Table 99 – The directors of Bank Rakyat Indonesia: Risk Management Certification,
20161231 .............................................................................................................183
Table 100 – The directors of Bank Rakyat Indonesia: Competency development
program, 2016......................................................................................................184
Table 101 – Job distribution of Directors and SEVPs of Bank Rakyat Indonesia within
Directors’ Committees, 20161231.......................................................................185
Table 102 – World’s satellite services revenue by 4 market segments, 2006-2011 (US$
bn)........................................................................................................................205
Table 103 – Satellite services revenue generation, 2012-2016 (US$ bn)...............................213
Table 104 – List of sub-bands of FSS and BSS spectrum......................................................233
Table 105 – Frequency band allocated for satellite services ..................................................234
Table 106 –Indonesian Satellites Filing in ITU, 2016............................................................236
Table 107 – Profile of Indonesian Satellites...........................................................................237
Table 108 – The list of companies providing satellite services in broadcasting and
telecommunications & satellites leased, 20161231 .............................................242
Table 109 –The list of foreign satellites orbitting and operating on Indonesian sky,
20161231 .............................................................................................................247
13. Asset Bubble, Bank Rakyat Indonesia, & Satellite Business in Indonesia
xi
List of Figures
Figure 1 – Monetary operation of Bank Indonesia and monetary instruments in
Indonesia................................................................................................................11
Figure 2 – Monetary operation of Bank Indonesia and monetary instruments ........................11
Figure 3 – Inflation targetting framework by macroeconomic indicators in Indonesia ...........13
Figure 4 – Inflation targetting framework by institutions responsible and in charge in
Indonesia................................................................................................................15
Figure 5 – Monthly inflation rates in Indonesia, January 2003-August 2017 ..........................16
Figure 6 – Monthly value of monetary operation in conventional banking in Indonesia,
Jan.2010-Aug.2017 (Rp bn)...................................................................................17
Figure 7 – Monetary operation in islamic banking industry in Indonesia, Jan. 2010-
August 2017 (% of total)........................................................................................17
Figure 8 – BI Rate, July 2005 – July 2016 ...............................................................................19
Figure 9 – BI 7-Day rate, April 2016 – August 2017...............................................................19
Figure 10 – BI Rate (July 2005 – July 2016) and BI 7-Day rate (April 2016 – August
2017) ......................................................................................................................19
Figure 11 – The transaction value of Indonesian money market, January 2010 – August
2017........................................................................................................................21
Figure 12 – JISDOR (Jakarta Interbank Spot Dollar Rate), 20130520-20170908
(US$/IDR)..............................................................................................................21
Figure 13 – US$/IDR buying price and its spread with the selling price of Bank
Indonesia, 20070102-20170908.............................................................................22
Figure 14 – FTSE All-Share index, 19990409-20170911........................................................23
Figure 15 – FTSE 100 index, 19840413-20170911 .................................................................23
Figure 16 – GBP/USD, 19710104-20170901...........................................................................25
Figure 17 – GBP/EUR, 19860508-20170911...........................................................................25
Figure 18 – GBP/USD, 19880304-20170911...........................................................................25
Figure 19 – RMB/USD, 19810101-20170912..........................................................................29
Figure 20 – ERM weighted mean and German inflation rates, 1971-1993..............................33
Figure 21 – ERM weighted mean and German inflation rates, quarterly, 1971-1993 .............33
Figure 22 – Overnight and long-term interest rates in Germany, 1970-1997...........................35
Figure 23 – Overnight and long-term interest rates in the UK, 1980-1997..............................35
Figure 24 – GBP/DM and UK base rates, 1992 .......................................................................35
Figure 25 – GBP/DM, 1990-2005 ............................................................................................35
Figure 26 – The inflation in the UK, 1270-1991 ......................................................................39
Figure 27 – Inflation targeting, unemployment, and economic growth in Germany,
1970-1997 ..............................................................................................................40
Figure 28 – Inflation targeting, unemployment, and economic growth in the UK, 1980-
1997........................................................................................................................40
Figure 29 – The US debts and its gold reserves, 1917-2012....................................................41
Figure 30 – The US debts & its limit and gold price, 2000-20170317.....................................41
Figure 31 – Inflation rates in Germany: Target vs Actual, 1970-1997.....................................42
Figure 32 – Inflation rates in the UK: Target vs Actual, 1980-1997........................................42
Figure 33 – Inflation rates in Germany: Target and actual, 1970-1997 ...................................43
Figure 34 – GBP/USD, 1980-1997...........................................................................................43
Figure 35 – The UK Phillips correlation in the 20th century: Inter-war era, 1926-1935 .........44
Figure 36 – The UK Phillips correlation in the 20th century: Post-WW2 era, 1961-2004 ......44
Figure 37 – Monthly inflation rates in Germany, 199201-201707...........................................45
Figure 38 – Monthly inflation rates in the UK, 198901-201708..............................................45
Figure 39 – Calculating LIBOR................................................................................................46
14. Sando Sasako
xii
Figure 40 – The spread between 3-month LIBOR with 3-month eurodollar deposit rate,
2007-April 2008.....................................................................................................50
Figure 41 – The spread between 3-month LIBOR with 3-month T-bill, 2007-April 2008......50
Figure 42 – The gap between 3-month LIBOR with 3-month T-bill, April 2007 – May
2008 .......................................................................................................................50
Figure 43 – CITI: The gap between 3-month LIBOR with 3-month T-bill, April 2007 –
May 2008 ...............................................................................................................51
Figure 44 – HBOS: The gap between 3-month LIBOR with 3-month T-bill, April 2007
– May 2008 ............................................................................................................51
Figure 45 – JP Morgan: The gap between 3-month LIBOR with 3-month T-bill, April
2007 – May 2008 ...................................................................................................51
Figure 46 – RBOC: The gap between 3-month LIBOR with 3-month T-bill, April 2007
– May 2008 ............................................................................................................51
Figure 47 – UBS: The gap between 3-month LIBOR with 3-month T-bill, April 2007 –
May 2008 ...............................................................................................................51
Figure 48 – West LB: The gap between 3-month LIBOR with 3-month T-bill, April
2007 – May 2008 ...................................................................................................51
Figure 49 – Penalties paid by banks and region, 2009-2016....................................................56
Figure 50 – Exchange-traded derivatives by currency, daily turnover, and regions, Sept.
2008 – June 2017...................................................................................................58
Figure 51 – Global OTC derivatives markets by notional principal, market value, and
credit exposure, June 2009 – Dec 2016 .................................................................58
Figure 52 – OTC FX derivatives by currency, maturity, and counterparty, June 2009 –
Dec 2016................................................................................................................59
Figure 53 – OTC interest rate derivatives by currency, maturity, and counterparty, June
2009 – Dec 2016....................................................................................................59
Figure 54 – OTC equity-linked derivatives by country, maturity, and counterparty, June
2009 – Dec 2016....................................................................................................59
Figure 55 – The Fed’s assets, Jan. 2007 – Sept. 2017..............................................................60
Figure 56 – The outstanding commercial & industrial loans in the US, Jan. 2007 – Sept.
2017 .......................................................................................................................60
Figure 57 – The balance sheets of 5 central banks and when compared with their own
GDP, 2007-2017....................................................................................................61
Figure 58 – S&P 500 Composite Index, Jan.2007–Sept.2017 .................................................61
Figure 59 – Emerging markets & corporate bonds, Jan.2007–Sept.2017 ................................61
Figure 60 – Wells Fargo cross-sell ratio, 1998–2016q2...........................................................69
Figure 61 – Federal Funds interest rate target, 2003 – Sept. 2017...........................................73
Figure 62 – The total assets of Bank Rakyat Indonesia, January 2002 – April 2017:
Value and Growth (monthly figures)...................................................................112
Figure 63 – The earning assets of Bank Rakyat Indonesia, January 2002 – April 2017:
Value and Growth (monthly figures)...................................................................112
Figure 64 – The third parties funds of Bank Rakyat Indonesia, January 2002 – April
2017: Value and Growth (monthly figures).........................................................113
Figure 65 – Loans of Bank Rakyat Indonesia, January 2002 – April 2017: Value and
Growth (monthly figures) ....................................................................................113
Figure 66 – The equity of Bank Rakyat Indonesia, January 2002 – April 2017: Value
and Growth (monthly figures) .............................................................................114
Figure 67 – The revenues of Bank Rakyat Indonesia, January 2002 – April 2017: Value
and Growth (monthly figures) .............................................................................115
Figure 68 – The net operating profit of Bank Rakyat Indonesia, January 2002 – April
2017: Value and Growth (monthly figures).........................................................115
15. Asset Bubble, Bank Rakyat Indonesia, & Satellite Business in Indonesia
xiii
Figure 69 – The earnings before tax (EBT) of Bank Rakyat Indonesia, January 2002 –
April 2017: Value and Growth (monthly figures) ...............................................116
Figure 70 – The earnings after tax (EAT) of Bank Rakyat Indonesia, January 2002 –
April 2017: Value and Growth (monthly figures) ...............................................116
Figure 71 – The retained earnings of Bank Rakyat Indonesia, January 2002 – April
2017: Value and Growth (monthly figures).........................................................117
Figure 72 – The market capitalisation of share of Bank Rakyat Indonesia, 10 November
2003 – 18 July 2017: Daily Value and Change ...................................................122
Figure 73 – The close price of share of Bank Rakyat Indonesia, 10 November 2003 – 18
July 2017: Daily Value and Change ....................................................................122
Figure 74 – The stock trading volume of Bank Rakyat Indonesia, 17 November 2003 –
18 July 2017: Daily Value and Change ...............................................................123
Figure 75 – The stock trading value of Bank Rakyat Indonesia, 10 November 2003 – 18
July 2017: Daily Value and Change ....................................................................123
Figure 76 – Investors’ preferences and trends on the share of Bank Rakyat Indonesia,
20170630..............................................................................................................125
Figure 77 – The organisation structure of Bank Rakyat Indonesia, 20161231 ......................160
Figure 78 – Satellite capabilities, May 2012 ..........................................................................202
Figure 79 – Satellites launched by functioning applications, 2006-2015...............................203
Figure 80 – Satellites launched by economic actors, 2006-2015 ...........................................204
Figure 81 – Satellites launched by regional operators, 2006-2015.........................................204
Figure 82 – World’s satellite services revenue by 4 market segments, 2006-2011 (US$
bn) ........................................................................................................................205
Figure 83 – Satellite operators wholesale revenue, 2005-2011..............................................205
Figure 84 – Fized Satellite Services (FSS) wholesale revenues by region, 2015...................206
Figure 85 – Mobile Satellite Services (MSS) wholesale revenues by region, 2015...............206
Figure 86 – Global Satellite Ground Equipment Revenues, 2012-2017 ................................207
Figure 87 – Global Navigation Satellite System (GNSS) market size, 2006-2015................208
Figure 88 – Global Navigation Satellite System (GNSS) Revenues by sat apps, 2015 .........208
Figure 89 – Satellite data pricing system in Global Navigation Satellite System (GNSS) ....209
Figure 90 – Satellite data sales in Global Navigation Satellite System (GNSS)....................210
Figure 91 – Satellite value chain, from upstream to downstream, 2016 ................................210
Figure 92 – Revenue generation in global satellite industry by 4 market segments, 2016 ....211
Figure 93 – Operational satellites by functions, 2016 ............................................................211
Figure 94 – The growth of revenue generation in global satellite industry, 2007-2016.........212
Figure 95 – World satellite industry revenues by segment, 2001-2011 (US$ bn)..................212
Figure 96 – Satellite services revenue generation, 2012-2016 ...............................................213
Figure 97 – Orbits of satellites in 2D......................................................................................214
Figure 98 – Orbits of satellites in 3D......................................................................................214
Figure 99 – Operational satellites by orbit, May 2012 ...........................................................215
Figure 100 – Telkom 3 satellite position as of 20170826 104836 Jakarta time.....................216
Figure 101 – Telkom 3 satellite position as of 20170826 104752 Jakarta time.....................216
Figure 102 – The orbit of Telkom 3S satellite as of 20170826 104636 Jakarta time.............217
Figure 103 – The orbit of Telkom 3 satellite as of 20170826 104614 Jakarta time...............217
Figure 104 – The orbit of Telkom 2 satellite as of 20170826 104546 Jakarta time...............217
Figure 105 – The orbit of Telkom 1 satellite as of 20170826 104520 Jakarta time...............217
Figure 106 – Telkom 3 satellite position as of 20170826 125419, Jakarta time....................218
Figure 107 – The initial plan of Proton-M/Breeze-M system trajectory in delivering
Telkom 3 satellite.................................................................................................218
Figure 108 – The Proton-M/Breeze-M system trajectory with another angle........................219
Figure 109 – Location of Breeze-M rocket body at likely breakup point ..............................219
16. Sando Sasako
xiv
Figure 110 – Non-GEO, non-GSO satellites orbiting Indonesian sky, 20170826 144454,
Jakarta time..........................................................................................................220
Figure 111 – Geostationary communication (GEO) satellites that is in service, inclined,
& planned.............................................................................................................222
Figure 112 – The geostationary orbit (GEO) satellite belt by frequency band features.........222
Figure 113 – The geostationary orbit (GEO) satellite belt by frequency band features
(2nd version)........................................................................................................223
Figure 114 – The 419 geosynchronous (GSO) satellites mapped by Denton, 20151120.......223
Figure 115 – Commercial communications satellites in geosynchronous orbit (GSO) &
the drifting Palapa C2 ..........................................................................................224
Figure 116 – Commercial communication satellites in GSO & the 88 broadcasting
services satellites (BSS).......................................................................................224
Figure 117 – Commercial communications satellites in geosynchronous orbit (GSO) &
the 67 Boeing satellites, 20120630......................................................................225
Figure 118 – SSL satellites in orbit ........................................................................................225
Figure 119 – Typical satellite orbits seen from above Earth’s North Pole: Van Allen
Belts; Iridium, ISS, Hubble; MEO (Glonass, Compass, Galileo, GPS), GEO....226
Figure 120 – Typical satellite orbits: LEO, MEO, Ellipso & Molnya, Glonass, GPS,
GSO (Clarke Belt), Van Allen Belts....................................................................227
Figure 121 – Typical satellite networks..................................................................................230
Figure 122 – Network of fixed satellite services with Inter-Satellite Links (ISL)
uncharted..............................................................................................................230
Figure 123 – Network of mobils satellite services .................................................................231
Figure 124 – Network of broadcasting satellite services........................................................231
Figure 125 – Larger benefits and controls for sat operator in HTS system............................232
Figure 126 – Fixed Satellite Services with and without HTS compared................................232
Figure 127 - Frequency band-(specturm) in satcoms .............................................................233
Figure 128 – Electromagnetic spectrum and the visible spectrum (light)..............................235
Figure 129 – The relationship between the different types of frequency and other wave
properties .............................................................................................................235
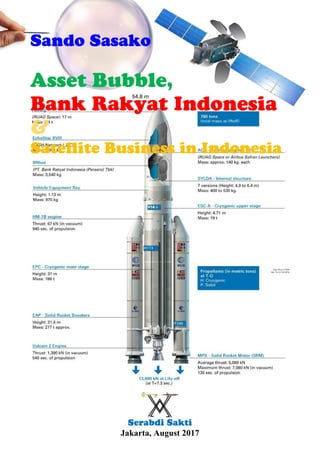
Figure 130 – Ariane 5: Typical flight events and standard trajectory for geostationary
transfer orbit.........................................................................................................239
17. Asset Bubble, Bank Rakyat Indonesia, & Satellite Business in Indonesia
1
Some Background
I was a little bit surprised by mid July 2017 to notify that Bank Rakyat Indonesia’s assets has
exceeded Bank Mandiri as of April 2017. It led to other questions since when and how about
the other SOE’s banks and Bank Central Asia. Some backtracking reveals that it was since
October 2014, BRI’s assets began exceeding Bank Mandiri. Their assets were IDR 712.45
trillion and IDR 707.97 accordingly.
Table 1 – Assets of 4 SOE’s banks and BCA, A pril 2017
Table – Assets of 4 SOE’s banks and BCA, April 2017
Bank Name
Total Assets
(IDR million)
Bank BTN 215,520,110
Bank BNI 558,428,701
Bank BRI 944,671,082
Bank Mandiri 891,773,622
Bank Central Asia 685,387,425
With IDR 1,000 trillion of assets, about IDR 996 trillion as of May 2017 to be precise, Bank
BRI has transformed itself to be a behemoth, a gigantic animal. It means they are and get even
hungrier, more starving than ever before. They’d call it, used to call it, pressures, burdens. Let
me tell you about a fable, a tale.
Let me take you to the Discovery Channel, National Geographic Channel, or whatever you
know and excited about. A whale. A shark. What do they tell you in common? Let’s change the
animal type to a tiger and lions. One with an a, the other with an s. An individual versus a herd,
the herd instinct.
Lions orchestrate their attacks on selected, particular individual buffalo, elephant, giraffe, or
any prey. We know nothing on how they communicate, surely not in any human language,
especially in English, how the herd pick and target the victim, one specific interest, potential
candidate.
They slowly move, split, and distancing themselves whilst preparing and get ready to make an
attack and ambush their prey. One prey. One big prey. Enough to feed them all, for some time.
It means that they must have been coordinating and planning and doing it on a regular basis.
Some regular basis. Silently. They need to eat to stay alive and preserve their lives.
Now, apply and implement the analysis on Bank Rakyat Indonesia. To begin with, we used to
think simple. Do the math. Let’s see their structures. The assets, the capital, the debts, the cash.
How do BRI grab the cash? There are signs, marks, traffic, traffic lights, trafficking. What do
they traffick?
Which one is worth? Which deal is worth the risk? The elephant risk? What is the most frenemy
of an elephant? An ant. Talking about the ant is always associated with its herd. An army. An
arm with a y letter. A bare hand. Ready to battle. At all times. There must be a queen. There
must be scouts. There are logistics. Chains. Networks. How do ants operate? There are martyrs.
Okay. Let’s scrap it out. Enough for today’s lesson. and enlightenment.
18. Sando Sasako
2
The Authentication and Authorisation
Some sites are heavily scripted. Some even have pushed to extract the HTML5 canvas image
data as it can be used to uniquely identify our computer, for every user coming, requesting the
site’s web server to respond. On the other hand, some browsers have been equipped with ‘no
script’ add-on, just like the TOR browser.
Having identified the browser has disabled their unique script to function to run and perform
and provide feedback as required and needed to extract user data’s credentials, the web server
will launch and initiate a CAPTCHA to validate if a human is indeed making the request or not.
Some captcha can be figured out easily. Some are not.
Most Australian websites have been intentionally and notoriously denying computers’ access
from Indonesian IP addresses. Some Australian domains can be easily tricked by using the TOR
browser. Some others implement the captcha filter that is definitely can’t be figured out. To
skip this ridiculous captcha, none is better than to disable the ‘no script’ add-on, restart the TOR
browser, and revisit the url. The browser will tell you then that such web server is so eager to
know your unique computer, such as MAC address or elses.
The user data credentials can take the forms of IP address, username and password, nonce, url,
http method, or others required by the web servers. The IP address can reveal your identity, at
least by internet service provider (ISP) name, domain name, client server name, hostname,
organisational identities such as name and location (of originating access).
User data credentials are somewhat an authentication tool. As they are validated, the web server
will provide some authorisation to the user, web surfer, to get access to the resources provided
by the web server(s). The mechanics of authentication and authorisation is an internet protocol
operating on the application layer, securing the data communication between the web server
and the browser.
As the browser or the client is talking to the web server, the client presents a list of supported
cipher suites (ciphers and hash functions). The browser is asking the web server to provide the
information required, provided by or in the SERP. The web server will pick their desired cipher
and hash function and generates cipher and session key.
The web server will respond by sending its identification in the form of a digital certificate, the
SSL certificate. The certificate contains the server name, the trusted certificate authority (CA),
and the server's public encryption key. Both client’s browser and web server will validate each
other the information exchanged. Denied access is given immediately and directly by any party
unsatisfied during the communication process.
For example, the browser will immediately display a warning from any link clicked within a
website logged in or from any SERP. Even if you want to reset the password, the website’s
server donot do what they claim to, such as sending a new password and/or a reset link. Here is
the warning claim:
“Deceptive Site! This web page at pdfsr.com has been reported as a deceptive site and has been
blocked based on your security preferences. Deceptive sites are designed to trick you into doing
something dangerous, like installing software, or revealing your personal information, like
passwords, phone numbers or credit cards. Entering any information on this web page may
result in identity theft or other fraud.”
19. Asset Bubble, Bank Rakyat Indonesia, & Satellite Business in Indonesia
3
On the other hand, the web server will take forever to respond to the request sent by the browser.
In late July 2017, the IDX web server refused to display the profile of BRI. Even the supposedly
to display the company profile uploaded in pdf. Is my IP address also blocked to access the IDX
website? The answer was a yes, as I knew then that the TOR browser with different IP address
was granted access to see it thru.
In the meantime, Google Chrome team and Mozilla engineers had found that Symantec had
misissued more than 30,000 SSL certificates, by doing shady SSL issuance practices. Google
then announced an intention to gradually remove support for Symantec certificates in Chrome
browser.1
Under Chrome's hood, Google will remove the Symantec's root SSL certificate. SSL certificates
are like giant trees with countless of branches, all converging back to the root certificate. Once
this certificate is removed, all certificates attached to this root will stop working too. It includes
other CAs bought by Symantec such as GeoTrust, Thawte, and RapidSSL.
Until Symantec revamps its SSL issuance procedures and comes up with a system that more
secure and reliable, it's highly unlikely that Google will allow a new Symantec root certificate
in Chrome again. In a similar decision, in November 2016, Google has untrusted the certificates
of WoSign and StartCom.2
1
Catalin Cimpanu, Google Outlines SSL Apocalypse for Symantec Certificates, 20170729,
http://bit.ly/2wdUXAq
2
Catalin Cimpanu, Google Ban Spells the End of Controversial Chinese HTTPS Provider, 20161103,
http://bit.ly/2x8Wqbj
20. Sando Sasako
4
How this report proceeds and gets distinguished
Like any other cashing in efforts, corporate raiders are more welcomed these days. Side
businesses and moonlightings are the ones they are after. They're not trying to get messy with
the parent company's businesses, but a more wide and deep access to the unthinkable on papers.
Capitalising on stock rides, either in upward and/or downward turns, is just a bonus.
The deep dives in this report are carried on to what had been published publicly by Bank Rakyat
Indonesia, either legal documents and/or financial documents. Some intelligence gathering
techniques3
have been implemented all the way down. Although, the term used in this report is
not what actually defined by the MI5.
The MI5’s principal techniques for gathering intelligence are:4
1. Covert Human Intelligence Sources or “agents”. Agents are people who are able to provide
secret information about a target of an investigation. Agents are not MI5 employees;
2. Directed surveillance, such as following and/or observing targets;
3. Interception of communications, such as monitoring emails or phone calls;
4. Communications data (including use of bulk communications data), information about
communications, such as “how and when” they were made, which is usually obtained from
communications service providers;
5. Bulk personal data, datasets containing information about a large number of people which
can be accessed in a targeted way to identify or find information about subject of interest;
6. Intrusive surveillance, such as putting eavesdropping devices in someone's home or car; and
7. Equipment interference, such as covertly accessing computers or other devices.
This report tries to be a business intelligence report, providing new insights that can empower
the reader of this report to make faster, more informed business decisions.
3
Even Microsoft also uses the same term in its site. Cf. Stephen Northcutt, Network Intrusion Detection: An
Analyst's Handbook, Ch.8, New Riders Publishing, 1999, 20170703, http://bit.ly/2xKJyfS
4
MI5, Gathering Intelligence, The Security Service of GCHQ, http://bit.ly/2xKguFC
21. Asset Bubble, Bank Rakyat Indonesia, & Satellite Business in Indonesia
253
References
Alioth LLC, UK inflation rate in 1992: 3.74%, http://bit.ly/2eWUxI9
Andrea Tan, Gavin Finch, and Liam Vaughan, RBS Instant Messages Show Libor Rates Skewed for
Traders. Bloomberg, 20120926.
Ann C. Chalstrom, "Inflation in the European Community: A Study Before and After German
Unification" Honors Projects. Paper 46. Illinois Wesleyan Univ. 1994. http://bit.ly/2fbXngh
Ashlyn Still and Jonathan Spicer, In shedding bonds, Fed aims for boring end to crisis-era measures,
Reuters, 20170918, http://reut.rs/2ykZiDN
Ashlyn Still and Jonathan Spicer, The legacy of the QE era, 20170918, Reuters Graphics, Thomson
Reuters Datastream, tmsnrt.rs/2jxgbbf, http://tmsnrt.rs/2xh1v4Q
Bates Research Group, LIBOR Explained: Understanding the LIBOR Scandal, 20130925.
Bundesbank, Inflation targeting, Deutsche Bundesbank – Service – I, 20170621, http://bit.ly/2wxi4pu
Bundesbank, Monetary targeting, Deutsche Bundesbank – Glossary, 20140701, http://bit.ly/2xHfhix
Bundesbank, Two-pillar strategy, Deutsche Bundesbank – Glossary, 20140701, http://bit.ly/2h9dDiG
Carrick Mollenkamp and Mark Whitehouse, Study Casts Doubt on Key Rate, WSJ, 20080529,
http://bit.ly/2wgcubC
Carrick Mollenkamp, Bankers Cast Doubt On Key Rate Amid Crisis, WSJ, 20080416,
http://bit.ly/2y2IvIG
Catalin Cimpanu, Google Ban Spells the End of Controversial Chinese HTTPS Provider, 20161103,
http://bit.ly/2x8Wqbj
Catalin Cimpanu, Google Outlines SSL Apocalypse for Symantec Certificates, 20170729,
http://bit.ly/2wdUXAq
Claire Suddath, "Why Did World War I Just End?". Time World. Time. 20101004.
http://ti.me/1B5jDHe
Connan Snider and Thomas Youle, Does the LIBOR reflect banks’ borrowing costs?, University of
Minnesota, 20100402.
Craig R. Whitney, Blaming the Bundesbank, 19931017, http://nyti.ms/2x2XqB4
Daniel L. Thornton, The Relationship Between the Daily and Policy-Relevant Liquidity Effects,
Federal Reserve Bank of St. Louis Review, Jan./Feb.2010, pp.73-88.
Daniel Schäfer, RBS settles row with ex-risk chief over final part of £1.9m bonus, FT, 20140103,
http://bit.ly/2xtPZDU
David Chapman, Gold And U.S. Debt Limit: Intertwined?, investing.com, 20170319,
http://bit.ly/2jAh1Ef
Douglas J. Keenan, My thwarted attempt to tell of Libor shenanigans, FT, 20120727.
Due, Brick and Mortar Business Failing? Here Are 4 Possible Reasons, 20170921,
http://bit.ly/2xqJykf
Forensic Accounting Club, Detection of Fraudulent Financial Statement Schemes,
forensicaccounting.club, 20160228, Last update: 20161122, http://bit.ly/2x6aLXG
Forensic Accounting Club, Financial Statement Fraud: Concealed Liabilities and Expenses,
forensicaccounting.club, 20160228, Last update: 20161122, http://bit.ly/2xhCzsf
Forensic Accounting Club, Financial Statement Fraud: Fictitious Revenues, forensicaccounting.club,
20160228, http://bit.ly/2wvvMJE
Forensic Accounting Club, Financial Statement Fraud: Fictitious Revenues, 20160228, Last update:
20161122, http://bit.ly/2wvvMJE
Forensic Accounting Club, Financial Statement Fraud: Improper Asset Valuation,
forensicaccounting.club, 20160228, updated: 20161122, http://bit.ly/2xpwo7v
Forensic Accounting Club, Financial Statement Fraud: Improper Disclosures,
forensicaccounting.club, 20160228, Last update: 20161122, http://bit.ly/2xQoGnY
Forensic Accounting Club, Financial Statement Fraud: Timing Differences, forensicaccounting.club,
20160228, Last update: 20161122, http://bit.ly/2yqsgCz
22. Sando Sasako
254
Forensic Accounting Club, What Is Financial Statement Fraud?, forensicaccounting.club, 20160228,
http://bit.ly/2ycWfgd
Frederic S. Mishkin and Adam S. Posen, Inflation Targeting: Lessons from Four Countries, Working
Paper 6126, National Bureau of Economic Research, Cambridge, MA, August 1997.
Gerold Grasshoff, et al, Global Risk 2017: Staying the Course in Banking, Boston Consulting Group,
March 2017.
Giancarlo Gandolfo: International Economics II: International Monetary Theory and Open-Economy
Macroeconomics, Springer Verlag, Berlin: 1987, pp.380-393, 404-411.
Hermann Simon, Whole Foods Is Becoming Amazon’s Brick-and-Mortar Pricing Lab, HBR,
20170912, http://bit.ly/2woJrly
International Monetary Fund: Global Financial Stability Report: Financial Stress and Deleveraging
Macrofinancial Implications and Policy, World economic and financial surveys, Oct. 2008.
J. Boughton, Silent Revolution: The IMF 1979-1989, 2001; in Ousmène Jacques Mandeng, Historic
perspectives on the purposes of the SDR, London School of Economics and New Sparta
Asset Management, 20150227, http://bit.ly/2y1Vmrv
Jacob Gyntelberg and Philip Wooldridge, Interbank rate fixings during the recent turmoil. Quarterly
Review. Bank for International Settlements. March 2008.
Justin H. Mims, The Wells Fargo Scandal and Efforts to Reform Incentive-Based Compensation in
Financial Institutions, NC Banking Inst. Vol.21, Issue 1, Article 21, 20170301.
Luca Benati, The inflation-targeting framework from an historical perspective, Monetary Assessment
and Strategy Division, Bank of England Quarterly Bulletin: Summer 2005. pp.160-168.
MI5, Gathering Intelligence, The Security Service of GCHQ, http://bit.ly/2xKguFC
Michael Ovaska, Central bank balance sheets, 20170822, tmsnrt.rs/2inHILp
Michael Tanglis, The “King of Cross-Sell” and the Race to Eight, Public Citizen, Washington DC,
20160929.
Mike Terceiro, Low balling the LIBOR – the LIBOR rate-rigging scandal, CCH Australian
Competition & Consumer Law Tracker, Issue 8, August 2012, http://bit.ly/2fuEWnd
Milton Friedman, “Factors Affecting the Level of Interest Rates,” in Proceedings of the 1968
Conference on Saving and Residential Financing. Chicago: United States Saving and Loan
League, 1969, pp.11-27; in Thomas M. Havrilesky and John T. Boorman, eds., Current
Issues in Monetary Theory and Policy. Arlington Heights, IL: AHM Publishing, 1976,
pp.362-78.
Moniek Wolters, The 1992-1993 ERM Crisis, Erasmus Student, http://bit.ly/2neyxf3.
Neel Kashkari, President of Minneapolis Federal Reserve Bank of Minneapolis, Monetary Policy and
Bubbles, 20170517, http://bit.ly/2f1e7mz
New York Southern District Court, Case No.1:15-cv-05844, Sonterra Capital Master Fund Ltd. et al
v. UBS AG et al, Document 121, 20151218
Rahul Mittal, A History of Finance – Black Wednesday, 20120413, http://bit.ly/2x08OMl
Robert Parker, Why did the Bretton Woods system fail?, 20161126, http://bit.ly/2jyaWYT
Robin Leigh-Pemberton, the Governor of Bank of England; The case for price stability, Quarterly
Bulletin, Bank of England, Nov. 1992, pp.441-448.
Rosa M Abrantes-Metz, Michael Kraten, Albert D Metz and Gim Seow, Libor Manipulation?, Social
Science Research Network, August 2008, p.2, http://bit.ly/2huL3F7
Sando Sasako, Coal Business in Indonesia, Serabdi Sakti, Jakarta, March 2017, p.80. The original
title of section is “Beating the Low Price Condition”. See the table of contents in this link
http://bit.ly/2rnOO2K.
Sando Sasako, Krisis Finansil Cina: Perspektif Kebijakan Moneter, Corporate Finance (Analisa
Laporan Keuangan), dan Investment Banking (Valuasi Nilai), Serabdi Sakti, Jakarta, March
2016. See the table of contents in this link http://bit.ly/2vMzUt0
Stephen Northcutt, Network Intrusion Detection: An Analyst's Handbook, Ch.8, New Riders
Publishing, 1999, 20170703, http://bit.ly/2xKJyfS
23. Asset Bubble, Bank Rakyat Indonesia, & Satellite Business in Indonesia
255
Steven Drobny, Inside the house of money: top hedge fund traders on profiting in the global markets,
John Wiley & Sons, Inc., Hoboken, New Jersey, 2006.
The State Council of PRC, State Council issues guideline on overseas investment, 20170818,
http://bit.ly/2vOVZny
Thomas M. Havrilesky and John T. Boorman, eds., Current Issues in Monetary Theory and Policy.
Arlington Heights, IL: AHM Publishing, 1976, pp.362-78.
US Consumer Financial Protection Bureau (CFPB), In the matter of: Wells Fargo Bank, N.A.,
Consent Order, Administrative Proceeding, 2016-CFPB-0015, 20160908, at p. 5, 7,
http://bit.ly/2dpnuyN.
Victoria Duff, Liquidity Effect in Economics, Chron, 20100820, Last Update 20161026,
http://bit.ly/2h7N0e7
Wells Fargo, 1999 Annual Report, p.7, http://bit.ly/2ddwP9O.
Werner Antweiler, European Currency Unit (ECU): A Brief History of the ECU, the Predecessor of
the Euro, The Pacific Exchange Rate Service, Sauder School of Business, University of
British Columbia, Vancouver, Canada, 20110119. http://fx.sauder.ubc.ca/ECU.html
Yue Wang, Betting On Brick-And-Mortar: Alibaba's Billion-Dollar Retail Experiment, Forbes,
20170827, http://bit.ly/2hj18Rz
24. Sando Sasako
256
Additional Readings
Andrew Beattie, The Greatest Currency Trades Ever Made, investopedia, 20080903,
http://bit.ly/1dvS8A9
Ben Moshinsky, George Soros didn't bet against the pound this time, Reuters, Business Insider US,
20160627, http://bit.ly/2f1Aaty
Chris Ratcliffe, RBS instant messages reveal traders skewed Libor, Bloomberg, Financial Post,
20120926, http://bit.ly/2jY6JOe
Guy Faulconbridge; George Soros did not bet against sterling just before Brexit vote: spokesman,
Reuters, 20160627, http://reut.rs/2jwcMcB
Justin Kuepper, Black Wednesday: George Soros' Bet Against Britain: How George Soros Broke the
Bank of England, thebalance.com, 20170828, http://bit.ly/2xFEuKh
Marion Dakers, George Soros: I did not bet against the pound before Brexit , telegraph.co.uk,
20160627, http://bit.ly/29ekKQ3
Mehreen Khan, George Soros did not bet against the pound before Brexit, ft.com, 20160627,
http://on.ft.com/2fpArai
Rohin Dhar, The Trade of the Century: When George Soros Broke the British Pound,
priceonomics.com, 20140515, Last update: 20160617, http://bit.ly/2cOGL7P
Sebastian Mallaby, 'Go for the Jugular', theatlantic.com, 20100604, http://theatln.tc/2xpQLS0
Stephen Gandel, How George Soros Lost Money In a Bad Brexit Bet, Reuters, fortune.com,
20160627, http://for.tn/2xF2b5k
Steve Schaefer, How George Soros Broke The British Pound And Why Hedge Funds Probably Can't
Crack The Euro, Forbes Flashback, 20150707, http://bit.ly/2xoJeTN
Suzanne Plunkett, How emails nailed Barclays, Reuters, Financial Post, 20120628,
http://bit.ly/2hv3Wre
Thomas Jaffe and Dyan Machan, How The Market Overwhelmed The Central Banks, Forbes,
19921109, http://bit.ly/2xoJeTN
Vince Veneziani, The Real Story Of How George Soros Shorted The Pound, Etching His Name Into
Financial History Forever, businessinsider.com, 20100604, http://read.bi/2y4FDY7
25. Asset Bubble, Bank Rakyat Indonesia, & Satellite Business in Indonesia
257
Suggested Readings
Alberto Martin, Origins and macroeconomic implications of asset bubbles, Jaume Ventura,
20110216, http://bit.ly/2xFVb8v
Charles Hugh Smith, The War On Cash: Why Now?, mises.org, 20150729, http://bit.ly/1IKLOUO
Charles Hugh Smith, Will The Crazy Global Debt Bubble Ever End?, blogspot.com,
seekingalpha.com, 20170528, http://bit.ly/2jwUFTL, http://bit.ly/2xp6Nvm
Forensic Accounting Club, Financial Statement Fraud Schemes, 20160228, Last update: 20161122,
http://bit.ly/2x5rABZ
Forensic Accounting Club, Financial Statement Fraud, 20160228, Last update: 20161122,
http://bit.ly/2faKxiu
Forensic Accounting Club, Fraud Detective Analysis of Financial Statements, 20160305, Last update:
20161122, http://bit.ly/2xppe33
Holly Black, Warning over 'mother of all asset bubbles', ftadviser.com, 20170605,
http://bit.ly/2h9bAr5
Izabella Kaminska, Bitcoin's surge fuels fears of asset bubble, afr.com, 20170515,
http://bit.ly/2x3GX0o
Jacob J, Cryptocurrency Bubble Will Burst: Aberdeen Asset Management, cointelegraph.com,
20170624, http://bit.ly/2h8tfzg
John Lyons and Shen Hong, Asset Bubbles From Stocks to Bonds to Iron Ore Threaten China,
wsj.com, 20161101, http://on.wsj.com/2fpkiSg
Kimberly Amadeo, Asset Bubble: Causes, Examples, and How to Protect Yourself, thebalance.com,
20170714, http://bit.ly/2h6Fj7N
Neel Kashkari, Monetary Policy and Bubbles, minneapolisfed.org, 20170517, http://bit.ly/2f1e7mz
Oliver Watts and Richard Hayler, Window Dressing in M&A Transactions, FTI Consulting, Inc,
20170522, http://bit.ly/2xFUQSX
perstirling.com, Per Stirling Capital Outlook - June 2017, 20170630, http://bit.ly/2h5L3Pi
Steve Goldstein, Fed's Kashkari says central bank should avoid fighting asset-price bubbles,
marketwatch.com, 20170517, http://on.mktw.net/2yddnTM
Wolf Richter, Brick & Mortar Retail Meltdown Fueled by Asset Stripping. Details Emerge in
Bankruptcy Courts, wolfstreet.com, 20170731, http://bit.ly/2h9myAv
Wolf Richter, Consumer Bankruptcies Rise for the First Time since 2010, wolfstreet.com, 20170205,
http://bit.ly/2xFx7Cm
Wolf Richter, Great Debt Unwind: Bankruptcies by Consumers and Businesses Jump,
wolfstreet.com, 20170606, http://bit.ly/2xF4ZiS
Wolf Richter, It Just Doesn't Let Up with Wells Fargo, wolfstreet.com, 20170729,
http://bit.ly/2h8HUKY
Wolf Richter, Next Asset Bubble Cracks: It's so Big even the Fed is Fretting, wolfstreet.com,
20170607, http://bit.ly/2qXUwbp, http://read.bi/2x8RSF3
Wolf Richter, Retail Meltdown Demolishes Mall Investors, wolfstreet.com, 20170509,
http://bit.ly/2xGUM5q
Wolf Richter, So When Will China's Debt Bubble Finally Blow Up?, wolfstreet.com, 20170817,
http://bit.ly/2wvFgVh
Wolf Richter, The Economy is Cracking under Too Much Debt, wolfstreet.com, 20161018,
http://bit.ly/2x5iwNu
Wolf Richter, The US Cities with the Biggest Housing Bubbles, wolfstreet.com, 20170829,
http://bit.ly/2iIssJh
26. Sando Sasako
258
Readings on Satellites
Anityo Nugroho, Satellite Communication – Part 1, 20110404, http://bit.ly/2wOwGW4
Arianespace, Flight VA 230: EchoStar XVIII and BRIsat, Launch Kit, 20160613, http://bit.ly/1S2Ibr
Bryce Space and Technology, 21 Years as the Voice of the U.S. Satellite Industry, SIA’s 20th annual
study of satellite industry data, Washington DC, 20170714.
Collins Student World Atlas, HarperCollins Publishers, 2005, ISBN 0 00 719549 4; in TAHN,
Geostationary Communication Satellites, 20071226, http://bit.ly/2wdWKbw
ComSoft VSAT Solutions GmbH, Satellites Served, http://bit.ly/2xIjdLU
Dan Meyers (Sydney Plavins), How to Rent and Operate a Satellite for $250 a Week!, 20160823,
http://bit.ly/2iCug6J
Diah Yuniarti, Studi Perkembangan dan Kondisi Satelit Indonesia (The Study of Development and
Condition of Indonesian Satellites), Puslitbang Sumber Daya dan Perangkat Pos dan
Informatika, Buletin Pos dan Telekomunikasi, Vol.11 No.2 Juni 2013 : 121-136.
Euroconsult, Satellite Value Chain: Snapshot 2016, Key Trends and Indicators on Supply & Demand
of the World Commercial Satellite Industry – An Extract, Executive Report, Paris,
20161213.
Geo Swan, North Pole February Ice-Pack 1978-2002, 20161023
Graham Templeton, Geek Answers: What is geostationary orbit, and why is it so important?,
20131214, geek.com, http://bit.ly/2iG8AXw
Hendra Santoso, ed, Data Statistik, Tahun 2016, Semester 2, Direktorat Jenderal Sumber Daya dan
Perangkat Pos dan Informatika, Kementerian Komunikasi dan Informatika, 20170519.
Innovation, Science & Economic Development Canada’s (ISED), Policy Framework for the
Provision of Fixed-Satellite Services (FSS) & Broadcasting-Satellite Services (BSS),
Spectrum Management & Telecommunications, Radio Systems Policy, RP-008, Issue 4,
Canda, June 2017
Innovation, Science & Economic Development Canada’s (ISED), Radio Spectrum Inventory: A 2010
Snapshot — Canada, Chapter 7–Satellite Services, http://bit.ly/2xMYZSo
Karaşimşek, Konu: Uydu sinyalleri ile ilgili sorular (Topic: Questions about satellite signals),
20080614, http://bit.ly/2vzedZk
Mahdi3d, INTELSAT 22 was thrown into orbit / lateral military cargo to Australia, IRNA, 20120326,
http://bit.ly/2w9sDlL, http://bit.ly/2wzJrTO, http://bit.ly/2ggiM88
Mick Denton, Electron/Ion Flux Model for Geosynchronous Orbit (GEO), 20150419, Last update:
20161007, http://bit.ly/2wNVrla
Mulyadi, Indonesian Satellite Service Regulatory Framework, Head of Satellite Management,
Ministry of Communications and Information Technology, ITU International Satellite
Symposium 2016, Bali, 6-8 September 2016.
n2yo.com, Telkom 3 Satellite details 2012-044A NORAD 38744, http://bit.ly/2xOgOkc
n2yo.com, What's Up In Your Sky?, http://bit.ly/2yjmHsM
Pacome Revillon, Fundamentals and Dynamics of the Satellite Communications Business, Inmarsat
Capital Markets Day 2016, Euroconsult, Paris, 20161007.
Patrick Blau, Yamal-402 Satellite healthy after Briz-M Upper Stage Failure, spaceflight101.net,
20121209, http://bit.ly/2wSmDOW, http://bit.ly/2xDtt8k
Satellite Industry Association, 21 Years as the Voice of the U.S. Satellite Industry.
Satellite Industry Association, Satellite 101: Satellite Technology and Services.
SatFlare.com, Telkom 3 - NORAD 38744 - 3D Online Satellite Tracking, http://bit.ly/2fDTVHX
Source: Gempar Ikka Wijaya, Nasib satelit bernilai Rp 1,8 triliun, 20120808, http://bit.ly/2vzZVad
Space Systems/Loral, LLC, SSL satellites in orbit, http://bit.ly/2vnmt2G
T.S. Kelso, Breeze-M Rocket Body (38746) Breakup, celestrak.com, 20121025, updated: 20121109,
http://bit.ly/2wzMiMR
Union of Concerned Scientists (UCS) Satellite Database; in Satellite Industry Association, Satellite
101: Satellite Technology and Services, Washington DC, 20130118.