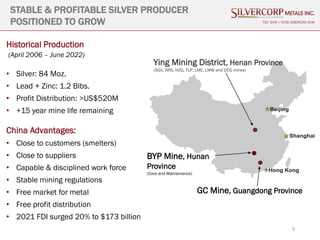
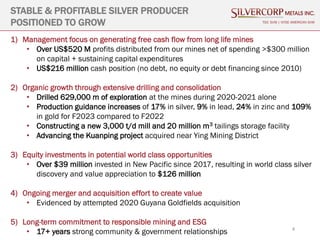
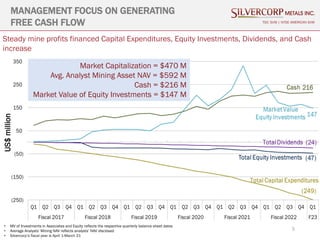
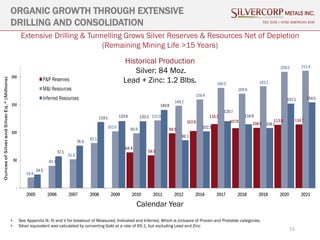
Silvercorp is a stable and profitable silver producer positioned for growth. It has a 15+ year mine life remaining at its operations in China. Through extensive drilling and consolidation efforts, Silvercorp is pursuing organic growth which has led to increased reserves and resources as well as new discoveries. This includes discovering gold deposits at its silver mines. Silvercorp also focuses on generating free cash flow which it uses to reinvest in its business, make equity investments, pay dividends, and increase its cash position.
Silvercorp Metals Inc. is a stable and profitable silver producer positioned for growth with over 15 years of mine life remaining in China. The company has historically produced 84 million ounces of silver and 1.2 billion pounds of lead and zinc while distributing over $520 million in profits. Management focuses on generating free cash flow from its long-life mines, organic growth through extensive drilling and consolidation, equity investments in potential opportunities, and ongoing merger and acquisition efforts to create value for shareholders.
Standard Oct 2022 SVM Corporate Presentation_Final.pdfJeffrey364256
Silvercorp is a stable and profitable silver producer positioned for growth with the following key attributes:
1) It has a 15+ year mine life remaining from its six operating mines in China, with a historical production of 84 million ounces of silver and 1.2 billion pounds of lead and zinc.
2) It has a strong balance sheet with $216 million in cash and no debt, and has distributed over $520 million in profits to shareholders since 2006.
3) It is focusing on organic growth through extensive exploration drilling and mine life expansion projects, with the goal of increasing annual silver production to 8 million ounces by 2026.
4) It has equity investments in other mining companies, such as a
Silvercorp is a stable and profitable silver producer positioned for growth through organic expansion and consolidation. It has a 15+ year mine life remaining at its operations in China and has produced over 81 million ounces of silver historically. Management is focused on generating free cash flow through extensive drilling, which has increased reserve estimates and discovery of new zones of mineralization. Recent drilling successes include discovery of gold deposits and wide zones of silver-lead mineralization at its mines. Silvercorp also pursues external growth through strategic investments and M&A opportunities.
This document provides an overview of Silvercorp Metals Inc., a silver producer positioned for growth. Key points include:
- Silvercorp has a 15+ year mine life remaining across its six mines in China, with a focus on generating free cash flow.
- The company is pursuing organic growth through extensive drilling programs and consolidation opportunities near its existing mines. Recent drilling has led to increased production guidance and new discoveries.
- Management prioritizes generating free cash flow to reinvest in the business, pay dividends, pursue acquisitions and equity investments, while maintaining a strong cash position with no debt.
- This strategy has provided value for investors through steady profits and dividends while also investing in development
1) Silvercorp is a stable and profitable silver producer positioned for growth, having produced 81 million ounces of silver and 1.1 billion pounds of lead and zinc over its operating history.
2) The company focuses on generating free cash flow from its long-life mines in China, having distributed $498 million in profits while investing over $300 million in capital expenditures.
3) Silvercorp plans to continue organic growth through extensive drilling, mine life expansion projects, and recent acquisitions like the Kuanping project, while also investing in exploration companies with potential world-class assets.
This document provides an overview of Silvercorp Metals Inc., a silver producer positioned for growth. Key points include:
- Silvercorp has a 15+ year mine life remaining across its six mines in China, with a focus on generating free cash flow.
- The company is pursuing organic growth through extensive drilling programs and consolidation opportunities near its existing mines. Recent drilling has led to increased production guidance and new discoveries.
- Management prioritizes generating free cash flow to reinvest in the business, pay dividends, pursue acquisitions and equity investments, while maintaining a strong cash position with no debt.
- This strategy has provided value for investors through steady profits and dividends while also investing in development
Silvercorp is a profitable silver producer positioned for growth. It has no debt, returns capital to shareholders through dividends and buybacks, and has a long mine life remaining in its Chinese operations. Silvercorp is investing to increase production and has exploration projects with upcoming catalysts. It also has a significant stake in another company. Silvercorp aims to increase annual silver production to around 8 million ounces by 2026 through constructing a new mill and expanding operations.
Oct 2022 -- SVM Corporate Presentation.pdfJeffrey364256
Silvercorp is a stable and profitable silver producer positioned for growth with the following key attributes:
- No debt and a history of profitable operations and cash flow generation to fund growth without financing since 2010.
- Guidance to increase silver, lead, zinc, and gold production in F2023 while maintaining industry-low costs.
- Exploration and development investments of $39 million since 2017 that have doubled reserves with further upside potential.
- Trading at a discount to peer average net asset value estimates providing compelling valuation for a growing producer.
Updated Oct 2022 SVM Corporate Presentation.pdfJeffrey364256
Silvercorp operates six silver mines in China and is positioned for production and cash flow growth. The company has a long history of stable silver production of over 80 million ounces since 2006. Silvercorp focuses on organic growth through ongoing exploration drilling, with over 1,900 km of drilling completed in the last two years leading to new discoveries, including high-grade gold veins. The company is also advancing projects like the Kuanping property and constructing a new larger processing plant. Silvercorp has a strong balance sheet with no debt and has returned over $520 million to shareholders, demonstrating a ability to generate profits and cash flow from its Chinese operations.
November 2022 SVM Corporate PresentationJeffrey364256
Silvercorp is a profitable silver producer positioned for growth. It has no debt and has returned over $175 million to shareholders. Production is expected to increase in fiscal 2023 for silver, lead, zinc, and gold. Extensive drilling continues to discover new mineralized zones and replace resources. A new mill and tailings facility are being constructed to increase throughput. Management focuses on generating free cash flow and providing value for investors through dividends and buybacks.
The corporate presentation provides an overview of Silvercorp Metals Inc., a Canadian primary silver producer with mines located in China. Key highlights include:
- Silvercorp has produced over 81 million ounces of silver over the past 15 years from its Ying Mining District in China. Reserves and resources continue to grow through exploration.
- Financial highlights show over $500 million in profit distributions and average analysts' mining NAV of $639.9 million. Silvercorp has generated over $500 million in organic cash flows.
- Production is expected to remain at approximately 6.5 million ounces of silver annually for the next 15 years based on current reserves and resources. Over 1 billion pounds of lead and zinc are also
Silvercorp Metals provides a corporate presentation highlighting its operations in China, financial performance, growing reserves and resources of silver, lead, and zinc, operating performance compared to peers, and strategy for quality growth. Key points include: Silvercorp being China's premier silver producer with over 81 million ounces produced over 15 years from its Ying mining district; average profit of $71/tonne in the most recent quarter; growing reserves and resources through extensive drilling; and a strategy of organic growth through drilling and pursuing acquisitions of projects that can generate over $50 million in annual cash flow. The presentation also covers Silvercorp's ESG objectives and highlights from its 2021 sustainability report.
Silvercorp Metals Inc. is a Canadian mining company and China's premier silver producer. The presentation provides an overview of Silvercorp's operations, including its three mines in China, financial highlights, growing reserves and resources of silver, lead and zinc, and exploration drilling results. It also discusses the company's strategy to pursue organic growth and acquisitions, incubation and investment strategy, and commitment to ESG and sustainability.
Silvercorp Metals Inc. is a Canadian mining company and China's premier silver producer. It operates three silver-lead-zinc mines in China: the Ying Mining District, GC Mine, and BYP Mine (currently on care and maintenance). Over the past 14 years, Silvercorp has produced 73 million ounces of silver, 1.03 billion pounds of lead, and 93 million pounds of zinc. It is forecasting silver production of 6.2-6.5 million ounces and cash costs of $66.6-73.6 per tonne in fiscal year 2021. Silvercorp also has a growing mineral reserve and resource base and pursues growth through organic expansion and potential acquisitions.
Silvercorp Metals Inc. is China's premier silver producer with operations focused in Henan and Guangdong Provinces. Over its 15-year mine life at the Ying Mining District, Silvercorp has produced over 77 million ounces of silver and expects to produce over 1 billion pounds of lead and zinc. Silvercorp has a track record of growing reserves and resources through exploration while generating significant organic cash flow and profits. It has distributed over $480 million to shareholders and reported $64 per tonne in profits in its most recent quarter.
Silvercorp Metals provides a corporate presentation that includes the following key points:
1. Silvercorp is China's premier silver producer with over 77 million ounces of silver produced over 15 years from its Ying Mining District in China.
2. The presentation highlights Silvercorp's financial performance, growing reserves and resources, low-cost production, and competitive valuation ratios compared to peers.
3. Silvercorp's strategy is to maintain steady production while pursuing organic and acquisition growth opportunities, and it has incubation investments in other precious metal companies to pursue additional growth opportunities.
This corporate presentation provides an overview of Silvercorp Metals Inc., a Canadian primary silver producer. Key points include:
- Silvercorp is China's premier silver producer with over 15 years of production history at its Ying Mining District in Henan Province.
- Exploration is ongoing to expand reserves and resources at existing mines, with a goal of maintaining over 15 years of remaining mine life. Recent drilling has encountered high grade silver, lead, zinc and gold intercepts.
- Silvercorp recently acquired the Zhonghe silver-lead property near its Ying operations and plans a major drilling campaign to define resources for mine permitting. Prior drilling at Zhonghe outlined extensive silver-lead-zinc mineralization
Silvercorp Metals is a Canadian mining company and China's premier silver producer. It operates three silver-lead-zinc mines in China - the Ying Mining District, GC Mine, and BYP Mine (currently on care and maintenance). Over its 15+ year mine life at the Ying District, Silvercorp has produced 79 million ounces of silver, 1.1 billion pounds of lead and zinc, and distributed $498 million in profits. Silvercorp is focused on organic growth through exploration and expanding existing operations, as well as pursuing acquisition opportunities. It also has strategic investments in other mining companies. The presentation discusses Silvercorp's operating and financial performance, reserves and resources, growth strategy, ESG objectives, and analyst
Silvercorp Metals Inc. is a Canadian mining company and China's premier silver producer. It operates three silver-lead-zinc mines in China - the Ying Mining District in Henan Province, the GC Mine in Guangdong Province, and the BYP Mine in Hunan Province, which is currently on care and maintenance. Over 14 years of mining operations, Silvercorp has produced over 75 million ounces of silver and over 1 billion pounds of lead and zinc. The presentation discusses Silvercorp's operating and financial performance, including historical and growing mineral reserves and resources, strong organic cash generation, increasing profit per tonne of ore mined, and high quarterly adjusted net income and free cash flow. Charts also
This corporate presentation provides an overview of Silvercorp Metals Inc. It discusses the company's operations in China, including its historical production of silver, lead, and zinc over 14 years. Financial highlights are presented showing the company's organic cash generation and expenditures. Metrics on the company's reserves and resources of silver, lead, and zinc are also included, demonstrating growth over time. Comparisons to peer companies on operating performance and valuation ratios are furnished. The company's strategy is outlined, focusing on steady production while pursuing growth opportunities through drilling, reopening a mine, acquisitions, and investments in other companies. One potential acquisition, the Zhonghe silver-lead property, is featured and prior drilling results are highlighted. The company
This corporate presentation provides an overview of Silvercorp Metals Inc. It begins with cautionary statements regarding forward-looking information and notes that all production, cost, and reserve figures are estimates subject to risks and uncertainties. The presentation then summarizes that Silvercorp is a leading silver producer in China with over 73 million ounces of silver produced over 14 years from its Ying Mining District. It also provides highlights of Silvercorp's strong financial performance, growing reserves and resources, high profit per tonne of ore mined, and competitive unit costs compared to peers.
- Asanko Gold reported operating and financial results for Q1 2017 that included record gold production of 58,187 ounces, in line with guidance. Net income was a positive US$7.8 million or US$0.04 per share.
- Mining rates were in line with milling rates at 339,096 tonnes per month with an average mined grade of 1.8 g/t. Processing rates were 20% above design at over 900,000 tonnes milled.
- Costs per ounce were higher than previous quarters due to lower grades and strip ratios from the new resource model as well as bringing maintenance costs forward, but are expected to decrease in H2 2017 with oxide mining and
- The document provides operating and financial results for Asanko Gold for Q4 2016 and full year 2016.
- Key highlights include commercial production being achieved ahead of schedule, ramping up to steady-state production by Q2, highest industry safety standards, and producing 57,178oz of gold in Q4 which exceeded feasibility projections.
- All-in sustaining costs declined quarter-over-quarter to $893/oz due to continued cost reductions and efficiencies, and the company had $66 million in cash and gold at the end of 2016.
- Asanko Gold reported quarterly production of 46,017 ounces of gold for Q2 2017, with cash costs of $930 per ounce.
- Mining rates were in line with the mill at 350,000 tonnes per month, with an average grade of 1.5 g/t due to mining lower grade areas.
- Processing saw 887,000 tonnes milled at a feed grade of 1.7 g/t and recovery of 94%, producing 46,017 ounces during the quarter.
- Cost performance was positive despite lower production and grades, with AISC decreasing 3% from the previous quarter to $930 per ounce.
Osisko reported its Q3 2017 results on November 9, 2017. Highlights included closing the acquisition of a precious metals portfolio from Orion for $1.1 billion, consisting of 74 royalties, streams, and offtakes. Osisko also declared a quarterly dividend of $0.05 per share and closed a $300 million convertible debenture offering. Subsequent to Q3, Osisko announced a US$65 million gold stream and private placement with Aquila Resources referenced to its Back Forty Project in Michigan.
The document discusses BeMetals Corp., a company focused on becoming a leading base and precious metals producer. It highlights BeMetals' management team which includes top mine finders and builders who have collectively discovered over 34 million ounces of gold. BeMetals has secured $25 million to date including a $7.5 million investment from strategic investor B2Gold Corp. BeMetals is well financed to deliver potential near-term catalysts from ongoing exploration programs at its Kazan Gold Project in Japan and other projects.
A 24 slide overview of BeMetals' exciting gold exploration in Japan, its zinc focused development asset in Idaho and tier 1 targeted copper exploration along the western extension of the Zambian Copperbelt.
Preso q3 2017 financial results presentation final.compressed-2asanko6699
- The company reported quarterly gold production of 49,293 ounces at an AISC of $975/ounce, with gold sales of 50,241 ounces generating $63.7 million in revenue.
- Mining interventions have yielded encouraging results with resource and reserve reconciliations delivering positive results.
- The company generated $40.7 million in cash from operating activities, up 20% from the previous quarter, with EBITDA of $31.3 million and net income of $4.7 million.
The report *State of D2C in India: A Logistics Update* talks about the evolving dynamics of the d2C landscape with a particular focus on how brands navigate the complexities of logistics. Third Party Logistics enablers emerge indispensable partners in facilitating the growth journey of D2C brands, offering cost-effective solutions tailored to their specific needs. As D2C brands continue to expand, they encounter heightened operational complexities with logistics standing out as a significant challenge. Logistics not only represents a substantial cost component for the brands but also directly influences the customer experience. Establishing efficient logistics operations while keeping costs low is therefore a crucial objective for brands. The report highlights how 3PLs are meeting the rising demands of D2C brands, supporting their expansion both online and offline, and paving the way for sustainable, scalable growth in this fast-paced market.
Enhancing Adoption of AI in Agri-food: IntroductionCor Verdouw
Introduction to the Panel on: Pathways and Challenges: AI-Driven Technology in Agri-Food, AI4Food, University of Guelph
“Enhancing Adoption of AI in Agri-food: a Path Forward”, 18 June 2024
More Related Content
Similar to Aug 2022 SVM Corporate Presentation.pdf
Updated Oct 2022 SVM Corporate Presentation.pdfJeffrey364256
Silvercorp operates six silver mines in China and is positioned for production and cash flow growth. The company has a long history of stable silver production of over 80 million ounces since 2006. Silvercorp focuses on organic growth through ongoing exploration drilling, with over 1,900 km of drilling completed in the last two years leading to new discoveries, including high-grade gold veins. The company is also advancing projects like the Kuanping property and constructing a new larger processing plant. Silvercorp has a strong balance sheet with no debt and has returned over $520 million to shareholders, demonstrating a ability to generate profits and cash flow from its Chinese operations.
November 2022 SVM Corporate PresentationJeffrey364256
Silvercorp is a profitable silver producer positioned for growth. It has no debt and has returned over $175 million to shareholders. Production is expected to increase in fiscal 2023 for silver, lead, zinc, and gold. Extensive drilling continues to discover new mineralized zones and replace resources. A new mill and tailings facility are being constructed to increase throughput. Management focuses on generating free cash flow and providing value for investors through dividends and buybacks.
The corporate presentation provides an overview of Silvercorp Metals Inc., a Canadian primary silver producer with mines located in China. Key highlights include:
- Silvercorp has produced over 81 million ounces of silver over the past 15 years from its Ying Mining District in China. Reserves and resources continue to grow through exploration.
- Financial highlights show over $500 million in profit distributions and average analysts' mining NAV of $639.9 million. Silvercorp has generated over $500 million in organic cash flows.
- Production is expected to remain at approximately 6.5 million ounces of silver annually for the next 15 years based on current reserves and resources. Over 1 billion pounds of lead and zinc are also
Silvercorp Metals provides a corporate presentation highlighting its operations in China, financial performance, growing reserves and resources of silver, lead, and zinc, operating performance compared to peers, and strategy for quality growth. Key points include: Silvercorp being China's premier silver producer with over 81 million ounces produced over 15 years from its Ying mining district; average profit of $71/tonne in the most recent quarter; growing reserves and resources through extensive drilling; and a strategy of organic growth through drilling and pursuing acquisitions of projects that can generate over $50 million in annual cash flow. The presentation also covers Silvercorp's ESG objectives and highlights from its 2021 sustainability report.
Silvercorp Metals Inc. is a Canadian mining company and China's premier silver producer. The presentation provides an overview of Silvercorp's operations, including its three mines in China, financial highlights, growing reserves and resources of silver, lead and zinc, and exploration drilling results. It also discusses the company's strategy to pursue organic growth and acquisitions, incubation and investment strategy, and commitment to ESG and sustainability.
Silvercorp Metals Inc. is a Canadian mining company and China's premier silver producer. It operates three silver-lead-zinc mines in China: the Ying Mining District, GC Mine, and BYP Mine (currently on care and maintenance). Over the past 14 years, Silvercorp has produced 73 million ounces of silver, 1.03 billion pounds of lead, and 93 million pounds of zinc. It is forecasting silver production of 6.2-6.5 million ounces and cash costs of $66.6-73.6 per tonne in fiscal year 2021. Silvercorp also has a growing mineral reserve and resource base and pursues growth through organic expansion and potential acquisitions.
Silvercorp Metals Inc. is China's premier silver producer with operations focused in Henan and Guangdong Provinces. Over its 15-year mine life at the Ying Mining District, Silvercorp has produced over 77 million ounces of silver and expects to produce over 1 billion pounds of lead and zinc. Silvercorp has a track record of growing reserves and resources through exploration while generating significant organic cash flow and profits. It has distributed over $480 million to shareholders and reported $64 per tonne in profits in its most recent quarter.
Silvercorp Metals provides a corporate presentation that includes the following key points:
1. Silvercorp is China's premier silver producer with over 77 million ounces of silver produced over 15 years from its Ying Mining District in China.
2. The presentation highlights Silvercorp's financial performance, growing reserves and resources, low-cost production, and competitive valuation ratios compared to peers.
3. Silvercorp's strategy is to maintain steady production while pursuing organic and acquisition growth opportunities, and it has incubation investments in other precious metal companies to pursue additional growth opportunities.
This corporate presentation provides an overview of Silvercorp Metals Inc., a Canadian primary silver producer. Key points include:
- Silvercorp is China's premier silver producer with over 15 years of production history at its Ying Mining District in Henan Province.
- Exploration is ongoing to expand reserves and resources at existing mines, with a goal of maintaining over 15 years of remaining mine life. Recent drilling has encountered high grade silver, lead, zinc and gold intercepts.
- Silvercorp recently acquired the Zhonghe silver-lead property near its Ying operations and plans a major drilling campaign to define resources for mine permitting. Prior drilling at Zhonghe outlined extensive silver-lead-zinc mineralization
Silvercorp Metals is a Canadian mining company and China's premier silver producer. It operates three silver-lead-zinc mines in China - the Ying Mining District, GC Mine, and BYP Mine (currently on care and maintenance). Over its 15+ year mine life at the Ying District, Silvercorp has produced 79 million ounces of silver, 1.1 billion pounds of lead and zinc, and distributed $498 million in profits. Silvercorp is focused on organic growth through exploration and expanding existing operations, as well as pursuing acquisition opportunities. It also has strategic investments in other mining companies. The presentation discusses Silvercorp's operating and financial performance, reserves and resources, growth strategy, ESG objectives, and analyst
Silvercorp Metals Inc. is a Canadian mining company and China's premier silver producer. It operates three silver-lead-zinc mines in China - the Ying Mining District in Henan Province, the GC Mine in Guangdong Province, and the BYP Mine in Hunan Province, which is currently on care and maintenance. Over 14 years of mining operations, Silvercorp has produced over 75 million ounces of silver and over 1 billion pounds of lead and zinc. The presentation discusses Silvercorp's operating and financial performance, including historical and growing mineral reserves and resources, strong organic cash generation, increasing profit per tonne of ore mined, and high quarterly adjusted net income and free cash flow. Charts also
This corporate presentation provides an overview of Silvercorp Metals Inc. It discusses the company's operations in China, including its historical production of silver, lead, and zinc over 14 years. Financial highlights are presented showing the company's organic cash generation and expenditures. Metrics on the company's reserves and resources of silver, lead, and zinc are also included, demonstrating growth over time. Comparisons to peer companies on operating performance and valuation ratios are furnished. The company's strategy is outlined, focusing on steady production while pursuing growth opportunities through drilling, reopening a mine, acquisitions, and investments in other companies. One potential acquisition, the Zhonghe silver-lead property, is featured and prior drilling results are highlighted. The company
This corporate presentation provides an overview of Silvercorp Metals Inc. It begins with cautionary statements regarding forward-looking information and notes that all production, cost, and reserve figures are estimates subject to risks and uncertainties. The presentation then summarizes that Silvercorp is a leading silver producer in China with over 73 million ounces of silver produced over 14 years from its Ying Mining District. It also provides highlights of Silvercorp's strong financial performance, growing reserves and resources, high profit per tonne of ore mined, and competitive unit costs compared to peers.
- Asanko Gold reported operating and financial results for Q1 2017 that included record gold production of 58,187 ounces, in line with guidance. Net income was a positive US$7.8 million or US$0.04 per share.
- Mining rates were in line with milling rates at 339,096 tonnes per month with an average mined grade of 1.8 g/t. Processing rates were 20% above design at over 900,000 tonnes milled.
- Costs per ounce were higher than previous quarters due to lower grades and strip ratios from the new resource model as well as bringing maintenance costs forward, but are expected to decrease in H2 2017 with oxide mining and
- The document provides operating and financial results for Asanko Gold for Q4 2016 and full year 2016.
- Key highlights include commercial production being achieved ahead of schedule, ramping up to steady-state production by Q2, highest industry safety standards, and producing 57,178oz of gold in Q4 which exceeded feasibility projections.
- All-in sustaining costs declined quarter-over-quarter to $893/oz due to continued cost reductions and efficiencies, and the company had $66 million in cash and gold at the end of 2016.
- Asanko Gold reported quarterly production of 46,017 ounces of gold for Q2 2017, with cash costs of $930 per ounce.
- Mining rates were in line with the mill at 350,000 tonnes per month, with an average grade of 1.5 g/t due to mining lower grade areas.
- Processing saw 887,000 tonnes milled at a feed grade of 1.7 g/t and recovery of 94%, producing 46,017 ounces during the quarter.
- Cost performance was positive despite lower production and grades, with AISC decreasing 3% from the previous quarter to $930 per ounce.
Osisko reported its Q3 2017 results on November 9, 2017. Highlights included closing the acquisition of a precious metals portfolio from Orion for $1.1 billion, consisting of 74 royalties, streams, and offtakes. Osisko also declared a quarterly dividend of $0.05 per share and closed a $300 million convertible debenture offering. Subsequent to Q3, Osisko announced a US$65 million gold stream and private placement with Aquila Resources referenced to its Back Forty Project in Michigan.
The document discusses BeMetals Corp., a company focused on becoming a leading base and precious metals producer. It highlights BeMetals' management team which includes top mine finders and builders who have collectively discovered over 34 million ounces of gold. BeMetals has secured $25 million to date including a $7.5 million investment from strategic investor B2Gold Corp. BeMetals is well financed to deliver potential near-term catalysts from ongoing exploration programs at its Kazan Gold Project in Japan and other projects.
A 24 slide overview of BeMetals' exciting gold exploration in Japan, its zinc focused development asset in Idaho and tier 1 targeted copper exploration along the western extension of the Zambian Copperbelt.
Preso q3 2017 financial results presentation final.compressed-2asanko6699
- The company reported quarterly gold production of 49,293 ounces at an AISC of $975/ounce, with gold sales of 50,241 ounces generating $63.7 million in revenue.
- Mining interventions have yielded encouraging results with resource and reserve reconciliations delivering positive results.
- The company generated $40.7 million in cash from operating activities, up 20% from the previous quarter, with EBITDA of $31.3 million and net income of $4.7 million.
Similar to Aug 2022 SVM Corporate Presentation.pdf (20)
The report *State of D2C in India: A Logistics Update* talks about the evolving dynamics of the d2C landscape with a particular focus on how brands navigate the complexities of logistics. Third Party Logistics enablers emerge indispensable partners in facilitating the growth journey of D2C brands, offering cost-effective solutions tailored to their specific needs. As D2C brands continue to expand, they encounter heightened operational complexities with logistics standing out as a significant challenge. Logistics not only represents a substantial cost component for the brands but also directly influences the customer experience. Establishing efficient logistics operations while keeping costs low is therefore a crucial objective for brands. The report highlights how 3PLs are meeting the rising demands of D2C brands, supporting their expansion both online and offline, and paving the way for sustainable, scalable growth in this fast-paced market.
Enhancing Adoption of AI in Agri-food: IntroductionCor Verdouw
Introduction to the Panel on: Pathways and Challenges: AI-Driven Technology in Agri-Food, AI4Food, University of Guelph
“Enhancing Adoption of AI in Agri-food: a Path Forward”, 18 June 2024
SATTA MATKA DPBOSS KALYAN MATKA RESULTS KALYAN MATKA MATKA RESULT KALYAN MATKA TIPS SATTA MATKA MATKA COM MATKA PANA JODI TODAY BATTA SATKA MATKA PATTI JODI NUMBER MATKA RESULTS MATKA CHART MATKA JODI SATTA COM INDIA SATTA MATKA MATKA TIPS MATKA WAPKA ALL MATKA RESULT LIVE ONLINE MATKA RESULT KALYAN MATKA RESULT DPBOSS MATKA 143 MAIN MATKA KALYAN MATKA RESULTS KALYAN CHART KALYAN CHART
SATTA MATKA DPBOSS KALYAN MATKA RESULTS KALYAN CHART KALYAN MATKA MATKA RESULT KALYAN MATKA TIPS SATTA MATKA MATKA COM MATKA PANA JODI TODAY BATTA SATKA MATKA PATTI JODI NUMBER MATKA RESULTS MATKA CHART MATKA JODI SATTA COM INDIA SATTA MATKA MATKA TIPS MATKA WAPKA ALL MATKA RESULT LIVE ONLINE MATKA RESULT KALYAN MATKA RESULT DPBOSS MATKA 143 MAIN MATKA KALYAN MATKA RESULTS KALYAN CHART
NIMA2024 | De toegevoegde waarde van DEI en ESG in campagnes | Nathalie Lam |...BBPMedia1
Nathalie zal delen hoe DEI en ESG een fundamentele rol kunnen spelen in je merkstrategie en je de juiste aansluiting kan creëren met je doelgroep. Door middel van voorbeelden en simpele handvatten toont ze hoe dit in jouw organisatie toegepast kan worden.
Prescriptive analytics BA4206 Anna University PPTFreelance
Business analysis - Prescriptive analytics Introduction to Prescriptive analytics
Prescriptive Modeling
Non Linear Optimization
Demonstrating Business Performance Improvement
KALYAN CHART SATTA MATKA DPBOSS KALYAN MATKA RESULTS KALYAN MATKA MATKA RESULT KALYAN MATKA TIPS SATTA MATKA MATKA COM MATKA PANA JODI TODAY BATTA SATKA MATKA PATTI JODI NUMBER MATKA RESULTS MATKA CHART MATKA JODI SATTA COM INDIA SATTA MATKA MATKA TIPS MATKA WAPKA ALL MATKA RESULT LIVE ONLINE MATKA RESULT KALYAN MATKA RESULT DPBOSS MATKA 143 MAIN MATKA KALYAN MATKA RESULTS KALYAN CHART
SATTA MATKA DPBOSS KALYAN MATKA RESULTS KALYAN CHART KALYAN MATKA MATKA RESULT KALYAN MATKA TIPS SATTA MATKA MATKA COM MATKA PANA JODI TODAY BATTA SATKA MATKA PATTI JODI NUMBER MATKA RESULTS MATKA CHART MATKA JODI SATTA COM INDIA SATTA MATKA MATKA TIPS MATKA WAPKA ALL MATKA RESULT LIVE ONLINE MATKA RESULT KALYAN MATKA RESULT DPBOSS MATKA 143 MAIN MATKA KALYAN MATKA RESULTS KALYAN CHART
High-Quality IPTV Monthly Subscription for $15advik4387
Experience high-quality entertainment with our IPTV monthly subscription for just $15. Access a vast array of live TV channels, movies, and on-demand shows with crystal-clear streaming. Our reliable service ensures smooth, uninterrupted viewing at an unbeatable price. Perfect for those seeking premium content without breaking the bank. Start streaming today!
https://rb.gy/f409dk
SATTA MATKA DPBOSS KALYAN MATKA RESULTS KALYAN CHART KALYAN MATKA MATKA RESULT KALYAN MATKA TIPS SATTA MATKA MATKA COM MATKA PANA JODI TODAY BATTA SATKA MATKA PATTI JODI NUMBER MATKA RESULTS MATKA CHART MATKA JODI SATTA COM INDIA SATTA MATKA MATKA TIPS MATKA WAPKA ALL MATKA RESULT LIVE ONLINE MATKA RESULT KALYAN MATKA RESULT DPBOSS MATKA 143 MAIN MATKA KALYAN MATKA RESULTS KALYAN CHART
Satta Matka Dpboss Kalyan Matka Results Kalyan Chart
Aug 2022 SVM Corporate Presentation.pdf
1. 1
STABLE & PROFITABLE SILVER
PRODUCER POSITIONED TO GROW
Corporate Presentation
August 2022
TSX: SVM
NYSE AMERICAN: SVM
2. 2
CAUTIONARY STATEMENTS
TSX: SVM | NYSE AMERICAN SVM
Cautionary Note Regarding Forward-Looking Information and Forward-Looking Statements
This presentation includes statements concerning future operations, prospects, strategies, plans, projections, forecasts, financial conditions and economic performance, as well as intentions
and objectives, that are “forward-looking statements” within the meaning of the United States Private Securities Litigation Reform Act of 1995 and “forward-looking information” within the
meaning of applicable Canadian provincial securities laws (collectively, “forward-looking statement”). Forward-looking statements are typically identified by words such as: “anticipates,”
“expects,” “believes,” “forecasts”, “projects”, “estimates,” “seeks,” “plans,” “intends”, “strategies”, “targets”, “goals”, “objectives”, “budgets”, “schedules”, “potential” or variations thereof or
stating that certain actions, events or results “may”, “could”, “would”, “might” or “will” be taken, occur or be achieved, or the negative of any of these terms and similar expressions. All
statements, other than statements of historical fact, included in this presentation including, without limitation, the anticipated business plans and timing of future activities of Silvercorp Metals
Inc. (the “Company” or “Silvercorp”), the possibility, timing and amount of estimated future production, costs of production, and reserve determination and reserve conversion rates, and
statements with respect to the price of silver, lead and zinc, are forward-looking statement. Forward-looking statements are necessarily based upon a number of assumptions, estimates,
beliefs, expectations and opinions as of the date of the disclosure that, while considered reasonable by management, are inherently subject to significant uncertainties and contingencies.
Forward-looking statements by the Company are not guarantees of future results or performance, and actual results may differ materially from those in forward-looking statements as a result of
known and unknown risks, uncertainties and various other factors. Such risks and uncertainties include fluctuations in precious metal prices, unpredictable results of exploration activities,
uncertainties inherent in the estimation of mineral reserves and resources, fluctuations in the costs of goods and services, problems associated with exploration, development and mining
operations, changes in legal, social or political conditions in the jurisdictions where the Company operates, delays in obtaining governmental permits and approvals, lack of appropriate funding,
accidents, other risks of the mining industry, risks relating to epidemics or pandemics such as COVID–19 and other risk factors as discussed in the Company’s filings with Canadian and United
States securities regulatory agencies. Should one or more of these risks or uncertainties materialize, or should underlying assumptions or estimates prove incorrect, actual results may vary
materially from those anticipated, believed, estimated or expected. The Company cautions readers not to place undue reliance on any such forward-looking statements, which speak only as of
the date made. The Company disclaims any obligation to update any forward-looking statements in this presentation, except as otherwise required by law. No securities regulatory authority
has in any way passed on the merits of this presentation nor any securities referred herein.
Cautionary Note to U.S. Investors concerning estimates of Measured, Indicated and Inferred Resources
Silvercorp has prepared disclosure in accordance with Canadian reporting standards, which differ significantly from the current requirements of the U.S. Securities and Exchange Commission
(the “SEC”) set out in Industry Guide 7. The terms “proven mineral reserve”, “probable mineral reserve” and “mineral reserves” used in this presentation are in reference to the mining terms
defined in the Canadian Institute of Mining, Metallurgy and Petroleum Standards (the “CIM Standards”), which definitions have been adopted by National Instrument 43-101 Standards of
Disclosure for Mineral Projects (“NI 43-101”) and differ from the definitions in the SEC’s Industry Guide 7. “Reserves” under the CIM Standards may not qualify as reserves under Industry
Guide 7. Under SEC Industry Guide 7, a mineral reserve is defined as a part of a mineral deposit, which could be economically and legally extracted or produced at the time the reserve
determination is made. Accordingly, information contained in this presentation providing descriptions of our mineral deposits in accordance with NI 43-101 may not be comparable to similar
information made public by other U.S. companies subject to the United States federal securities laws and the rules and regulations thereunder. In addition, the terms “mineral resource”,
“measured mineral resource”, “indicated mineral resource” and “inferred mineral resource” are defined in the CIM Standards and are required to be disclosed by NI 43-101; however, these
terms are not defined terms under SEC Industry Guide 7 and are normally not permitted to be used in reports and registration statements filed with the SEC. Investors are cautioned not to
assume that any part or all of mineral deposits in these categories will ever be converted into reserves. “Inferred mineral resources” are that part of a mineral resource for which quantity and
grade or quality are estimated on the basis of limited geological evidence and sampling. Such geological evidence is sufficient to imply but not verify geological and grade or quality continuity.
However, it is reasonably expected that the majority of inferred mineral resources could be upgraded to indicated mineral resources with continued exploration. Under Canadian rules,
estimates of inferred mineral resources may not form the basis of feasibility or pre-feasibility studies, except in rare cases. Investors are cautioned not to assume that all or any part of an
inferred mineral resource is economically or legally mineable. Disclosure of “contained ounces” in a resource is permitted disclosure under Canadian regulations; however, the SEC normally
only permits issuers to report mineralization that does not constitute “reserves” by SEC standards as in place tonnage and grade without reference to unit measures.
Effective February 25, 2019, the SEC adopted new mining disclosure rules under subpart 1300 of Regulation S-K of the United States Securities Act of 1933, as amended (the “SEC
Modernization Rules”), with compliance required for the first fiscal year beginning on or after January 1, 2021. The SEC Modernization Rules replace the historical property disclosure
requirements included in SEC Industry Guide 7. As a result of the adoption of the SEC Modernization Rules, the SEC now recognizes estimates of “Measured Mineral Resources”, “Indicated
Mineral Resources” and “Inferred Mineral Resources”. In addition, the SEC has amended its definitions of “Proven Mineral Reserves” and “Probable Mineral Reserves” to be substantially
similar to corresponding definitions under the CIM Standards. During the period leading up to the compliance date of the SEC Modernization Rules, information regarding minimal resources or
reserves contained or referenced in this presentation may not be comparable to similar information made public by companies that report according to U.S. standards. While the SEC
Modernization Rules are expected to be “substantially similar” to the CIM Standards, readers are cautioned that there are differences between the SEC Modernization Rules and the CIM
Standards.
3. 3
STABLE & PROFITABLE SILVER PRODUCER
POSITIONED TO GROW
Historical Production
(April 2006 – June 2022)
• Silver: 84 Moz.
• Lead + Zinc: 1.2 Blbs.
• Profit Distribution: >US$520M
• +15 year mine life remaining
China Advantages:
• Close to customers (smelters)
• Close to suppliers
• Capable & disciplined work force
• Stable mining regulations
• Free market for metal
• Free profit distribution
• 2021 FDI surged 20% to $173 billion
TSX: SVM | NYSE AMERICAN SVM
Ying Mining District, Henan Province
(SGX, HPG, HZG, TLP, LME, LMW and DCG mines)
GC Mine, Guangdong Province
BYP Mine, Hunan
Province
(Care and Maintenance)
4. 4
STABLE & PROFITABLE SILVER PRODUCER
POSITIONED TO GROW TSX: SVM | NYSE AMERICAN SVM
1) Management focus on generating free cash flow from long life mines
• Over US$520 M profits distributed from our mines net of spending >$300 million
on capital + sustaining capital expenditures
• US$216 million cash position (no debt, no equity or debt financing since 2010)
2) Organic growth through extensive drilling and consolidation
• Drilled 629,000 m of exploration at the mines during 2020-2021 alone
• Production guidance increases of 17% in silver, 9% in lead, 24% in zinc and 109%
in gold for F2023 compared to F2022
• Constructing a new 3,000 t/d mill and 20 million m3 tailings storage facility
• Advancing the Kuanping project acquired near Ying Mining District
3) Equity investments in potential world class opportunities
• Over $39 million invested in New Pacific since 2017, resulting in world class silver
discovery and value appreciation to $126 million
4) Ongoing merger and acquisition effort to create value
• Evidenced by attempted 2020 Guyana Goldfields acquisition
5) Long-term commitment to responsible mining and ESG
• 17+ years strong community & government relationships
5. 5
MANAGEMENT FOCUS ON GENERATING
FREE CASH FLOW TSX: SVM | NYSE AMERICAN SVM
• MV of Investments in Associates and Equity reflects the respective quarterly balance sheet dates
• Average Analysts’ Mining NAV reflects analysts’ NAV disclosed
• Silvercorp’s fiscal year is April 1-March 31
Steady mine profits financed Capital Expenditures, Equity Investments, Dividends, and Cash
increase
US$
million
Market Capitalization = $470 M
Avg. Analyst Mining Asset NAV = $592 M
Cash = $216 M
Market Value of Equity Investments = $147 M
6. MANAGEMENT FOCUS ON GENERATING
FREE CASH FLOW TSX: SVM | NYSE AMERICAN SVM
Profit (Green Line Below) on every tonne of ore mined
Per
Tonne
Value
(US$)
6
Calendar Year
• Realized silver price is calculated using the Shanghai Metal Exchange price, less smelter deduction and Value Added Tax
Silver
Price
(US$
per
ounce)
7. 7
MANAGEMENT FOCUS ON GENERATING
FREE CASH FLOW TSX: SVM | NYSE AMERICAN SVM
Free cash flow = operating cash flow less capital expenditures, less capital lease
payments
Adjusted net income = adjusted for one-time non-cash items, FX gain(loss),
investment in associates gain(loss), equity investments gain(loss) and share-
based compensation
Calendar Year Calendar Year
8. 8
MANAGEMENT FOCUS ON GENERATING
FREE CASH FLOW TSX: SVM | NYSE AMERICAN SVM
Fiscal Year
** Mid-Point of guidance. Expected 2023 Ying production includes silver equivalent gold production at a 65:1 ratio
9. 9
MANAGEMENT FOCUS ON GENERATING
FREE CASH FLOW TSX: SVM | NYSE AMERICAN SVM
1) Indicated in calendar quarters
2) Net of by-product credits
3) Changed reporting basis to AgEq
4) Only reflects silver segment
• Data Source: Capital IQ, Company filing
(3) (3)
(4)
(3)
Lower Cost Higher Margin Compared to Peers
(1)
46%
10.1%
(2)
$9.25
10. 10
MANAGEMENT FOCUS ON GENERATING
FREE CASH FLOW TSX: SVM | NYSE AMERICAN SVM
• Stock prices as of August 11, 2022; LTM results are most recent reported. Data Source: Capital IQ, Company filing
Providing Value for Investors
11. 11
ORGANIC GROWTH THROUGH EXTENSIVE
DRILLING AND CONSOLIDATION TSX: SVM | NYSE AMERICAN SVM
1) Drill above or
beneath stopes that
were previously
mined but stopped
due to variability in
the vein structures
2) Drill for veins in
the resource area at
shallower elevations
(closer to surface)
where only limited
drilling was done
3) Drill the newly
discovered gold
veins in the resource
area
4) Step-out drilling
from the resource
area for new
discoveries
The strategy of organic growth through extensive drilling
Benefits
1) Increased FY2023 Production Guidance
2) Expected resource and reserve upgrade increase in the coming NI 43-101 MRE
3) Making new discoveries
12. 12
ORGANIC GROWTH THROUGH EXTENSIVE
DRILLING AND CONSOLIDATION TSX: SVM | NYSE AMERICAN SVM
Other Benefits:
1) Slowing down going deeper in mining depths, or even to shallower depths
2) Reducing amount of tunnel development and sustaining capital
Ying: 8,167 drill holes in 1,940 km of drilling and 680 km of tunnelling
GC: 2,563 drill holes in 350 km of drilling and 90 km of tunnelling
Calendar Year
Silvercorp’s extensive drilling & tunnelling for growth
13. 13
ORGANIC GROWTH THROUGH EXTENSIVE
DRILLING AND CONSOLIDATION TSX: SVM | NYSE AMERICAN SVM
Making new discoveries - Finding Gold Deposits in Silver Mines
Drilling at HPG Mine discovered a new “Rhyolitic Breccia Dyke” type of broad Au-Ag zone:
Breccia dyke (extends along a 2 km NW trend, up to 200 m thick and over 1 km depth) is
perpendicular to normally mined NE Ag-Pb-Zn veins; was missed by previous drilling.
Hole ZK1315 intercepted 18.4 m @ 1.42 g/t Au, 122 g/t Ag, 0.97% Pb, 0.56% Zn
Hole ZK1511 intercepted 31.8 m @ 1.14 g/t Au, 52 g/t Ag, 0.3% Pb, and 0.25% Zn.
Cross-cut tunnel PD2-570-15WCM cut 20.7 m @ 1.06 g/t Au, 122 g/t Ag, 1.33% Pb, and 1.48%
Zn
Drilling at HPG Mine discovered high grade Au veins
Hole ZK2542 intercepted 1.64 m true width of vein H16 @ 24.66 g/t Au
Hole ZK2342 intercepted 2.09 m interval of vein H16 @ 8.93 g/t Au
Hole ZK1218 intercepted 1.22 m true width of vein H17 @ 10.54 g/t Au
Hole ZK11206 intercepted 1.10 m true width of vein H41W @ 2.86 g/t Au, 1,469 g/t Ag,
3.69% Pb, 2.33% Zn
Hole ZK11604 intercepted 1.12 m true width of vein H40 @ 7.31 g/t Au, 100 g/t Ag, 1.78% Pb
Hole ZK2537 intercepted 1.58 m interval @ 17.1 g/t Au, 301 g/t Ag, and 18.66% Pb
14. LMW Mine: Low angle Veins of Au or Au-Cu and Wide Ag-Pb-Cu Zone Discovered
Vein LM50:
Hole ZKX0796 intercepted 2.74 m true width @ 11.82 g/t Au
Hole ZKX0423 intercepted 1.62 m true width @ 10.53 g/t Au
Hole ZKX0723 intercepted 4.89m true width @ 5.23 g/t Au
Hole ZKX0527 intercepted 2.22m true width @ 8.51 g/t Au,
Vein LM26:
Hole ZKX0787 intercepted 1.27 m true width @ 5.86 g/t Au
Hole ZKX0153 intercepted 1.23 m true width @ 4.62 g/t Au and 0.75% Cu
Hole ZKX0172 intercepted 1.01 m true width @ 2.81 g/t Au and 4.05% Cu;
Vein LM22:
Hole ZKX0535 intercepted 1.66m true width @ 37.08 g/t Au and 0.53% Cu
Tunnel PD924-LM22-834-5YMSS exposed 20 m long and 0.38 m true thickness @ 26.89 g/t
Au and 12.93% Cu
Tunnel PD924-LM22-834-5YMSD exposed 10 m long and 0.39 m true thickness @ 38.95 g/t
Au and 5.63% Cu
Wide Ag-Pb mineralization defined at LM7 vein
Hole ZKX0575 intercepted 19.67 m true width @ 261 g/t Ag, 1.08% Pb, and 0.78% Cu
Hole ZKX0530 intercepted 23.96 m true width @ 202 g/t Ag, 1.26% Pb, and 0.37% Cu
Hole ZKX0751 intercepted 19.32 m true width @ 162 g/t Ag, 1.38% Pb and 1.00% Cu 14
ORGANIC GROWTH THROUGH EXTENSIVE
DRILLING AND CONSOLIDATION TSX: SVM | NYSE AMERICAN SVM
15. 15
ORGANIC GROWTH THROUGH EXTENSIVE
DRILLING AND CONSOLIDATION TSX: SVM | NYSE AMERICAN SVM
• See Appendix III, IV and V for breakout of Measured, Indicated and Inferred, Which is inclusive of Proven and Probable categories.
• Silver equivalent was calculated by converting Gold at a rate of 65:1, but excluding Lead and Zinc
Extensive Drilling & Tunnelling Grows Silver Reserves & Resources Net of Depletion
(Remaining Mining Life >15 Years)
Historical Production
Silver: 84 Moz.
Lead + Zinc: 1.2 Blbs.
Calendar Year
16. 16
ORGANIC GROWTH THROUGH EXTENSIVE
DRILLING AND CONSOLIDATION TSX: SVM | NYSE AMERICAN SVM
Development System & 3D Models at Ying One of Eight Core Logging Warehouses
Tunnels and Drill Holes Seven Core Storage Facilities
17. 17
TSX: SVM | NYSE AMERICAN SVM
Kuanping (KP)
• 12.39 km2,~33 km north of Ying
• Acquired for US$13.5M
• Previous exploration defined six silver-
lead-zinc vein structures and one gold-
silver vein structure
• 2022 work plan:
• Drill 12,000 m
• Applied for a mining permit
• Future ores could be trucked to Ying
mill for treatment (~25km)
ORGANIC GROWTH THROUGH EXTENSIVE
DRILLING AND CONSOLIDATION
18. 18
EQUITY INVESTMENT & INCUBATING
WORLD CLASS OPPORTUNITIES TSX: SVM | NYSE AMERICAN SVM
1) Invested a total of US$39 million between 2017 and 2020 in New Pacific Metals
(TSX: NUAG, NYSE/AMEX: NEWP): 28.2% interest
2) Provided technical and management support, that quickly advanced the discovery
into a world class silver resource at the Silver Sand Project, Bolivia
Maiden Mineral Resource Estimate (April 2020):
3) NUAG current market cap ~US$465M represents a 3.4X value appreciation
4) Other investments in mining equities have a market value of $15 million as of June
30, 2022
Mineral Resources Tonnes (Mt) Ag (g/t) Ag (Moz)
Measured 8.40 159 43.05
Indicated 26.99 130 122.81
Measured & Indicated 35.39 137 155.86
Inferred 9.84 112 35.55
19. 19
EQUITY INVESTMENT & INCUBATING
WORLD CLASS OPPORTUNITIES TSX: SVM | NYSE AMERICAN SVM
New Pacific Metals Silver Sand Project: Open-Pittable and Heap Leachable
20. 20
ONGOING MERGER & ACQUISITION EFFORT TO
CREATE VALUE TSX: SVM | NYSE AMERICAN SVM
Identifying, acquiring or investing in value-creating projects
• Focus on projects with defined resources and high margins (i.e. high grade) and/or
long mine life potential
• Targeting >$50M annual free cash flow that can be developed with reasonable
capital expenditures and timelines
Guyana Goldfields (GGF) Acquisition Example:
1) GGF was abandoned by the market as the strip ratio increased from 2.2 in 2017 to
15.6 in 2019, Au grade decreased from 2.9 to 1.2 g/t, the share price fell from
$7.60 to $0.30.
2) SVM identified GGF as a value creation opportunity by remodeling the resource into
a higher-grade underground operation
3) SVM offered C$0.60 per share to acquire GGF; third party competing bid emerged
4) SVM increased offer to C$1.30 per share
5) In the end, SVM was out-bid by Zijin Mining at C$1.85 per share
6) SVM realized a total gain of approx. US$20 M despite losing the opportunity
21. 21
CATALYSTS TSX: SVM | NYSE AMERICAN SVM
1) Increased production expected for F2023 per guidance
2) Updated NI 43-101 for the Ying Mining District
3) Apply for a mining permit for the newly-acquired Kuanping gold-silver project and initiate
a 12,000 m drill program
4) Construct a 3,000 tonne per day flotation mill and 20 million m3 tailings storage facility
(TSF) to increase milling capacity to ~5,000 tonne per day
5) Further 300,000+ metres of drilling planned for FY2023 to upgrade resources to
extend mine life, and to make new discoveries
6) Obtain the mining permit for the BYP gold project and bring it back into production at
30,000-40,000 oz gold per year
22. 22
LONG-TERM COMMITMENT TO RESPONSIBLE
MINING & ESG TSX: SVM | NYSE AMERICAN SVM
Safety, Efficiency, Sustainability
• Build a strong corporate culture in safety, social ecological systems and harmonious
environments
• Integrate innovative technology to optimize our operations
• Continuously being largest taxpayer to sustain local social programs
• Generate sustainable economic, social, and environmental value for all stakeholders
23. 23
LONG-TERM COMMITMENT TO RESPONSIBLE
MINING & ESG TSX: SVM | NYSE AMERICAN SVM
GC Mine Site (Birds Eye View)
Solid Waste Reduction Initiatives
Tailings Storage Facility at Ying
Tailings Back Fill Facility at GC Mine
1 M t/y waste rock aggregate plant
at Ying
Construct Green Mines
24. 24
LONG-TERM COMMITMENT TO RESPONSIBLE
MINING & ESG TSX: SVM | NYSE AMERICAN SVM
Waste water treatment system at SGX Mine
Tailings dry stacking at GC Mine
Recycle treated waste water to mills for milling Environment Management Certificates
2022 ESG Best Practice Award
25. F2021 SUSTAINABILITY REPORT
TSX: SVM | NYSE AMERICAN SVM
25
Highlights of Our Responsible Performance & Accomplishments
ENVIRONMENT
• Zero material
incidents
• “National Green
Mines”
• EMS ISO 14001
certification
• Integrated TCFD
recommendations
• Upgraded SGX
wastewater plant
• 1M t/y waste rock
aggregate plant
built at Ying
SOCIAL
• Zero grievances
• USD$1.2M
contributed to
social programs
including clean
water access
• Village road &
tunnel development
• 80% local
procurement
HEALTH & SAFETY
• Zero Covid-19
cases & epidemic
control community
donations
• 157,247 hours
safety training
• 15 emergency &
23 rescue drills at
Ying
• 8 emergency drills
at GC
GOVERNANCE
• Formed
Sustainability
Committee and
ESG Management
Centre
• Disclosure
Standard aligned
with UN SDGs
• Developed Diversity
& Inclusion and
Human Rights
Statements
26. 26
OWNERSHIP & COVERAGE
TSX: SVM | NYSE AMERICAN SVM
Top 10 Institutional Investors % O/S
1 Van Eck Associates 10.52
2 ETF Managers Group 2.94
3 Renaissance Technologies 2.86
4 Global X Management 2.16
5 Connor Clark & Lunn 1.43
6 Two Sigma Investments 1.33
7 BlackRock Fund Advisors 1.21
8 Stabilitas GmbH 1.16
9 DZ Privatbank 1.16
10 Two Sigma Advisors 0.95
Source: BD Corporate & CIQ August 2022 Data
Analyst Coverage
Canada
Ryan Thompson BMO Capital Markets
Felix Shafigullin Eight Capital
Justin Stevens PI Financial
Dalton Baretto Canaccord Genuity
Craig Stanley Raymond James
Gabriel Gonzalez Echelon Capital Markets
US
Joe Reagor Roth Capital
Retail Investors
62%
Insitutions
34%
Insiders 4%
27. 27
LEADERSHIP: A SOLID HISTORY OF VALUE
CREATION TSX: SVM | NYSE AMERICAN SVM
Management
Rui Feng, Ph.D., Geology
Chairman and CEO, Director
Derek Liu, MBA, CGA, CPA
Chief Financial Officer
Yong-Jae Kim, LL.B.
General Counsel and Corporate
Secretary
Lon Shaver, CFA
Vice President
Board of Directors
Rui Feng, Ph.D., Geology
David Kong, CA, CPA, Former Ernst &
Young LLP Partner; over 30 years PubCo.
experience
Yikang Liu, Former Dep. Gen. Sec. of the
China Mining Assoc.; over 40 years
geological experience
Paul Simpson, Securities lawyer; 20 years
experience advising natural resources
companies
Marina Katusa, BSc., MBA, over 10 years
experience in geology and corporate
development
30. 30
HEAD OFFICE
Suite #1750
1066 West Hastings St.
Vancouver, BC, Canada V6E 3X1
Tel: 604-669-9397
Fax: 604-669-9387
Toll-Free: 1-888-224-1881
Investor@silvercorp.ca
www.silvercorp.ca
Watch The Most Recent Interview
TSX: SVM
NYSE AMERICAN: SVM
Silvercorp’s disclosure
documents are available
from the System for
Electronic Document
Analysis and Retrieval
(SEDAR) at www.sedar.com
32. 32
YING MINING DISTRICT, HENAN
TSX: SVM | NYSE AMERICAN SVM
• SGX, TLP, LME, LMW, HPG, HZG
and DCG underground mines have
identified 311 veins
• 2 mills of 3,200 tpd capacity
produce silver-lead and zinc
concentrates
• 6 smelters within 200 km
• Produced 79 Moz of silver & over 1
Blbs of lead & zinc since 2006
• >1.96 M metres of drilling extends
mine life >15 years after 16 years’
production
• 300,000 m drilling planned for
F2023
• Acquired Kuanping Project, 33 km
north
• Construct new 3,000 tpd mill and
TSF
• Ying Mining District Video
¹
¹
¹
² ²
²
¹ 77.5% owned by Silvercorp
² 80% owned by Silvercorp
Ying Mining District: 4 mining permits 68.59km²
33. 33
GC MINE
TSX: SVM | NYSE AMERICAN SVM
Updated MRE NI 43-101 March 2021:
• P&P Reserves up 8% from the last
Resource Estimate Report, despite
2 years mine production depletion
• Measured and indicated resources
up 11% and inferred resource up
17%
• Projected LOM has the potential to
go beyond 2034
GC Underground Mine operates:
• 330,000 tonne ore per year to
produce silver-lead, zinc, and minor
tin concentrates since 2014
• Tailings are de-watered, then back-
filled underground and dry-stacking
34. 34
BYP GOLD MINE
TSX: SVM | NYSE AMERICAN SVM
Preparing for production:
• 2019 NI 43-101 gold resource identified
421,000 oz M&I and 110,000 oz inferred
• Lead-Zinc mine suspended August 2014
• Actively re-applying for a new mining permit
with gold; approval is pending a provincial
wide rezoning of environmental and
ecological areas
• BYP Mining permit is outside of these areas
500 tpd Mill at the BYP Mine
35. 35
REVENUE PERCENTAGE BY METAL
TSX: SVM | NYSE AMERICAN SVM
Calendar Quarters
Silver: 54%
Gold: 3%
Base Metals: 43%
36. 36
REALIZED METAL PRICE EXAMPLES
TSX: SVM | NYSE AMERICAN SVM
Silver
US$ Per Ounce
Lead
US$ Per Pound
Zinc
US$ Per Pound
Shanghai Metal Exchange quoted prices on November 23, 2021: Silver=4.865 RMB/gram, lead=15,000
RMB/tonne, Zinc=23,750 RMB/tonne, all including 13% VAT. Conversion to net realized selling prices as follows:
Silver in US$ =4.865/1.13*31.1035/6.392*90%=$18.97
Lead in US$=(15,000-1,150 smelter deduction)/1.13/2204.62/6.392=$0.87
Zinc in US$=(23,750--4,100 smelter deduction)/1.13/2204.62/6.393=$1.23
* Net of value added tax
37. 37
LEAD & ZINC PRODUCTION
> 1 Billion Pounds of Lead and Zinc Over 15 Years TSX: SVM | NYSE AMERICAN SVM
* Silvercorp’s fiscal year is April 1-March 31
* Future numbers are the mid point of guidance
103*
38. 38
GROWING RESERVES & RESOURCES - LEAD & ZINC
FY2005 – FY20211 (After > 1 Blbs Lead & Zinc Produced) 2 TSX: SVM | NYSE AMERICAN SVM
1. Measured & Indicated Resources inclusive of Reserves. See Appendix III, IV and V for breakout of Measured, Indicated and Inferred, Proven and Probable
categories.
2. Includes production since the last technical reports for Ying and GC, respectively; BYP: approx. lbs produced prior to March 31, 2015
Fiscal Year
39. 39
SUMMARY OF RESERVES1
TSX: SVM | NYSE AMERICAN SVM
Project
Reserve
Category
Tonnes
(Million)
Average Grades Contained Metal Reserves
Silver
(g/t)
Gold
(g/t)
Lead
(%)
Zinc
(%)
Silver
(Moz)
Silver Eq².
(Moz)
Lead
(t)
Zinc
(t)
Ying Mining
District
Proven 5.29 276 0.09 4.33 1.59 46.99 1.04 228,900 84,000
Probable 6.70 241 0.16 3.39 1.26 52.02 2.21 227,500 84,500
GC Mine
Proven 2.59 93 1.50 3.30 7.74 - 38,102 85,729
Probable 1.54 95 1.50 3.00 4.74 - 23,133 46,720
Consolidated
Proven 7.88 - - - - 54.73 1.04 267,002 169,729
Probable 8.24 - - - - 56.76 2.21 250,633 131,220
Total 16.12 - - - - 111.49 3.25 517,635 300,949
1. Technical Report for Ying Mining District effective July 31, 2020; Technical Report for GC Mine effective March 31, 2021; Table includes HPG mine proven reserves of
16,000oz Gold (480,000 tonnes grading 1.05 g/t Gold) and HPG mine probable reserves of 34,000oz Gold (760,000 tonnes grading 1.38 g/t Gold).
2. Gold was converted to Silver equivalent at a rate of 65:1.
40. 40
SUMMARY OF RESOURCES1
TSX: SVM | NYSE AMERICAN SVM
Project
Resource
Category
Tonnes
(Million)
Average Grades
Contained Metal Resources (Inclusive of
Reserves)
Silver
(g/t)
Gold
(g/t)
Lead
(%)
Zinc
(%)
Silver
(Moz)
Silver Eq.²
(Moz)
Lead
(t)
Zinc
(t)
Ying Mining
District
Measured 8.41 264 0.12 4.28 1.53 71.29 2.16 360,200 128,600
Indicated 11.71 212 0.17 3.18 1.10 79.98 4.22 372,100 128,700
Inferred 18.58 184 0.36 3.04 0.82 109.87 13.73 565,300 151,800
GC Mine
Measured 5.29 88 - 1.30 3.10 14.91 - 69,853 163,293
Indicated 4.75 75 - 1.10 2.50 11.46 - 50,349 117,480
Inferred 8.44 87 - 1.00 2.40 23.56 - 88,451 200,488
Consolidated
Measured 13.70 - - - - 81.64 2.16 430,052 291,893
Indicated 16.46 - - - - 94.14 4.22 422,449 246,180
Inferred 27.02 - - - - 131.04 13.73 653,751 352,288
1. Technical Report for Ying Mining District effective July 31, 2020; Technical Report for GC Mine effective March 31, 2021; Table includes HPG mine measured resources of
33,300 oz Gold (880,000 tonnes grading 1.17 g/t Gold), indicated resources of 64,900 oz Gold (1,500,000 tonnes grading 1.35 g/t Gold), inferred resources of 211,200 oz
Gold (3,200,000 tonnes grading 2.05 g/t Gold).
2. Gold was converted to Silver equivalent at a rate of 65:1.
41. 41
SUMMARY OF RESOURCES: BYP MINE
TSX: SVM | NYSE AMERICAN SVM
Domain Categories
Quantity
Au
Grade
Pb
Grade
Zn
Grade
Au
Metal
Pb
Metal
Zn
Metal
Mt g/t % % koz kt kt
Gold area
Measured 2.8 3 - - 269 - -
Indicated 1.5 3.1 - - 152 - -
Measured &
Indicated
4.3 3.1 - - 421 - -
Inferred 1.3 2.5 - - 110 - -
Lead and Zinc
area
Indicated 4 - 0.7 2.3 - 28 89
Inferred 6.1 - 1.4 3.1 - 83 187
Overlap area
Indicated 0.12 0.8 1.2 1.7 3 2 2
Inferred 0.03 1 2.7 3.5 1 1 1
Notes to Resource Tables:
1. All Mineral Resources as of November 30th, 2018
2. Technical Report for BYP Mine dated April 30, 2019 and available under the Company’s profile on SEDAR at www.sedar.com
42. 42
ENDNOTES
TSX: SVM | NYSE AMERICAN SVM
• Qualified Persons
• Guoliang Ma, P. Geo., is a Qualified Person within the meaning of National Instrument 43-101 – Standards Of Disclosure for Mineral Projects (“NI
43-101”) who supervised the preparation of the scientific and technical information of Silvercorp included in this presentation.
• For more information on Silvercorp’s projects, readers should refer to Silvercorp’s Annual Information Form dated June 23, 2020, and Silvercorp’s
technical reports, each of which is available on SEDAR at www.sedar.com.
• The scientific and technical information related to Silvercorp’s projects included in this investor presentation are derived from the technical reports
entitled:
• NI 43-101 Technical Report Update on the Gaocheng Ag-Zn-Pb Project in Guangdong Province, People’s Republic of China” with an effective date of
March 31, 2021 (Mineral Resources and Mineral Reserves effective December 31, 2020), prepared by AMC Mining Consultants (Canada) Ltd.
(“AMC”)
• NI 43-101 Technical Report Update on the Ying Ag-Pb-Zn Property in Henan Province, China effective date 31 July, 2020 by H.A. Smith, P.Eng., A.A.
Ross. P.Geo., P.Geol., S. Robinson, P.Geo., R. Webster, MAIG, R. Chesher, FAusIMM(CP), A. Riles, MAIG
• NI 43-101 Technical Report for Ying Gold-Silver-Lead-Zinc Property, Henan Province, China, effective date 31 December, 2016 by P R Stephenson,
P. Geo., H A Smith, P.Eng., A Ross, P. Geo, H Muller, Beng, MAusIMM, CP.
• NI 43-101 Technical Report on the GC Ag-Zn-Pb Project in Guangdong Province, People’s Republic of China, effective date 30 June 2019 prepared
by D. Nussipakynova, P.Geo., H. Smith, P.Eng., A. Riles, MAIG (QP), P. Stephenson, P.Geo., MAIG.
• NI 43-101 Technical Report for BYP Gold-Lead-Zinc Property, Hunan Province, China, effective date 30 April, 2019, prepared by Tony Cameron,
Principle Mining Engineer, Robert William Dennis, Executive Consultant, and Song Huang, Consulting Geologist.
• Non-IFRS Measures
• This presentation includes certain terms or performance measures commonly used in the mining industry that are not defined under International
Financial Reporting Standards (“IFRS”), including “all-in sustaining costs”. Non-IFRS measures do not have any standardized meaning prescribed
under IFRS, and therefore they may not be comparable to similar measures employed by other companies. The data presented is intended to
provide additional information and should not be considered in isolation or as a substitute for measures of performance prepared in accordance
with IFRS and should be read in conjunction with the Company’s consolidated financial statements. Readers should refer to the Company’s most
recently filed Management Discussion & Analysis, available under the Company’s corporate profile at www.sedar.com and at www.sec.gov for a
more detailed discussion of how the Company calculates such measures and a reconciliation of certain measures to IFRS terms.