Ats morning note nov 10 2015

Losses for stocks of state-run companies and index heavyweights HDFC and L&T outweighed gains for index heavyweights ITC and Reliance Industries resulting in modest losses for key benchmark indices. The barometer index, the S&P BSE Sensex, lost 143.84 points or 0.55% to settle at 26,121.40. The losses for the Sensex were higher in percentage terms than those for the Nifty 50 index. The Nifty shed 39.10 points or 0.49% to settle at 7,915.20. The Sensex and Nifty, both, hit their lowest closing level in almost six weeks. The two key benchmark indices edged lower for the fourth straight trading session. But, the highlight of the trading session was a strong intraday rebound for the two key benchmark indices. After an initial sharp setback triggered by the Bharatiya Janata Party's (BJP) drubbing in Bihar assembly elections, the two key benchmark indices staged a strong intraday rebound later. The Sensex reclaimed the psychological 26,000 level after falling below that mark in intraday trade.

Recommended
More Related Content
More from atsstockbroker
More from atsstockbroker (20)
Recently uploaded
Recently uploaded (20)
Ats morning note nov 10 2015
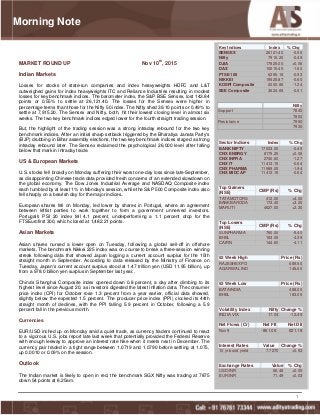
- 1. 1 Key Indices Index % Chg SENSEX 26121.40 -0.55 Nifty 7915.20 -0.49 DJIA 17825.00 +0.06 DAX 10515.45 -1.60 FTSE 100 6295.16 -0.93 NIKKEI 19525.87 -0.60 KOSPI Composite 2000.86 -1.24 SSE Composite 3624.69 -0.61 Nifty Support 7840 7800 Resistance 7990 7930 Sector Indices Index % Chg BANK NIFTY 17003.00 -0.49 CNX ENERGY 8175.25 +0.08 CNX INFRA 2740.60 -1.27 CNX IT 11412.15 -0.64 CNX PHARMA 11989.05 -1.94 CNX MIDCAP 11412.15 -0.64 Top Gainers (NSE) CMP (Rs) % Chg TATAMOTORS 412.00 +4.00 BANKBARODA 172.40 +3.20 MARUTI 4627.00 +2.30 Top Losers (NSE) CMP (Rs) % Chg SUNPHARMA 760.00 -5.40 BHEL 183.05 -4.39 CAIRN 144.60 -4.11 52 Week High Price (Rs) RAJESHEXPO 689.50 AGARWAL IND 146.60 52 Week Low Price (Rs) BATAINDIA 488.00 BHEL 183.05 Volatility Index Nifty Change % INDIA VIX 17.04 -12.49 Net Flows (Cr) Net FII Net DII Nov 9 -861.06 621.18 Interest Rates Value Change % 10 yr bond yield 7.7270 +0.53 Exchange Rates Value % Chg USD/INR 66.48 +0.05 EUR/INR 71.49 +0.03 MARKET ROUND UP Nov 10th , 2015 Indian Markets Losses for stocks of state-run companies and index heavyweights HDFC and L&T outweighed gains for index heavyweights ITC and Reliance Industries resulting in modest losses for key benchmark indices. The barometer index, the S&P BSE Sensex, lost 143.84 points or 0.55% to settle at 26,121.40. The losses for the Sensex were higher in percentage terms than those for the Nifty 50 index. The Nifty shed 39.10 points or 0.49% to settle at 7,915.20. The Sensex and Nifty, both, hit their lowest closing level in almost six weeks. The two key benchmark indices edged lower for the fourth straight trading session. But, the highlight of the trading session was a strong intraday rebound for the two key benchmark indices. After an initial sharp setback triggered by the Bharatiya Janata Party's (BJP) drubbing in Bihar assembly elections, the two key benchmark indices staged a strong intraday rebound later. The Sensex reclaimed the psychological 26,000 level after falling below that mark in intraday trade. US & European Markets U.S. stocks fell broadly on Monday suffering their worst one-day loss since late-September, as disappointing Chinese trade data provided fresh concerns of an extended slowdown on the global economy. The Dow Jones Industrial Average and NASDAQ Composite index each tumbled by at least 1% in Monday's session, while the S&P 500 Composite index also fell sharply on a bearish day for the major indices.. European shares fell on Monday, led lower by shares in Portugal, where an agreement between leftist parties to work together to form a government unnerved investors. Portugal's PSI 20 index fell 4.1 percent, underperforming a 1.1 percent drop for the FTSEurofirst 300, which closed at 1,482.21 points. Asian Markets Asian shares nursed a lower open on Tuesday, following a global sell-off in offshore markets. The benchmark Nikkei 225 index was on course to break a three-session winning streak following data that showed Japan logging a current account surplus for the 15th straight month in September. According to data released by the Ministry of Finance on Tuesday, Japan's current account surplus stood at 1.47 trillion yen (USD 11.95 billion), up from a 978.0 billion yen surplus in September last year.. China's Shanghai Composite index opened down 0.8 percent, a day after climbing to its highest level since August 20, as investors digested the latest inflation data. The consumer price index (CPI) for October rose 1.3 percent from a year earlier, official data showed, slightly below the expected 1.5 percent. The producer price index (PPI) clocked its 44th straight month of declines, with the PPI falling 5.9 percent in October, following a 5.9 percent fall in the previous month. Currencies EUR/USD inched up on Monday amid a quiet trade, as currency traders continued to react to a vigorous U.S. jobs report late last week that potentially provided the Federal Reserve with enough leeway to approve an interest rate hike when it meets next in December. The currency pair traded in a tight range between 1.0719 and 1.0790 before settling at 1.075, up 0.0010 or 0.09% on the session. Outlook The Indian market is likely to open in red, the benchmark SGX Nifty was trading at 7875 down 54 points at 8.25am. Morning Note
- 2. 2 For forthcoming Board Meeting, click on the following link http://www.bseindia.com/corporates/board_meeting.aspx? expandable=0 News Flash Economy News Duty hike effect: Taxes have now exceeded actual cost of production of petrol IMF chief Christine Lagarde warned that global energy prices could remain low for years and urged Gulf countries to adjust their budgets and to adapt to sustained oil price drop. Government Signs Loan Agreement with ADB for $273 Million Loan under Rural Connectivity Investment Program Consumer to cut festive season spend by 43%: ASSOCHAM Survey Government Proposes to Increase India's Share in International Tourist arrival from 0.68 % to 1.00 % by 2016-17 Essel Group to build 2 lakh affordable homes by 2022 Corporate News Cipla's consolidated net profit rose 44.4% to Rs 431.24 crore on 24.6% growth in total income to Rs 3478.33 crore in Q2 September 2015 over Q2 September 2014. Rico Auto Industries consolidated net profit jumped 457.4% to Rs 9.42 crore on 37.1% fall in total income to Rs 249.05 crore in Q2 September 2015 over Q2 September 2014. Rural Electrification Corporation net profit rose 7.64% to Rs 1619.19 crore on 16.94% increase in total income to Rs 5924.73 crore in Q2 September 2015 over Q2 September 2014. Tata Power reported a consolidated net profit of Rs 247.31 crore in Q2 September 2015, compared with net loss of Rs 77.75 crore in Q2 September 2014. Total income rose 11.80% to Rs 9557.76 crore in Q2 September 2015 over Q2 September 2014. Britannia Industries consolidated net profit declined 19.16% to Rs 218.63 crore on 12.33% growth in total income to Rs 2238.81 crore in Q2 September 2015 over Q2 September 2014. ONGC net profit declined 11.1% to Rs 4842.02 crore on 1% increase in net sales to Rs 20563.19 crore in Q2 September 2015 over Q2 September 2014. Reliance Communications consolidated net profit rose 1.9% to Rs 156 crore on 0.9% decline in total income to Rs 5355 crore in Q2 September 2015 over Q2 September 2014. Dr Reddy's Laboratories extending Friday's 14.65% fall triggered by the company receiving a warning letter issued by the US drug regulator relating to its two manufacturing facilities. Nestle India announced that it has begun rollout of Maggi noodles from today, 9 November 2015. Nestle India said it has conducted over 3500 tests representing over 200 million packs in both national as well as international accredited laboratories for testing and all reports are clear. Nestle India announced that the company has received results from all three NABL accredited laboratories mandated by the Bombay High Court to test newly manufactured Maggi noodles samples. All the samples of the Maggi Noodles Masala have been cleared with lead much below permissible limits, the company said in a statement. Vijay Mallya to exit United Spirits, step down from board
- 3. 3 Commodities News U.S. crude futures tumbled below $44 a barrel on Monday, as a steady inventory build at the Cushing Oil Hub intensified concerns related to excess oversupply throughout domestic energy markets. On the New York Mercantile Exchange, WTI crude for December delivery traded in a broad range between $43.66 and $45.10, before settling at $43.88, down 0.41 or 0.93% on the session. The front month contract for U.S. crude futures fell below $44 for only the fourth session in the last 30 days of trading. Since surging more than 3.8% last Tuesday above $48 a barrel, Texas Long Sweet futures have closed in the red four times in the last five sessions. MCX SILVERM November contract was trading at Rs 35108 up Rs 192, or 0.55 percent. The SILVERM rate touched an intraday high of Rs 35172 and an intraday low of Rs 35060. So far 5058 contracts have been traded. SILVERM prices have moved down Rs 7952, or 18.47 percent in the November series so far. GOLD PRICES dropped a $5 per ounce rally to $1095 in London trade Monday, retreating within 1.1% of late-July's half-decade lows against the Dollar as Western stock markets fell to erase the gains made following Friday's much stronger-than-expected US jobs data. Major government bond prices also fell, pushing interest rates higher again, as New York's major indexes dropped almost 1% at the opening to match losses in Eurozone equities. Edging back to unchanged from last Friday's 14-week closing low, gold priced in Dollars is on track to drop for the third calendar year in succession, Commodity Pivot Table for 10/11/2015 Scrip Pivot point R1 R2 R3 S1 S2 S3 ALUMINIUM 30-Nov-15 100.72 101.18 102.02 102.48 99.88 99.42 98.58 ALUMINIUM 31-Dec-15 101.95 102.40 103.20 103.65 101.15 100.70 99.90 CARDAMOM 13-Nov-15 644.77 666.03 695.77 717.03 615.03 593.77 564.03 CARDAMOM 15-Dec-15 757.53 762.07 765.13 769.67 754.47 749.93 746.87 COPPER 30-Nov-15 329.95 331.15 333.10 334.30 328.00 326.80 324.85 CRUDEOIL 19-Nov-15 2949.67 2987.33 3044.67 3082.33 2892.33 2854.67 2797.33 CRUDEOIL 18-Dec-15 3049.67 3083.33 3137.67 3171.33 2995.33 2961.67 2907.33 GOLD 4-Dec-15 25691.33 25757.67 25829.33 25895.67 25619.67 25553.33 25481.67 LEAD 30-Nov-15 110.17 110.63 111.47 111.93 109.33 108.87 108.03 LEAD 31-Dec-15 111.15 111.55 112.20 112.60 110.50 110.10 109.45 NATURALGAS 24-Nov-15 154.23 156.67 161.23 163.67 149.67 147.23 142.67 NATURALGAS 28-Dec-15 166.03 168.77 173.93 176.67 160.87 158.13 152.97 NICKEL 30-Nov-15 640.97 644.43 650.47 653.93 634.93 631.47 625.43 NICKEL 31-Dec-15 647.37 650.63 656.27 659.53 641.73 638.47 632.83 SILVER 4-Dec-15 34739.00 34978.00 35404.00 35643.00 34313.00 34074.00 33648.00 ZINC 30-Nov-15 109.13 109.87 111.18 111.92 107.82 107.08 105.77 ZINC 31-Dec-15 110.33 111.02 112.28 112.97 109.07 108.38 107.12
- 4. 4 Key Corporate Action Symbol Purpose Ex-Date Record Date MAYURUNIQ Interim Dividend - Re 0.80/- Per Share (Purpose Revised) 9-Nov-15 10-Nov-15 ASTRAL Interim Dividend - Re 0.15/- Per Share (Purpose Revised) 9-Nov-15 10-Nov-15 GRANULES Interim Dividend-Re 0.15/- Per Share 9-Nov-15 11-Nov-15 ZYLOG Annual General Meeting 9-Nov-15 - MARICO Interim Dividend Rs 1.75 Per Share (Purposed Revised) 9-Nov-15 10-Nov-15 AARTIIND Interim Dividend - Rs 3/- Per Share (Purpose Revised) 9-Nov-15 11-Nov-15 SOLARINDS Interim Dividend - Rs 9/- Per Share 9-Nov-15 10-Nov-15 GULPOLY Interim Dividend - Rs 1.75 Per Share 10-Nov-15 13-Nov-15 SONATSOFTW Interim Dividend - Re 3.50/- Per Share (Purpose Revised) 10-Nov-15 13-Nov-15 ONGC Interim Dividend - Rs 4.50/- Per Share (Purpose Revised) 10-Nov-15 13-Nov-15 HCL-INSYS Annual General Meeting 10-Nov-15 - ATULAUTO Interim Dividend - Rs 2.75/- Per Share 10-Nov-15 13-Nov-15 AARTIDRUGS Interim Dividend - Rs 2.25/- Per Share (Purpose Revised) 10-Nov-15 14-Nov-15 MRF Interim Dividend - Rs 3/- Per Share 10-Nov-15 13-Nov-15 MANAKSIA Interim Dividend - Rs 2/- Per Share (Purpose Revised) 10-Nov-15 14-Nov-15 TIDEWATER Interim Dividend - Rs 150 Per Share 10-Nov-15 13-Nov-15 LGBBROSLTD Interim Dividend - Rs 2.50/- Per Share (Purpose Revised) 10-Nov-15 13-Nov-15 DCMSHRIRAM Interim Dividend-Rs 1.20/- Per Share 13-Nov-15 16-Nov-15 SUNDRMFAST Interim Dividend - Re 0.85/- Per Share 13-Nov-15 16-Nov-15 L&TINFRA Interest Payment 16-Nov-15 17-Nov-15 MTEDUCARE Interim Dividend 16-Nov-15 17-Nov-15 PAGEIND Interim Dividend 16-Nov-15 17-Nov-15 HEXAWARE Interim Dividend Rs 2.25 Per Share 16-Nov-15 17-Nov-15 GABRIEL Interim Dividend Re 0.45 Per Share 16-Nov-15 17-Nov-15 Options Strategy The synthetic long stock is an options strategy used to simulate the payoff of a long stock position. It is entered by buying at-the-money calls and selling an equal number of at-the- money puts of the same underlying stock and expiration date. This is an unlimited profit, unlimited risk options trading strategy that is taken when the options trader is bullish on the underlying security but seeks a low cost alternative to purchasing the stock outright. Stock – BANKBARODA Buy – 175CE – 4.60 CMP – 171 Sell – 175PE – 7.50 -50000 -40000 -30000 -20000 -10000 0 10000 20000 30000 40000 50000 160 165 170 175 180 185 BANKBARODA @Expiry Net Payoff
- 5. 5 Weekly consolidated call tracker Segment – NSE Cash and F&O Date Stock Trade Entry Stoploss Target1 Target2 Booked Remark 9/Nov/15 HCLTECH BUY 890 881 899 908 Avoided 9/Nov/15 DISHTV BUY 96 95 97 98 98 Target 9/Nov/15 POLARIS BUY 205 203 207 209 207 Target 9/Nov/15 IPCALAB BUY 713 706 720 727 713 Exit at cost 9/Nov/15 NECLIFE BUY 51 50.5 51.5 52 Avoided 9/Nov/15 AMARAJABAT BUY 910 900 919 928 900 SL 9/Nov/15 PFC SELL 225.8 228 223.5 221 228 SL 9/Nov/15 ICICIBANK Nov Fut SELL 262.35 264.9 260 257.5 260 Target 9/Nov/15 CAIRN Nov Fut SELL 145.95 147.6 144.5 143 144.5 Target Segment – MCX Date Commodity Trade Entry Stoploss Target1 Target2 Booked Remark 9/Nov/15 ZINC Nov Fut SELL 109.80 110.8 108.8 107.8 108.55 Target 9/Nov/15 CRUDE Nov Fut SELL 2977 3009 2950 2940 2940 Target 9/Nov/15 SILVER Dec Fut SELL 35020 34920 34820 35120 35120 SL Performance Report Equity + F&O (Rs) Commodity (Rs) Total Profit Made Consolidated 208168.61 178677.50 Total Profit Made this Week 9330.40 6950.00 Disclaimer: This report is only for the information of our customers. Recommendations, opinions or suggestions are given with the understanding that readers acting on this information assume all risks involved. The information provided herein is not to be constructed as an offer to buy or sell securities of any kind. ATS Wealth Managers Pvt Ltd and/or its group companies do not as assume any responsibility or liability resulting from the use of such information