1. The tidal freshwater zone (TFZ)
• Tidally-influenced region of river upstream of estuary
• Increased water residence time may enhance N
cycling in sediments and water column3
Organic matter and grain size comparisons
in sediments of tidally-influenced freshwater rivers
Sierra Melton1, 2, Tricia Light1,3, Amber Hardison1, Jim McClelland1, Xin Xu1, Hengchen Wei1
1University of Texas Marine Science Institute, 2Colorado College, 3Scripps College
Introduction
Sediment characteristics affect bacterial activity and
organic matter (OM) content of sediments, influencing
nitrogen (N) cycling:
Methods
Sampling:
• Collected 2 cores from each site
• Sectioned sediment column
Field Site
Mission and Aransas watersheds, in South Texas
• Different anthropogenic influences
Sampling Sites
• 5 sites in each river’s TFZ
Grain size distribution analysis:
• Washed each slice through set of sieves
• Oven-dried, measured mass of each grain size fraction
Porosity analysis:
• Water mass = Wet mass – Dry mass
• % water is proxy for porosity in submerged sediment
>300 µm
<63 µm63-125 µm
125-300 µm
Results
Conclusions
Mission:
• Finer sediments likely support greater N cycling rates
Aransas:
• More sandy, less variable with depth
• N cycling rates likely slower
• Greater risk of N loading from anthropogenic sources
1. CSIRO Huon Estuary Study Team, 2000, Huon Estuary Study —
environmental research for integrated catchment management and
aquaculture. Final report to Fisheries Research and Development
Corporation. Project number 96/284, June 2000. CSIRO Division of
Marine Research. Marine Laboratories, Hobart.
2. Howarth, R.W. and Marino, R., 2006, Nitrogen as the limiting nutrient
for eutrophication in coastal marine ecosystems: Evolving views over
three decades: Limnology and Oceanography, v. 51(1), p. 364-376.
3. Bianchi, T.S., 2007, Biogeochemistry of Estuaries. Oxford University
Press.
Literature Cited
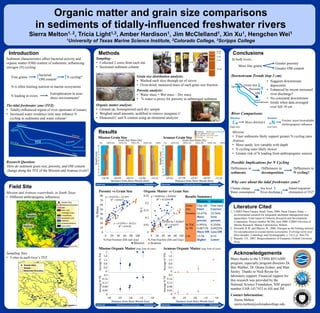
Mission Grain Size Aransas Grain Size
Mission Organic Matter (top 3cm of core) Aransas Organic Matter (top 3cm of core)
Organic matter analysis:
• Ground up, homogenized each dry sample
• Weighed small amounts, acidified to remove inorganic C
• Measured C and N content using an elemental analyzer
OM follows grain size trends OM follows grain size trends
y = 0.6223x + 23.299
R² = 0.8327
y = 0.5295x + 20.211
R² = 0.9192
0
10
20
30
40
50
60
70
80
0 20 40 60 80 100
%Water
% Fine Fraction (Silt and clay)
y = 0.0016x + 0.0454
R² = 0.3344
y = 0.0015x + 0.0067
R² = 0.9377
0
0.05
0.1
0.15
0.2
0.25
0 20 40 60 80 100
%C
% Fine Fraction (Silt and Clay)
Porosity vs Grain Size Organic Matter vs Grain Size
Results Summary
• Suggests downstream
depocenter
• Enhanced by recent increased
river discharge?
• No consistent downstream
trends when data averaged
over full 10 cm
Differences in
sediments
Differences in
decomposition
Differences in
N cycling?
Acknowledgements
Many thanks to the UTMSI REUisME
program, especially program directors Dr.
Ben Walther, Dr. Deana Erdner, and Matt
Seeley. Thanks to Nick Reyna for
laboratory support. Financial support for
this research was provided by the
National Science Foundation, NSF project
number EAR-1417433 to AH and JM.
Contact Information:
Sierra Melton
sierra.melton@coloradocollege.edu
Climate change
Water consumption
Sea level
River discharge
Inland migration/
elimination of TFZ?
Fine grains
bacterial,
OM content1 N cycling?
N is often limiting nutrient in marine ecosystems
N loading in rivers
Eutrophication in near-
shore environments2
Research Question:
How do sediment grain size, porosity, and OM content
change along the TFZ of the Mission and Aransas rivers?
Downstream Trends (top 3 cm)
Why care about the tidal freshwater zone?
River Comparisons
Possible Implications for N Cycling
Mission Aransas
Grain
size
Clay, silt
Finer
Fine sand
Coarser
%water 41.67%
More
porous
32.36%
Less
porous
% TOC
% TN
0.995%
0.0871%
More OM
0.350%
0.0423%
Less OM
C:N 13.38
Higher
8.19
Lower
-30 -25 -20 -15 -10
Distance from River Mouth (km)
-30 -25 -20 -15 -10
Distance from River Mouth (km)
More fine grains
Greater porosity
Greater OM content
In both rivers…