Downloaded 37 times


![28 29
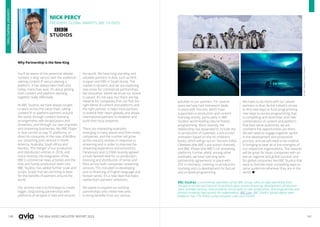
THE ASIA VIDEO INDUSTRY REPORT 2023
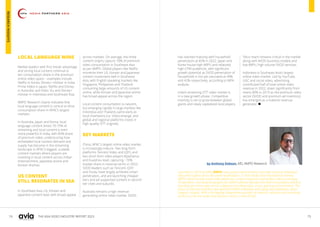
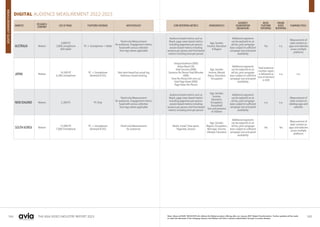
Certain types of “service provider[s]” –
which now covers intermediary service,
caching service, hosting service and
information location tools service – are
presumed to be exempt from liability if 2
conditions are satisfied:
a. An explicit announcement and actual
compliance of service-terminating
measures have been made; and
b. Compliance with the statutory
conditions provided for each type of
service provider.
For hosting service and information
location tools services, the amended
Copyright Act introduces a new notice and
take down procedure allowing copyright
owners to issue a copyright infringement
notice to such service providers and
counter-claims against such notice.
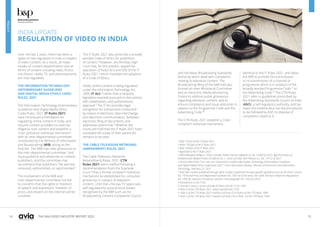
6.
CHINA
China’s Third Amendment of Copyright
Law ("Third Amendment"), effective
since 1 June 2021, is a major reform in
response to the increasing number of
copyright infringement lawsuits in China,
including cases of digital piracy.
Some key highlights below:
• In response to previous criticisms
relating to the assessment of damages,
new legislation has increased the
amount of statutory damages payable
within the range of CNY 500 (USD 77)
to CNY 5 million (around USD 770,000)
and introduced punitive damages
consistent with its trade marks and
patent laws. Where appropriate,
punitive damages of up to 5 times the
determined damages may be awarded.
• Copyright authorities can also impose
fines on infringers proportionate to
the illegal business turnover; conduct
investigations; and seize suspected
infringing articles.
7.
HONG KONG
The Hong Kong Copyright (Amendment)
Bill 2022 has been gazetted. If
enacted, it will introduce an exclusive
technology-neutral communication
right for copyright owners and criminal
sanctions against infringement relating to
the new communication right.It also will
introduce two additional statutory factors
for the court to consider when assessing
whether to award additional damages to
copyright owners in civil cases involving
copyright infringements that will to help
deter infringement.
The Bill also introduces “safe harbour”
provisions for online service providers
to protect their activities and incentivise
them to cooperate with copyright owners
in combatting online piracy.
by Andy Leck
Head of the Intellectual Property and
Technology Practice Group in Singapore, Baker McKenzie
We at Baker McKenzie appreciate the challenges of staying innovative and profitable in an
increasingly regulated global landscape. Working across borders, our Media and Entertainment
practice brings together intellectual property and technology specialists to advise on a wide
range of complex cross-border matters to help clients keep the show on the road. We advise on
all aspects of intellectual property in the media and entertainment space, including development
agreements, brand strategy, designs and complex copyright questions associated with moral
rights, content production, distribution and transactions.
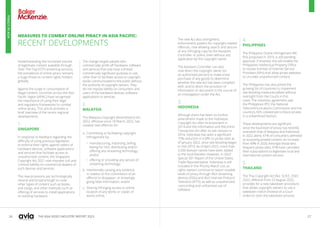
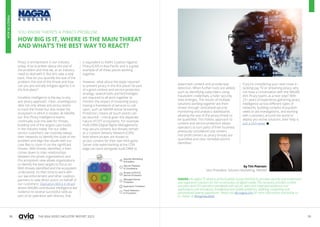
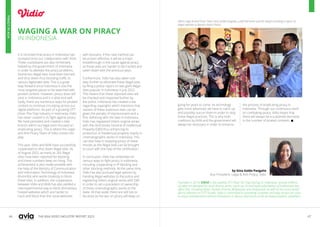
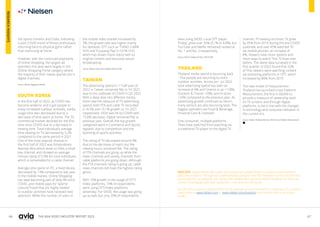
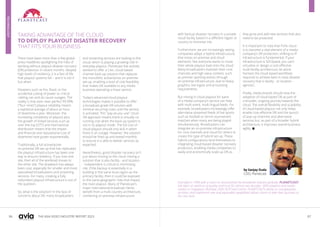
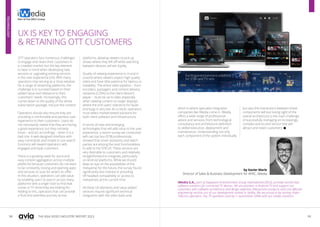
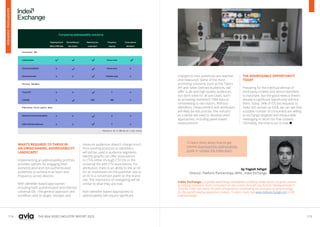
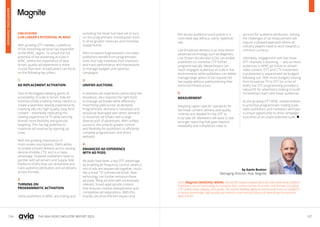
COMMENTARY
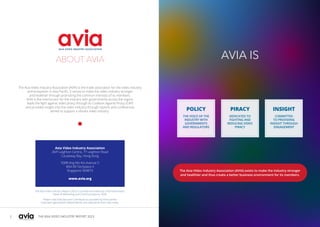
The rapid development of copyright laws
across the region recognises the need for
better and smarter regulations to guard
against the misappropriation of content
by bad actors.
While the industry cannot solely depend
on existing laws and regulations to catch
up with rapidly evolving technology,
the increased amount of effective
site-blocking in a number of countries
and updated copyright laws across the
region show a greater awareness of these
issues among governments. For example,
YouGov surveys in Malaysia show that
consumers move away from piracy when
faced with site-blocking pages. Indonesia
too, has seen a downward trajectory of
streaming piracy since the introduction of
its site-blocking regime.
Nonetheless, as technology continues
to march forward and more content
continues to be pirated before it is even
released, an effective strategy to reduce
theft and combat piracy in APAC can
only be achieved through consistent
enforcement, disruption and consumer
education and outreach.
PIRACY
IN
ASIA](https://image.slidesharecdn.com/asia-video-industry-report-2023-230102044026-b645e604/85/Asia-Video-Industry-Report-2023-pdf-15-320.jpg)


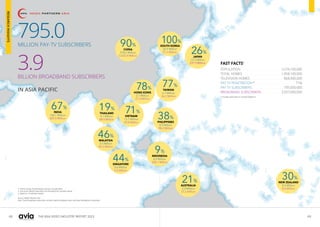
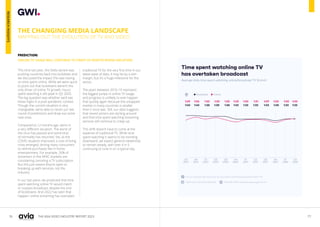


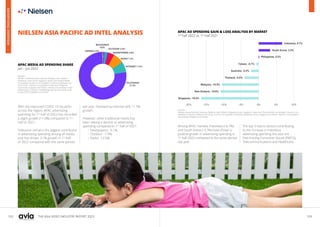


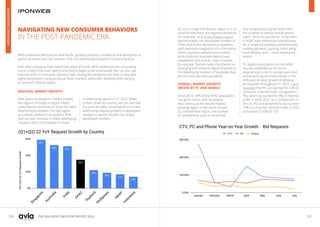


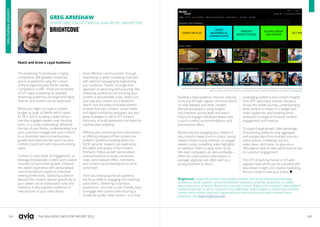


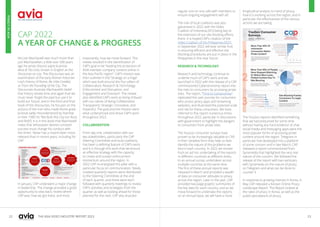
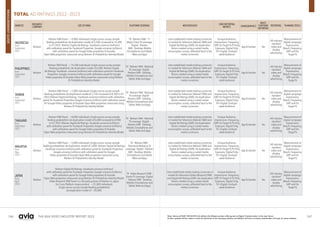
![160 161
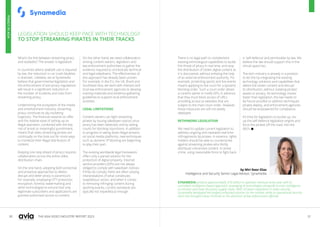
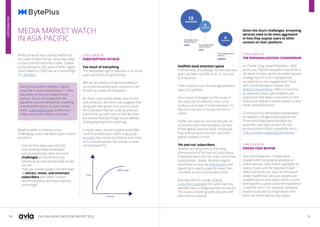
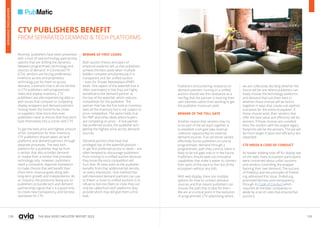
THE ASIA VIDEO INDUSTRY REPORT 2023
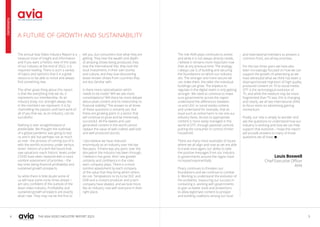
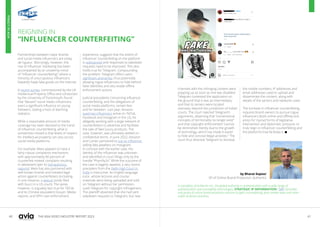
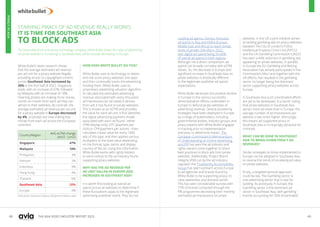
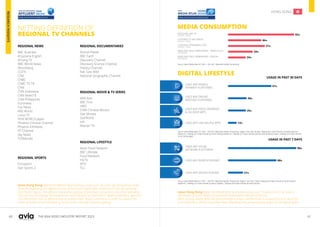
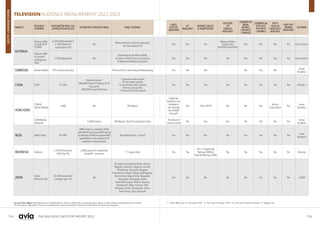
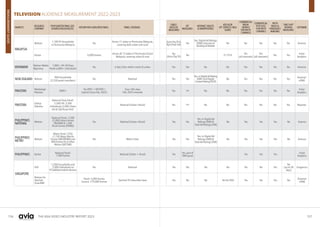
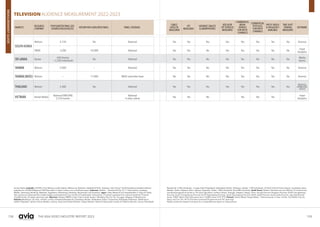
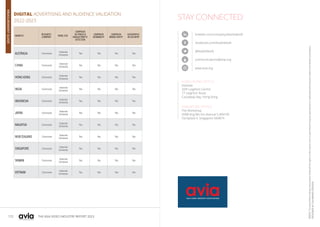
SYNDICATED MEDIA SURVEYS 2022-2023
MARKETS
RESEARCH
COMPANY
SURVEY SAMPLE SIZE PANEL COVERAGE METHODOLOGY DEMOGRAPHICS
CAB/SAT
MEASURED
DTT SOFTWARE
REACH &
FREQUENCY
HONG KONG Nielsen Media Index 6,000+ All area Face-to-Face/Online 12 - 64 Yes Yes Clear Decisions Yes
AUSTRALIA Nielsen Consumer & Media View 30,000 National Online 14+ Yes Yes Clear Decisions No
NEW ZEALAND Nielsen
Consumer & Media
Insights
10,000 National
Recruited: CATI/Online
All survey completed Online
15+ Fused withTAM data Fused withTAM data Clear Decisions Yes
INDONESIA11 cities Nielsen Consumer & Media View 17,000 Indonesia,11 cities
Face-to-face/Phone interview
(during COVID-19)/Online Survey
10+ Yes Yes Clear Decisions Yes
MALAYSIAPeninsular only Nielsen Consumer & Media View 10,000 Peninsular Malaysia Only
Face-to-face or
CATI (Rural)/Online (Urban)
15+ Fused withTAM data Fused withTAM data Clear Decisions Yes
MALAYSIAEast Malaysia Nielsen Consumer & Media View 2,000
East Malaysia [Kota Kinabalu
(Sabah) & Kuching (Sarawak)]
Face-to-face 15+ Yes Yes Clear Decisions Yes
MYANMAR Nielsen Media
Myanmar
Consumer & Media View 5,300+ National CAPI/ CATI 10 - 64 Yes Yes Clear Decisions No
PHILIPPINES National Urban Nielsen Consumer & Media View 10,000 National Urban CATI-CAWI/Face-to-Face CAPI 10+ Yes Yes Clear Decisions Yes
SINGAPORE Nielsen Consumer & Media View 4,200+ National Face-to-face/Online/ CATI 15+ Yes Yes Clear Decisions
Yes
(Print only)
THAILAND Nielsen Consumer & Media View 9,000+ National Face-to-Face/Online 12+ Yes Yes Clear Decisions No
TAIWAN Nielsen Media Index 10,000 National Face-to-Face/Online 12 - 65 Yes Yes Clear Decisions Yes
BANGLADESH Kantar
National Media Survey
(NMS) -TGI
16,200 National Face-to-Face 15+ Yes No ThinkMedia Yes
SRI LANKA Kantar
National Demographic
& Media Survey
(NDMS) -TGI
12,500 National Face-to-Face/CAPI 6+ Yes No QuestPlus No
VIETNAM Kantar Media
Media Habit Survey
(MHS) -TGI
6 Cities (Urban)
9,352 & National
(exc 6 cities)
7,200
6 cities & National Face-to-Face/Self completed 15 - 54 Choices 4 Yes
CHINA Sinomonitor CMMS/H3/MMMS
CMMS - 120,000+
H3 - 12,400+
MMMS - 30,000+
CMMS - National,108 cities (tier 1-5)
H3 - National,20 cities (tier 1-3)
MMMS - National,46 cities (tier 1-3)
Face-to-Face/Self
completed/Online
CMMS - 15-64
H3 - 18-50
MMMS - 15-64
Yes No
Telmar
DataTile
No
INDIA IMRB India 51,000 National Face-to-Face/Self completed 15 - 55 ABC
MEASUREMENT
GUIDE](https://image.slidesharecdn.com/asia-video-industry-report-2023-230102044026-b645e604/85/Asia-Video-Industry-Report-2023-pdf-81-320.jpg)


The Asia Video Industry Report 2023 highlights the role of the Asia Video Industry Association (AVIA) in strengthening the video industry ecosystem by addressing piracy and regulatory challenges in the region. It emphasizes the importance of collaboration among industry members to navigate evolving market dynamics, including the impacts of COVID-19 and changing consumer preferences. The report also discusses ongoing regulatory developments in various Asian countries, advocating for self-regulation and a balanced approach to content oversight to foster growth and innovation.


![[Research];[Digital marketing market]_2](https://cdn.slidesharecdn.com/ss_thumbnails/adma-digital-marketing-yearbook-2009-090823041957-phpapp02-100517235501-phpapp02-thumbnail.jpg?width=640&height=640&fit=bounds)


![[rokonz.com] Glossary of Semantic SEO Part-3.pdf](https://cdn.slidesharecdn.com/ss_thumbnails/rokonz-260123200835-55123e1e-thumbnail.jpg?width=640&height=640&fit=bounds)


![[rokonz.com] Glossary of Semantic SEO Part-2.pdf](https://cdn.slidesharecdn.com/ss_thumbnails/rokonz-260123200719-92199ba8-thumbnail.jpg?width=640&height=640&fit=bounds)


![[rokonz.com] Glossary of Semantic SEO Part-1.pdf](https://cdn.slidesharecdn.com/ss_thumbnails/rokonz-260123200456-440e4060-thumbnail.jpg?width=640&height=640&fit=bounds)


