Downloaded 232 times
![EXECUTIVE SUMMARY
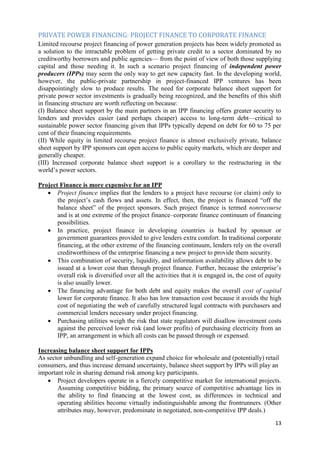
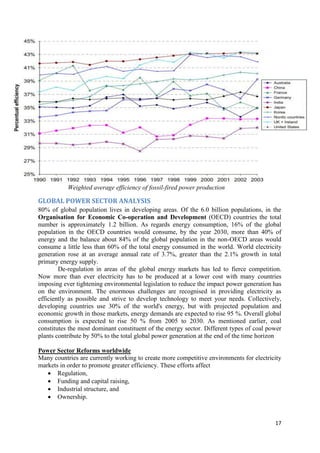
OBJECTIVES
To provide the optimum integrated financial model of Capital Budget & Capital
Structure for the additional power capacity required as per the 12th Five Year Plan and
Other Studies for the NTPC considering the public undertaking nature and various
regulatory provisions related to pricing, contracting of raw material, operations,
administration etc. by various regulatory authorities like CERC, Power Ministry and
Environment Ministry
To analyse the Power generation policies of developing and the developed countries,
particularly focusing on the India and China and recommending the changes for
Indian Power Sector to enhance the Capacity in most efficient manner.
METHODOLOGY
Methodology will include the intensive and extensive research, study and analysis to come to
the required solutions and suggestions incorporating the Power Industry norms. It will have
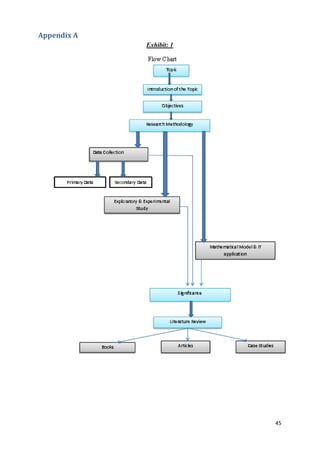
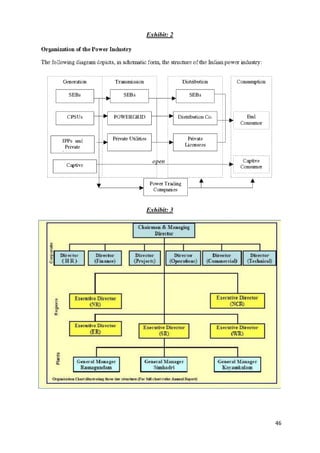
two sections: [see Exhibit 1]
DATA COLLECTION
Primary data
Data gathered from the NTPC staff, discussion and internal survey.
Secondary data
Data gathered using the external sources like study reports by various agencies like Asian
Development Bank, World Bank, UNO and other consultancy organisations who worked in
the same area like KPMG etc.
EXPLORATORY AND MATHEMATICAL STUDY
In Exploratory and Mathematical study various financial tools were used giving the inputs
from values available in primary data & secondary data section. Using these exploratory
results, future policies for Power Capacity addition and Operational, Fund Raising &
Technical Efficiencies will be recommended.
IT APPLICATION
Finally, using available software tools like MS Excel various charts and table drawn for the
visual representation of the study and analysis.
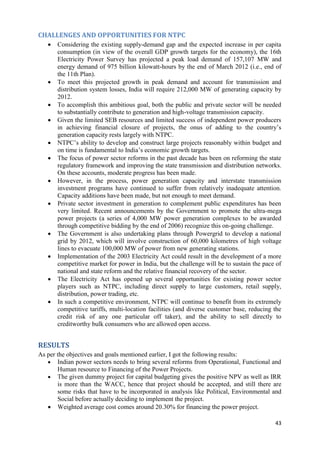
RESULTS
Indian Power sector greatly need to improve on various fronts to meet the 12th Five Year
target of the power capacity addition in terms of Operational, Functional, Funding, Cost
Reduction, Environment Challenges, Human Resource, Administration, Regulations, Tariffs,
and Distribution. Along it, India need to look for the alternative energy and sources also
considering the cost involving in Oil and Coal import and their limited availability with
focusing on the environmental effects and the large power requirement for sustaining the
economic and social growth.
5](https://image.slidesharecdn.com/arvindsinghmahor-10bm60017-summerprojectreport-110731131256-phpapp01/85/Arvind-singh-mahor-summer-project-report-5-320.jpg)
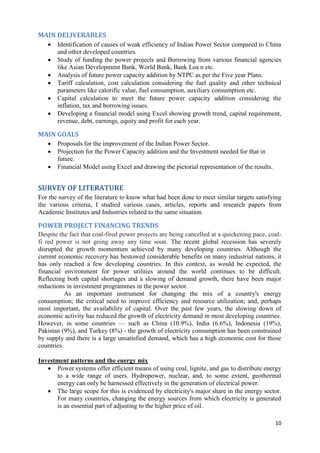
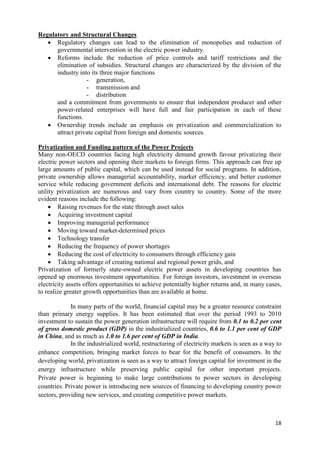
![COMPANY BACKGROUND
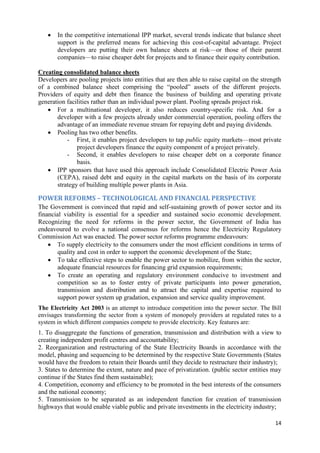
POWER INFRASTRUCTURE IN INDIA
India is the fifth largest producer of electricity in the world and according to the Planning
Commission, while the State Governments account for 51.5% of the total generation capacity,
the central sector and the private sector account for 33.1% and 15.4% of the generation
capacity respectively. The Power industry in India derives its funds and financing from the
government, some private players that have entered the market recently, World Bank, public
issues and other global funds. India‘s total installed capacity of 173,626.40 MW as on March
31, 2011, the installed capacity of central power sector utilities, state sector entities and
private sector companies accounted for approximately 31.3%, 47.5% and 21.2%,
respectively. The following table sets forth a summary of India's energy generation capacity
as of March 31, 2011 in terms of fuel source and ownership:
See the organisation of Indian Power Sector Organisation [see Exhibit 2]
Sector Thermal Nuclear Hydro Renewable energy Total
sources
Central 40,747.23 4,780.00 8,885.40 - 54,412.63
State 52186.73 - 27,257.00 3,008.85 82,452.58
Private 19890.52 - 1,425.00 15,445.67 36,761.19
Total 1,12,824.48 4,780.00 37,567.40 18,454.52 1,73,626.40
NTPC PROFILE
NTPC Limited (formerly known as National Thermal Power Generation Limited), India's
largest power company, was set up in 1975 with a vision “A world class integrated power
major, powering India‟s growth, with increasing global presence" to accelerate power
development in India. It has emerged as an „Integrated Power Major‟, with a significant
presence in the entire value chain of power generation business. NTPC is a Government-
owned entity with 89.5% of its paid-up capital contributed by the Government and the
balance of 10.5% being held with foreign institutional investors, financial institutions, banks,
and the general public. NTPC is primarily involved in constructing and operating power
stations. It is among the world‘s largest and most efficient power generation companies.
NTPC has installed capacity of 29,394 MW. It has
15 coal based power stations (23,395 MW),
7 gas based power stations (3,955 MW) and
4 power stations in Joint Ventures (1,794 MW).
The company has power generating facilities in all major regions of the country. It
plans to be a 75,000 MW company by 2017. NTPC is pursuing expansion of its business
activities into hydroelectric generation, coal mining, gas exploration, and participation in the
liquefied natural gas value chain, which supplements and supports its core power generation
activities.
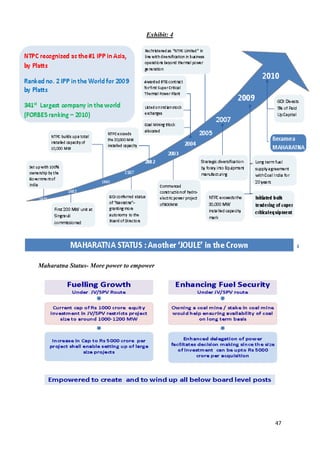
NTPC Organisational Structure [see Exhibit 3]
Vision- A world class integrated power major, powering India's growth with increasing
global presence.
Mission- Develop and provide reliable power related products and services at competitive
prices, integrating multiple energy resources with innovative & Eco-friendly technologies and
contribution to the society
6](https://image.slidesharecdn.com/arvindsinghmahor-10bm60017-summerprojectreport-110731131256-phpapp01/85/Arvind-singh-mahor-summer-project-report-6-320.jpg)
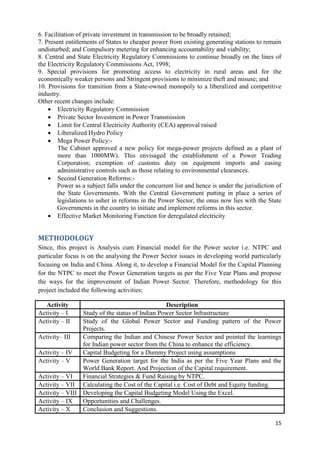
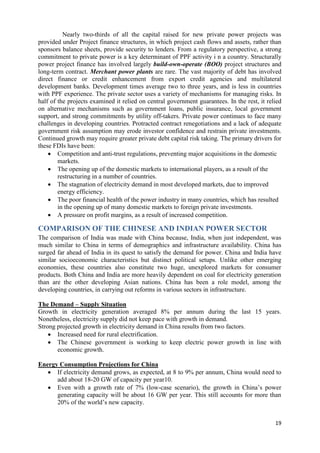
![Core Values - BCOMIT
Business ethics
Customer Focus
Organizational & Professional Pride
Mutual Respect & Trust
Innovation & Speed
Total Quality for Excellence
Corporate Mission
―Develop and provide reliable power, related products and services at competitive prices,
integrating multiple energy sources with innovative and eco-friendly technologies and
contribute to society‖.
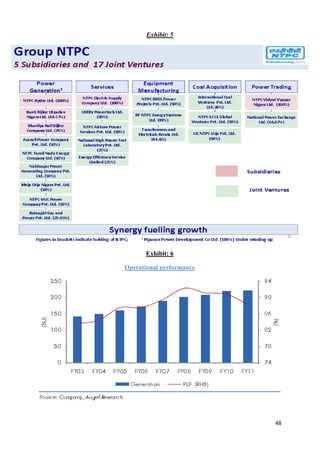
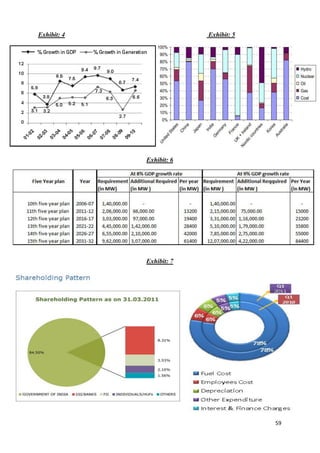
For the growth so far [see Exhibit: 4].
PRODUCTS AND SERVICES
Power generation- The Company has formulated a long term Corporate Plan for 15 years up
to 2017. The Corporate Plan seeks to integrate the Company's vision, mission and strategies
for growth with the national plans and to provide the company the cutting edge in the
emerging competitive environment. NTPC is targeting to become a 75,000 MW plus
Company by 2017.
Consultancy-The Consultancy Wing of NTPC, with an ISO 9001:2000 accreditation,
undertakes all the Consultancy and turnkey project contracts for Domestic and International
clients in the different phases of Power plants. NTPC is registered as a consultant with several
leading international development and financial institutions such as The World Bank, The
Asian Development Bank, The African Development Bank and UNDP.
Power Management Institute- NTPC has full-fledged facilities at the Power Management
Institute, NOIDA for providing training in all aspects of power Plant Management and
Systems. It also has Full Scope Replica Training Simulators both for Coal as well as Gas
based Stations for training personnel in Operation and Maintenance of power plants.
SUBSIDIARIES AND JOINT VENTURES
Business development through Acquisition and Joint Ventures serves both NTPC's own
commercial interest as well as the interest of the Indian economy taking over being a part of
the acquisition process, is also an opportunity for NTPC to add to its power generation
capacity through minimal investment and very low gestation period. Group NTPC has 5
Subsidiaries and 17 Joint Ventures [see Exhibit: 5] in the following area:
Power Generation
Services
Equipment Manufacturing
Coal Acquisition
Power Trading
7](https://image.slidesharecdn.com/arvindsinghmahor-10bm60017-summerprojectreport-110731131256-phpapp01/85/Arvind-singh-mahor-summer-project-report-7-320.jpg)
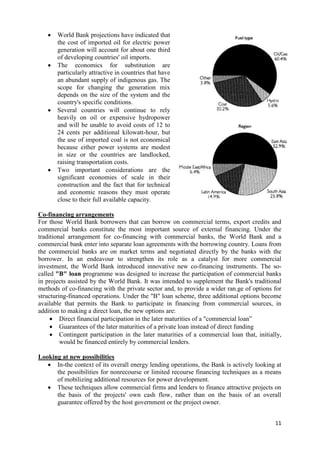
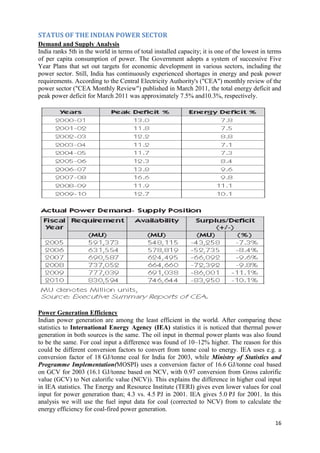
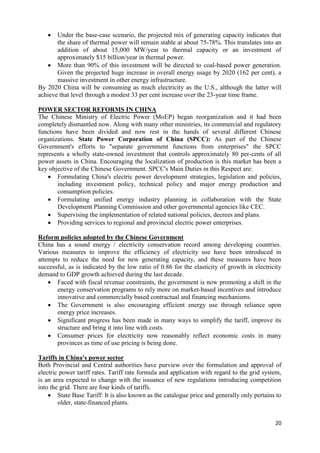
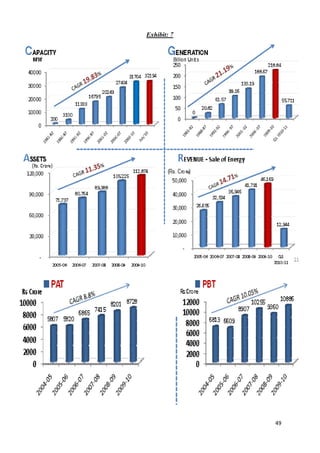
![PERFORMANCE HIGHLIGHTS
Coal based Stations performed at the highest ever Plan Load Factor (PLF) of 89.43 per cent
compared to 87.67 per cent last year. [see exhibit 6]. Seven coal based stations (Dadri,
Unchahar, Vindhyachal, Simhadri, Rihand, Tanda and Talcher-Kaniha) have achieved more
than 90 per cent PLF. Generated 188.74 Billion Units (BU) - an increase of 10.41 per cent
over the previous year. Contributed 28.50 per cent of the total electricity generated in the
country during 2006-07 with 20.18 per cent share of the total installed capacity of the nation.
PAF of both the coal and gas-based stations remained at healthy levels, which enabled the
company to earn efficiency incentives. The company‘s Plant Availability Factor (PAF) for
FY2011 as a whole stood at 91.67%, up 46bp Y-O-Y. During 4QFY2011, PAF of coal-based
plants stood at 96.4%, while PAF of gas-based plants stood at 96.87%. [Exhibit: 6]
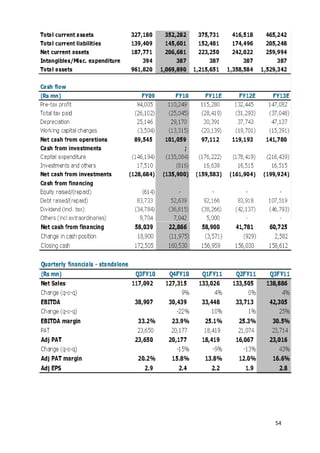
FINANCIAL RESULTS
NTPC Ltd has declared its provisional unaudited revenues and profit for quarter and year-
ended March 31, 2011. The audited results are expected by May 20, 2011 post which we will
release a detailed results analysis. The provisional numbers indicate that the performance is
likely to be in line with CRISIL Equities‘ estimates. CRISIL continue to believe that NTPC is
better placed due to strong growth prospects, higher fuel security and a stable return model.
NTPC maintains fundamental grade of 5/5, indicating that the fundamentals of the company
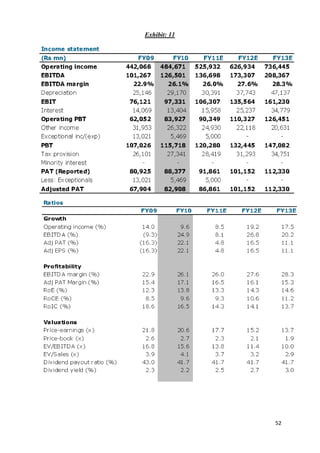
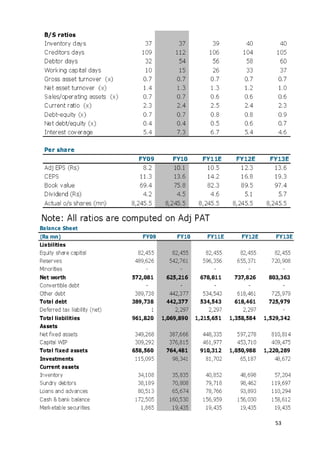
are excellent relative to other listed securities in India. [Exhibit: 7] & [Exhibit: 8]
100% realization of the billing for the eighth consecutive year.
Provisional and un-audited Net Sales of Rs. 53,721 crore during 2010-11 as against
Rs. 46,169 crore (audited) during 2009-10, registering an increase of 16.36%. The
provisional and un-audited Gross Revenue is Rs.56,331 crore during 2010-11 as
against Rs.49,247 crore (audited) for the year 2009-10, an increase of 14.38%.
Provisional and un-audited Profit after tax for the year 2010-11 is Rs.8,826.16 crore s
compared to Rs.8,728.2 crore (audited) during the year 2009-10, an increase of
1.12%.
Capital Expenditure of Rs.12,817.61 crore during 2010-11, an increase of 22.46%
over the last year‘s figure of Rs.10,467.13 crore. NTPC Group‘s capital expenditure
was Rs. 16,326.58 crore as against Rs.14,334.54 crore over the last year, an increase
of 14%
Contributed Rs.6,243.99 crore to exchequer on account of Corporate tax, Dividend
and tax thereon and wealth tax, an increase of 92% over the previous year.
Approved outlay for 2011-12 for NTPC‘s capital schemes is Rs.26,400 crore; for
NTPC Group, the outlay is Rs.30,843.72 crore.
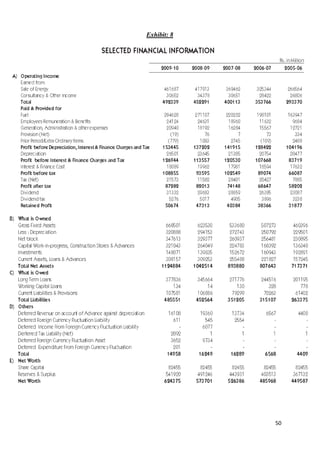
For Financial Results [Exhibit: 11]
8](https://image.slidesharecdn.com/arvindsinghmahor-10bm60017-summerprojectreport-110731131256-phpapp01/85/Arvind-singh-mahor-summer-project-report-8-320.jpg)
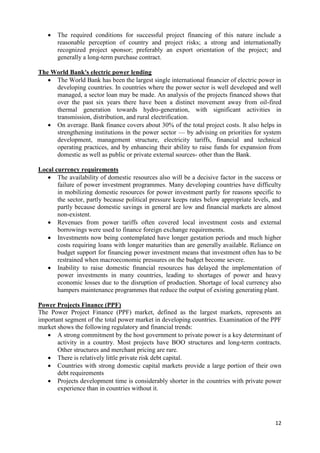
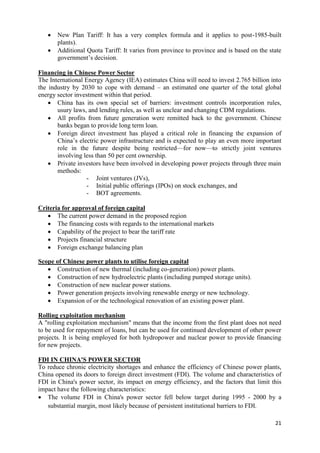
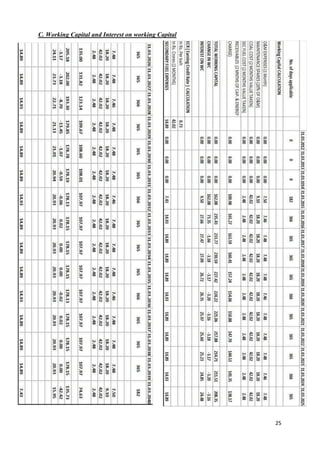
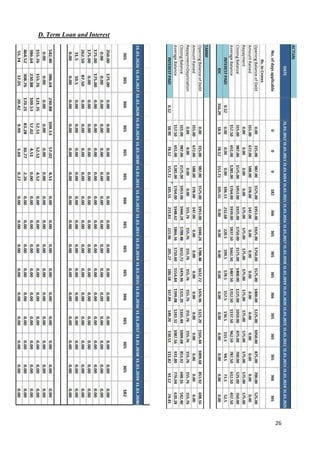
![FINANCIAL STRATEGIES AND FUND RAISING BY NTPC
Fund Mobilisation
Leveraging strong ratios to raise debt at optimal rates:
A. Capital Structure
New projects to be financed with Debt equity ratio of 70:30.
Internal accruals sufficient to finance equity portion of the scheduled investment in
NTPC
Deployment of equity in Subsidiaries/JVs selectively – preferably with control
retention.
B. Debt Funding
NTPC has the ―Most Favoured Borrower‖ status due to:
- Low gearing and healthy coverage ratios
- Debt servicing ability to remain strong due to certainty of revenue based on the
cost plus regime.
Long term debt (term loans/bonds) preferred to match project cash flows-to be
realised from domestic/international markets.
Projects executed by subsidiaries and JVs to be financed under projects finance route.
C. 2010-2011
Total outlay Rs. 22350 crore, Rs. 12818 crore required as debt.
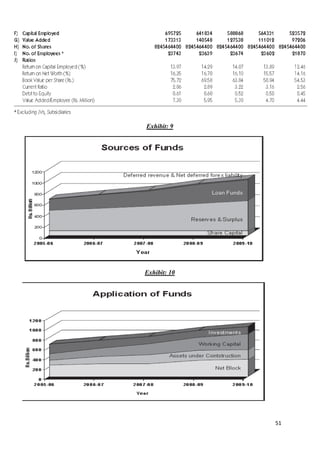
For Sources of fund [Exhibit: 9] and Application of fund [Exhibit: 10]
32](https://image.slidesharecdn.com/arvindsinghmahor-10bm60017-summerprojectreport-110731131256-phpapp01/85/Arvind-singh-mahor-summer-project-report-32-320.jpg)
![Appendix B
CASE LET - NTPC: CURRENT STATUS, FUTURE DEMANDS AND INVESTMENT NEEDED
On May 5th, 2011, a hot day, as it usually it happens in Delhi or other North Indian
Places during summer season, Power Management Institute (PMI), management training
wing of National Thermal Power Corporation (NTPC) at Noida (Uttar Pradesh, India) had
got new interns for their MBA training at NPTC from IIT Kharagpur were coming to have
their first glimpse of NTPC and future corporate life. All people were informed to report to
Prof. Dash, a senior and very renowned faculty at PMI Noida.
After sometime, Prof. Dash called everybody and gave short introduction of self,
the PMI (NPTC) and the various projects in Indian Power Sector being carried out. Later, he
asked everybody to give their details about profile and background knowledge before asking
about the choice of projects. Arvind Mahor, an intern among them, told of his profile as
finance and expressed his desire to work in Capital Budgeting and Capital Structuring at
Power Projects. Prof. Dash asked him some questions in the area of Corporate Finance and
discussed with him about the demand and supply of power scenario in India and focused on
the 12th Five Year Plan and its target by 2017 in energy sector. He told him to carry out with
the project in “Capital Budgeting, Capital Planning and Comparative study of Power Sector
focusing on China and India and proposing the ways for the improvements”.
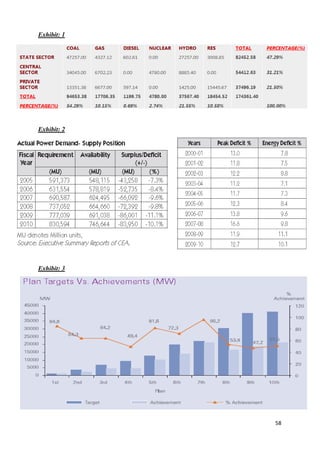
INDIAN POWER SECTOR STATUS
The power sector in India is mainly governed by the Ministry of Power. As far as generation
is concerned it is mainly divided into three sectors these are Central Sector, State Sector, and
Private Sector. Due to India‘s economic rise, the demand for energy has grown at an average
of 3.6% per annum over the past 30 years. At the end of April 2011, the installed power
generation capacity of India stood at 174361.40MW. The total thermal capacity, including
gas stations and diesel generation accounts for about 64.27% of installed capacity of the
country followed by hydro capacity at 23.13%. Nuclear stations account for 2.86% and the
balance 9.74% is contributed by Renewable Energy Sources [Exhibit: 1]. Still, Power Sector
Units (PSUs) are the measure players, NTPC is one of them.
PROFILE OF NTPC
NTPC Limited (formerly known as National Thermal Power Generation Limited), India's
largest power company, was set up in 1975. It has emerged as an „Integrated Power Major‟,
with a significant presence in the entire value chain of power generation business. NTPC is a
Government-owned entity with 89.5% of its paid-up capital contributed by the Government
and the balance of 10.5% being held with foreign institutional investors, financial institutions,
banks, and the general public. It plans to be a 75,000 MW company by 2017. NTPC is
primarily involved in constructing and operating power stations. It is among the world‘s
largest and most efficient power generation companies. NTPC has installed capacity of
29,394 MW. It has
15 coal based power stations (23,395 MW),
7 gas based power stations (3,955 MW) and
4 power stations in Joint Ventures (1,794 MW).
55](https://image.slidesharecdn.com/arvindsinghmahor-10bm60017-summerprojectreport-110731131256-phpapp01/85/Arvind-singh-mahor-summer-project-report-55-320.jpg)
![NTPC is pursuing expansion of its business activities into hydroelectric generation, coal
mining, gas exploration, and participation in the liquefied natural gas value chain, which
supplements and supports its core power generation activities.
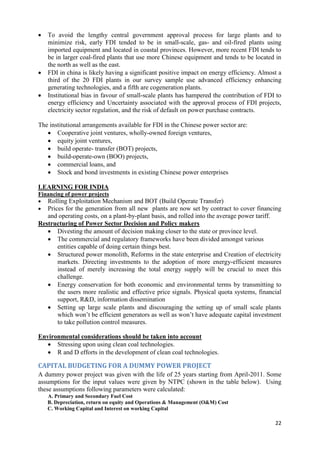
PROJECT DETAILS
This project had three parts. In first part, some assumptions were given for the input values
like project life, fuel cost, land cost, financial parameters, efficiency etc. for a dummy project
that NTPC is planning to implement. In this part he was to calculating Capital Budgeting
parameters like NPV and IRR considering the risk factors to determine the financial
implications of the project.
Second part was about to analyse the global Power sector Practices both in
developed and developing countries particularly focusing on China‘s Power Sector growth
trend, in hence proposing the various ways for operational and functional efficiency
improvement, financing pattern like FDI, Private participation etc. and other reforms
considering the regulatory norms, environmental effects etc. for the Indian Power Sector.
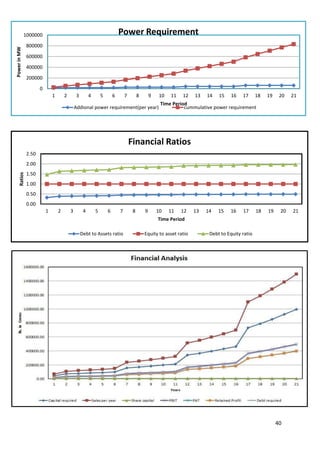
Finally, to project the Power demand and capital requirement year-on-year basis as
per the Five Year Plans, past track record and study reports from the various organisations
like World Bank, private consulting firms, planning commission etc. and prepare the financial
model using Excel tool depicting the visual representation in the forms of graphs and tables.
GLOBAL POWER SECTOR TRENDS
World electricity generation rose at an average annual rate of 3.7%, greater than the 2.1%
growth in total primary energy supply. The share of fossil fuels in the overall fuel mix for
electricity generation is in general more than 50–60%. From the fossil fuels, coal is most
frequently used [Exhibit: 5]. De-regulation in areas of the global energy markets has led to
fierce competition. The enormous challenges are recognised in providing electricity as
efficiently as possible and strive to develop technology to meet your needs. Collectively,
developing countries use 30% of the world's energy, but with projected population and
economic growth in those markets, energy demands are expected to rise 95 %. Overall global
consumption is expected to rise 50 % from 2005 to 2030. Many non-OECD countries facing
high electricity demand growth favour privatizing their electric power sectors and opening
their markets to foreign firms.
FUNDING PATTERN OF THE POWER PROJECTS
In many parts of the world, financial capital may be a greater resource constraint than primary
energy supplies. It has been estimated that over the period 1993 to 2010 investment to sustain
the power generation infrastructure will require from 0.1 to 0.2 per cent of GDP in the
industrialized countries, 0.6 to 1.1 per cent in China, and as much as 1.0 to 1.6 per cent in
India [Exhibit: 4]. Nearly two-thirds of all the capital raised for new private power projects
was provided under Project finance structures, in which project cash flows and assets, rather
than sponsors balance sheets, provide security to lenders. Structurally power project finance
has involved largely build-own-operate (BOO) project structures and long-term contract.
Merchant power plants are rare. The vast majority of debt has involved direct finance or
credit enhancement from export credit agencies and multilateral development banks. The
private sector uses a variety of mechanisms for managing risks but main is relying on central
government.
56](https://image.slidesharecdn.com/arvindsinghmahor-10bm60017-summerprojectreport-110731131256-phpapp01/85/Arvind-singh-mahor-summer-project-report-56-320.jpg)
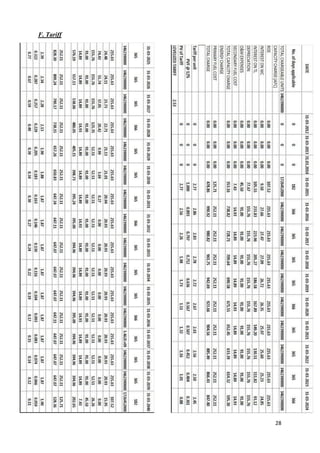
![LESSON FOR INDIA
Financing of power projects: Prices for the electricity produced from all new power plants
are now set by contract to cover financing and operating costs, on a plant-by-plant basis, and
rolled into the average power tariff. Encourage the FDI like China by Joint ventures (JVs),
Initial public offerings (IPOs) on stock exchanges, Build-Operate-Transfer (BOT)
agreements, simultaneously, implement "rolling exploitation mechanism".
Restructuring of Power Sector Decision: India should divest the amount of decision
making closer to the state or province level, structure the power monolith and create the
power markets. Along it, should investment in energy-efficient measures, energy
conservation for both economic and environmental terms, R&D and clean energy.
DEMAND AND SUPPLY STATUS
Rapid growth of the economy places a heavy demand on electric power. The demand for
electricity has consistently exceeded the supply, and the demand-supply gap has been
widening. The per capita power consumption in India is 733.54KWh/yr, which is very
minimal as compared to global average of 2340KWh/yr. In fiscal 2010, peak energy deficit
was 12.7% and total energy deficit was 10.1%. The total demand for electricity in India is
expected to cross 950,000 MW by 2030. Peak load demand, however, increased by 8.52%
whereas peak supply grew by 7.6 % resulting in raising peak load deficit to 12.7% in 2009-10
from 11.9 % in the previous year [Exhibit: 2]. Central Electricity Authority in its 17th Electric
Power Survey (EPS) has projected that in order to completely wipe off the energy deficit, the
energy requirement at the power station bus bar would be of the order of 968.659 Billion
Units in 2011-12 The Indian government has set an ambitious target to add approximately
78,000 MW of installed generation capacity by 2012.
POWER GENERATION EFFICIENCY
After comparing these statistics to International Energy Agency (IEA) statistics it is noticed
that Indian Power generation among the lease efficient. The biggest indicator of a poor track
record is the inability to meet targets on the power generation capacity additions [Exhibit: 3].
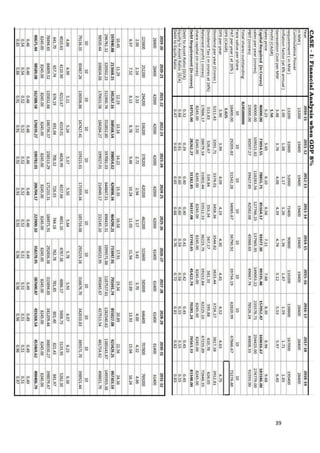
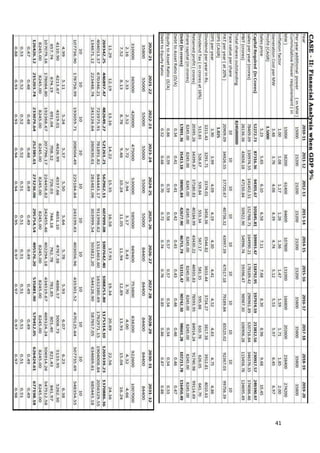
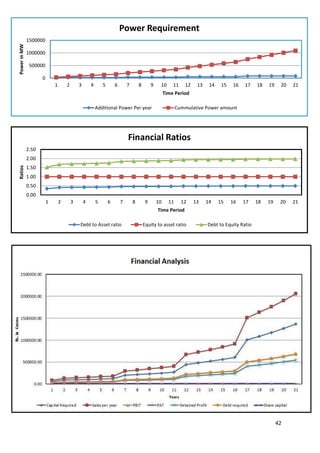
PROJECTION OF THE DEMAND AND INVESTMENT
[Exhibit: 6]
FINANCIAL STRATEGIES AND FUND RAISING BY NTPC
NTPC is leveraging strong ratios to raise debt at optimal rates. New projects to be financed
with Debt equity ratio of 70:30. NTPC is maintaining sufficient internal accruals to finance
equity portion of the scheduled investment and deploying equity in Subsidiaries/JVs
selectively – preferably with control retention. Long term debt (term loans/bonds) is preferred
to match project cash flows-to be realised from domestic/international markets. Projects
executed by subsidiaries and JVs to be financed under projects finance route.
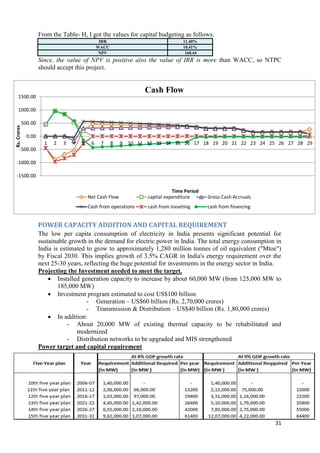
RESULTS
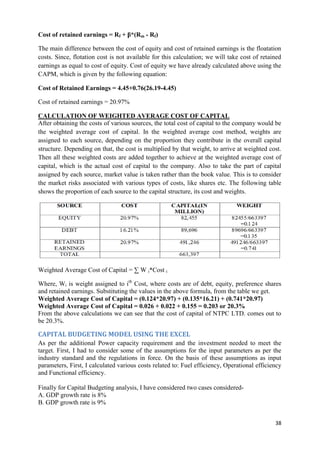
The results for the capital budgeting of dummy project came out as:
WACC = 10.41% IRR = 11.40% NPV = 160.44 Rs.
And capital investment in term of equity and debt was calculated at GDP rate of 8% and 9%.
57](https://image.slidesharecdn.com/arvindsinghmahor-10bm60017-summerprojectreport-110731131256-phpapp01/85/Arvind-singh-mahor-summer-project-report-57-320.jpg)

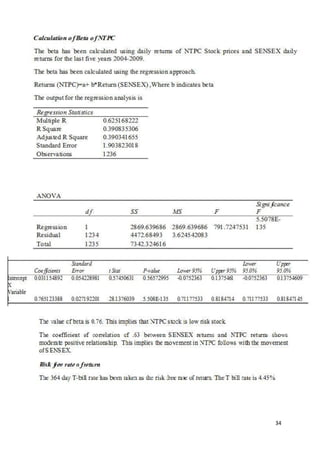
This document provides an executive summary, background on NTPC Ltd and the Indian power sector, objectives of the project report, methodology used, and results. The objectives were to provide an optimal financial model for NTPC's capital budget and structure to meet 12th Five Year Plan targets, and analyze power policies in India and China to enhance India's capacity. The methodology included primary and secondary data collection, exploratory and mathematical analysis using tools like capital budgeting and Excel, and recommending policies. The results showed that India needs improvements in various areas like capacity addition, operations, funding, costs, regulations and distribution to meet targets sustainably while transitioning to alternative energy sources.


