artigo cientifico de revisãokfnerkfnrekfnerkfnerkfn
1.
Context:
3. Mapping 137Csinitial fallout in South American soils
1- Studies carried out during
the period of nuclear
weapons tests, by AMAP,
1955-1985
2- Work carried out with the
spatial variation in the
global precipitation of
Cs137 in Iceland
3- Study with co-simulation
of indicators among 141
inventories in reference soil
locations
4- Study with Digital Soil
Mapping Approach to Predict
Proportions and Sources of
Artificial Radionuclides in
Western European Soils
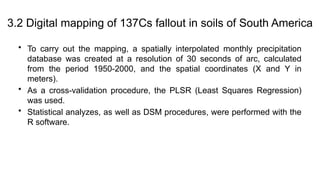
3.2 Digital mappingof 137Cs fallout in soils of South America
• To carry out the mapping, a spatially interpolated monthly precipitation
database was created at a resolution of 30 seconds of arc, calculated
from the period 1950-2000, and the spatial coordinates (X and Y in
meters).
• As a cross-validation procedure, the PLSR (Least Squares Regression)
was used.
• Statistical analyzes, as well as DSM procedures, were performed with the
R software.
4.
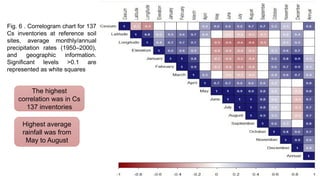
Fig. 6 .Correlogram chart for 137
Cs inventories at reference soil
sites, average monthly/annual
precipitation rates (1950–2000),
and geographic information.
Significant levels >0.1 are
represented as white squares
The highest
correlation was in Cs
137 inventories
Highest average
rainfall was from
May to August
5.
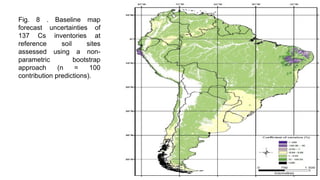
Fig. 8 .Baseline map
forecast uncertainties of
137 Cs inventories at
reference soil sites
assessed using a non-
parametric bootstrap
approach (n = 100
contribution predictions).
6.
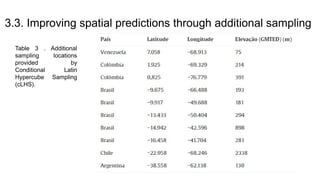
3.3. Improving spatialpredictions through additional sampling
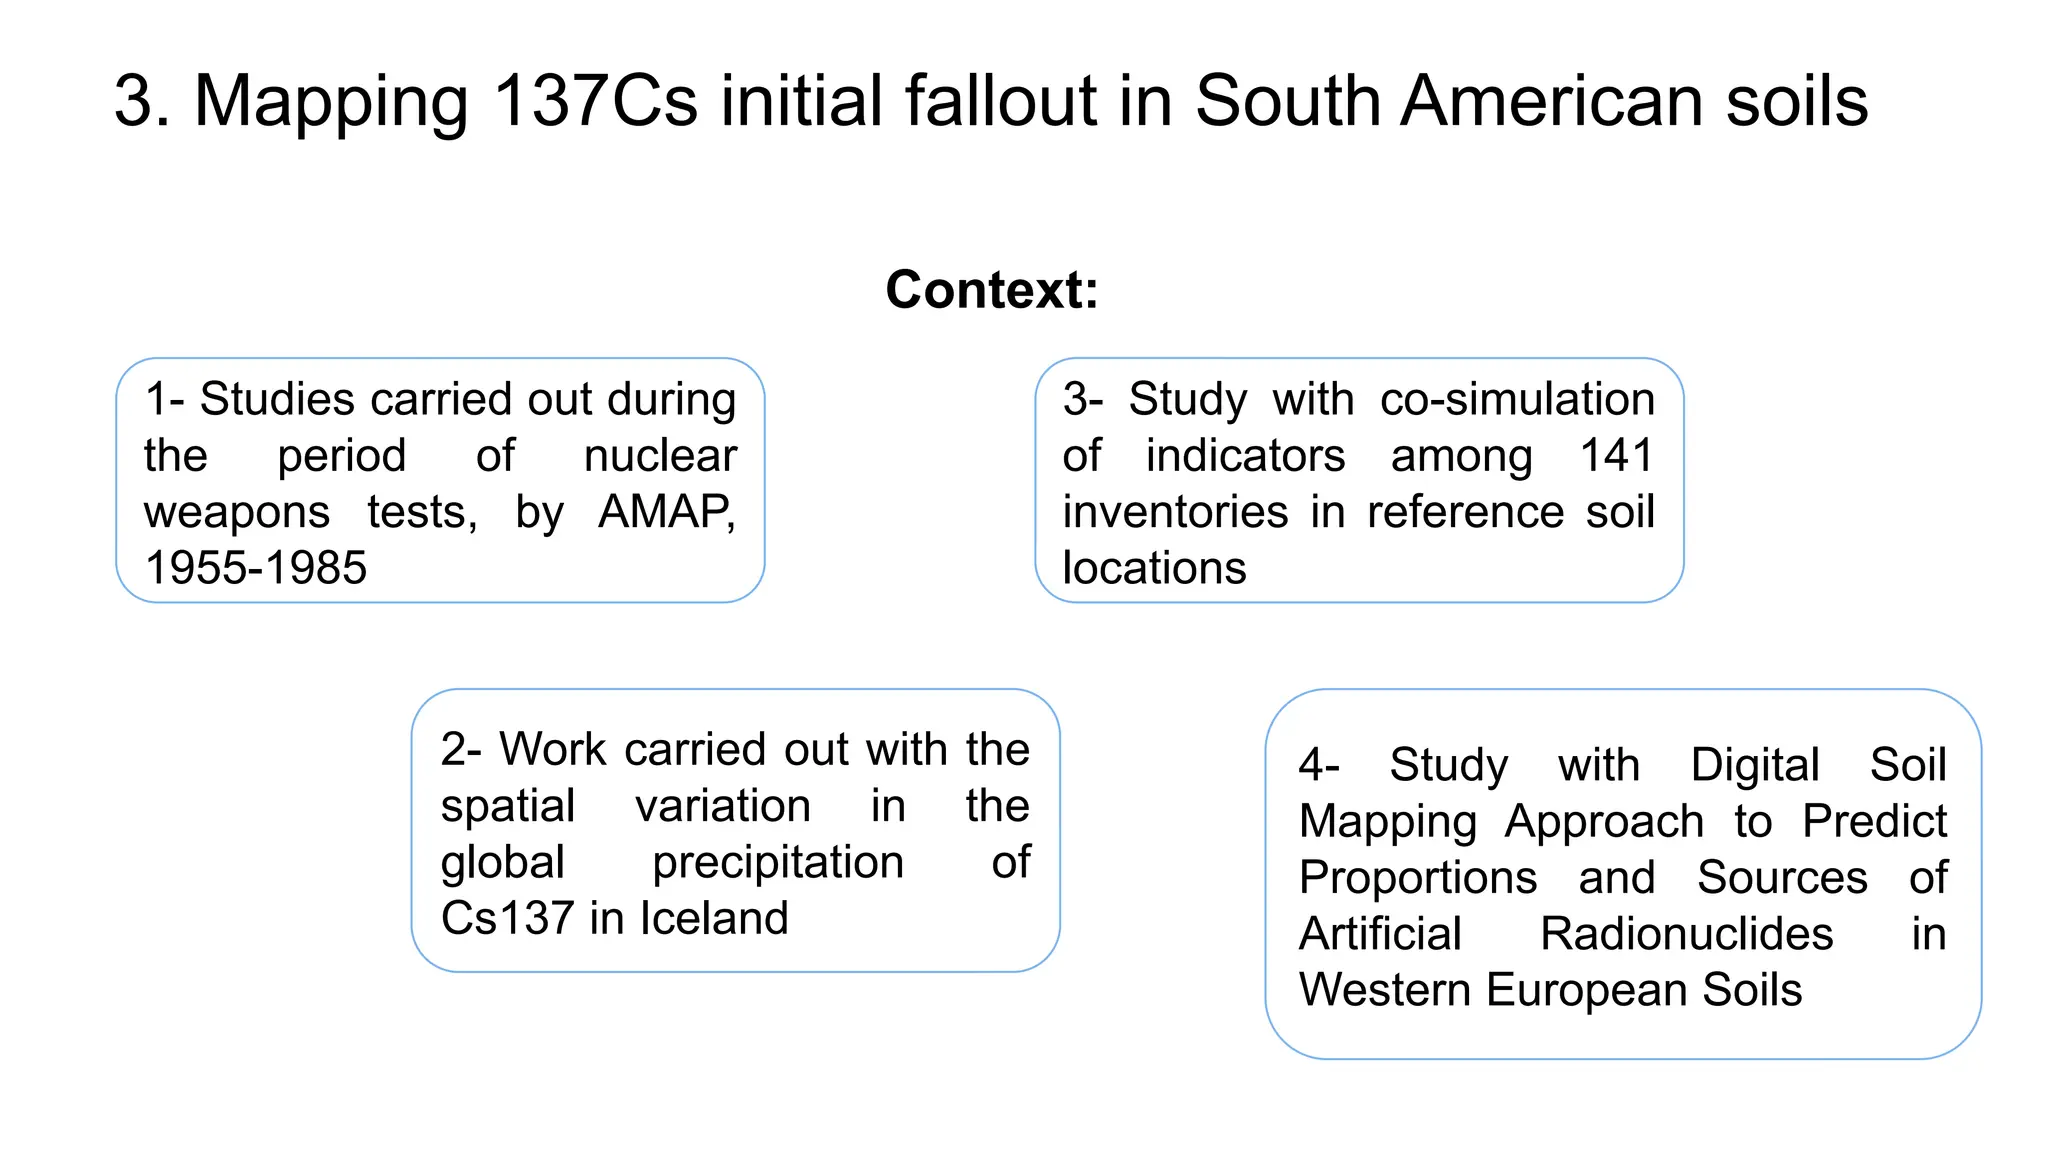
Table 3 . Additional
sampling locations
provided by
Conditional Latin
Hypercube Sampling
(cLHS).
7.
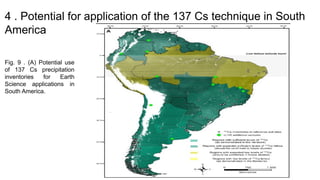
4 . Potentialfor application of the 137 Cs technique in South
America
Fig. 9 . (A) Potential use
of 137 Cs precipitation
inventories for Earth
Science applications in
South America.