Argie bond quant portfolio track record
•
0 likes•50 views

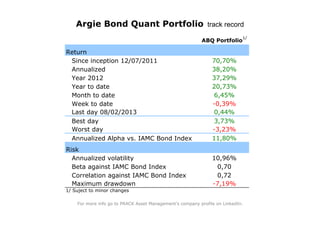
The document provides performance metrics for the ABQ Portfolio, including returns since inception in December 2011, annualized returns for 2012 and year-to-date, as well as monthly, weekly, and daily returns. It also lists the best and worst single days, annualized alpha, risk measures like volatility and beta, and maximum drawdown of 7.19%.

Recommended
Recommended
More Related Content
What's hot
What's hot (20)
More from Francisco Prack
More from Francisco Prack (20)
Argie bond quant portfolio track record
- 1. Return Since inception 12/07/2011 Annualized Year 2012 Year to date Month to date Week to date Last day 08/02/2013 Best day Worst day Annualized Alpha vs. IAMC Bond Index Risk Annualized volatility Beta against IAMC Bond Index Correlation against IAMC Bond Index Maximum drawdown 1/ Suject to minor changes ABQ Portfolio 1/ 70,70% 6,45% -0,39% 38,20% 20,73% 37,29% -3,23% 0,44% 3,73% 11,80% 10,96% 0,70 -7,19% 0,72 Argie Bond Quant Portfolio track record For more info go to PRACK Asset Management's company profile on LinkedIn.
- 2. Daily data Inception date 12/07/2011 =1 Argie Bond Quant Portfolio track record 0,90 1,00 1,10 1,20 1,30 1,40 1,50 1,60 1,70 1,80 D 2011 J 2012 F M A M J J A S O N D J 2013 F M A M J J A Maximum drawdown Recovery ABQ Portfolio