Argie bond quant portfolio track record
•
0 likes•56 views

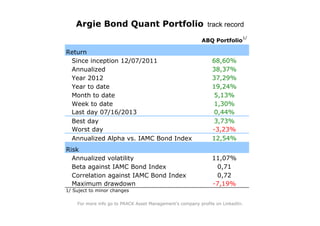
The document provides performance metrics for the ABQ Portfolio from inception in December 2011 through mid-July 2013. It shows the portfolio's annualized and year-to-date returns, monthly returns, and best and worst single-day performances. It also includes risk metrics like annualized volatility, beta, correlation, and maximum drawdown compared to an index.

Recommended
Recommended
More Related Content
What's hot
What's hot (20)
More from Francisco Prack
More from Francisco Prack (20)
Argie bond quant portfolio track record
- 1. Return Since inception 12/07/2011 Annualized Year 2012 Year to date Month to date Week to date Last day 07/16/2013 Best day Worst day Annualized Alpha vs. IAMC Bond Index Risk Annualized volatility Beta against IAMC Bond Index Correlation against IAMC Bond Index Maximum drawdown 1/ Suject to minor changes ABQ Portfolio 1/ 68,60% 5,13% 1,30% 38,37% 19,24% 37,29% -3,23% 0,44% 3,73% 12,54% 11,07% 0,71 -7,19% 0,72 Argie Bond Quant Portfolio track record For more info go to PRACK Asset Management's company profile on LinkedIn.
- 2. Daily data Inception date 12/07/2011 =1 Argie Bond Quant Portfolio track record 0,90 1,00 1,10 1,20 1,30 1,40 1,50 1,60 1,70 1,80 D 2011 J 2012 F M A M J J A S O N D J 2013 F M A M J J Maximum drawdown Recovery ABQ Portfolio