The document discusses Engro Corporation Limited's annual report for 2009, which saw the completion of Engro Chemical Pakistan Limited's conversion into a holding company structure called Engro Corporation Limited. Key highlights from 2009 included record revenue, continued progress on expansion projects, and the establishment of new subsidiaries. The annual report provides financial and operational details on Engro Corporation Limited and its various subsidiaries for the fiscal year ending December 31, 2009.


![(Amounts in thousand)
2009 2008
(Rupees)
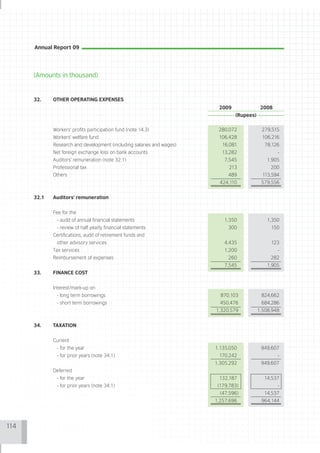
Engro Polymer & Chemicals Limited 3,593,712 3,688,167
Engro Fertilizers Limited - -
Engro Eximp (Private) Limited [including advance against issue 499,386 3,283
of share capital amounting to Rs. 480,000 (2008: Nil)]
Engro Management Services (Private) Limited 2,663 2,579
Engro Foods Limited [including advance against issue of
share capital amounting to Nil (2008: Rs. 50,000)] 3,370,148 2,731,747
Engro Energy Limited 2,928,318 2,984,011
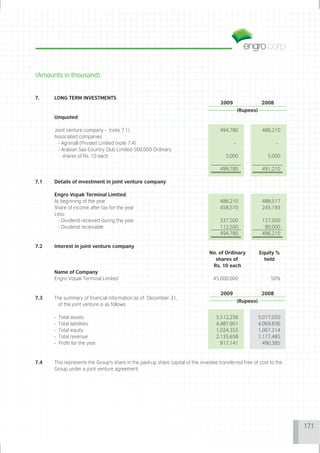
Engro Vopak Terminal Limited 512,178 503,607
Engro PowerGen Limited [including advance against
issue of share capital Rs. 298,800 (2008: Rs. 15,100)] 290,857 3,824
Avanceon Limited 58,392 49,584
Arabian Sea Country Club Limited (June 30, 2009) 3,197 3,043
Agrimall (Private) Limited (June 30, 2008) (4,096) (4,096)
7. EMPLOYEE SHARE OPTION SCHEME
Under the Employee Share Option Scheme (the Scheme), senior employees who are critical to the business
operations are granted options to purchase 5 million newly issued ordinary shares at an exercise price of
Rs. 277 per ordinary share. As per the Scheme, the entitlements and exercise price are subject to adjustments
because of issue of right shares and bonus shares. The number of options granted to an employee is calculated
in accordance with the criticality of employee to the business and their ability and is subject to approval by
the Compensation Committee. No amounts are paid or payable by the recipient on receipt of the option. The
options carry neither right to dividends nor voting rights. Vesting period has started from the date of grant,
for employees who were granted shares on or before June 30, 2008 and shall end on December 31, 2010,
where after these options can be exercised within a period of two years ending December 31, 2012.
For options granted after June 30, 2008, the vesting period will end such number of days after December
31, 2010 as is equal to the number of days between the date the initial option letters were issued and the date
of grant of the later options. However, the latter options can also only be exercised upto December 31, 2012.
93](https://image.slidesharecdn.com/arengro2009-130318112112-phpapp02/85/Ar-engro2009-94-320.jpg)


![(Amounts in thousand)
15.3 During 2008, Model Customs Collectorate raised a sales tax demand of Rs. 57,135 on certain imports of Mono
Ammonium Phosphate (MAP) 10:50:0 by the Holding Company based on the actual import value rather than
the deemed value as prescribed by SRO 609 (1) / 2004.
The Holding Company has paid the demand made under protest and filed an appeal before the Collector, Sales
Tax and Federal Excise. Further, the Ministry of Food, Agriculture and Livestock had also recommended through
its letter dated June 27, 2008 that the aforementioned grade of MAP should be assessed at deemed value of
import with retrospective effect. The management therefore is confident that the issue would be decided in
the Holding Company's favor.
15.4 Includes sales tax refundable of the Subsidiary Company, Engro Foods Limited, amounting to Rs. 409,328
(2008: Rs. 239,516). Sales tax has been zero rated on Engro Foods Limited's supplies (output), raw materials,
components and assemblies imported or purchased locally by the Subidiary Company for manufacturing in
respect of its dairy operations. Provisions for impairment amounting to Rs. 121,539 (2008: Rs. 36,361) has
been made against the aforementioned refundable balance.
15.5 The Collector of Customs through his order dated April 11, 2008 disposed off the refund applications filed
by the Subsidiary Company (EPCL) for the refund of custom duty paid at import stage on import of Vinyl Chloride
Monomer. The Subsidiary Company based on the advice of its tax consultant, has filed an appeal before the
Collector of Customs (Appeals), Karachi dated May 31, 2008 against the aforementioned order on which no
progress has been made. However, based on prudence, full provision is carried against the aforementioned
custom duty refundable.
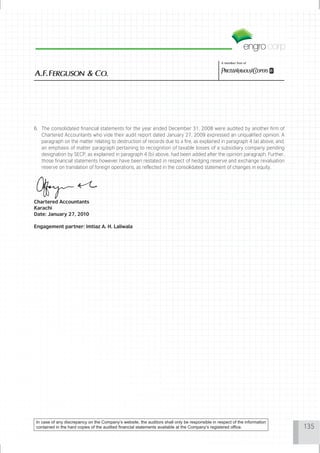
15.6 The maximum amounts due from joint venture at the end of any month during the year aggregated as follows:
2009 2008
(Rupees)
Engro Vopak Terminal Limited [includes dividend of
Rs. 112,500 (2008: Rs. 90,000)] 135,509 93,134
15.7 Includes marketing support subsidy receivable amounting to Rs. 226,322 (2008: Rs. 46,221), under an agreement
dated September 24, 2009 for quantity size discount and investment support allowance, net off amount due
on account of packaging material purchased by the Subsidiary Company, Engro Foods Limited.
15.8 As at December 31, 2009 receivables aggregating to Rs. 59,061 (2008: Rs. 57,292) were past due but not
impaired. The ageing analysis of these loans and advances is as follows:
2009 2008
(Rupees)
Upto 3 months 9,953 23,501
3 to 6 months - 1,941
More than 6 months 49,108 31,850
59,061 57,292
181](https://image.slidesharecdn.com/arengro2009-130318112112-phpapp02/85/Ar-engro2009-182-320.jpg)