Downloaded 10 times
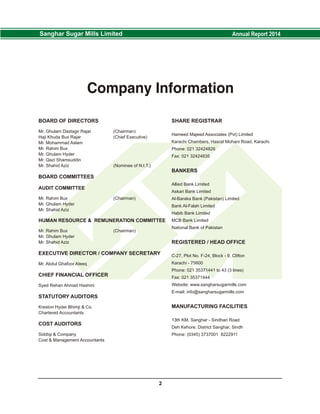
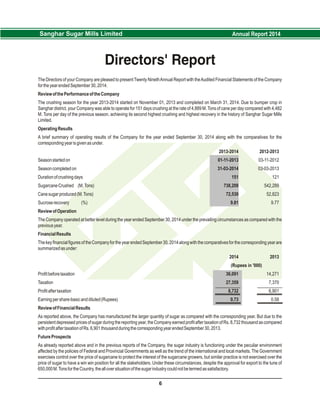
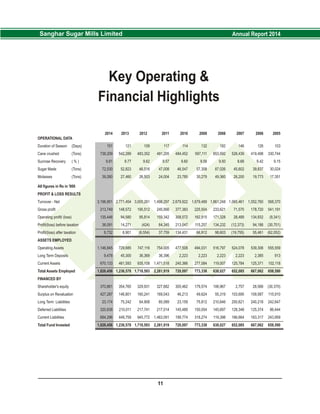
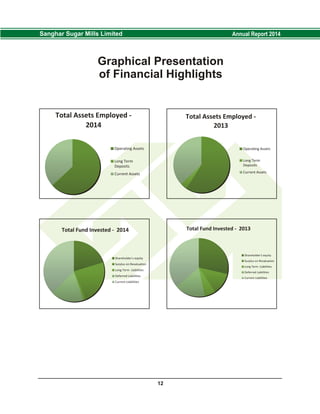
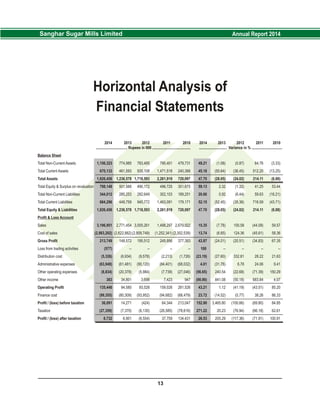
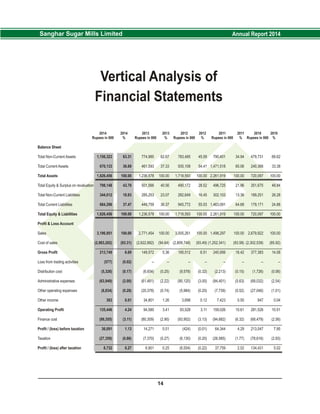
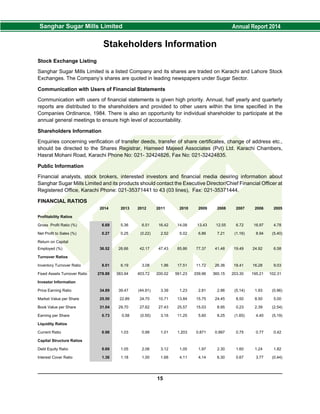
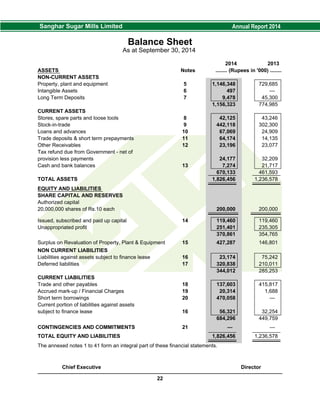
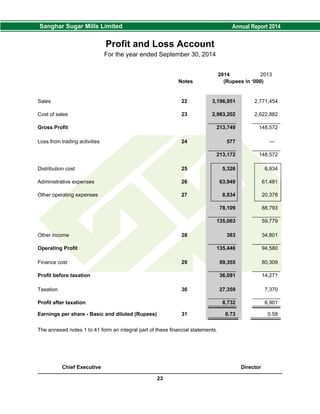
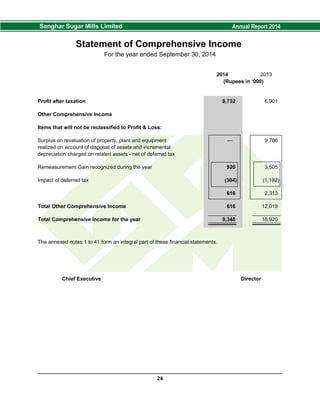
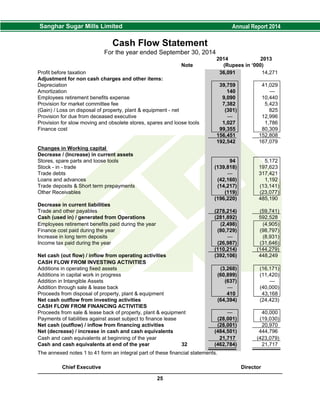

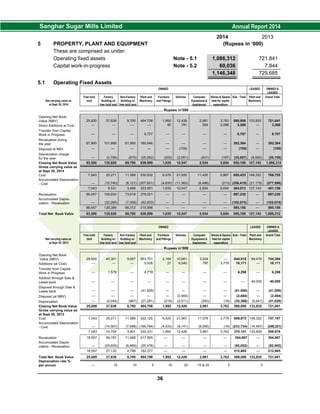

- Sanghar Sugar Mills Limited is a listed company trading on the Karachi and Lahore Stock Exchanges. It communicates regularly with shareholders and other users through annual, half-yearly, and quarterly reports. - The company saw an increase in profit after taxation to Rs. 8.7 million in 2014 compared to Rs. 6.9 million in 2013. Total assets also increased substantially to Rs. 1.8 billion in 2014 from Rs. 1.2 billion in 2013. - Key financial ratios such as gross profit ratio, net profit to sales, return on capital employed, and earnings per share all improved from 2013 to 2014, indicating stronger financial performance.