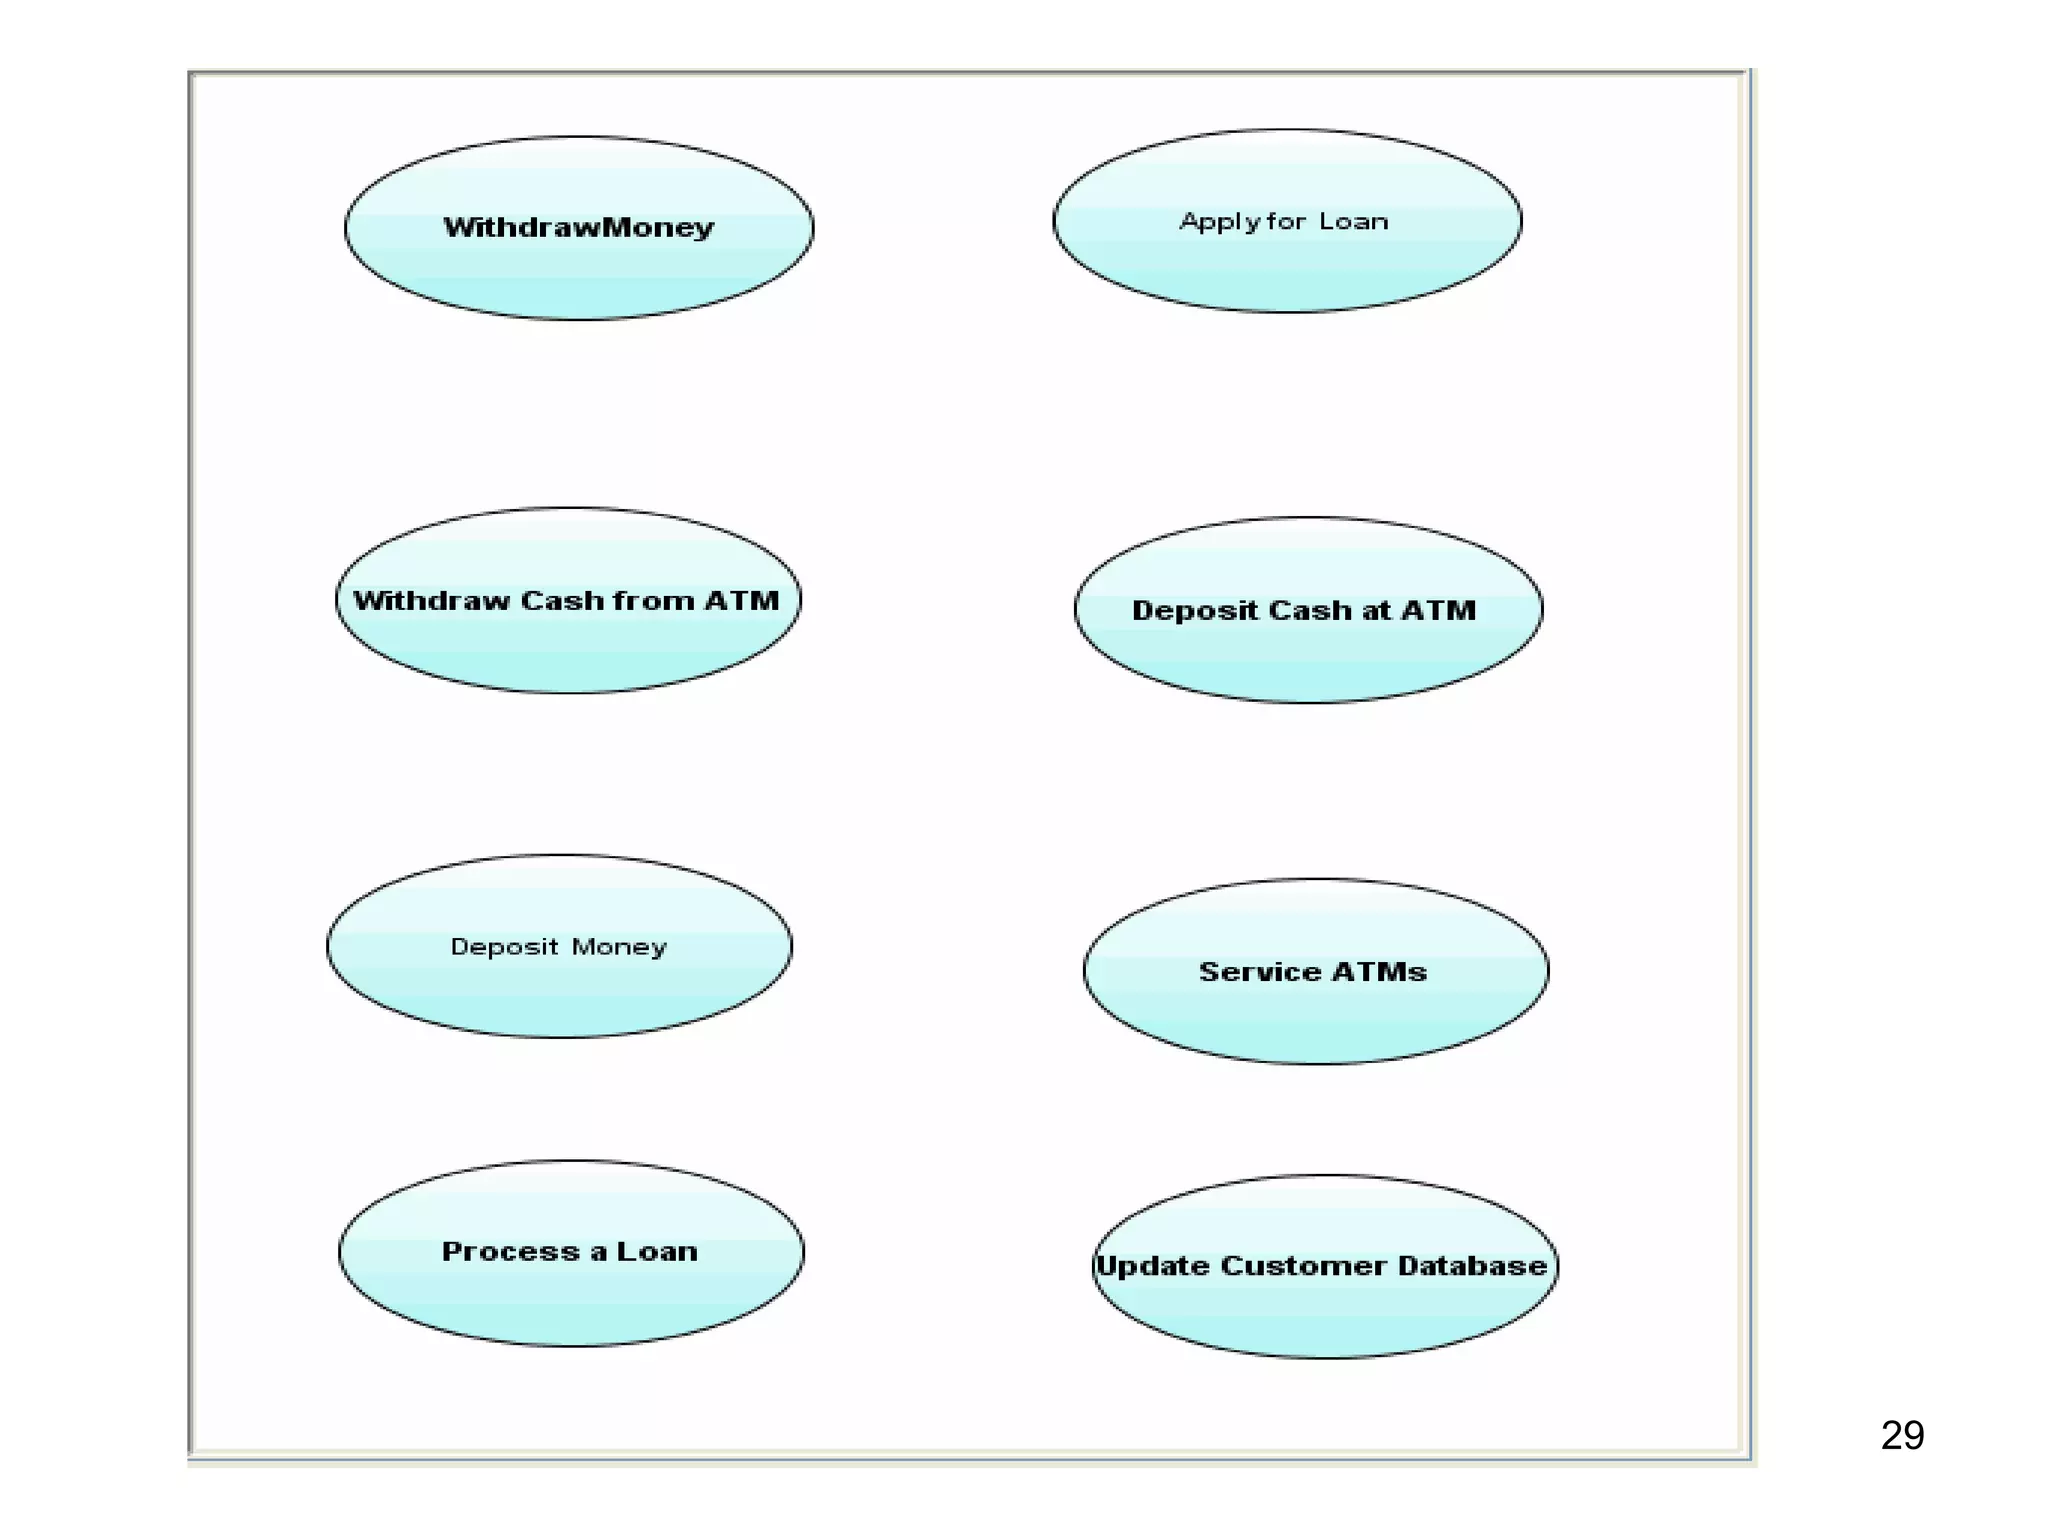
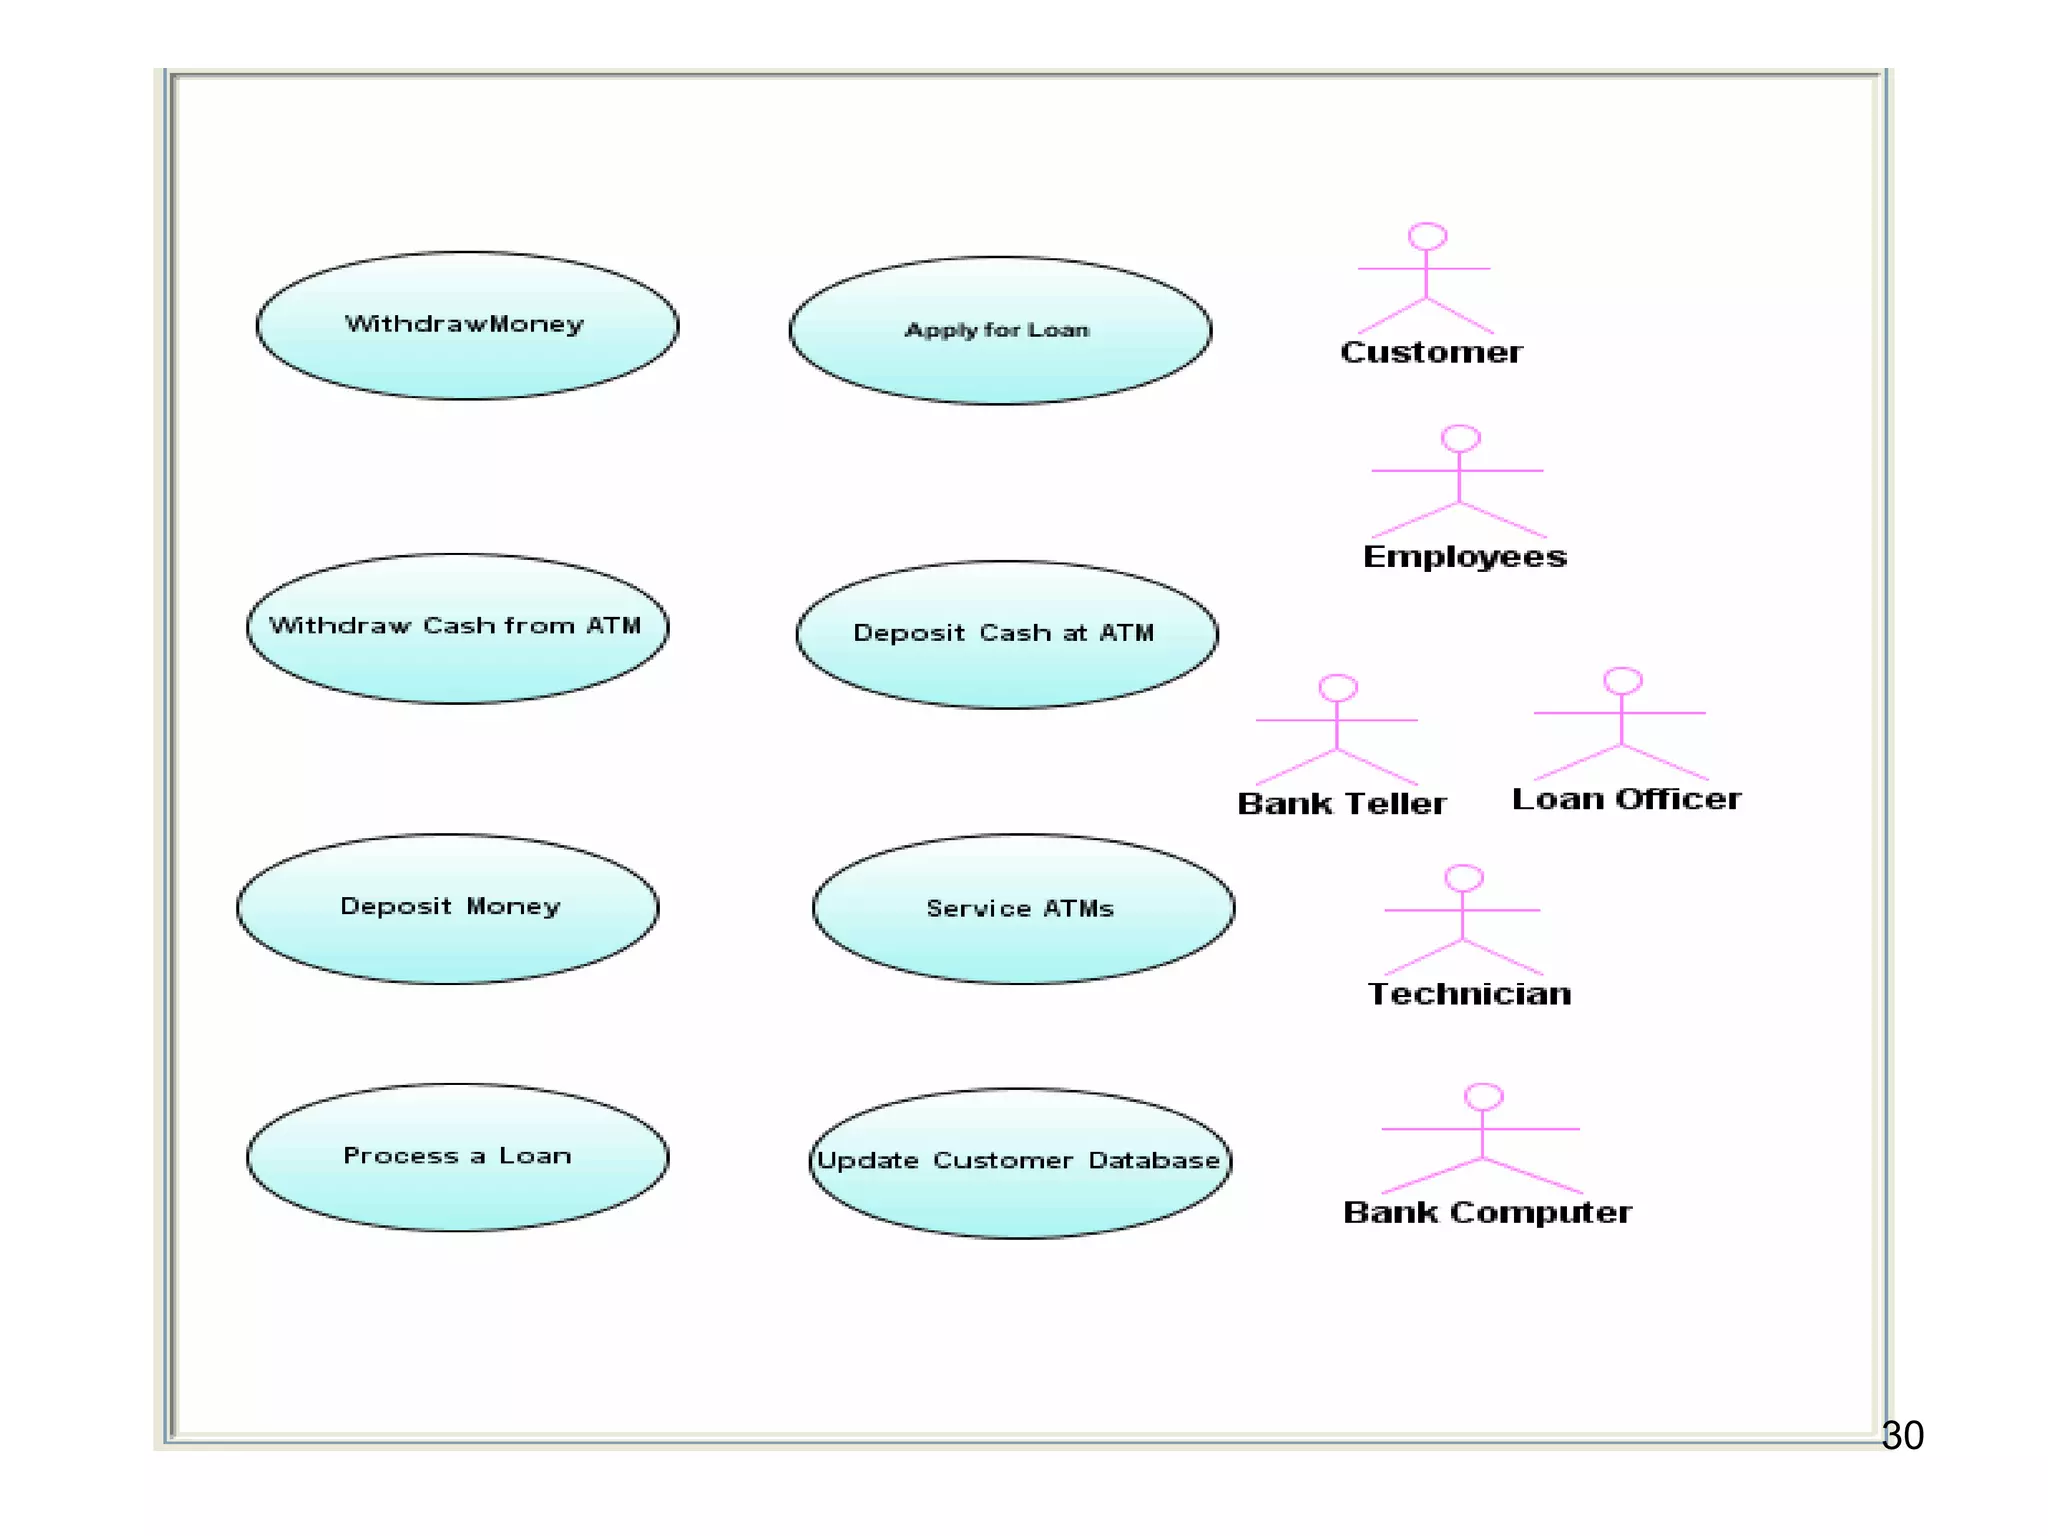
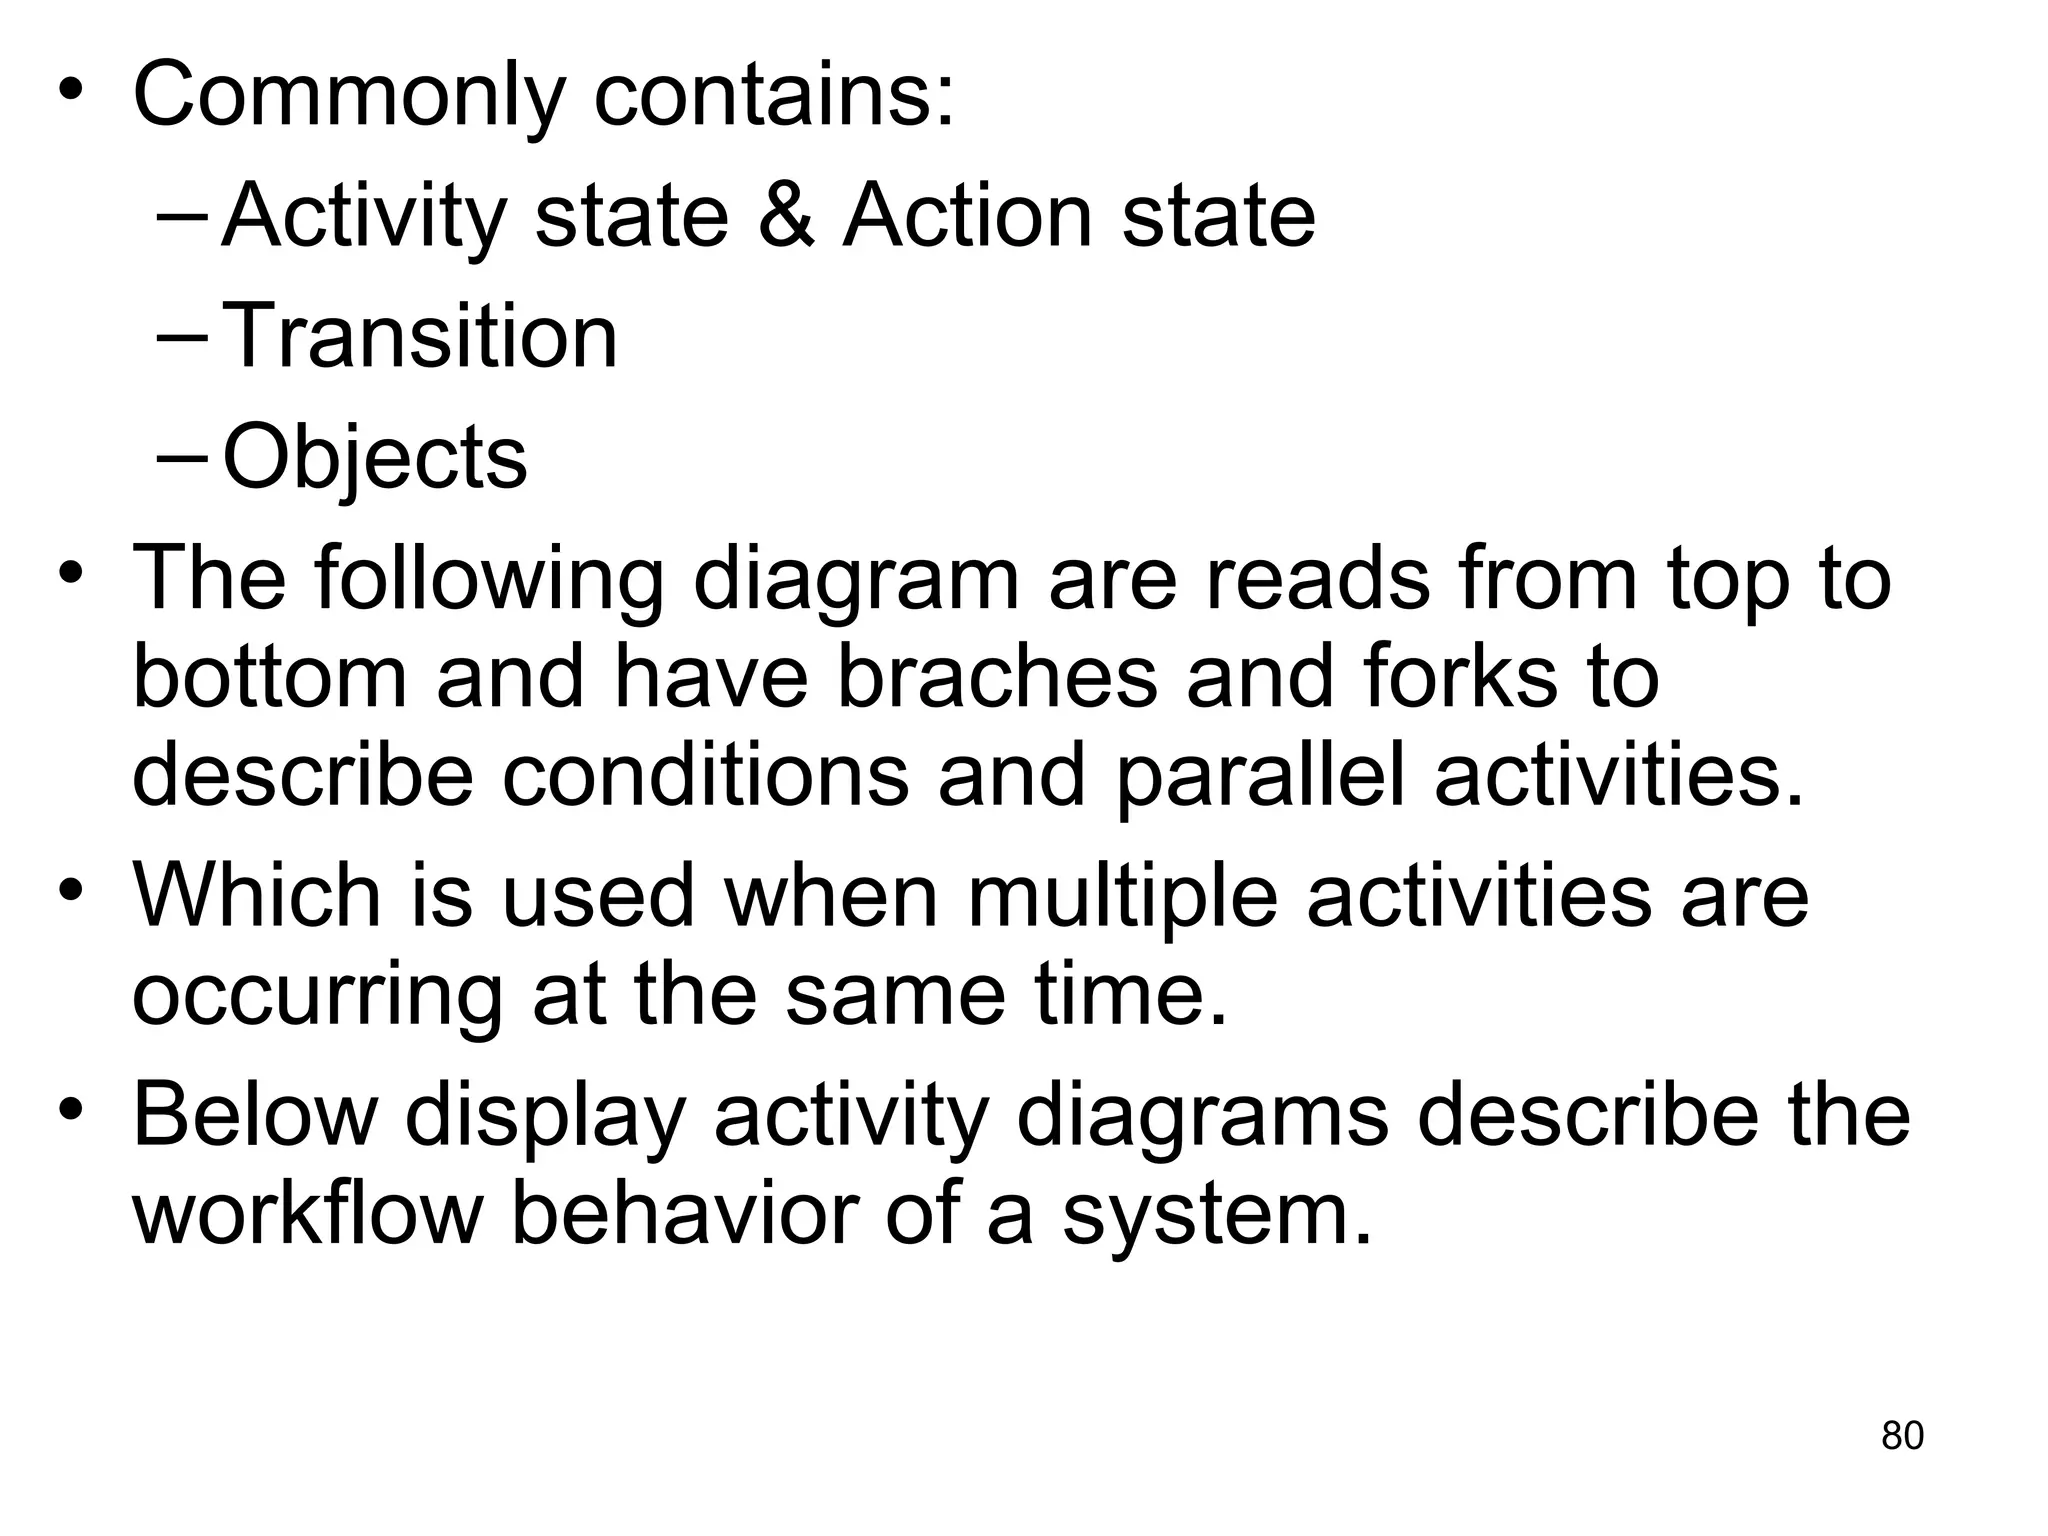
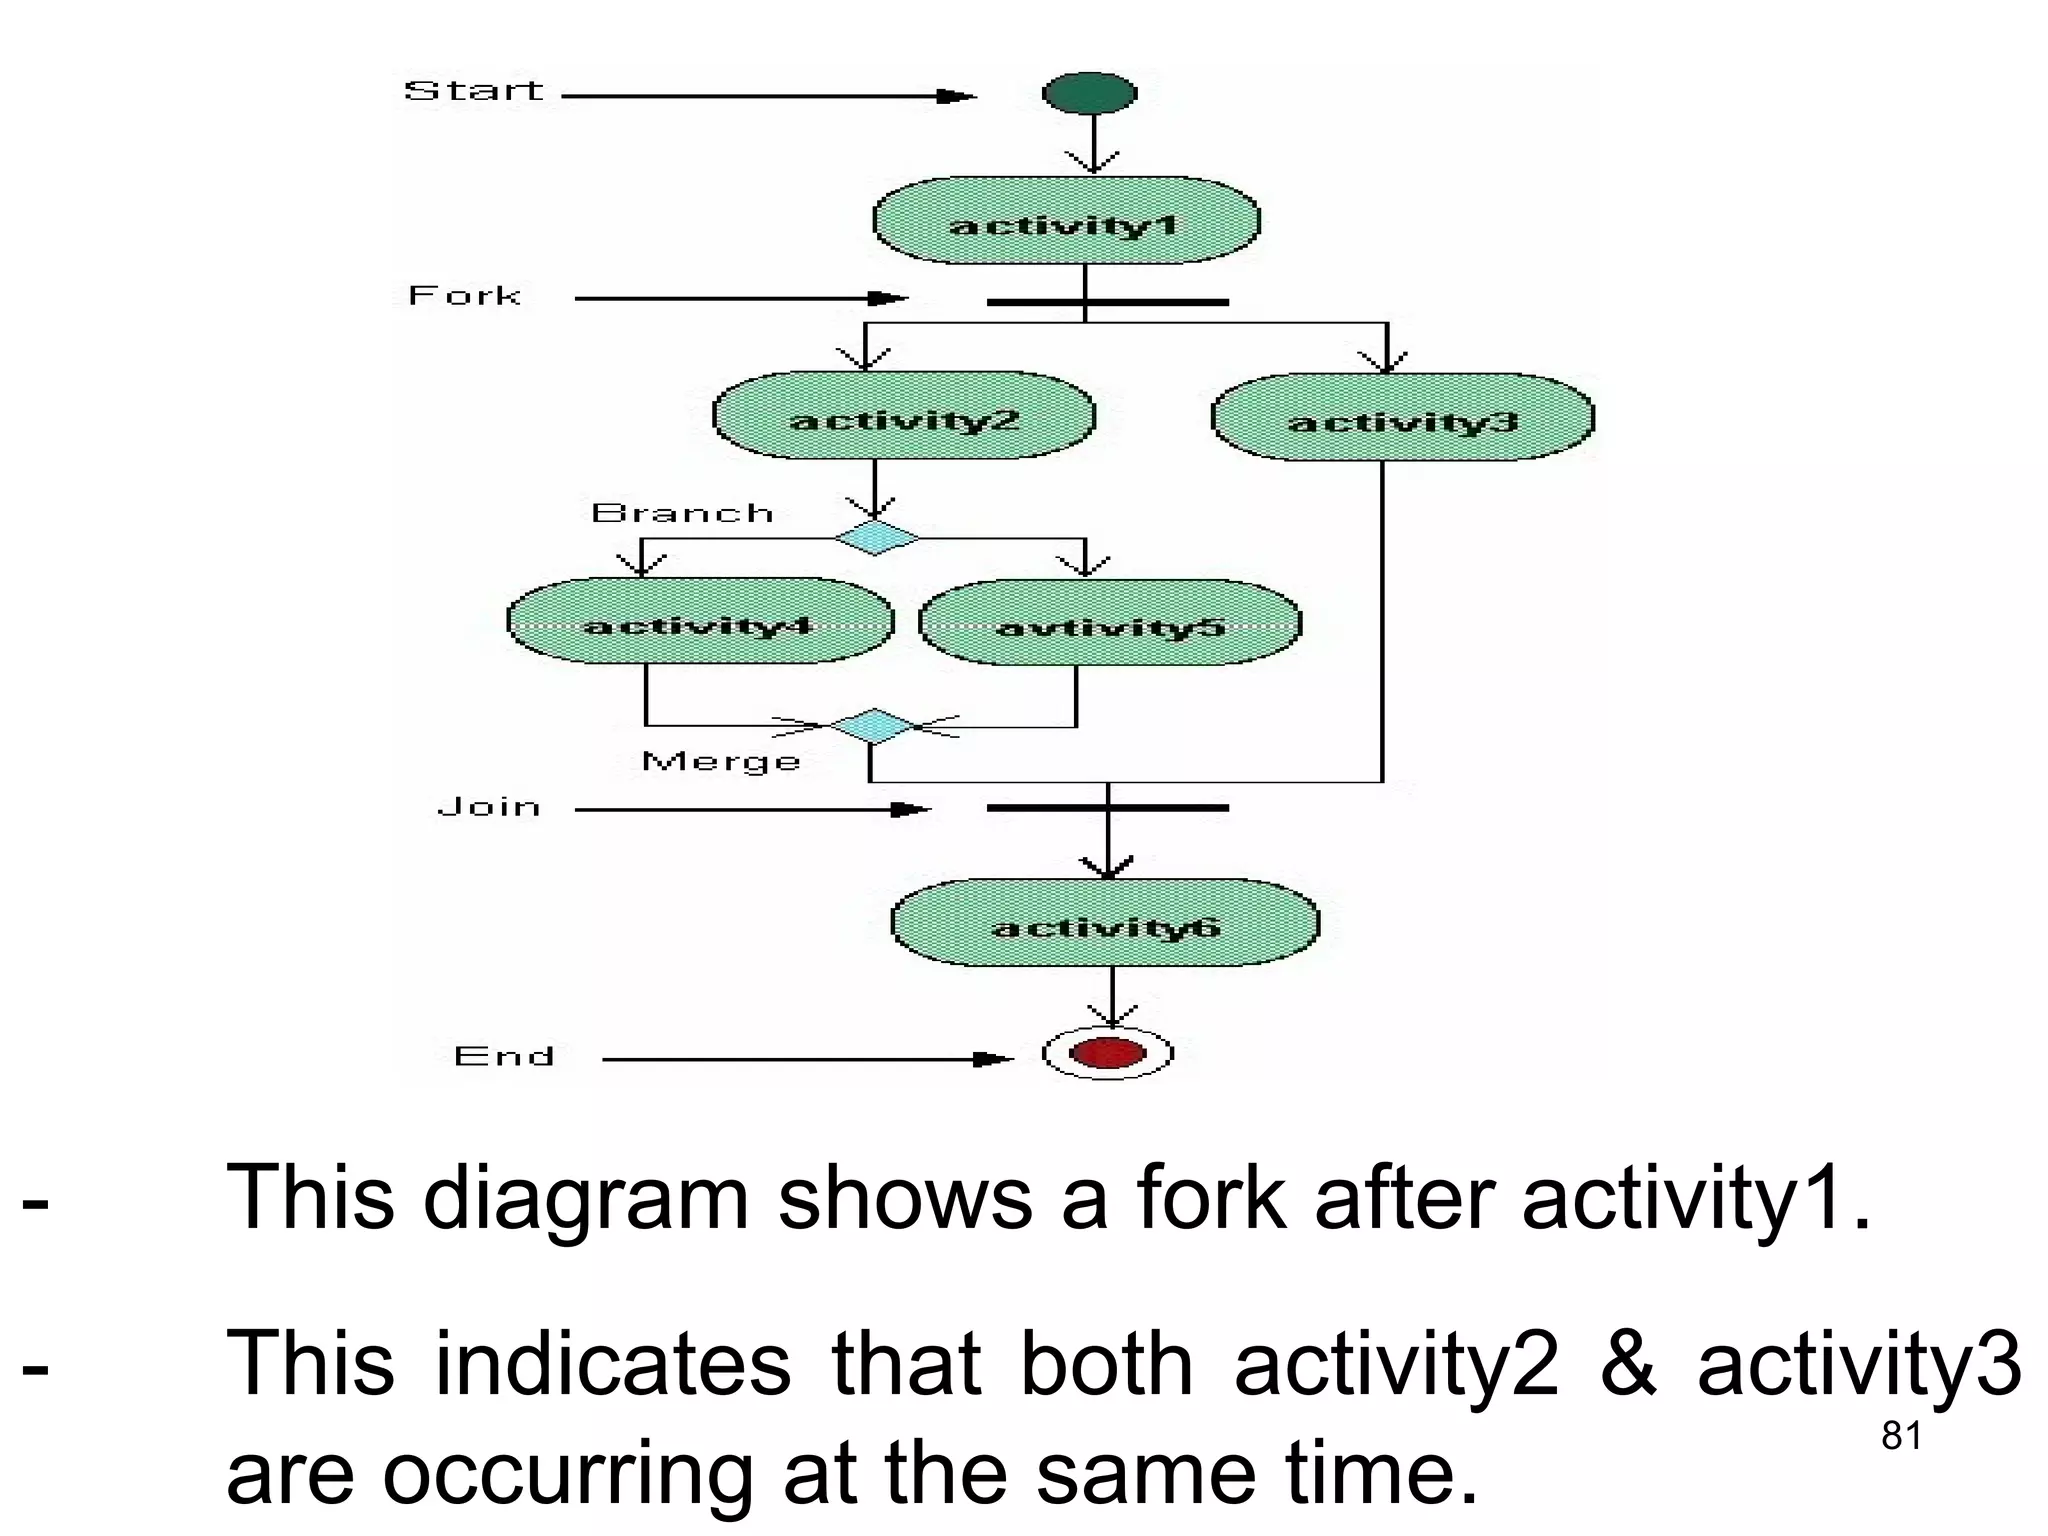
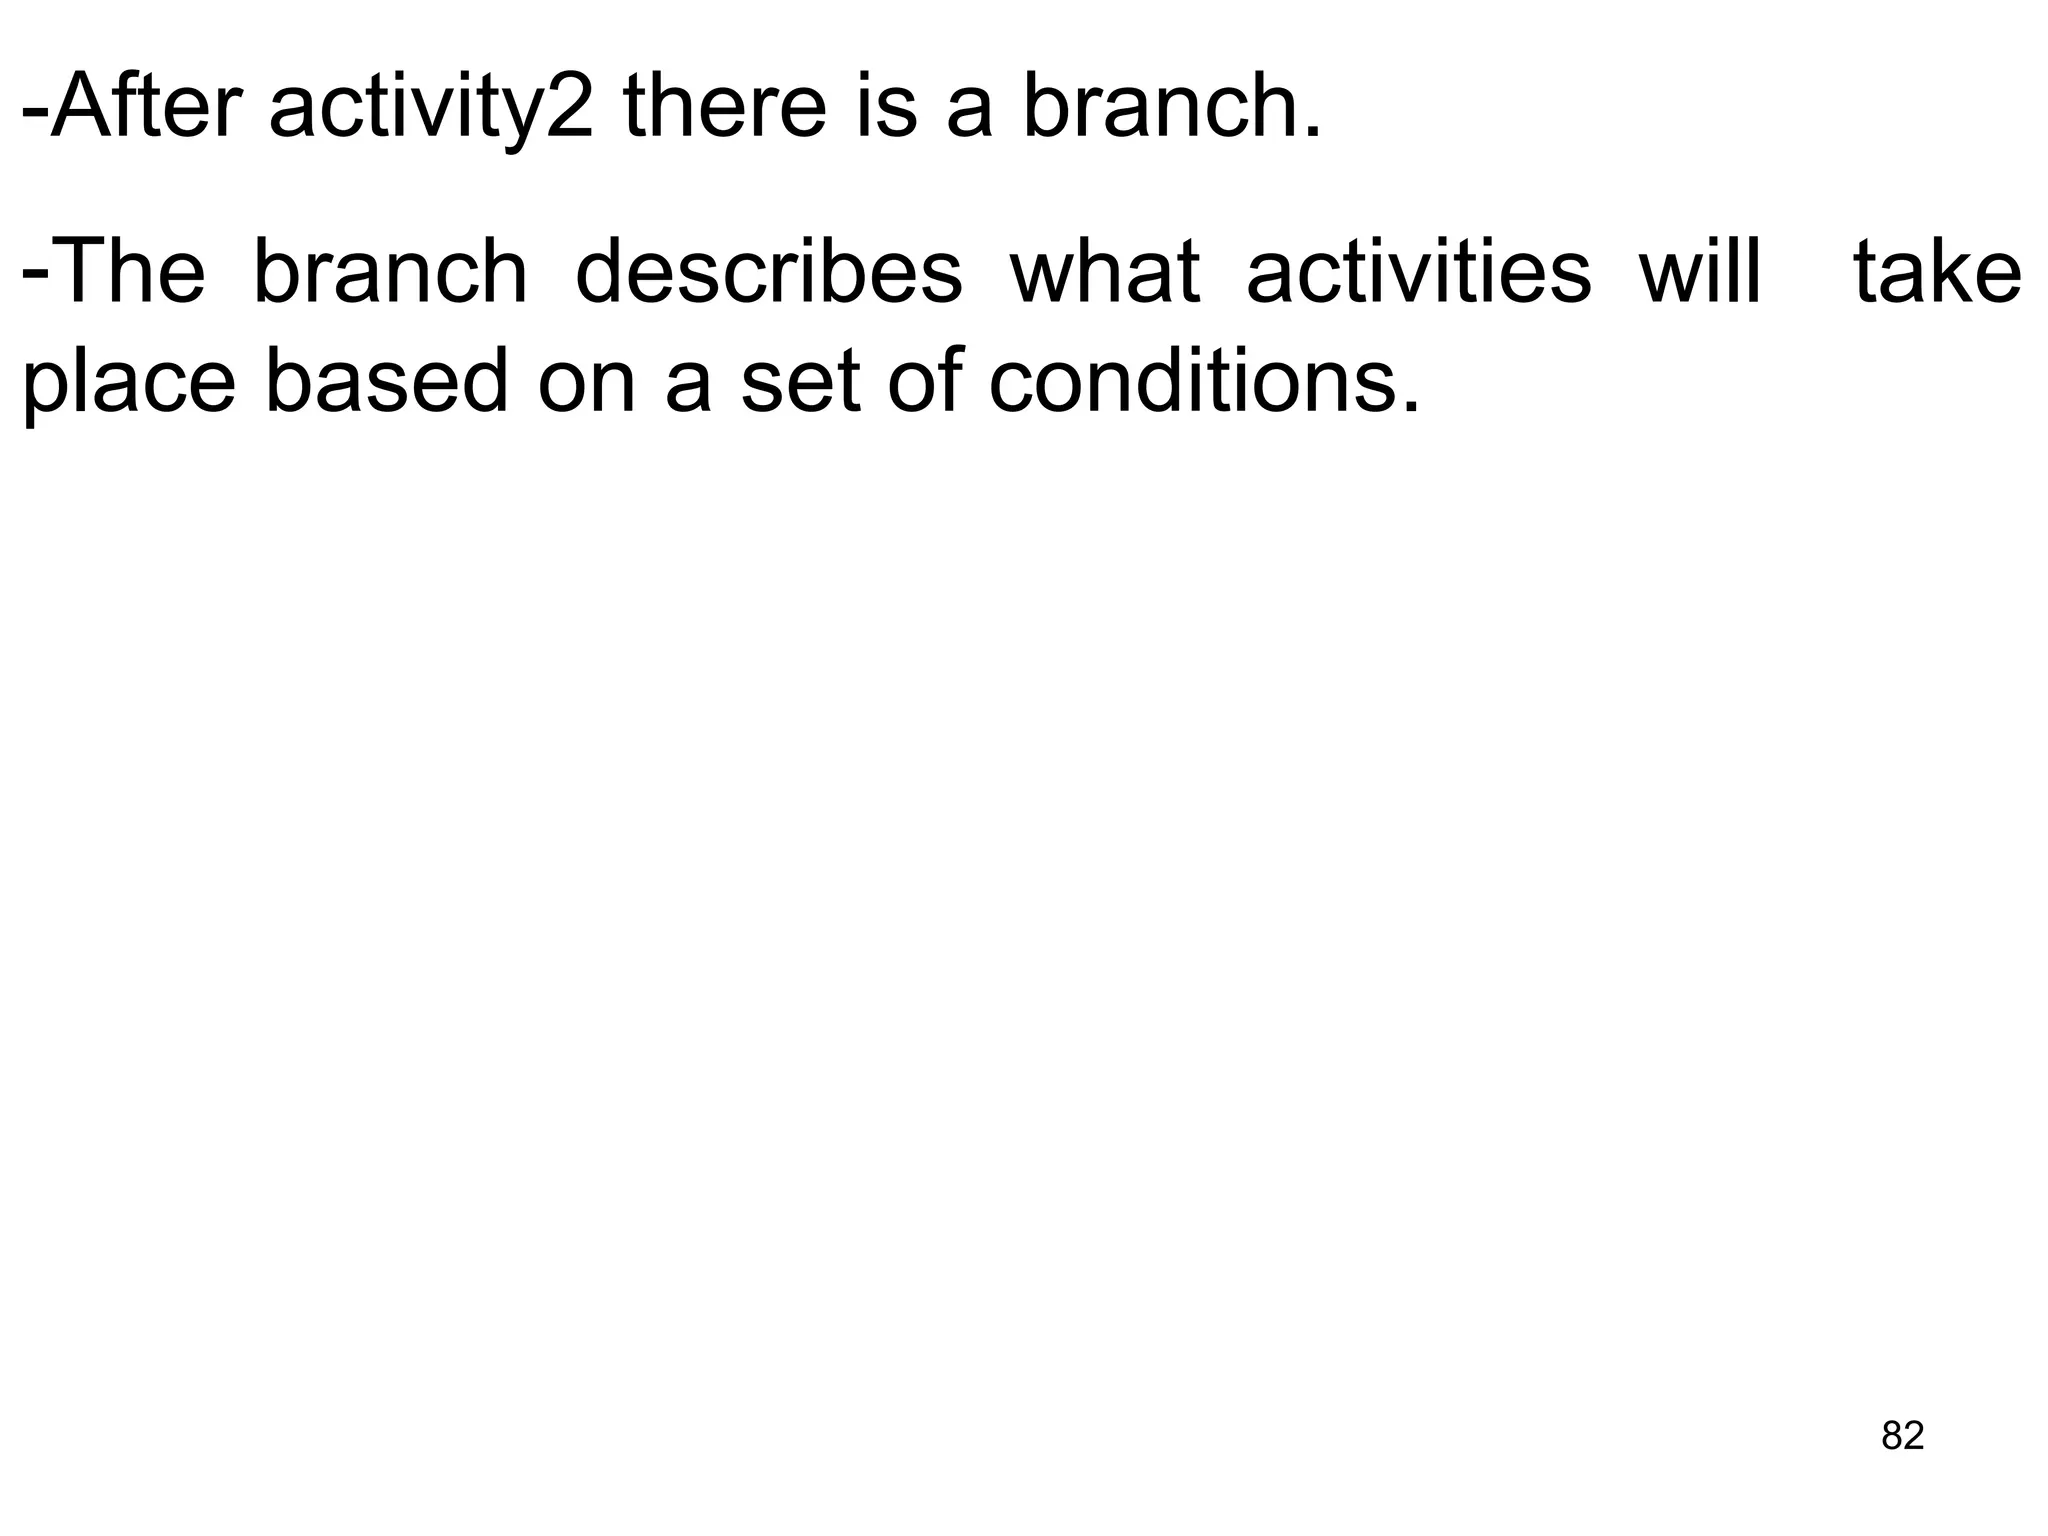
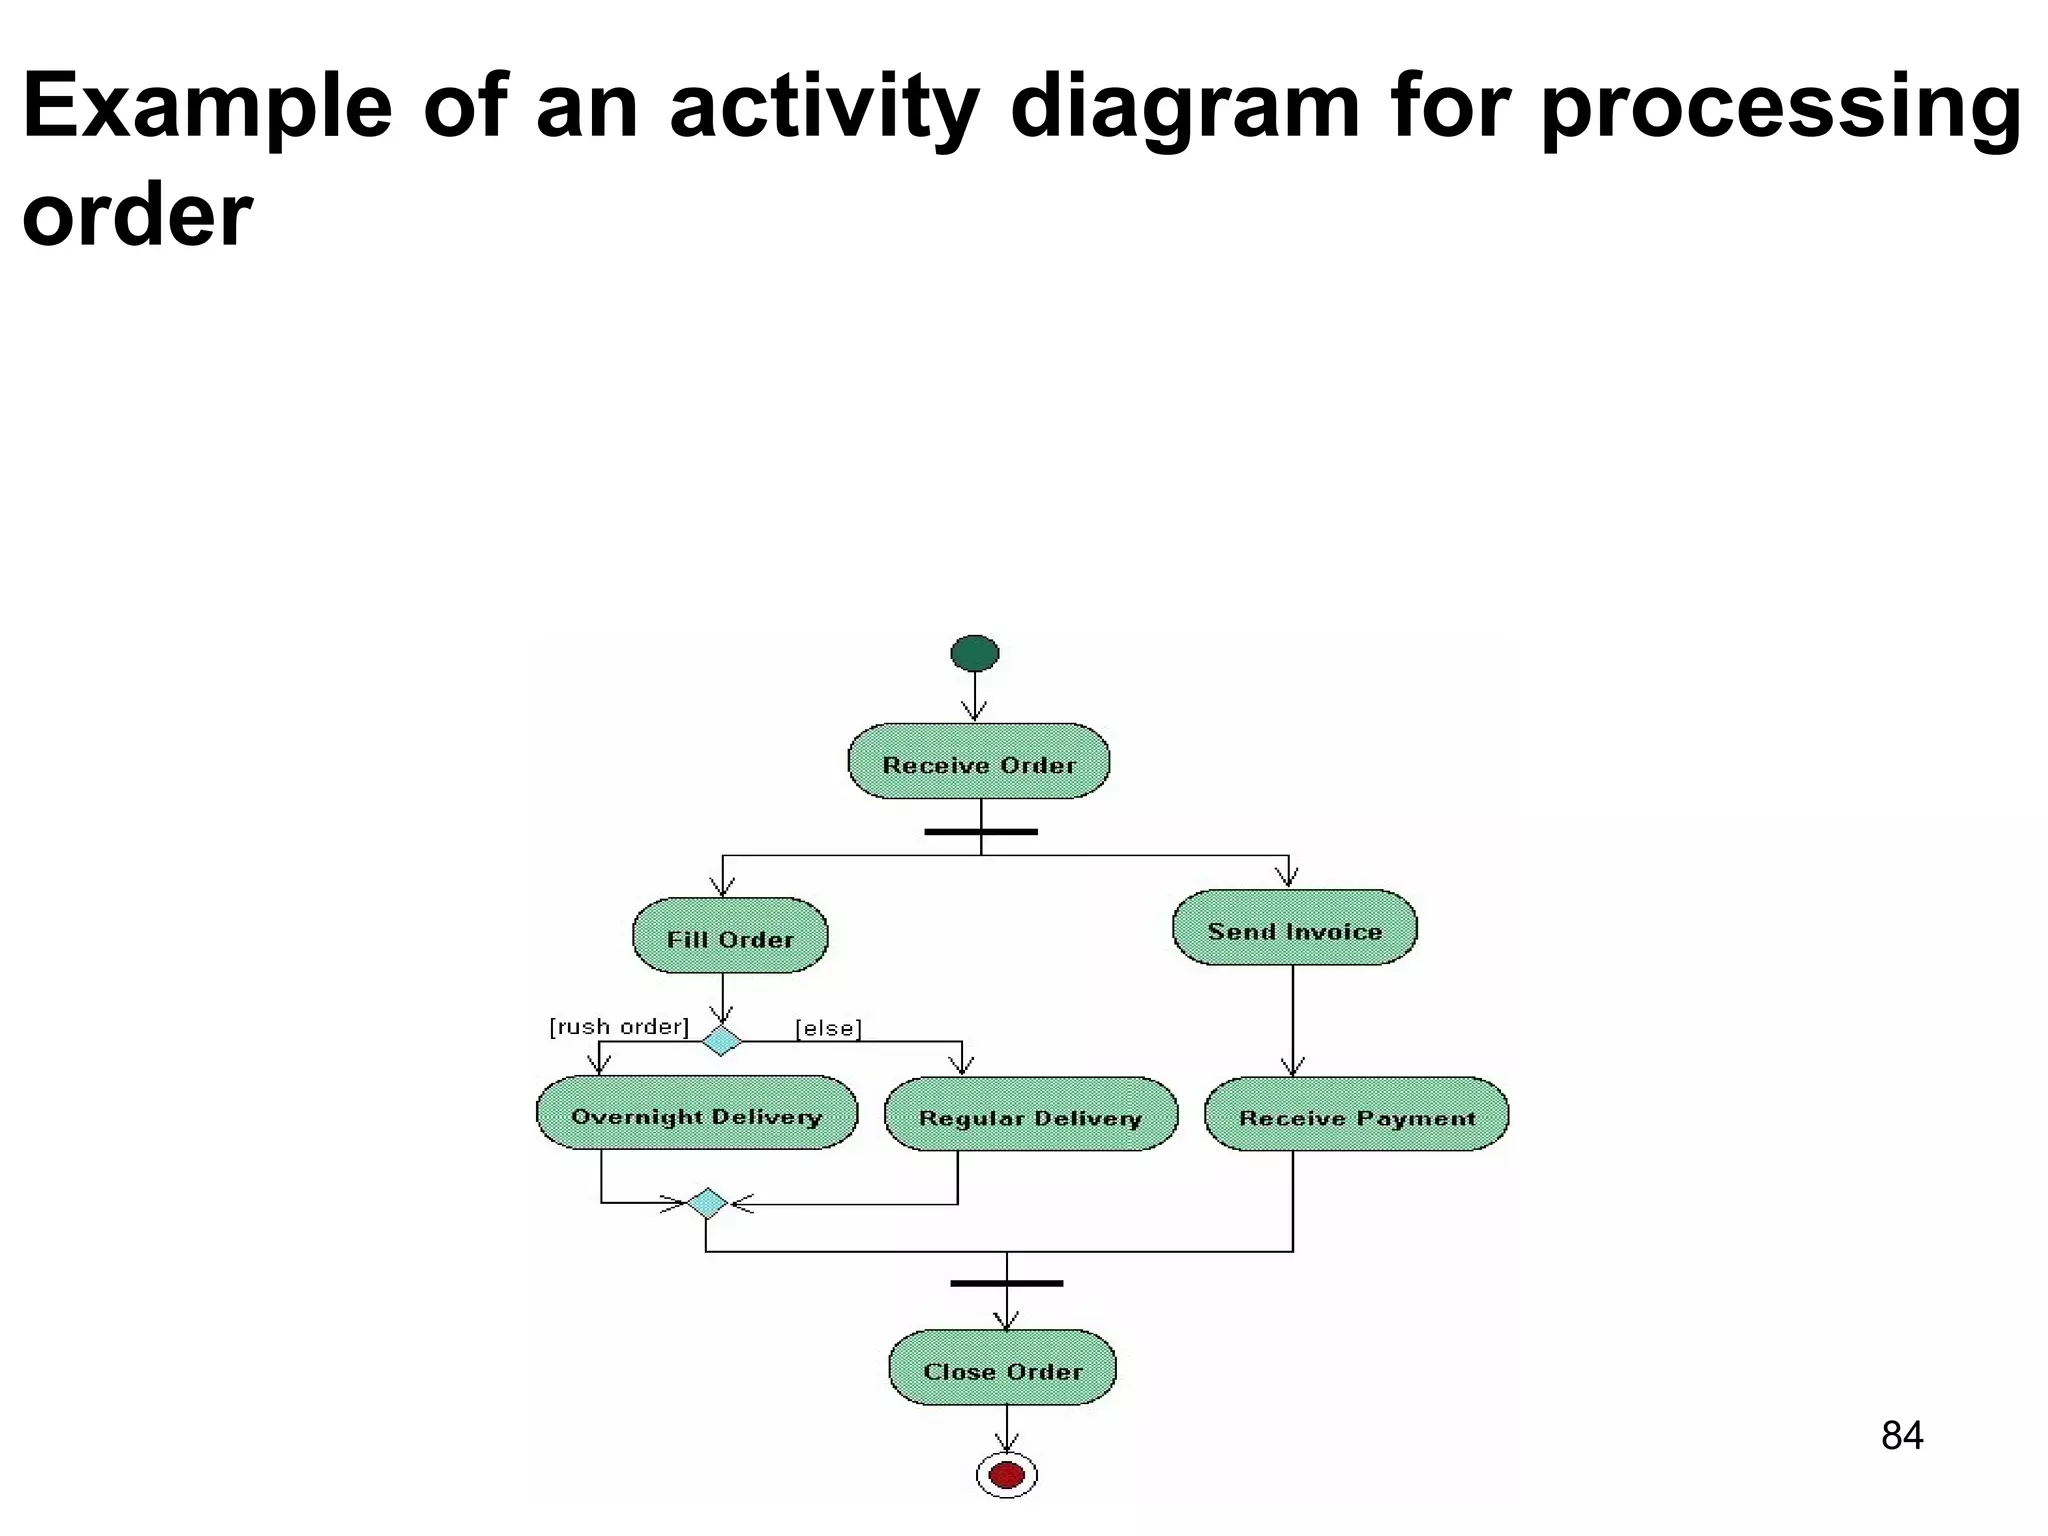
Downloaded 23 times
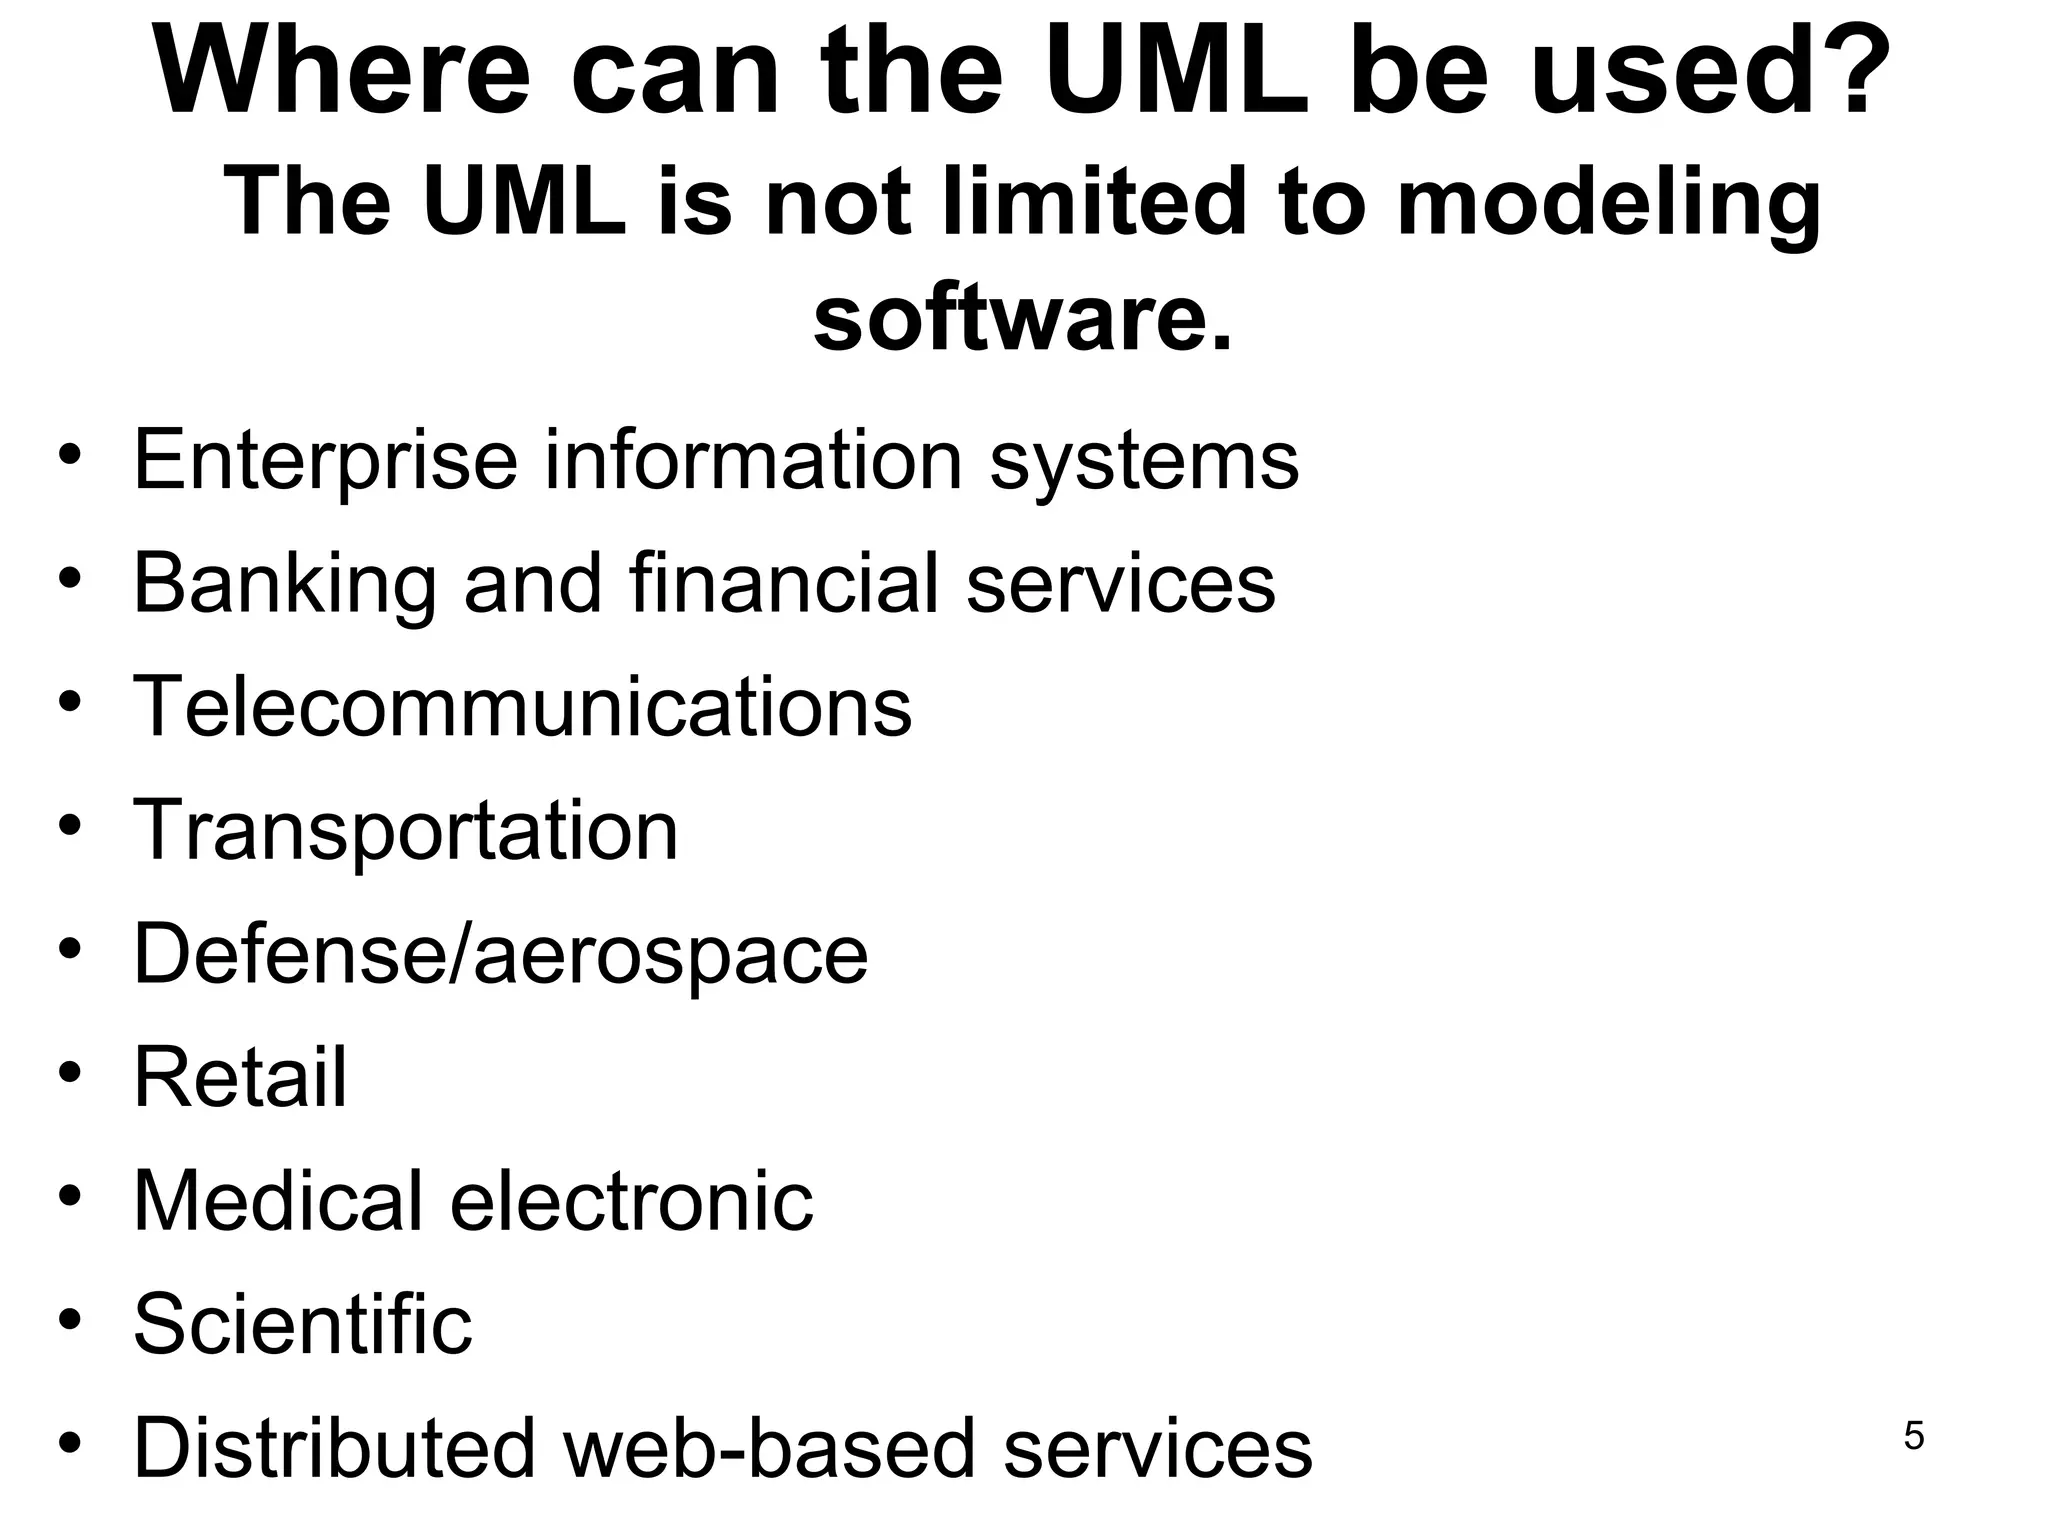
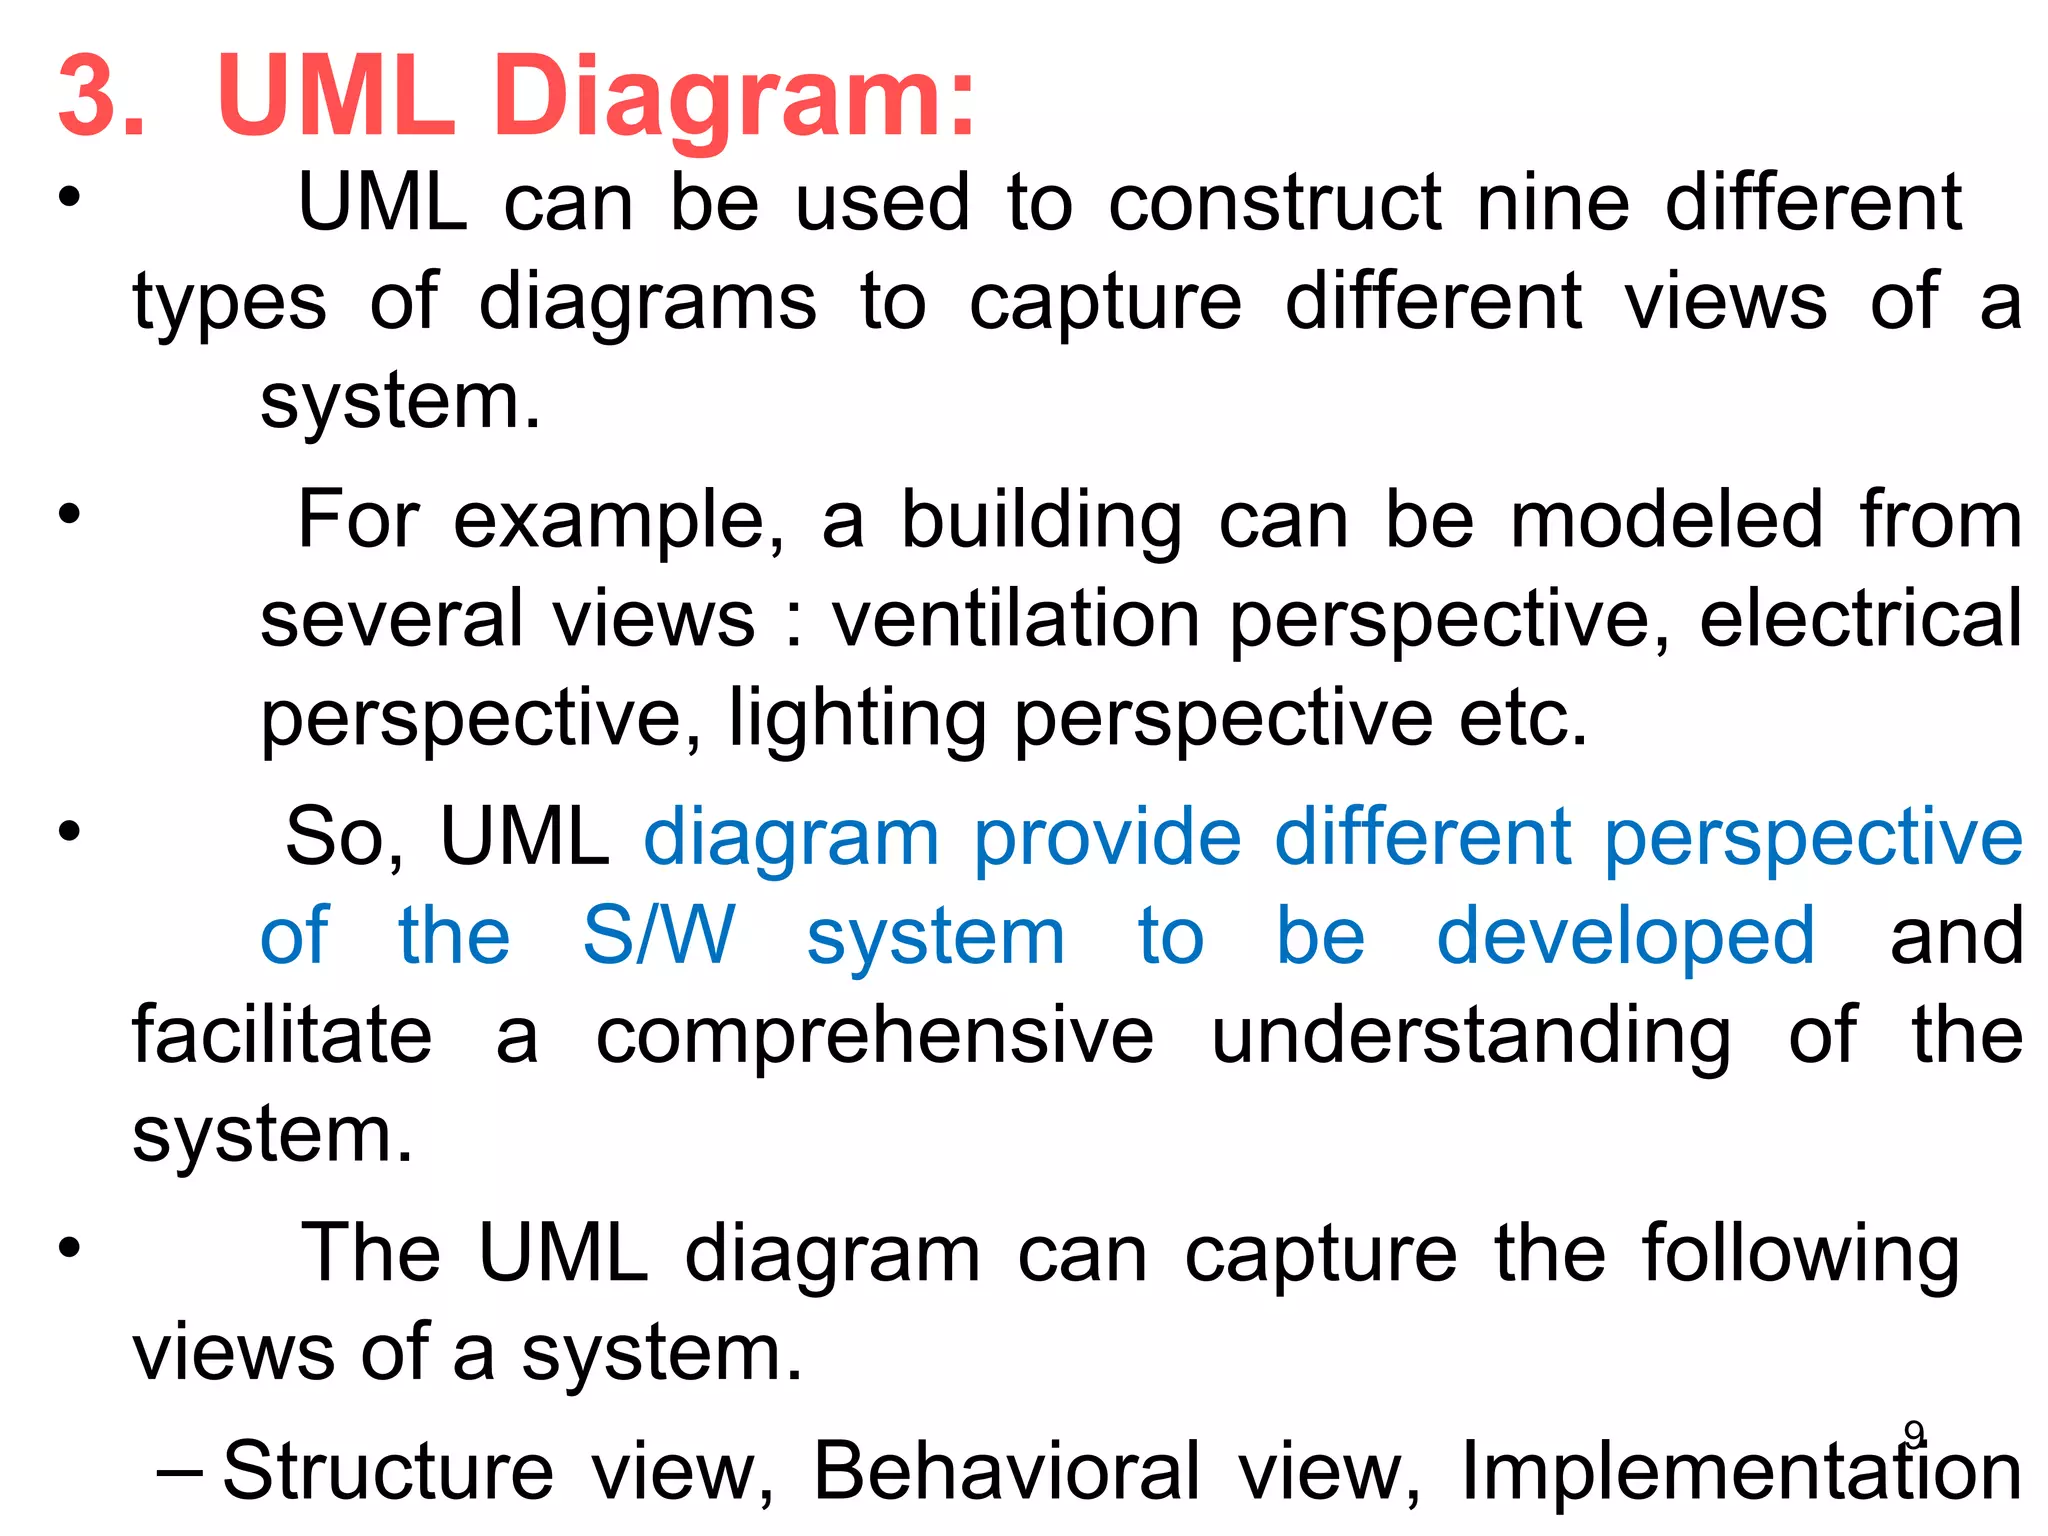
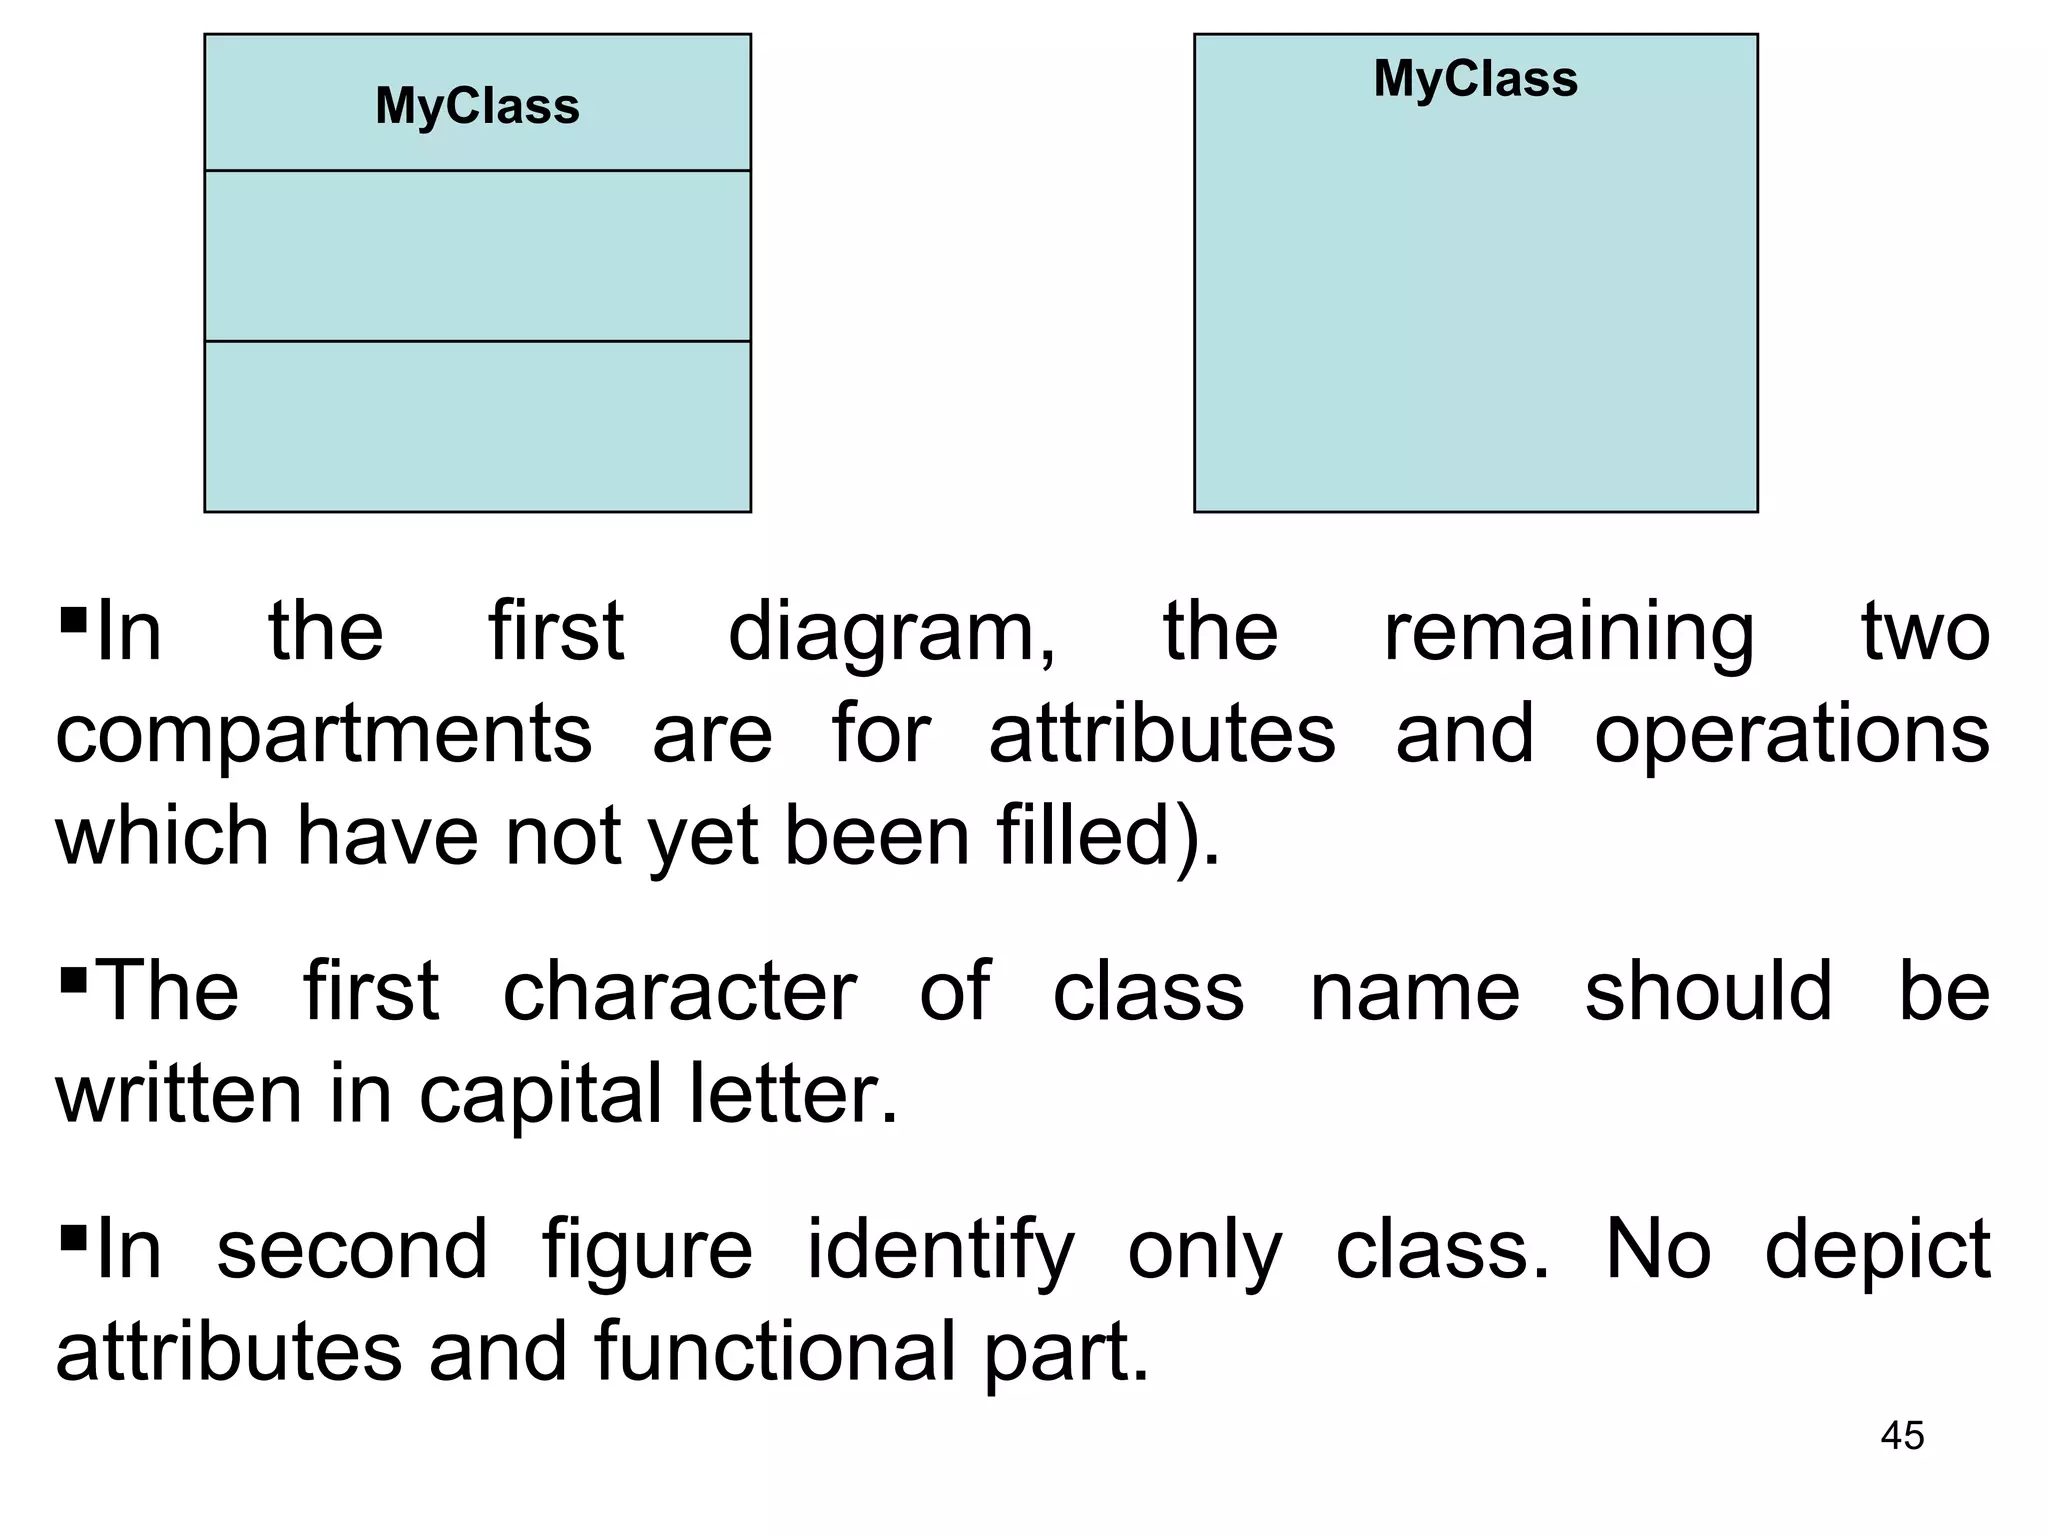
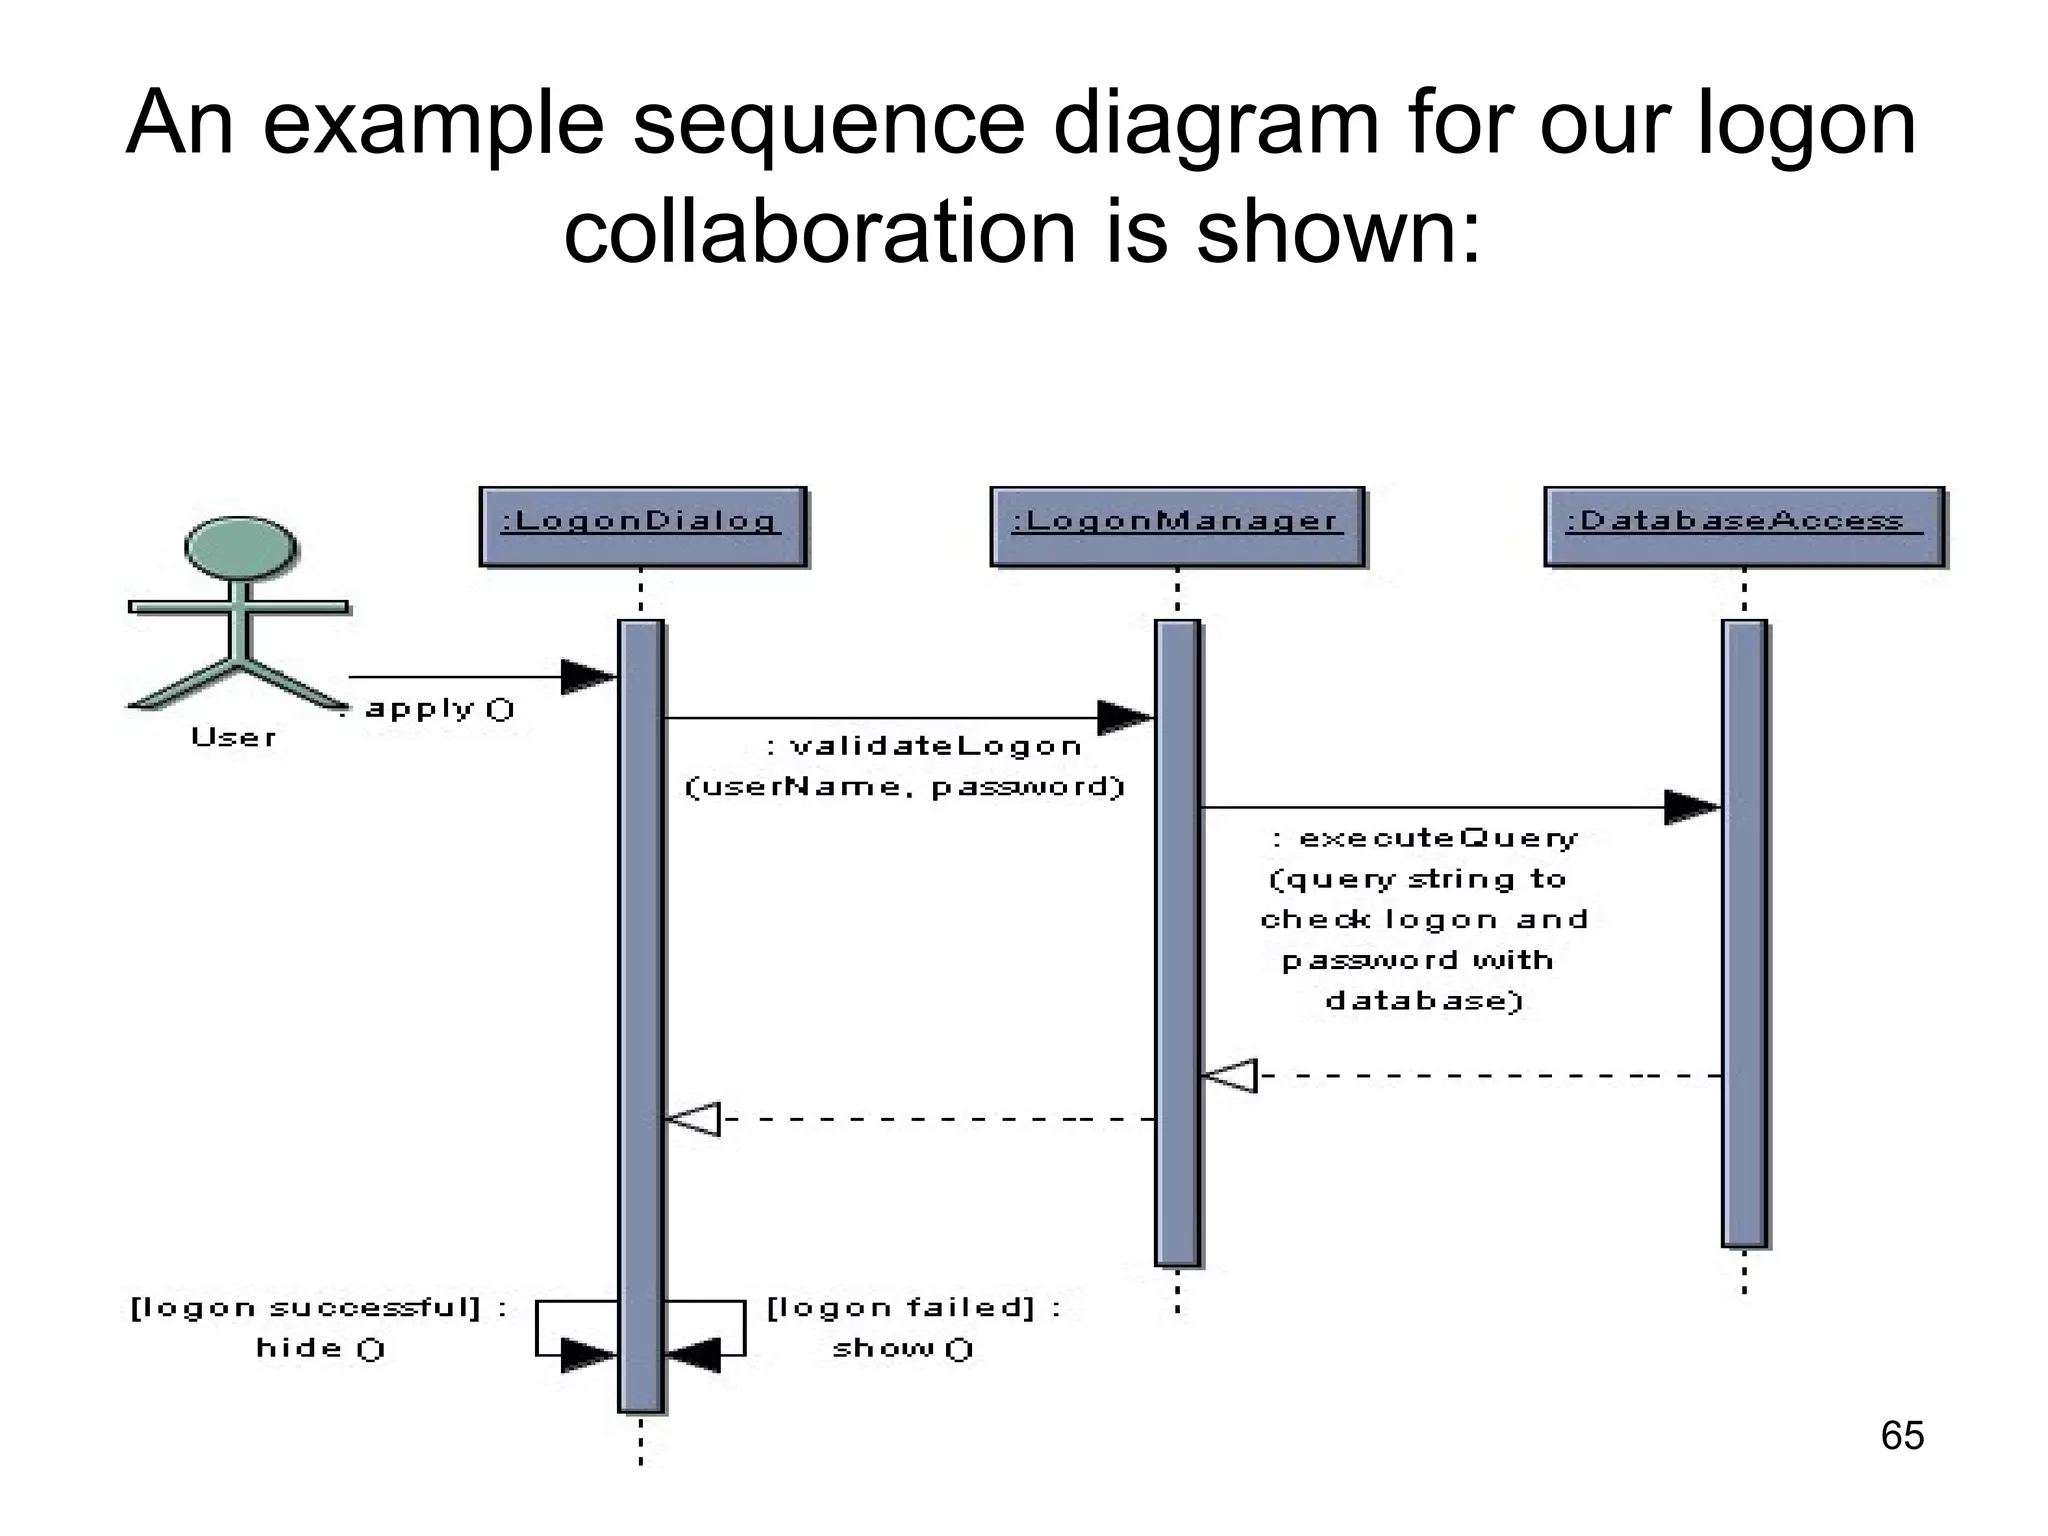
![Things to Note:
•The flow of time is shown from top to bottom, that
is messages higher on the diagram happen before
those lower down
•The blue boxes are instances of the represented
classes, and the vertical bars below are timelines
•The arrows (links) are messages - operation calls
and returns from operations
•The hide and show messages use guards to
determine which to call.
•Guards are always shown in square braces [ ] and
represent constraints on the message (the
message is sent only if the constraint is satisfied)
66](https://image.slidesharecdn.com/chapter00analysisanddesignwithuml-170410035329/75/analysis-and-design-with-uml-66-2048.jpg)
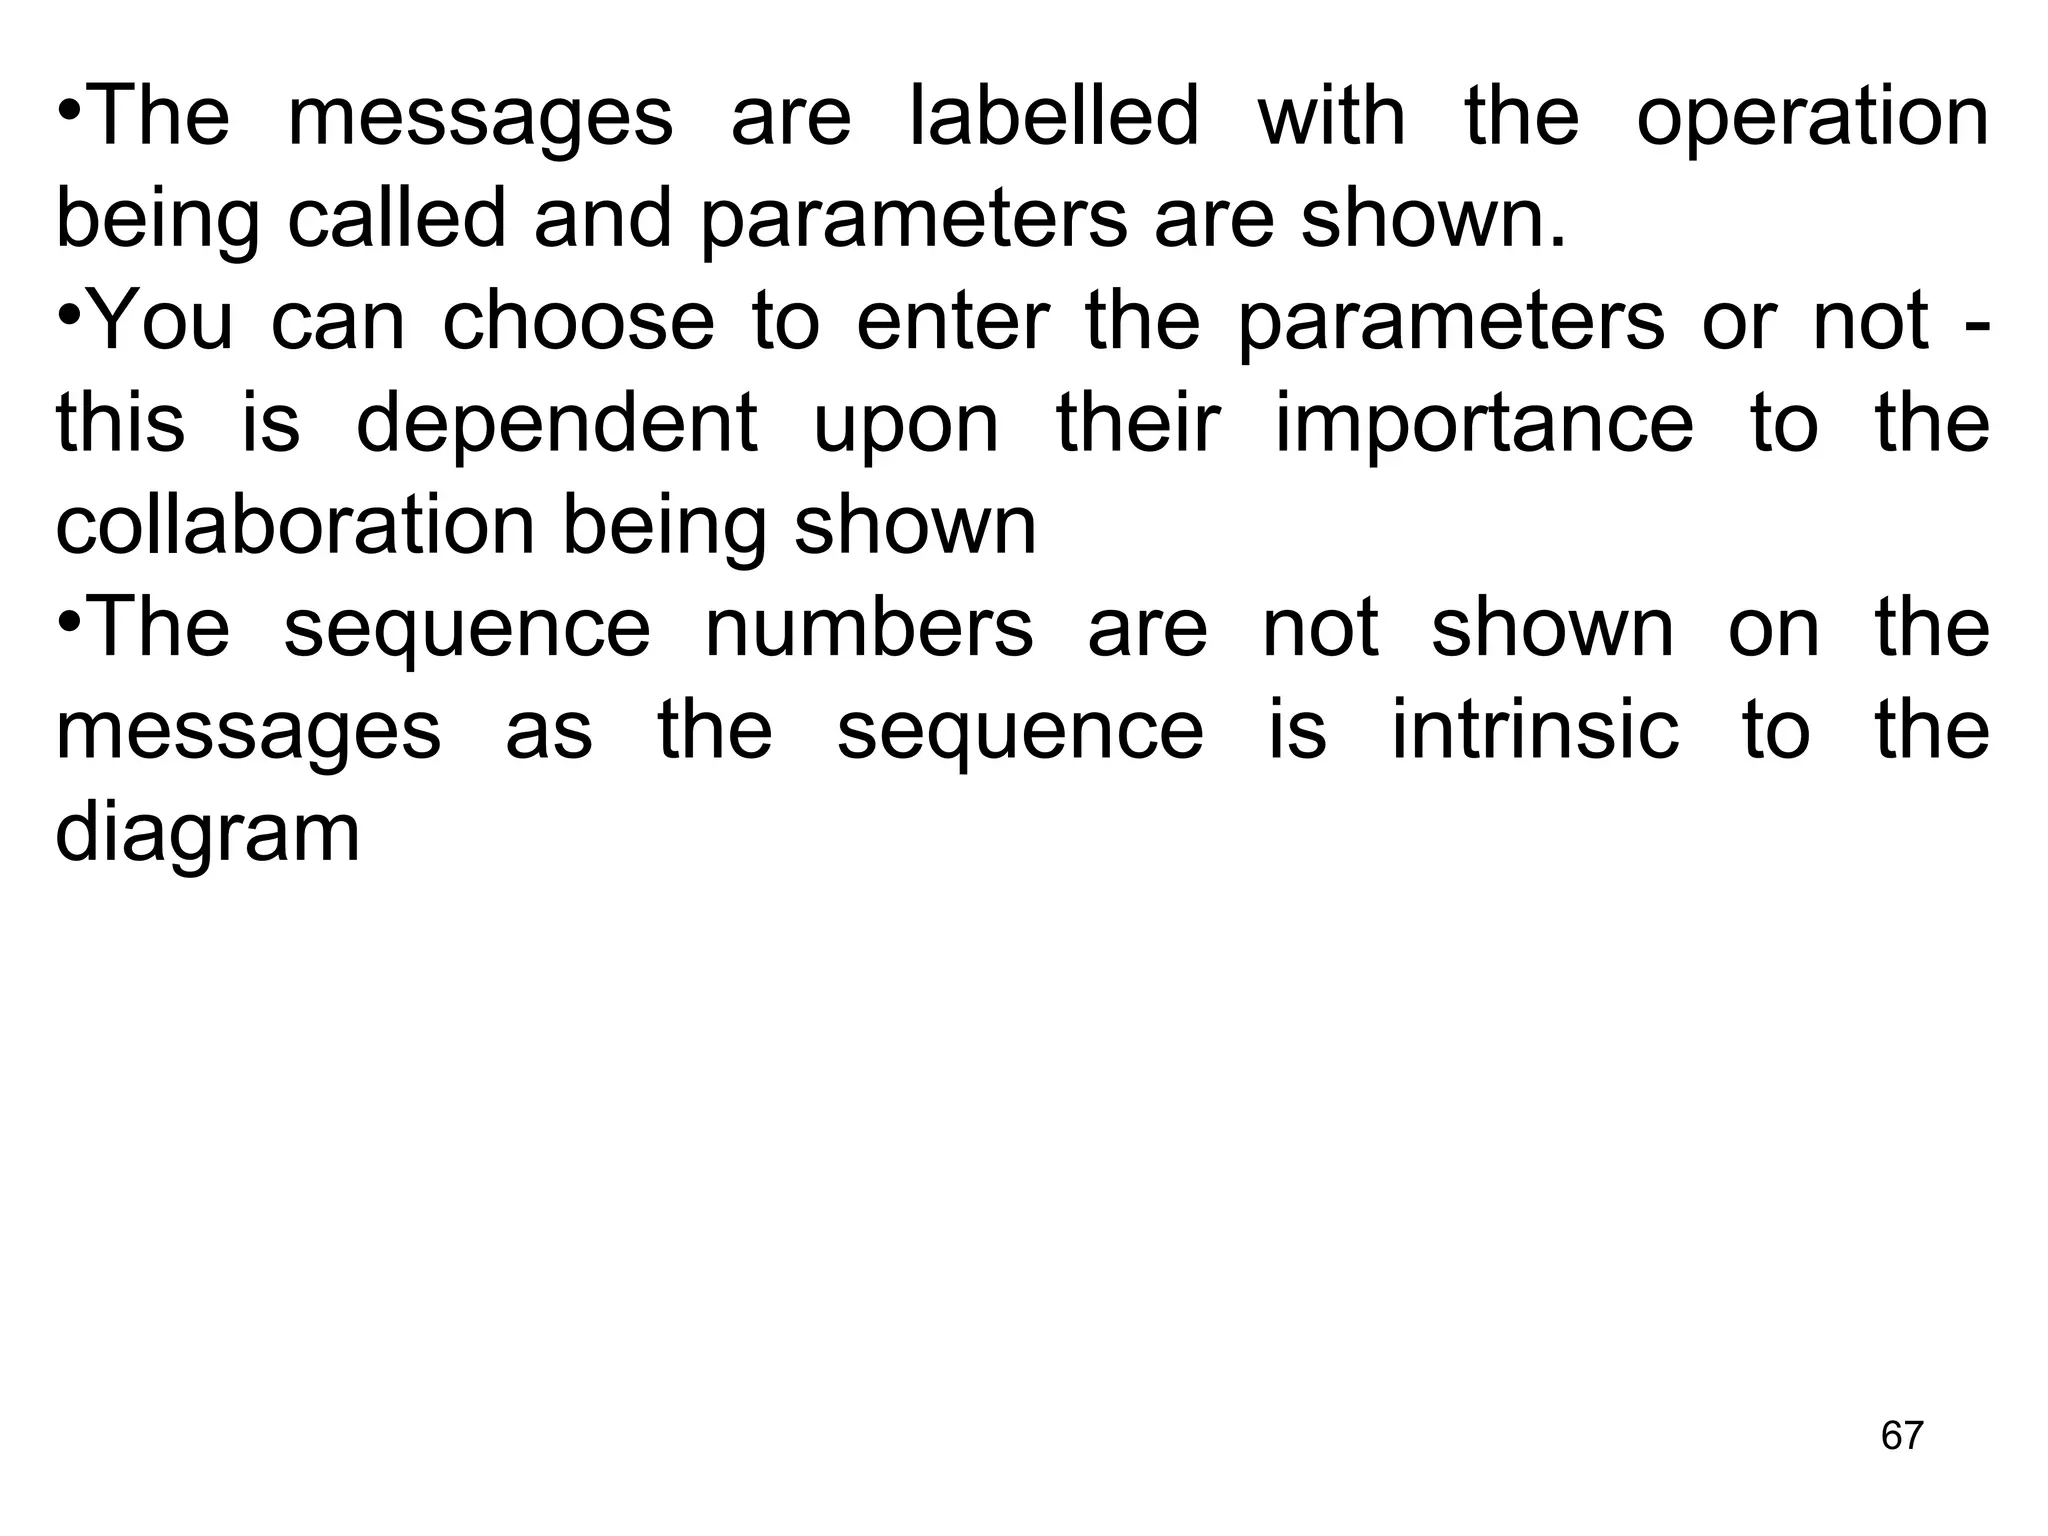
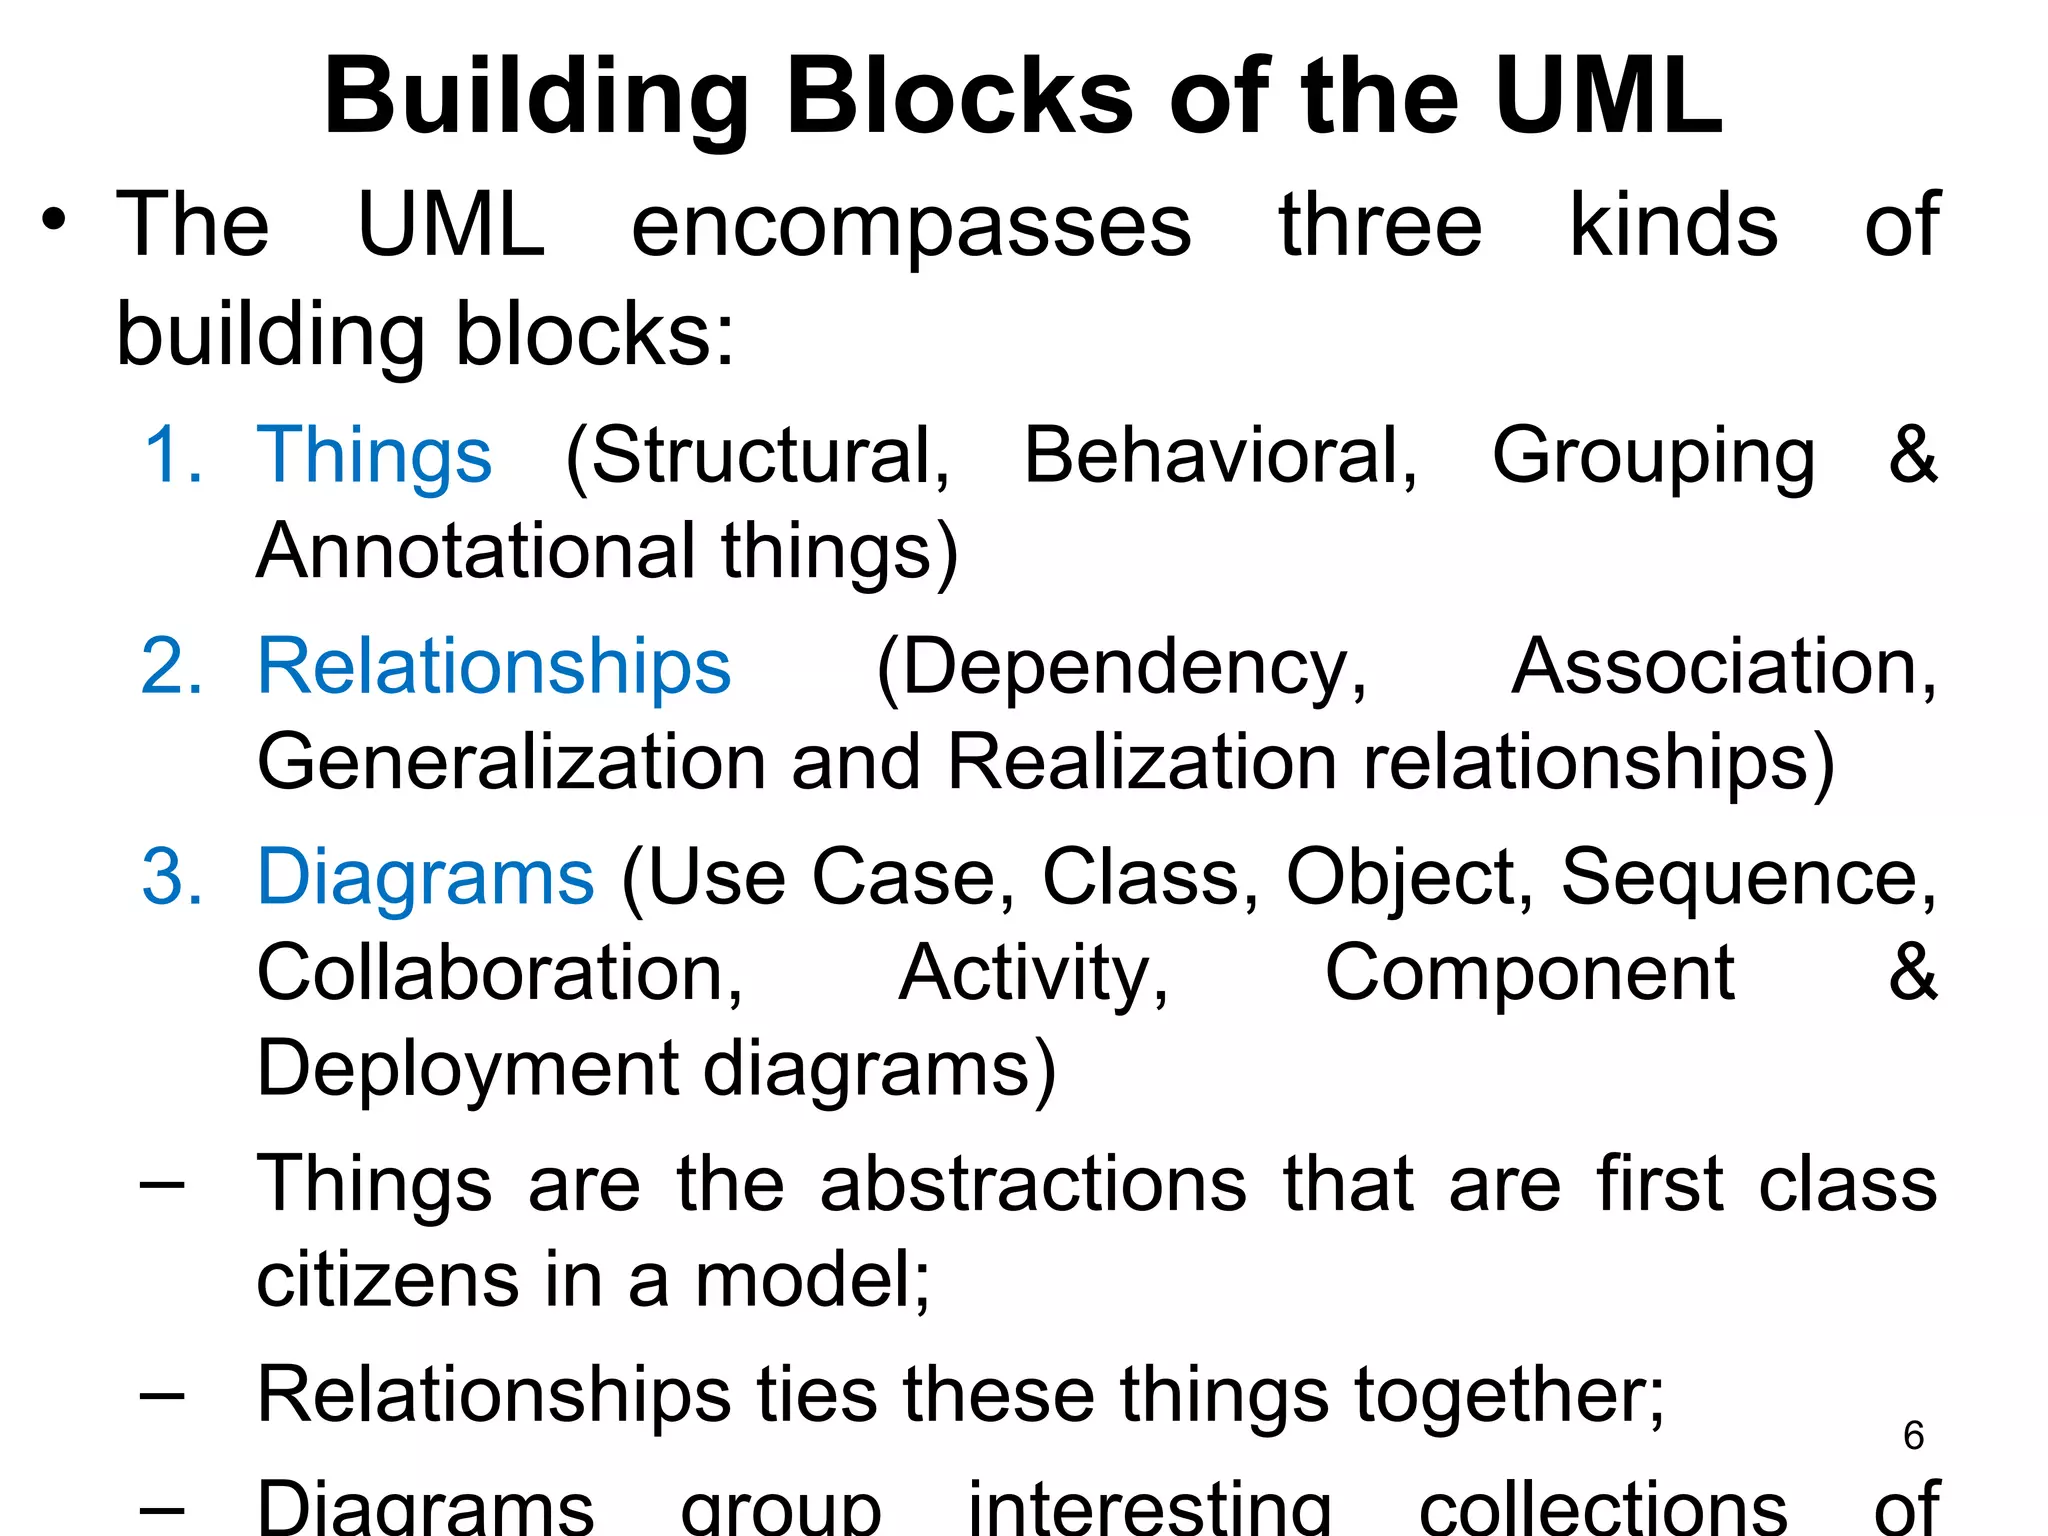
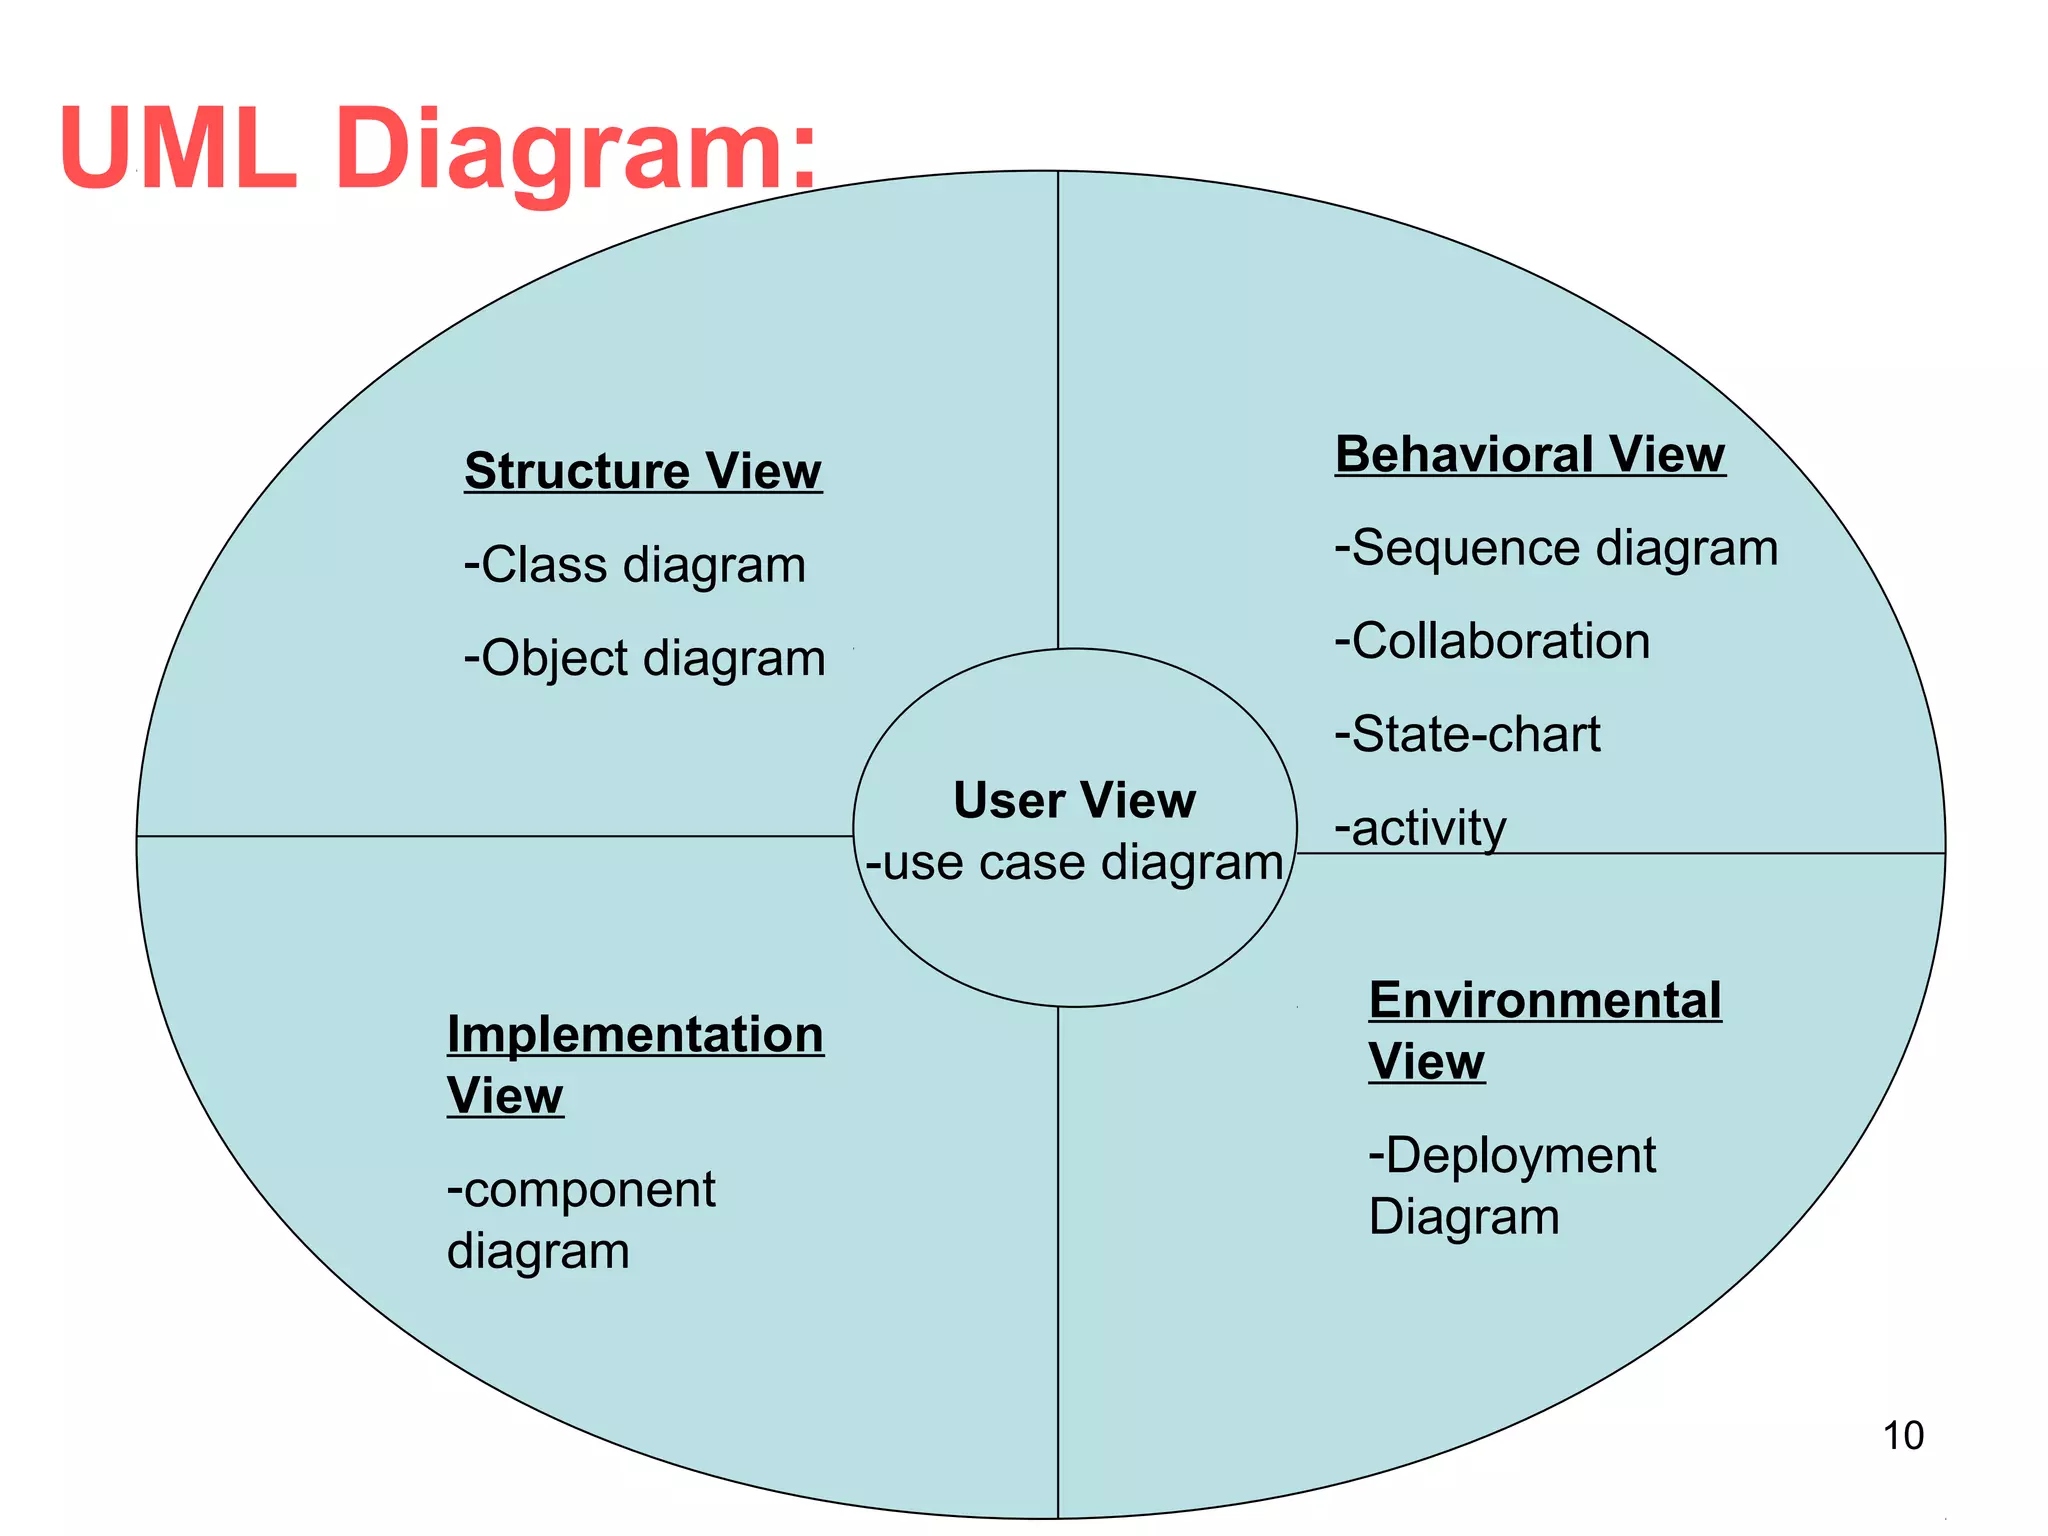
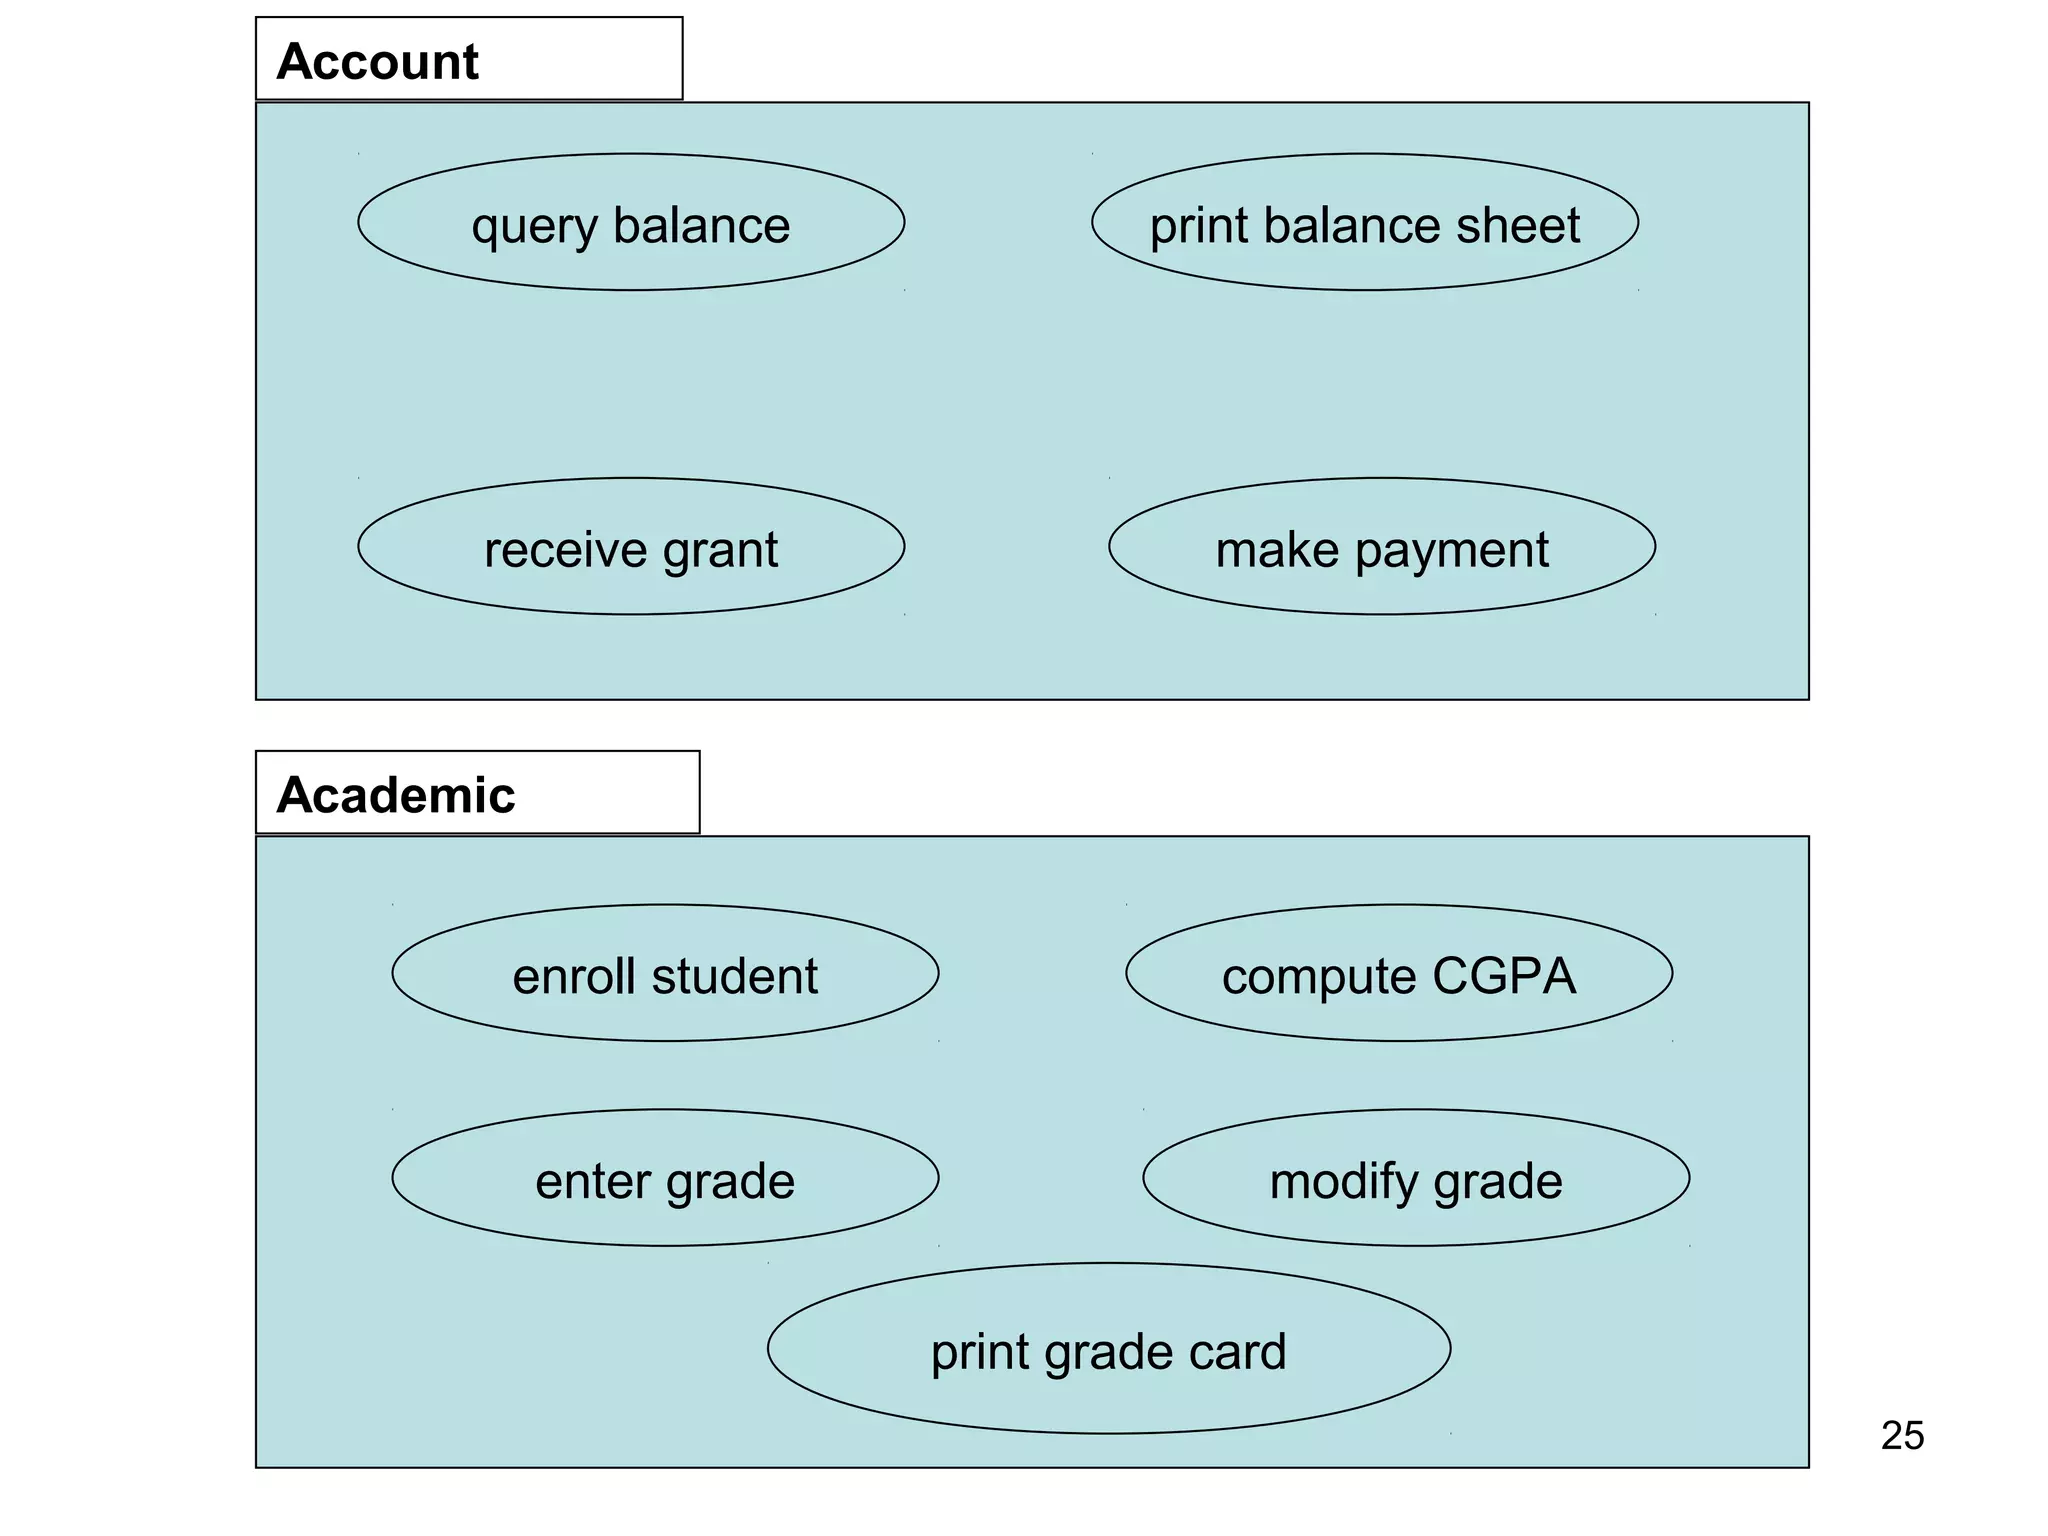
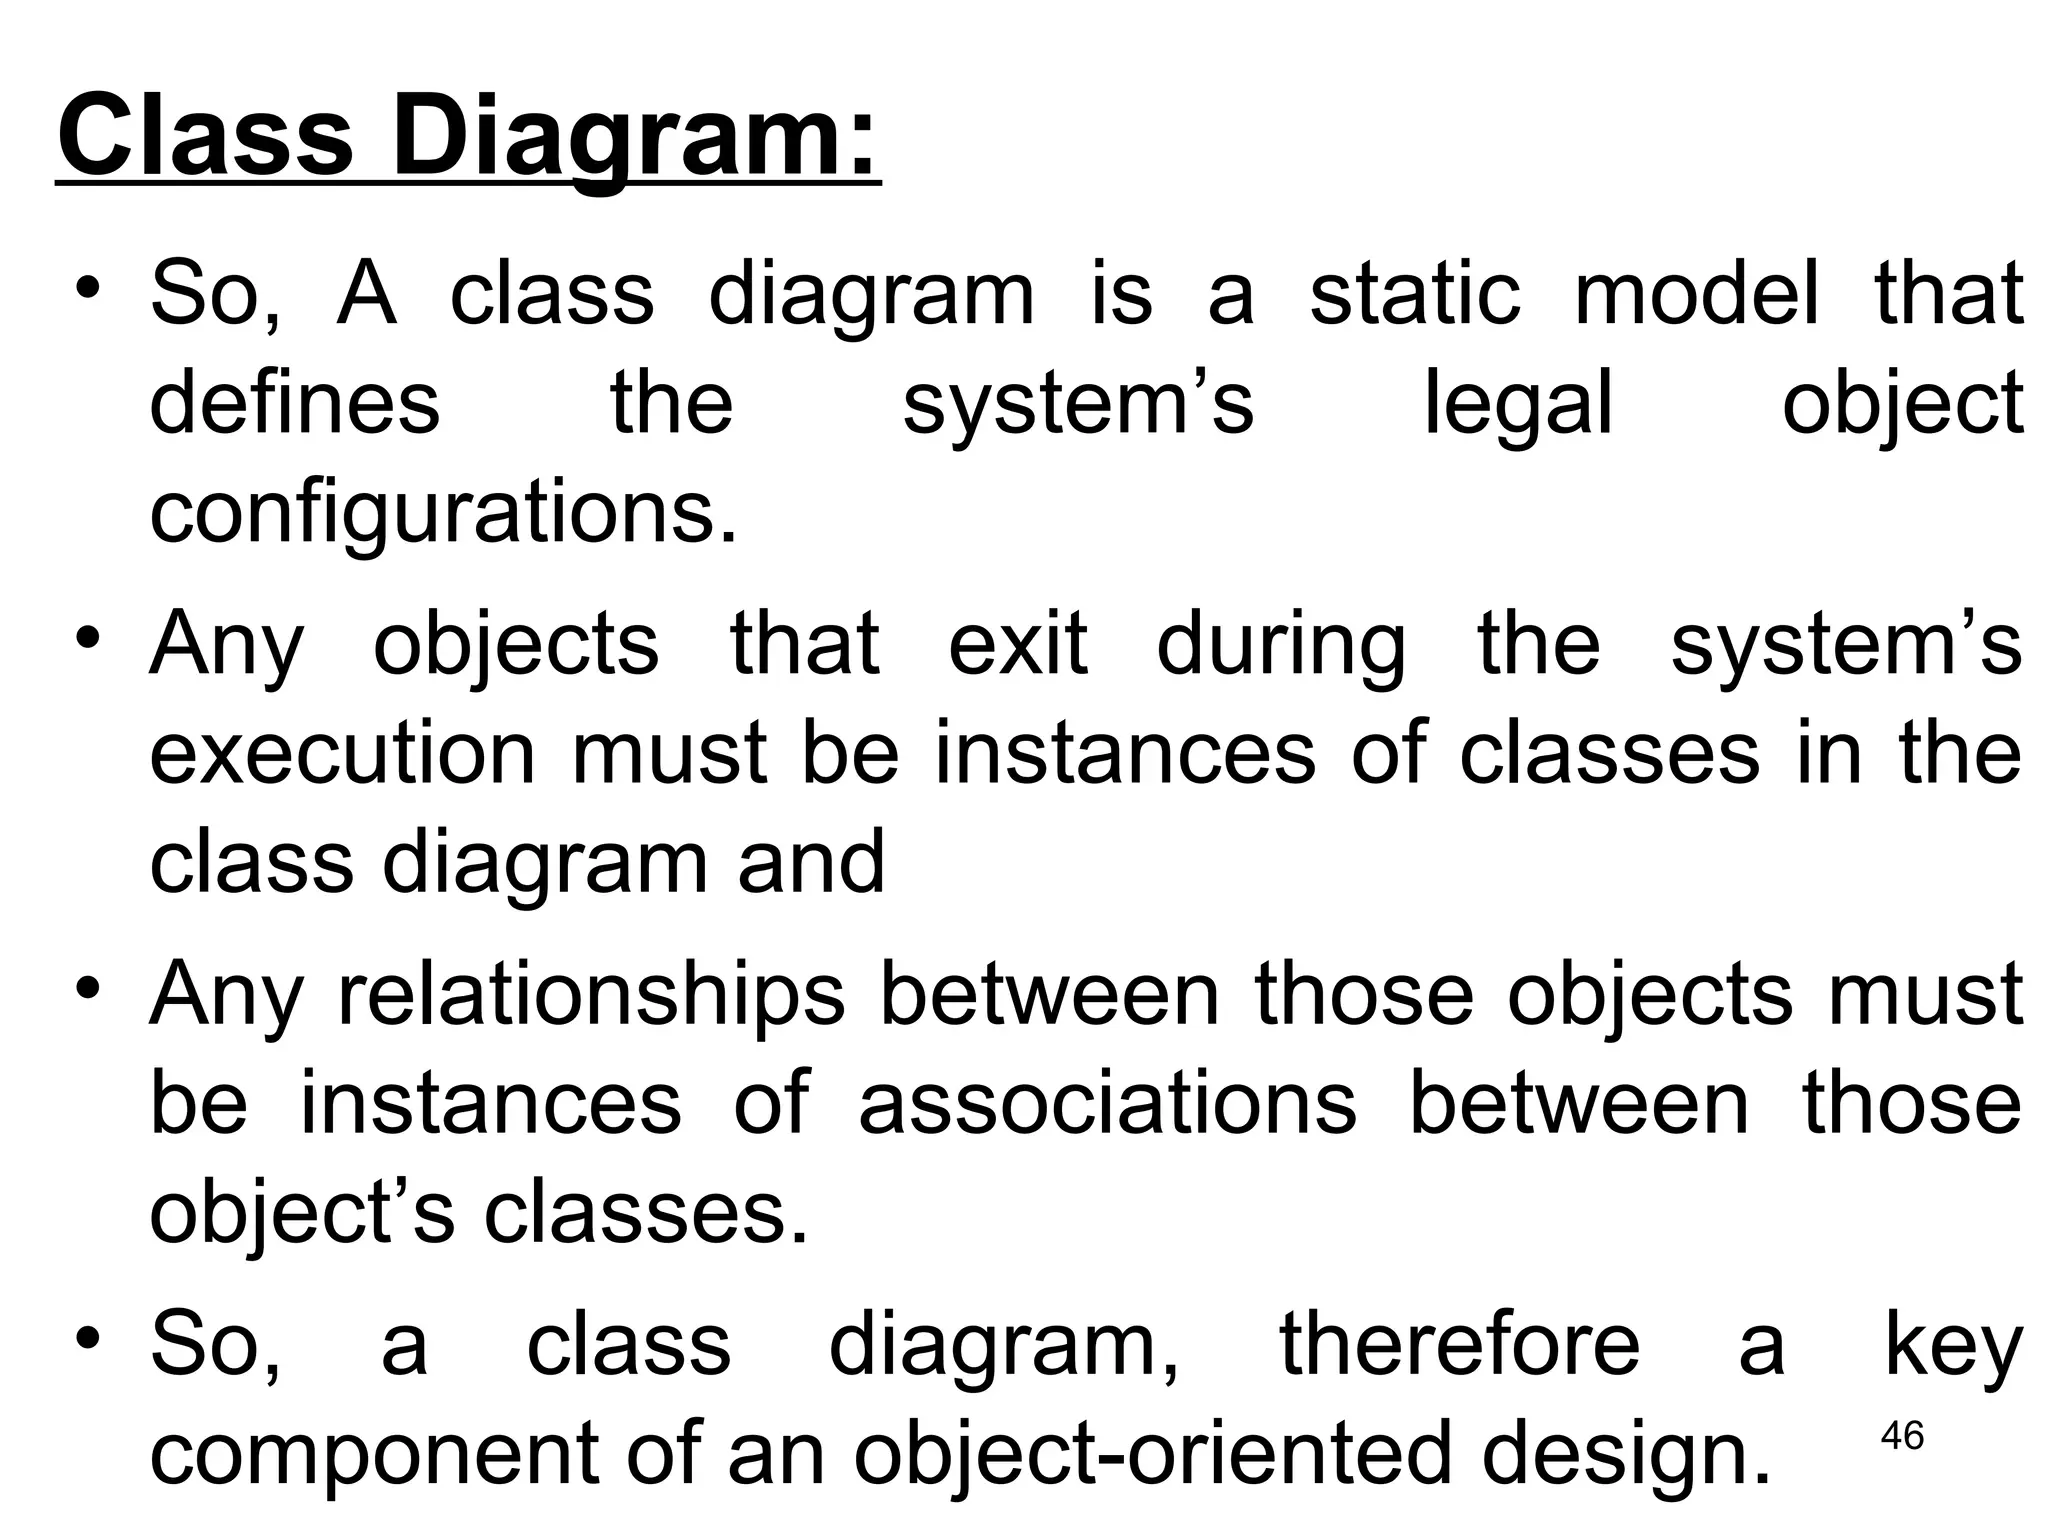
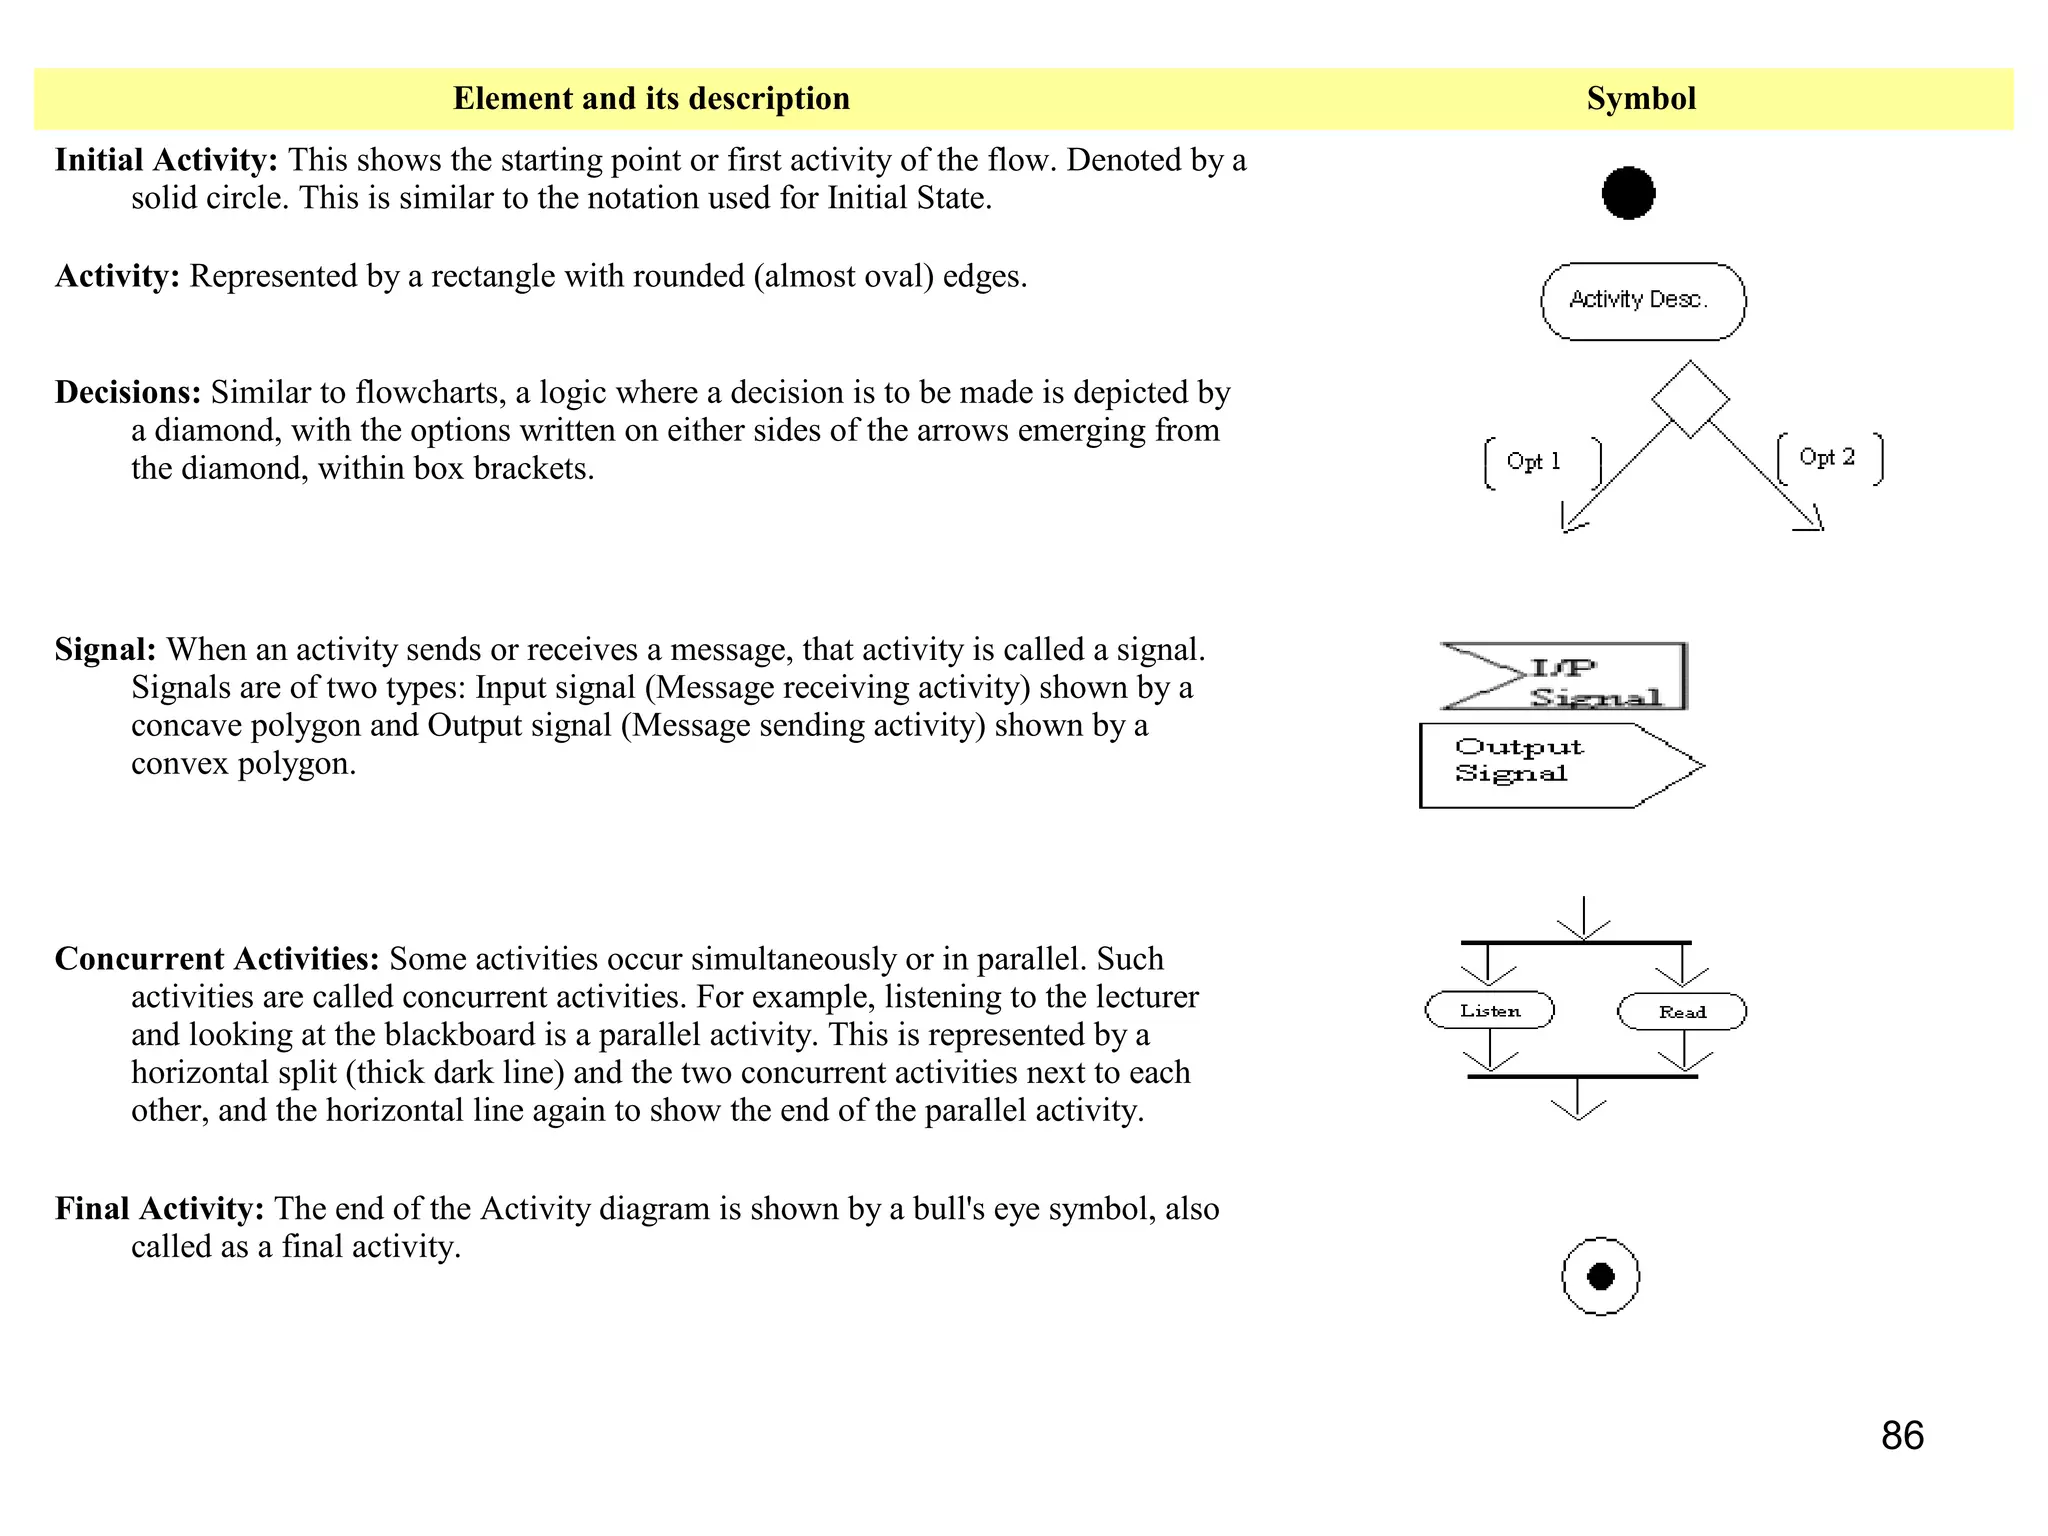
![• Each message is labeled with the message name.
• Some control information can also be included.
– A condition (e.g. [invalid]) indicate that a message is sent,
only if the condition is true.
– An iteration marker(*) shows that the message is sent
many time to multiple receiver objects, as would happen
when you are iterating over a collection or the elements of
an array. (for every book object).
Library
book issue
control
library book
register
library book library member
issued book Find member borrowing
Display member borrowing
select book book selected
issued bookissued book
find *
[invalid]
70](https://image.slidesharecdn.com/chapter00analysisanddesignwithuml-170410035329/75/analysis-and-design-with-uml-70-2048.jpg)
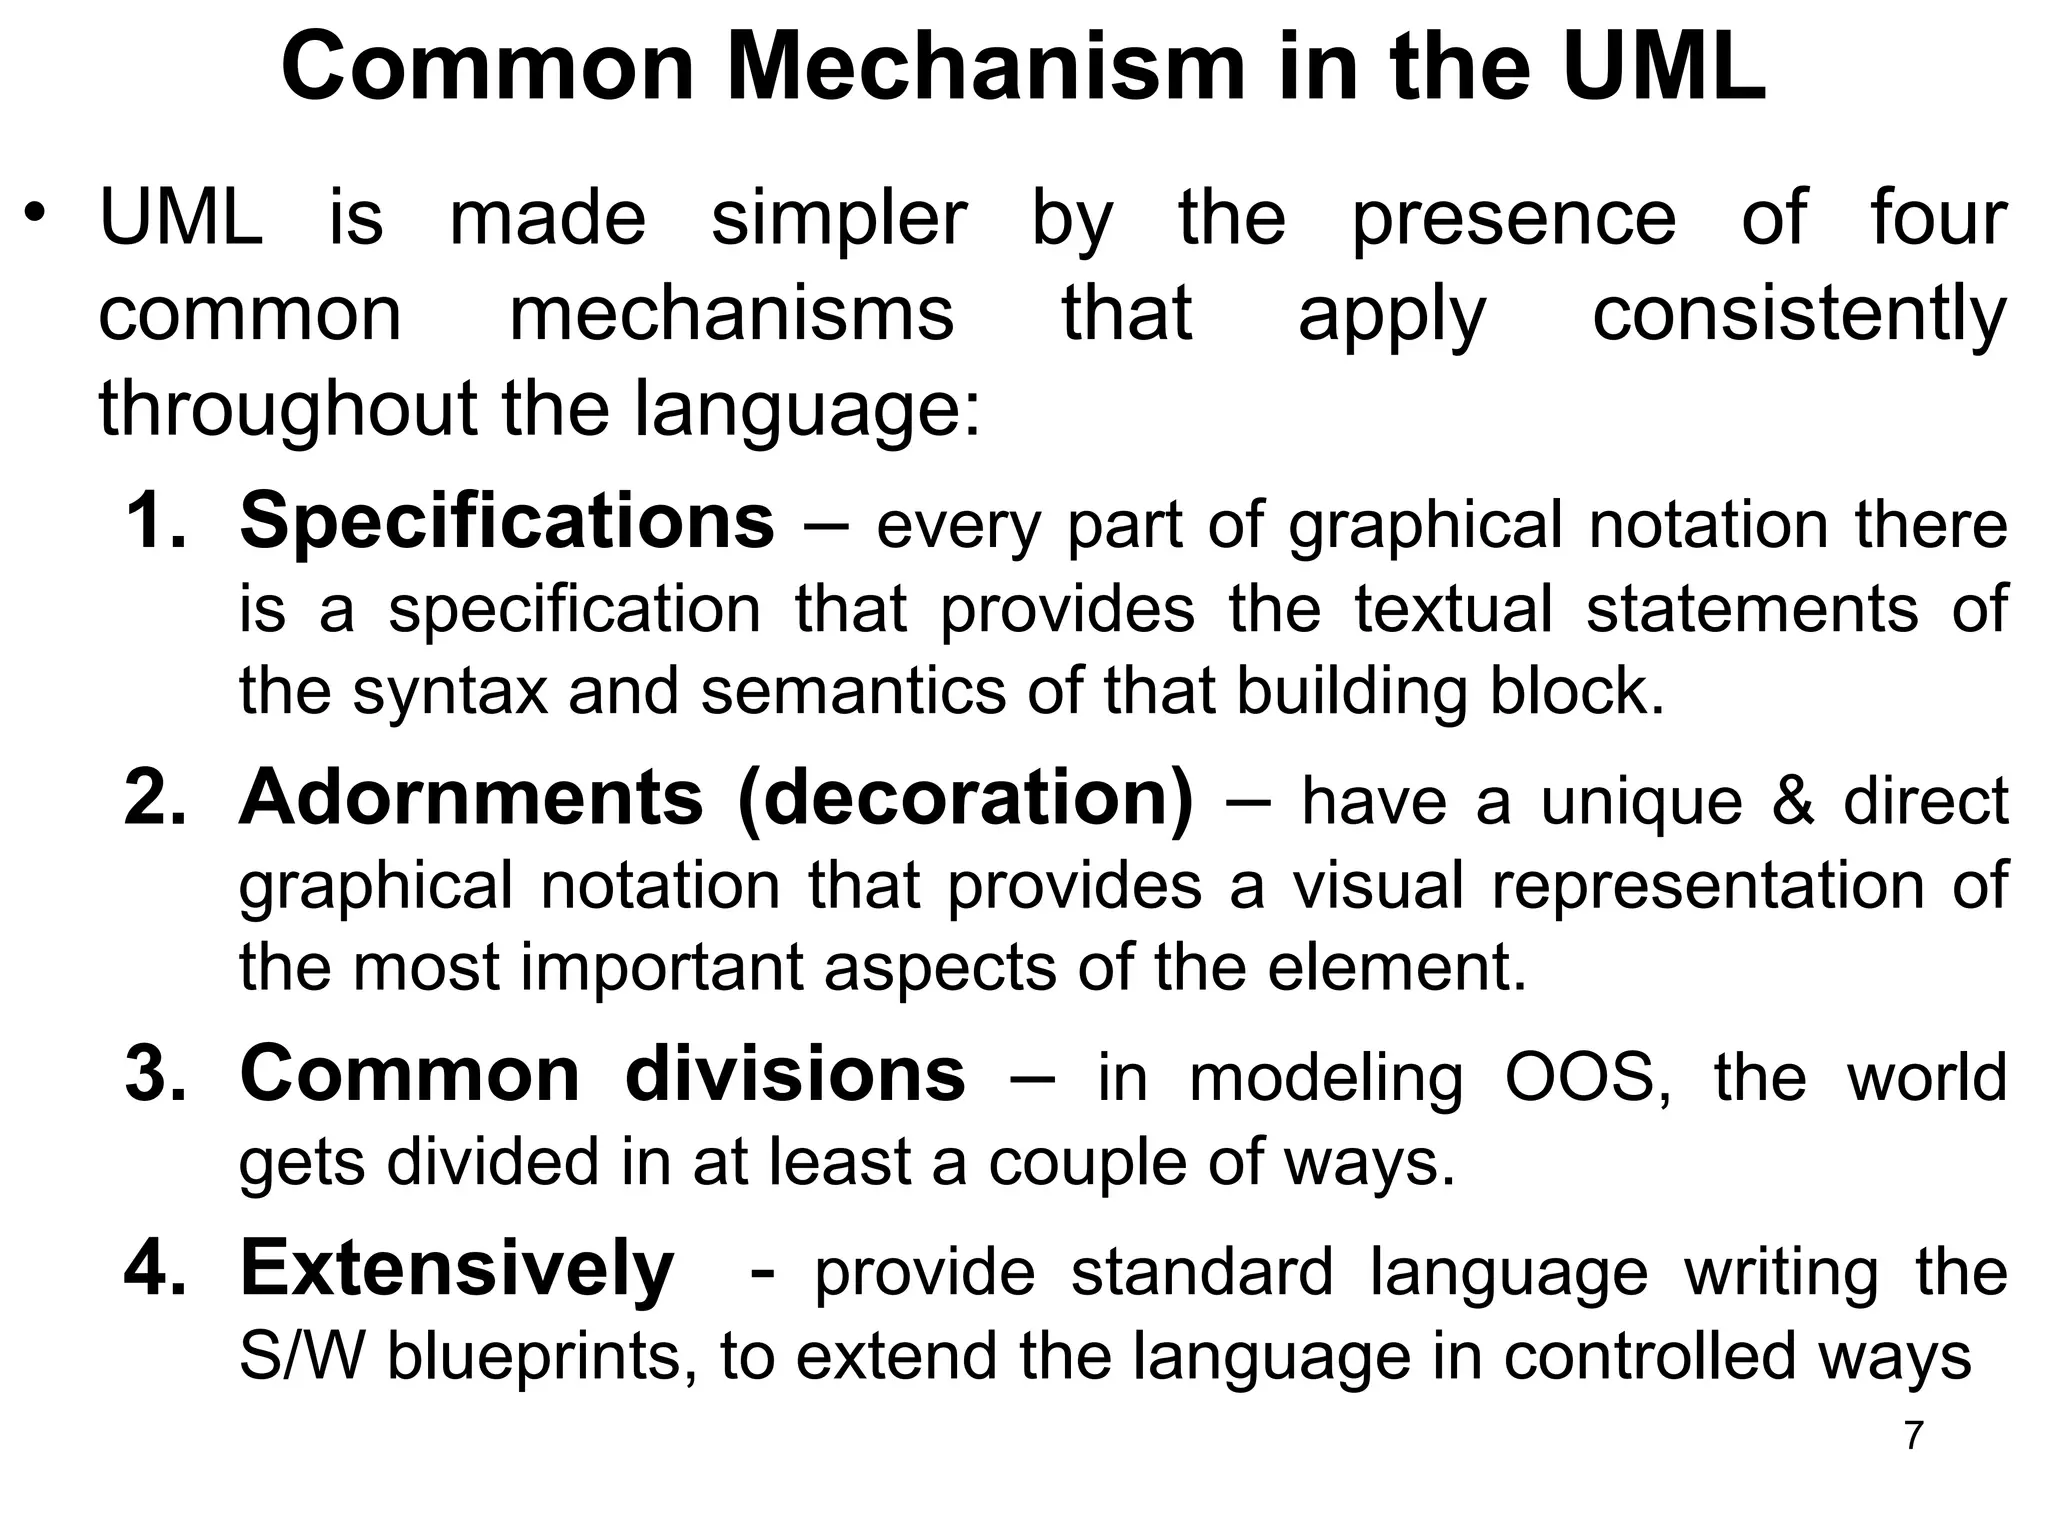
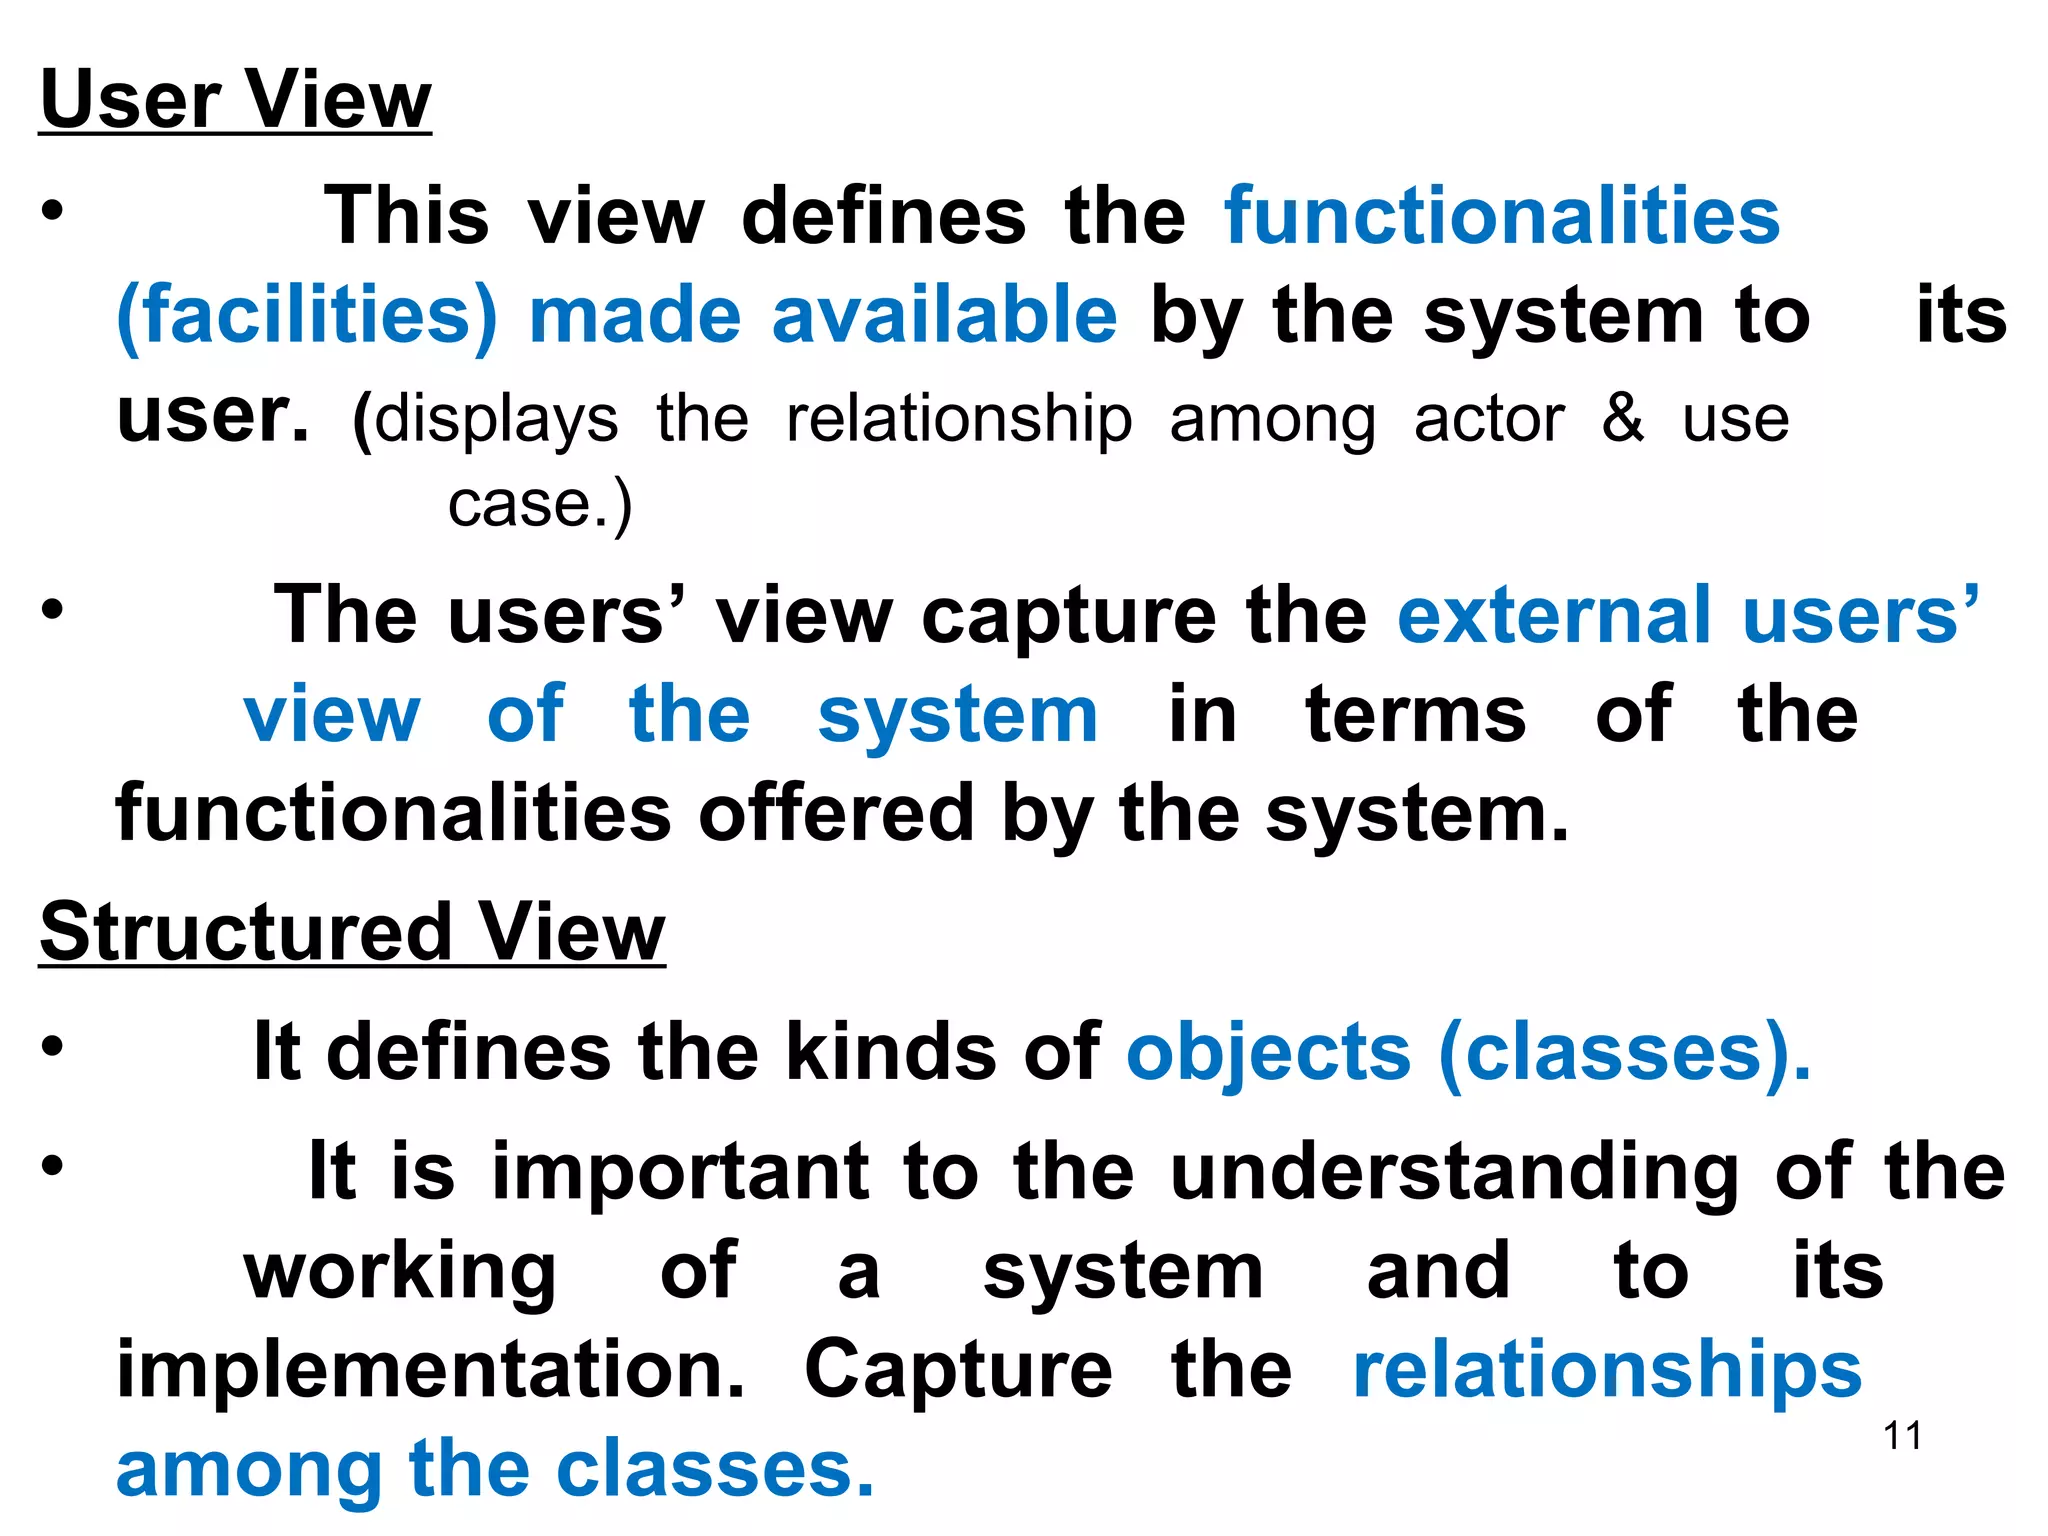
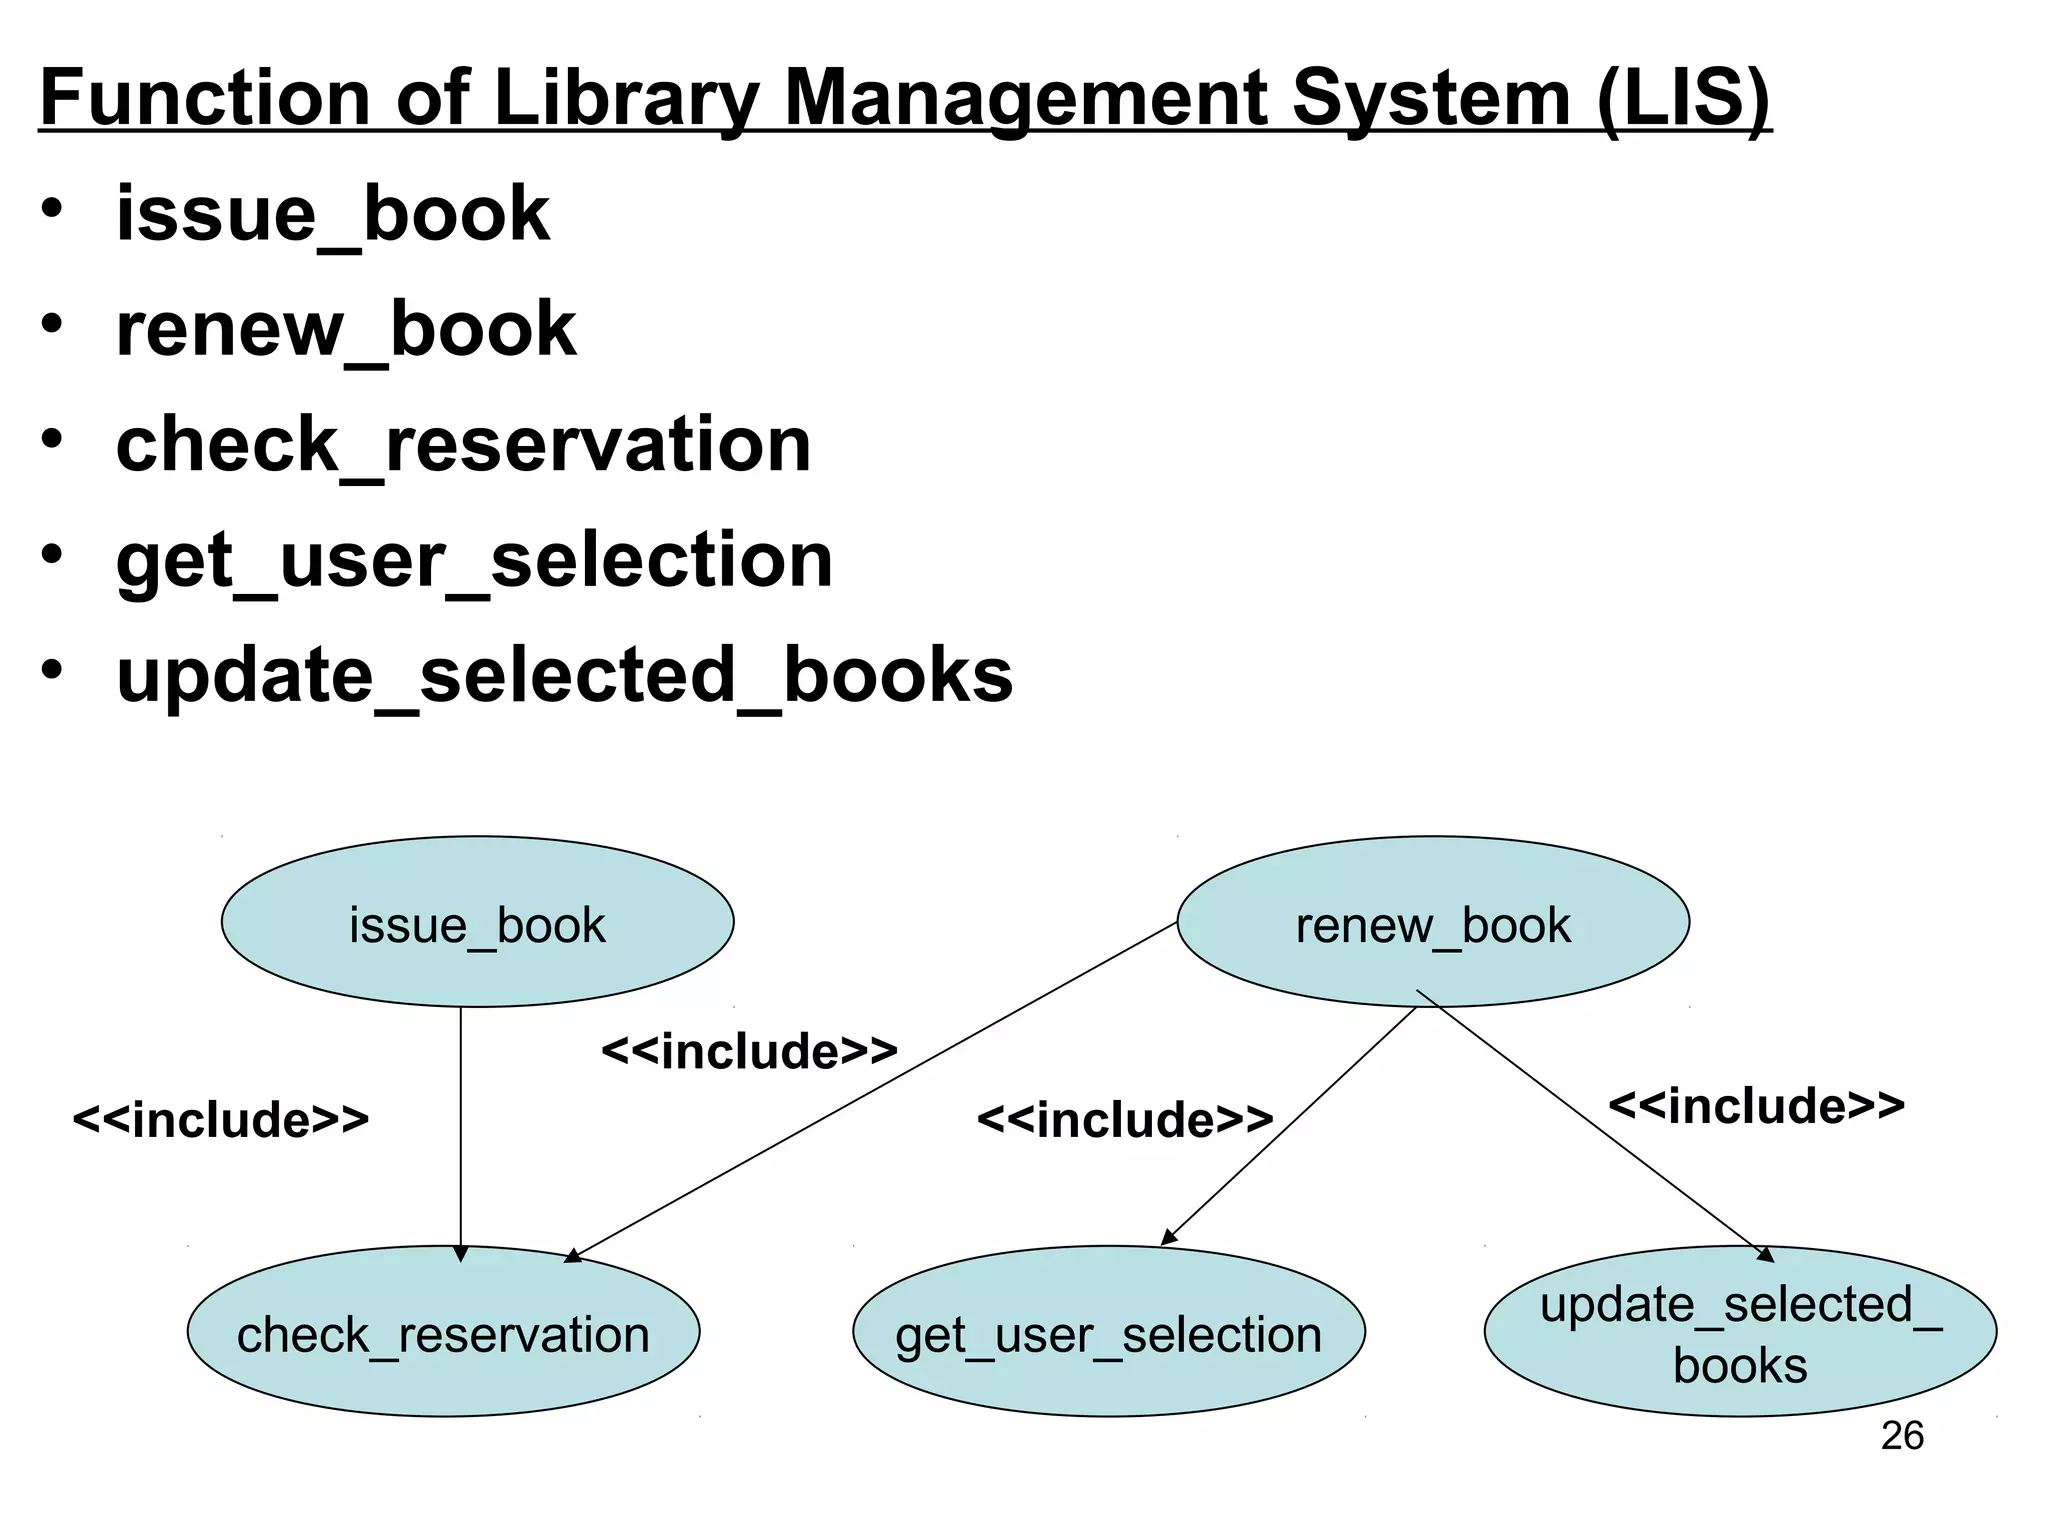
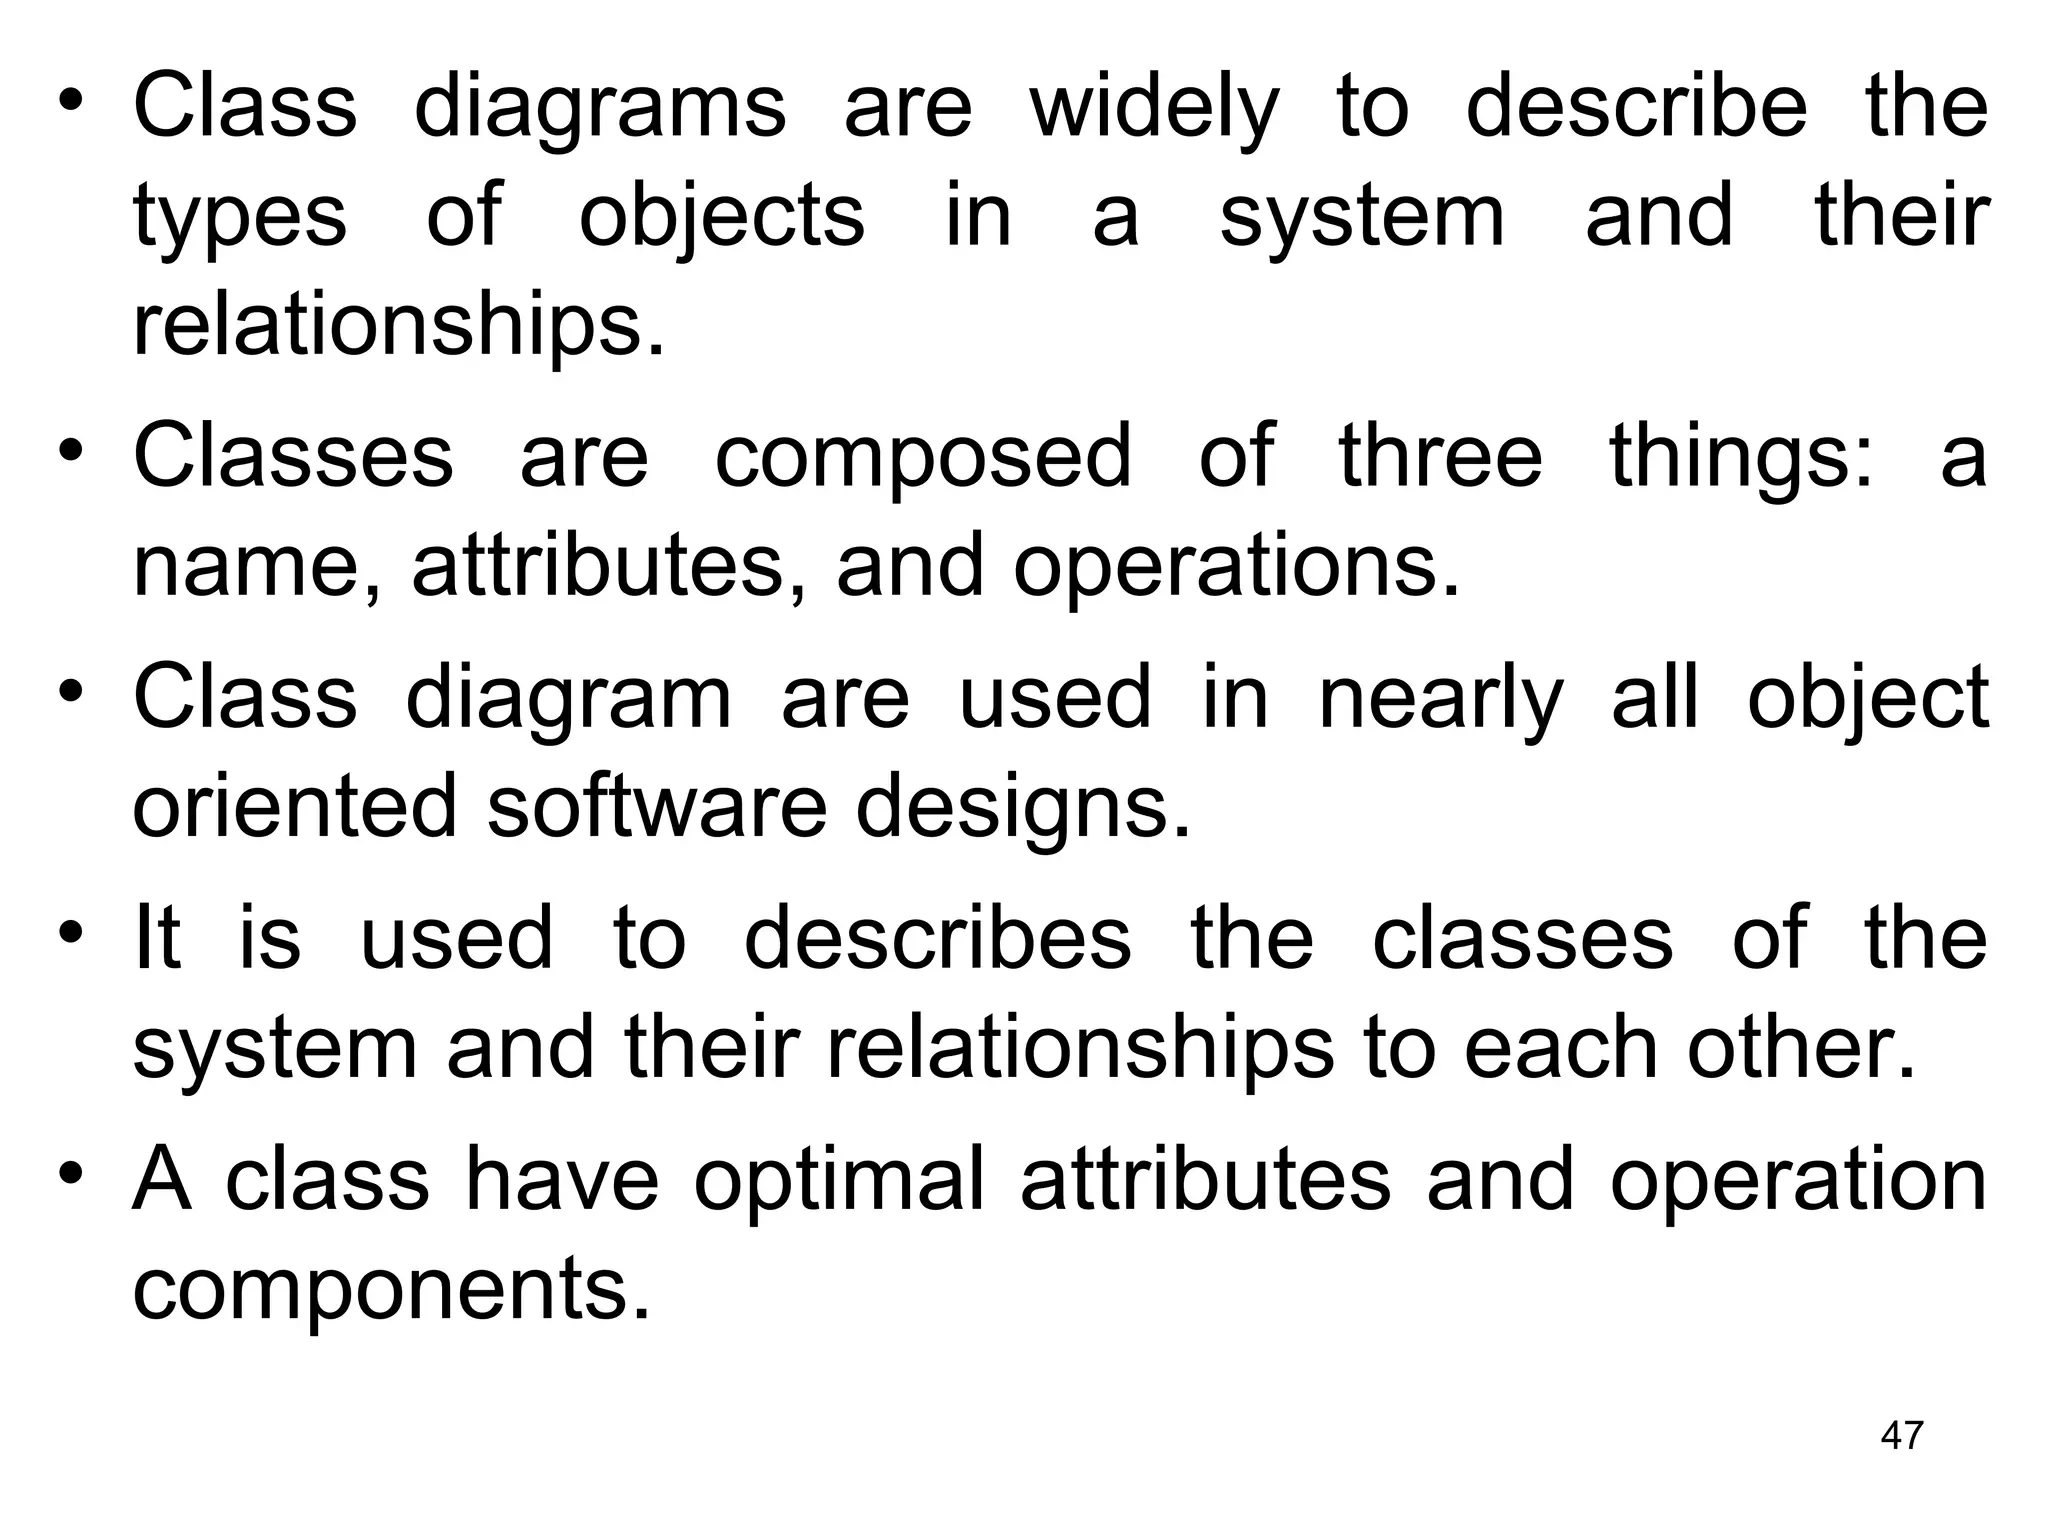
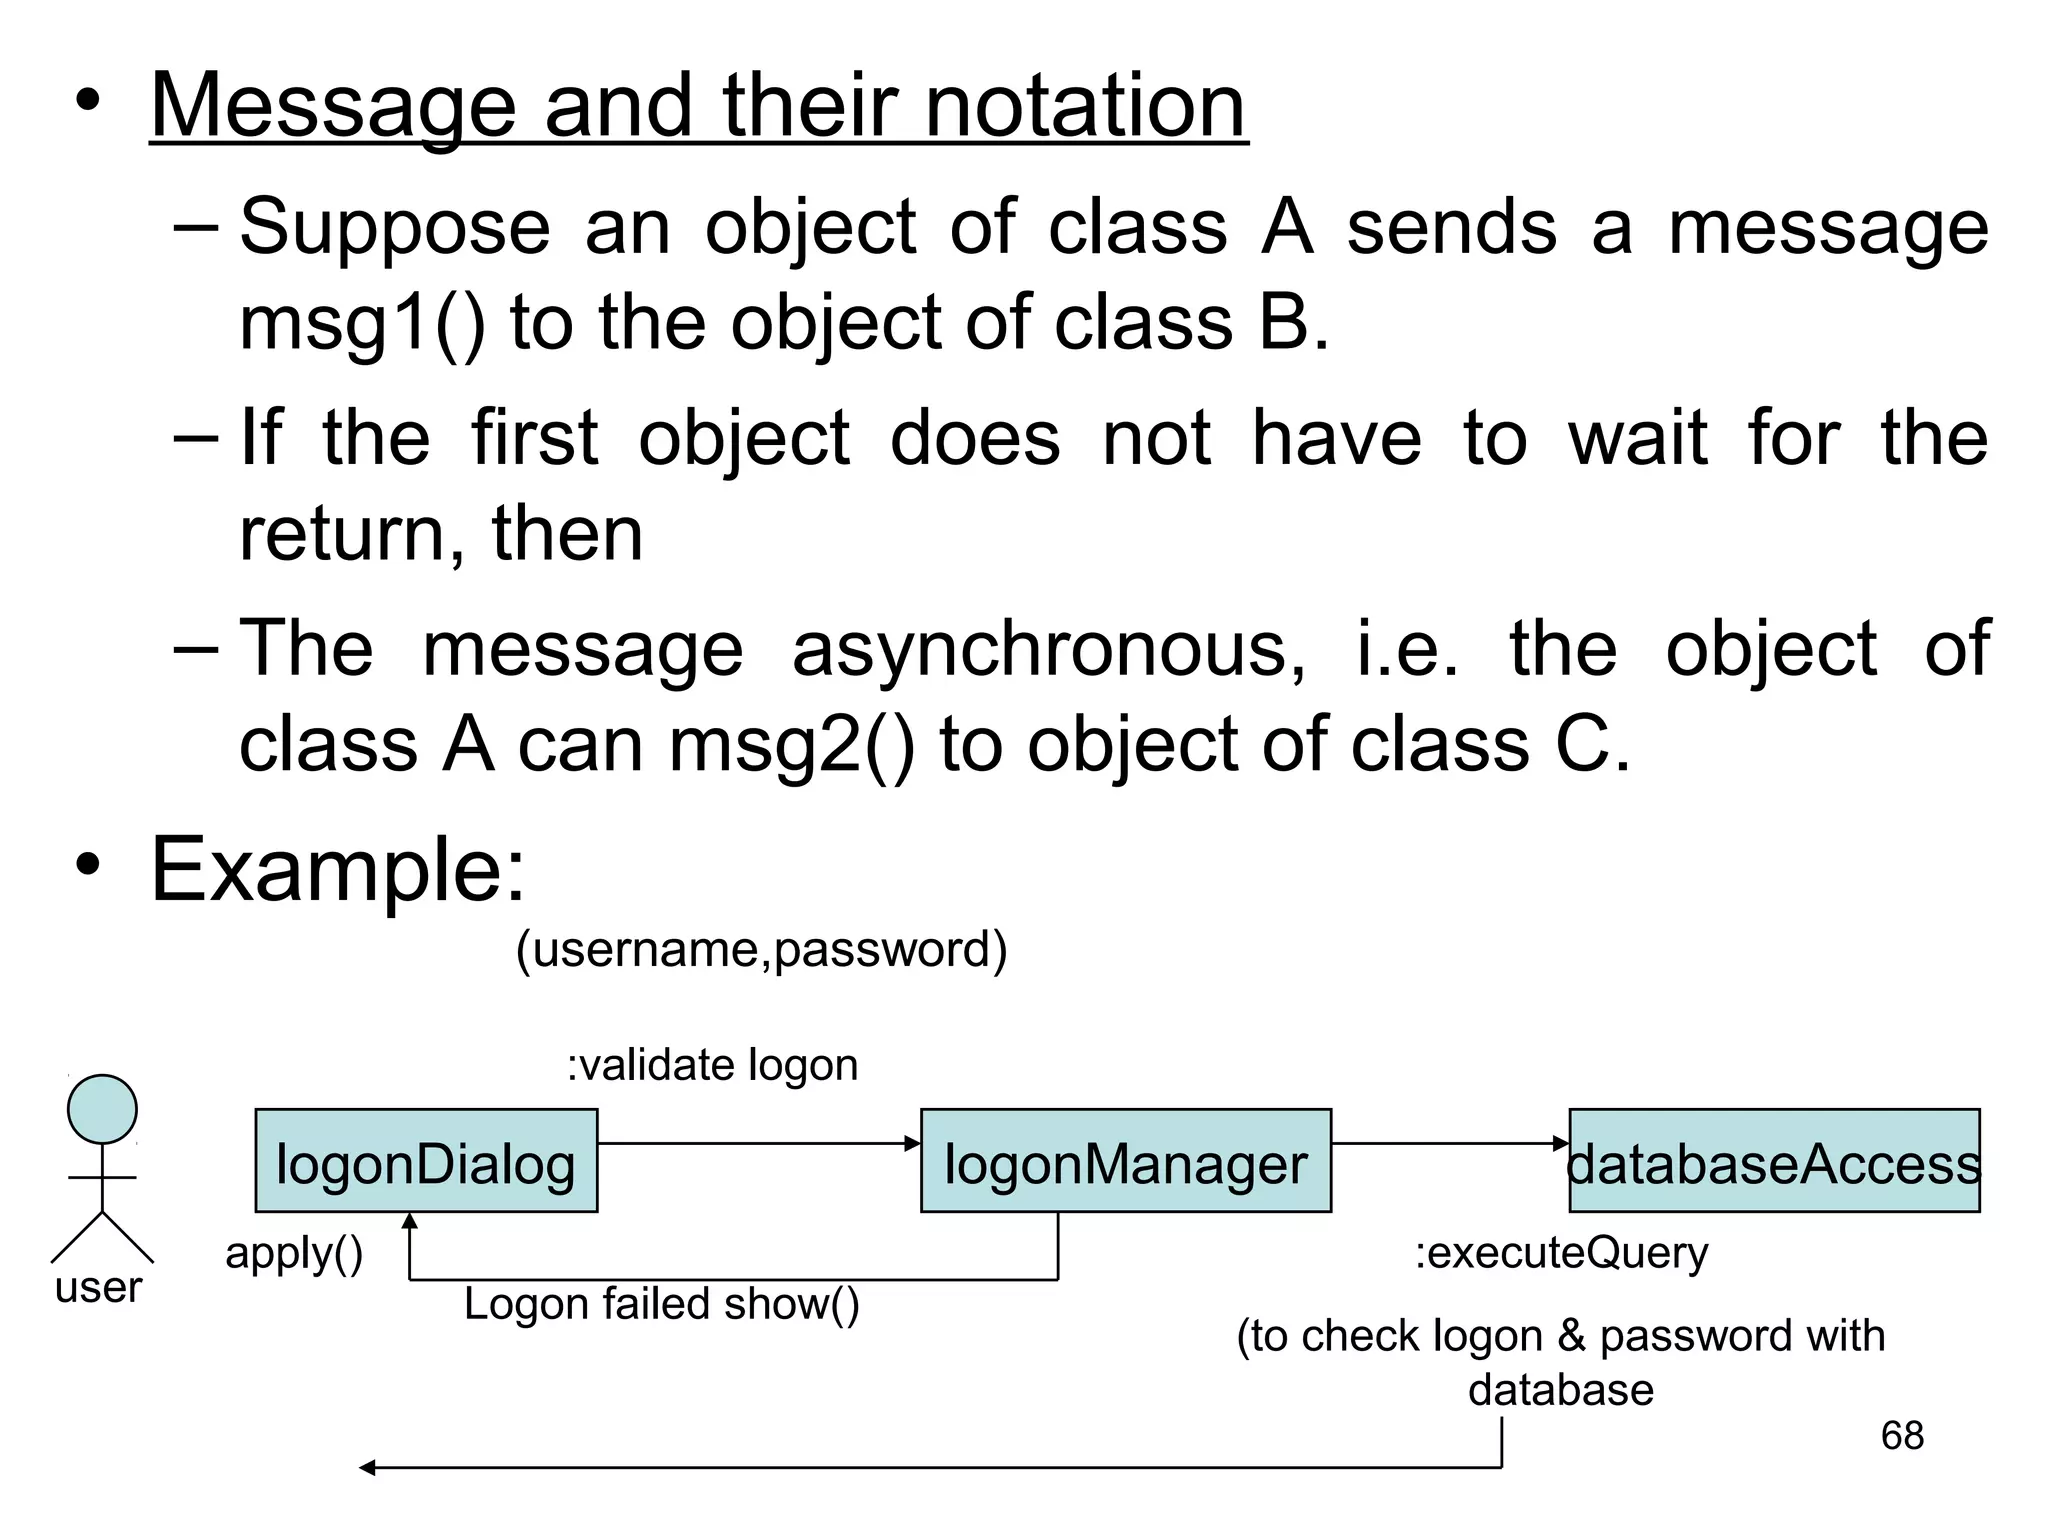
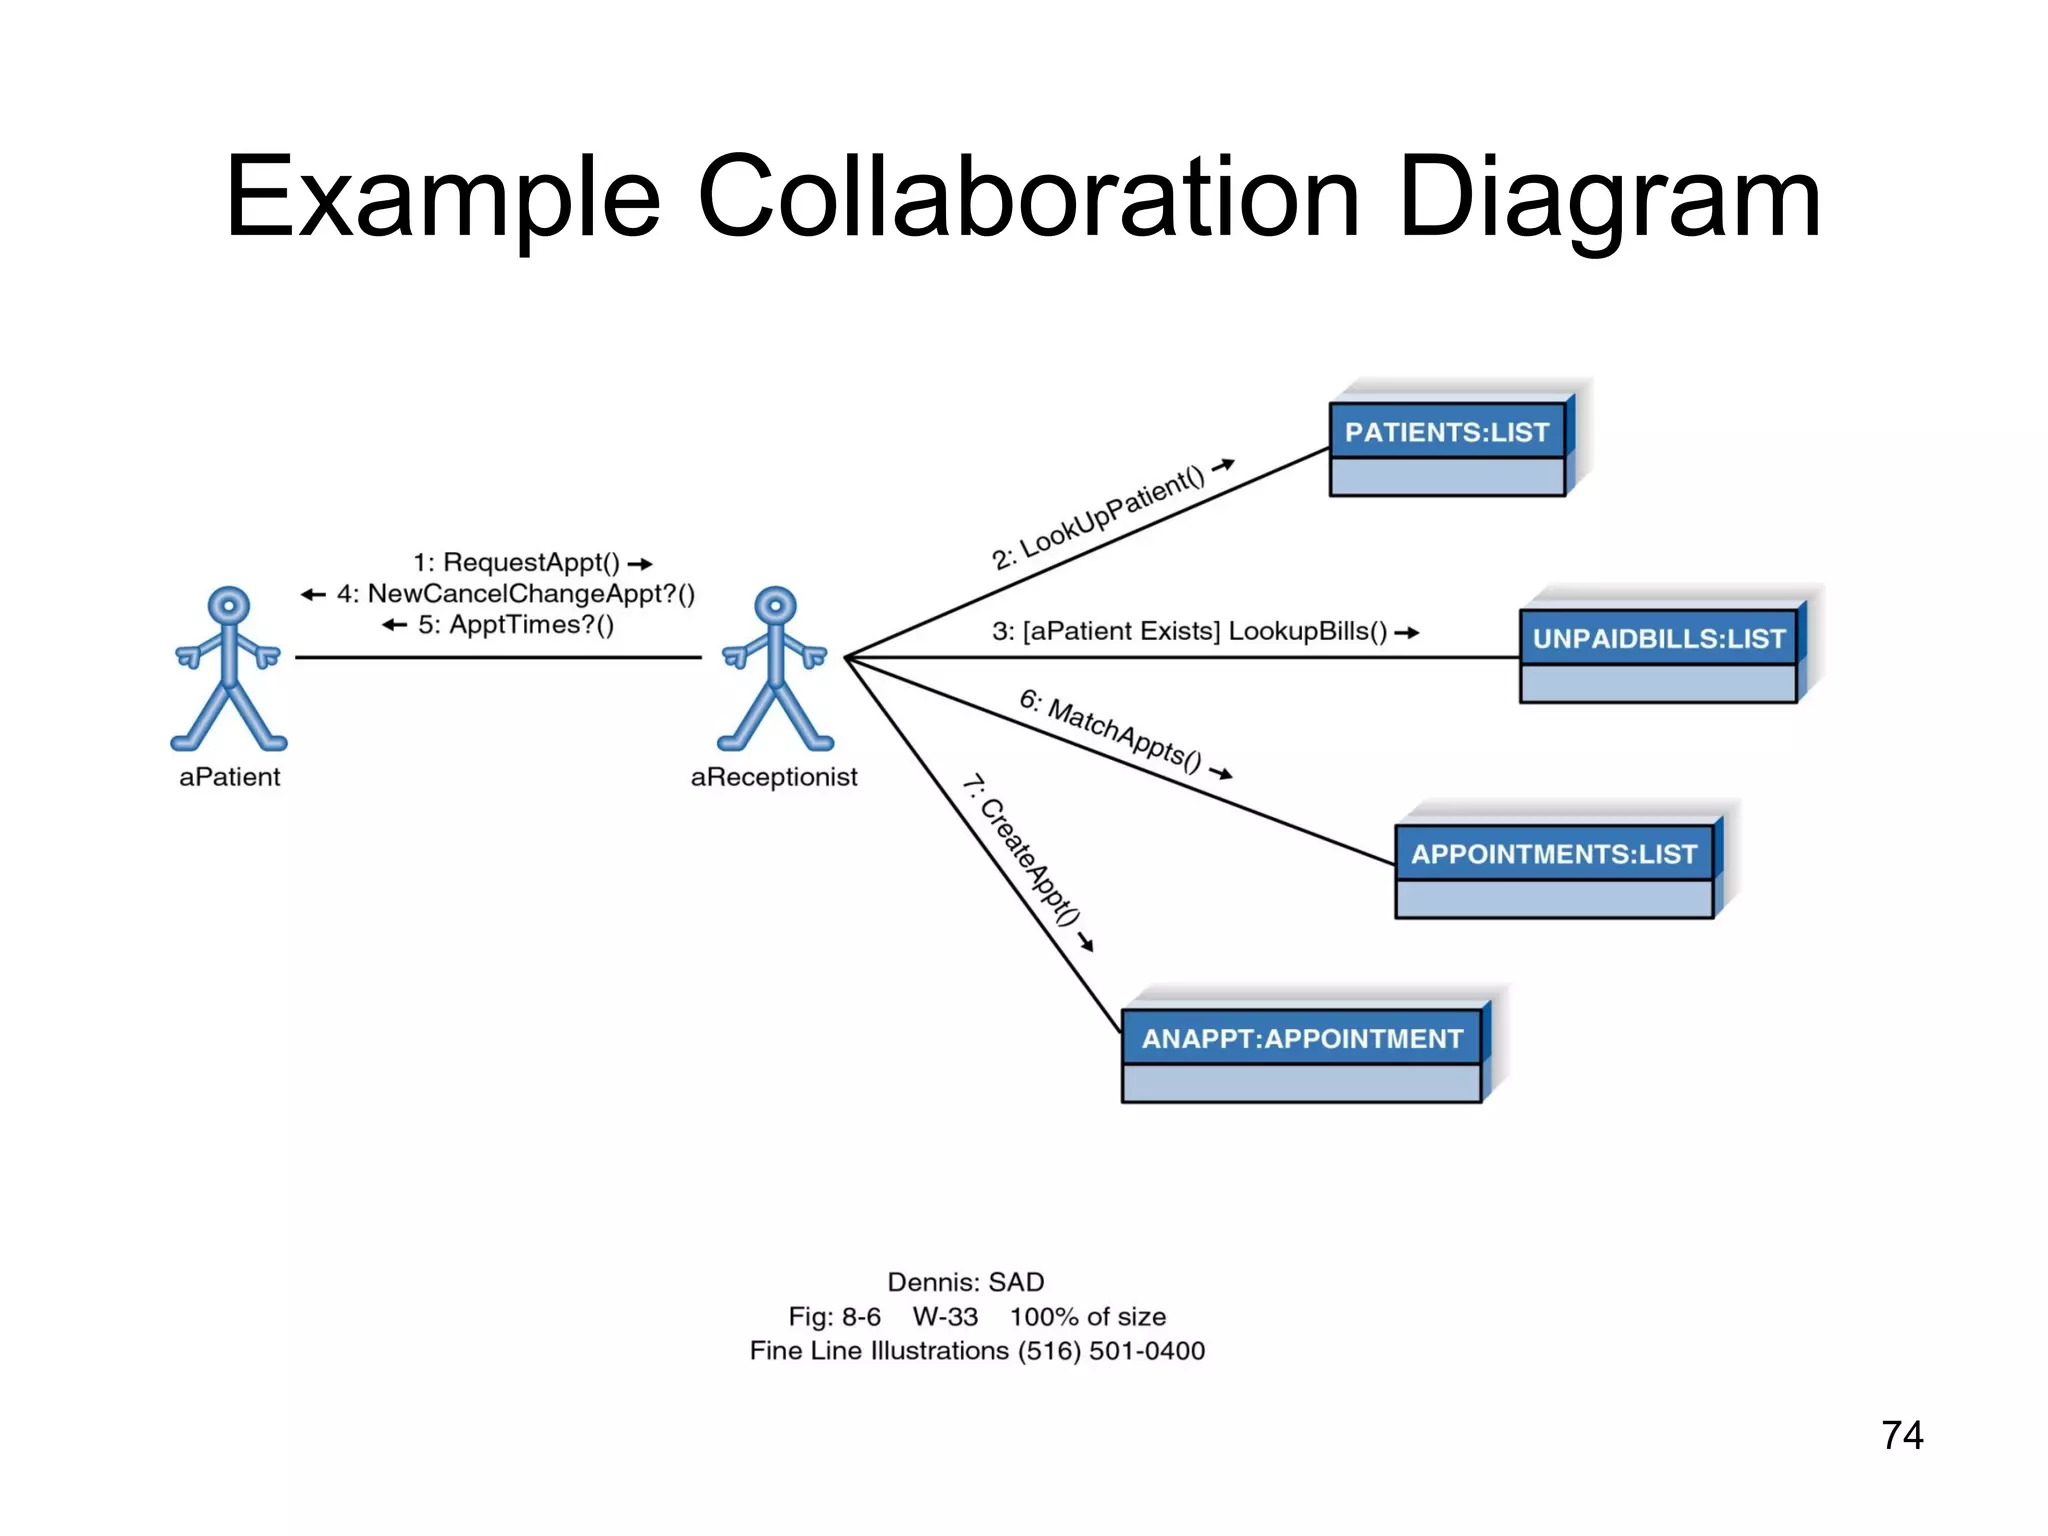
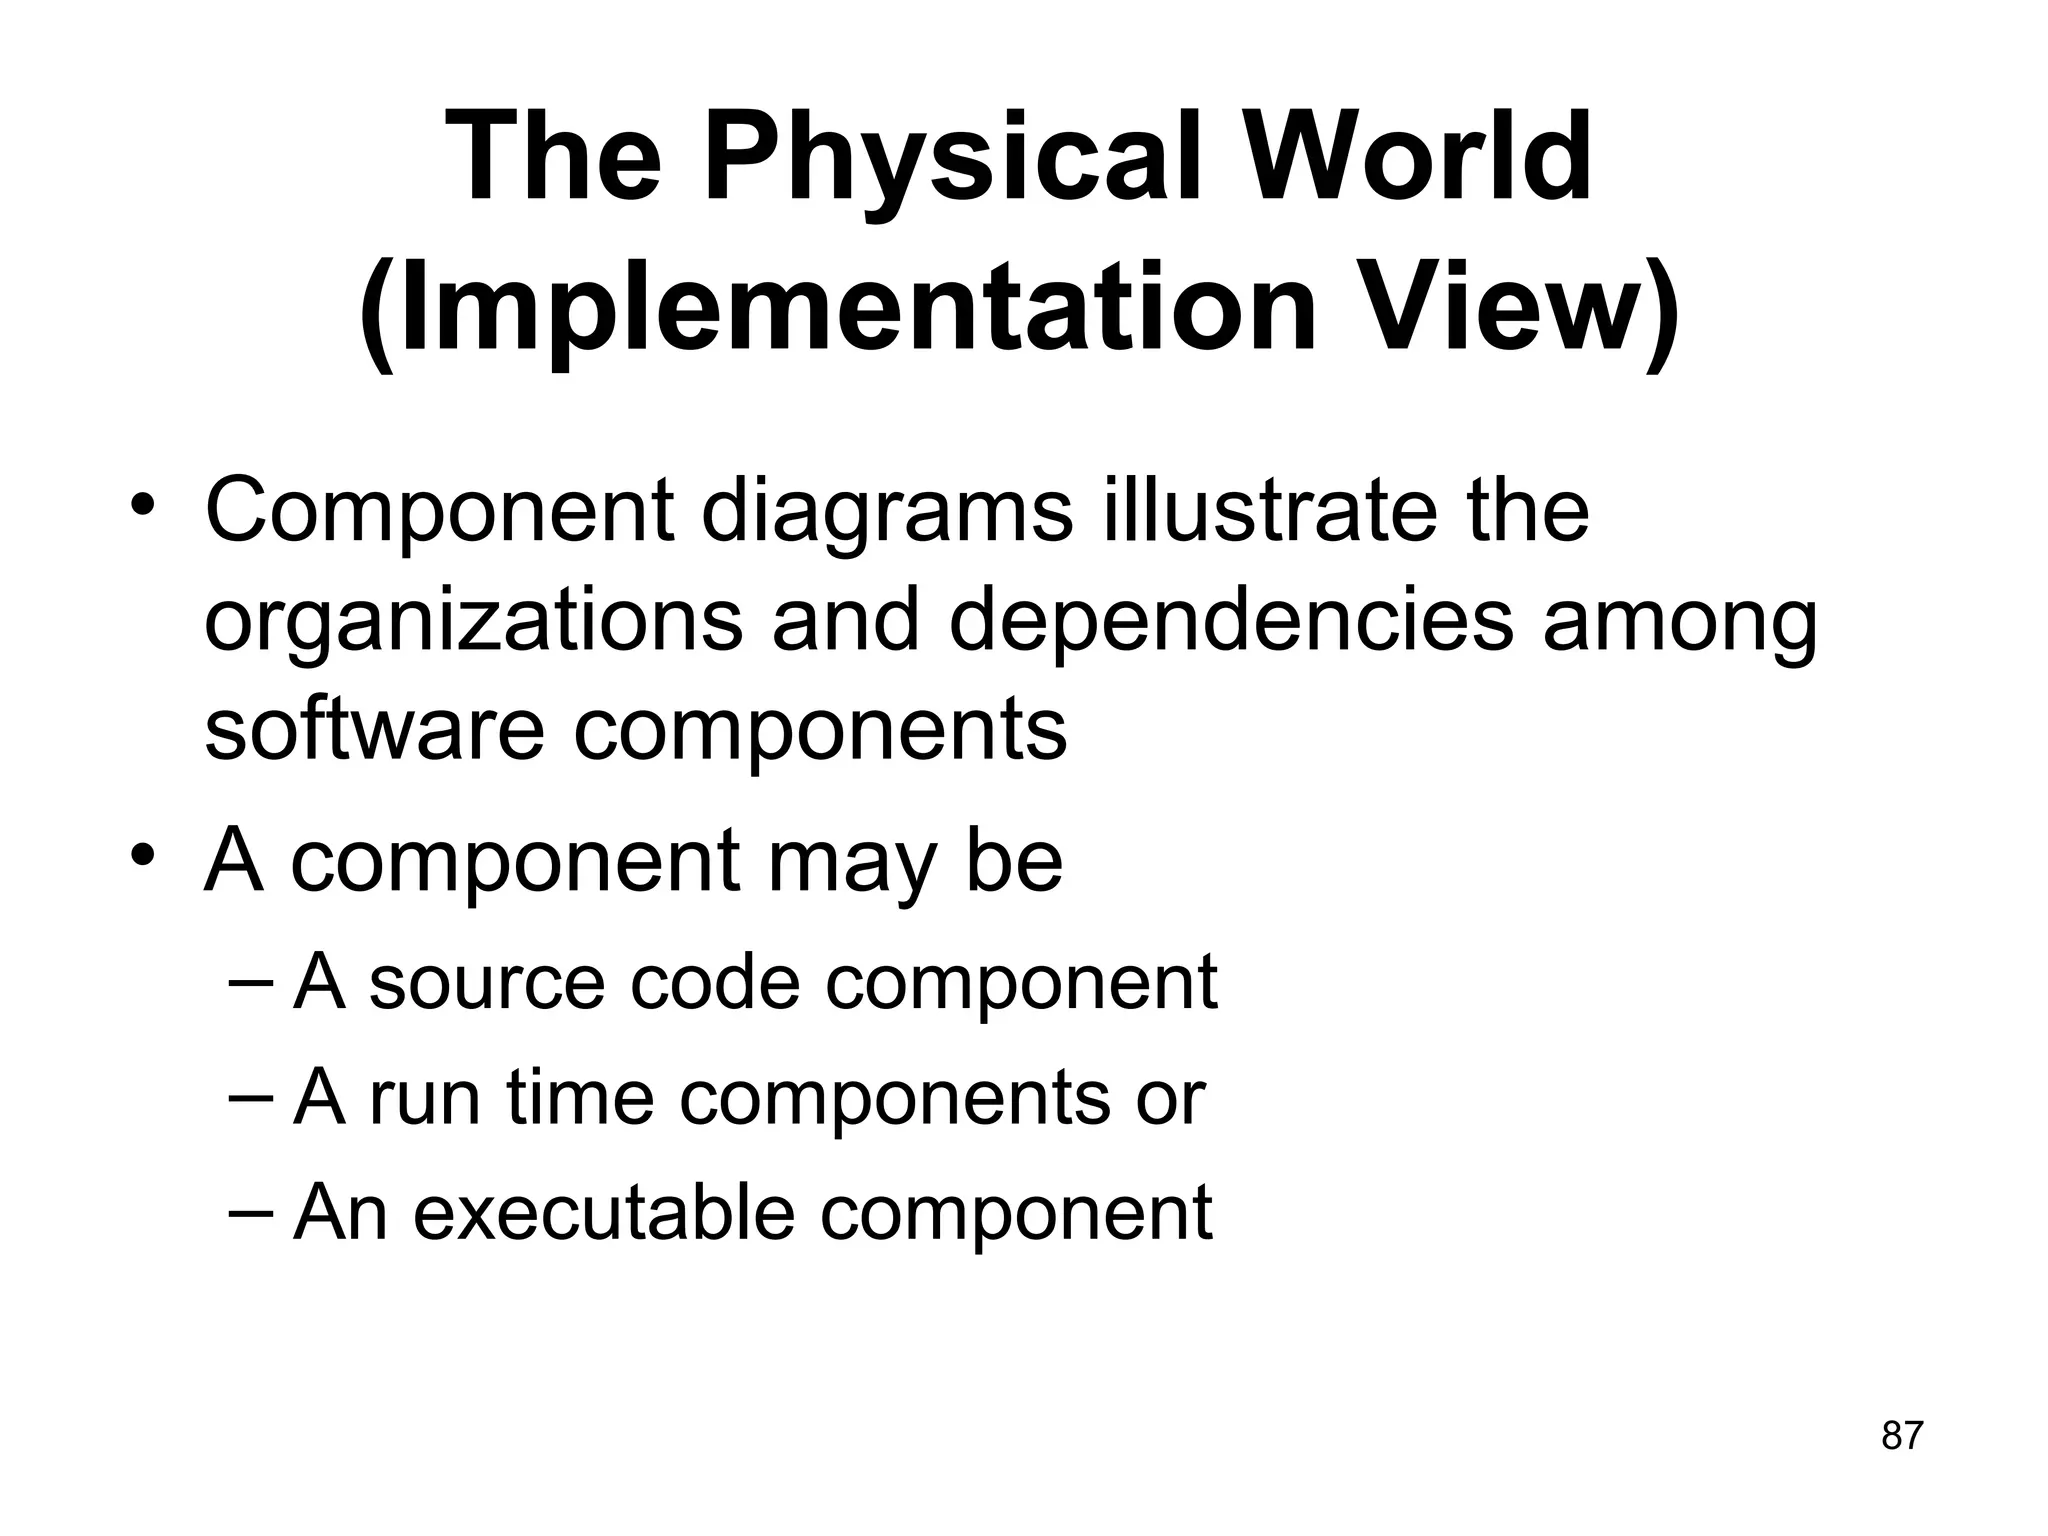
![Collaboration Diagram:
• Collaboration diagrams shows the relationship between object
and the order of messages passed between them.
• So, it shows the structured and behavioral aspects explicitly.
• The object are listed as icons and arrows indicate the
messages being passed between them.
• There are many acceptable sequence numbering schemes in
UML.
• For Example.
1: message()
2: message()
Object:class1
Object:class2 Object:class3
1: prepare()
2: new()
:order entry window
:order :delivery item
[in stock]
73](https://image.slidesharecdn.com/chapter00analysisanddesignwithuml-170410035329/75/analysis-and-design-with-uml-73-2048.jpg)
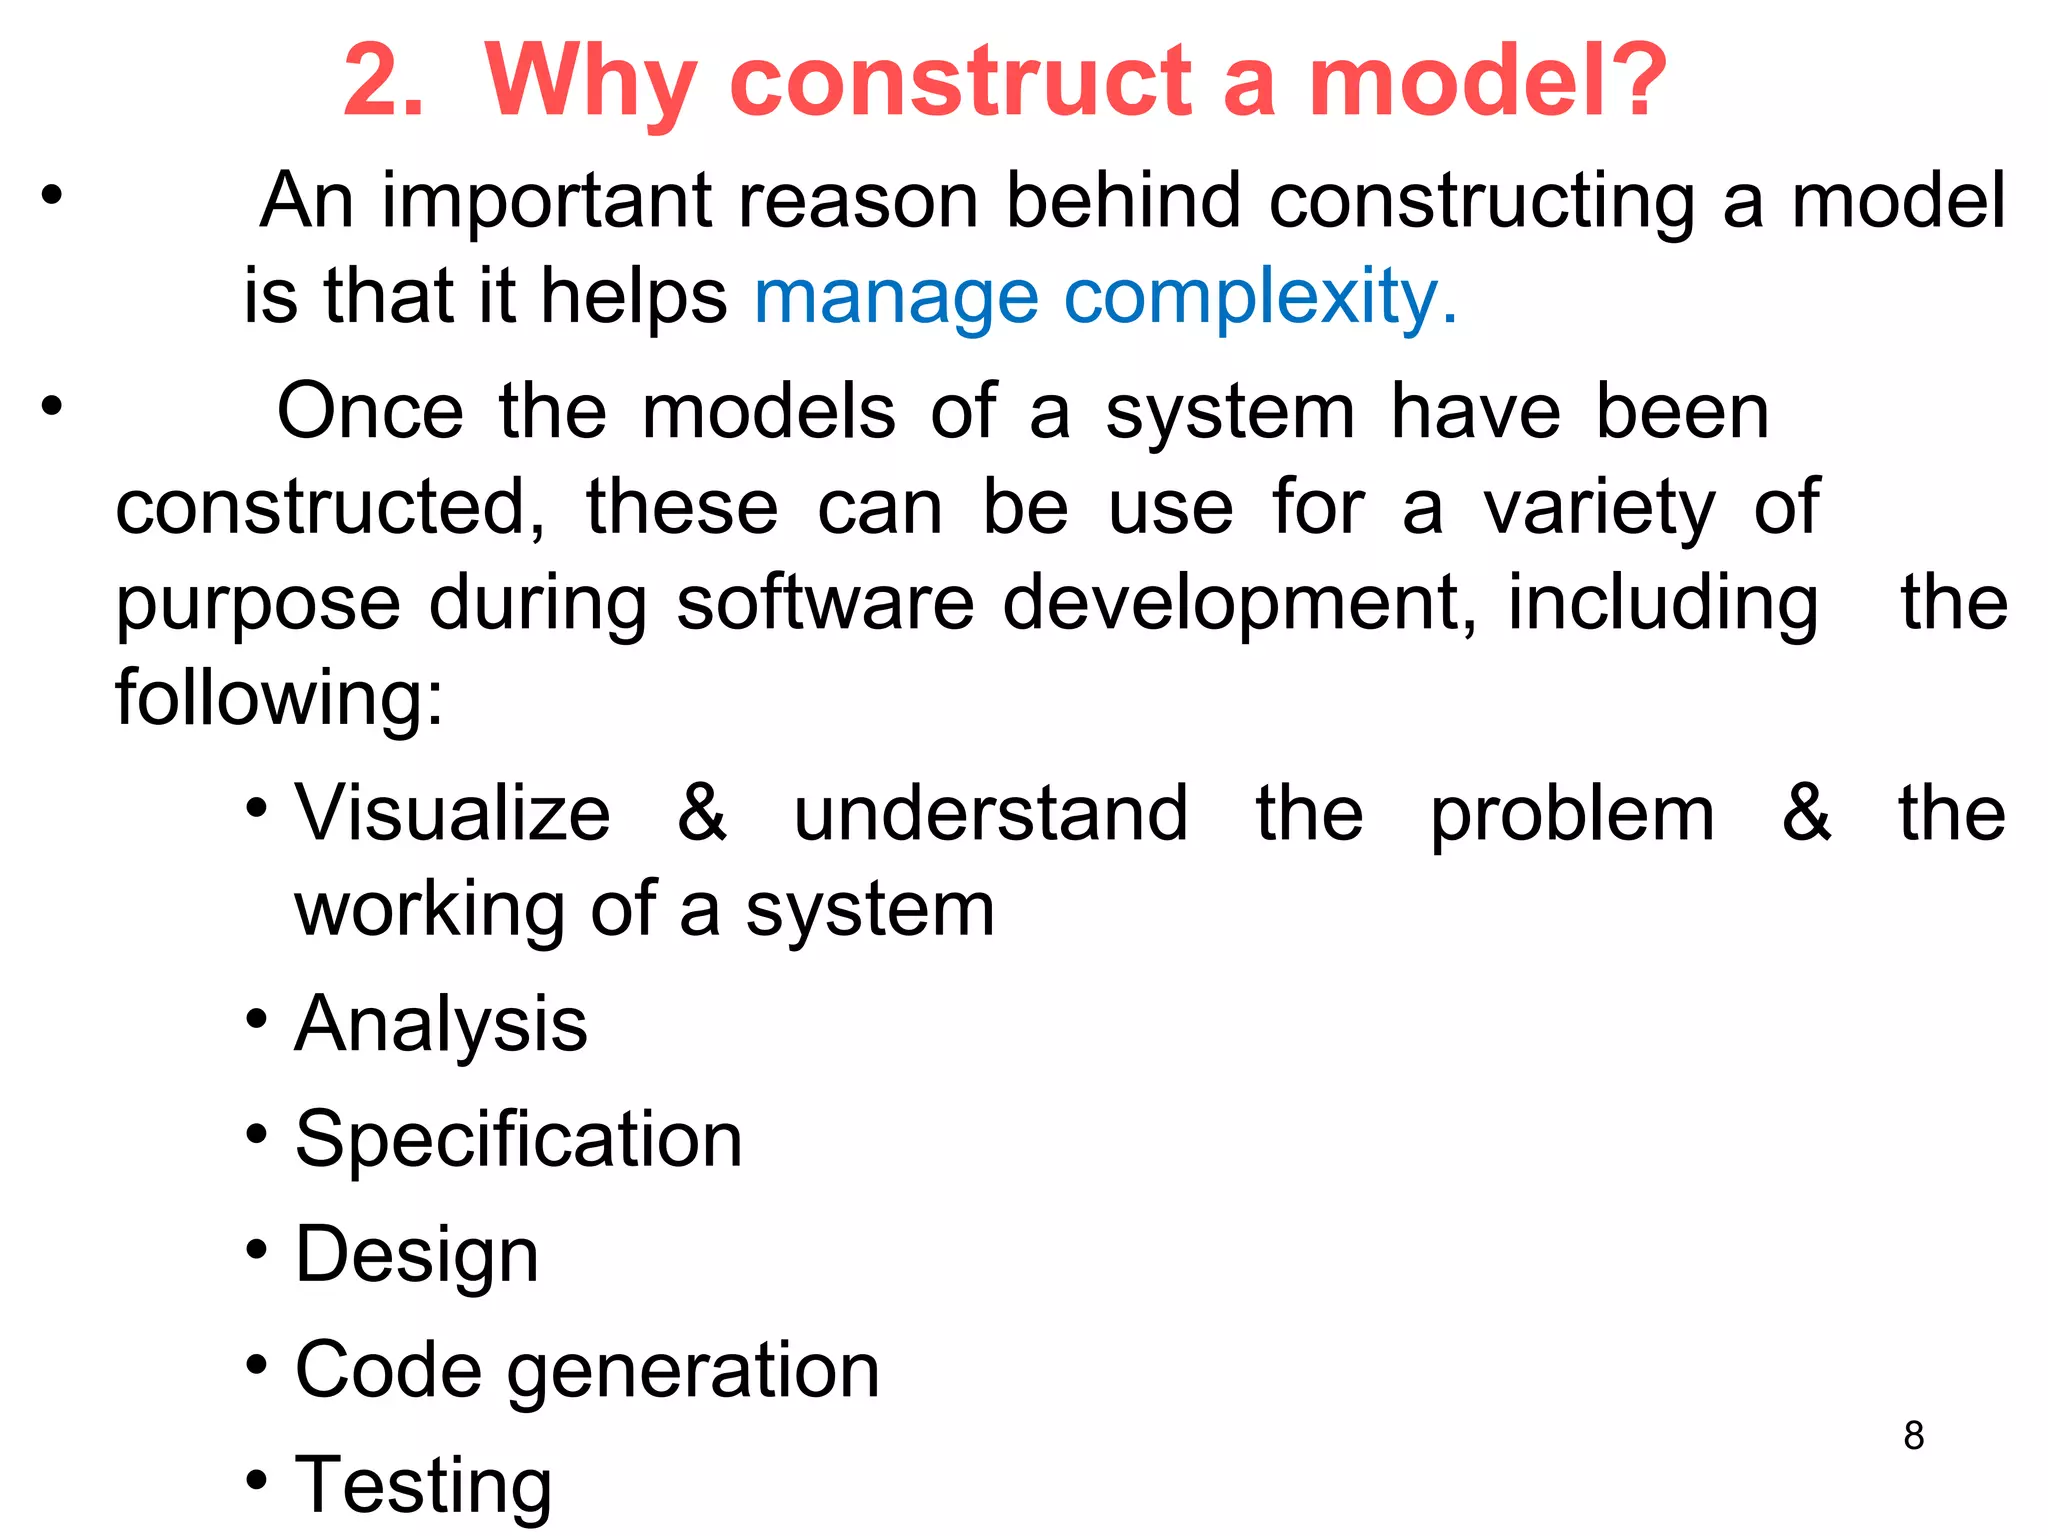
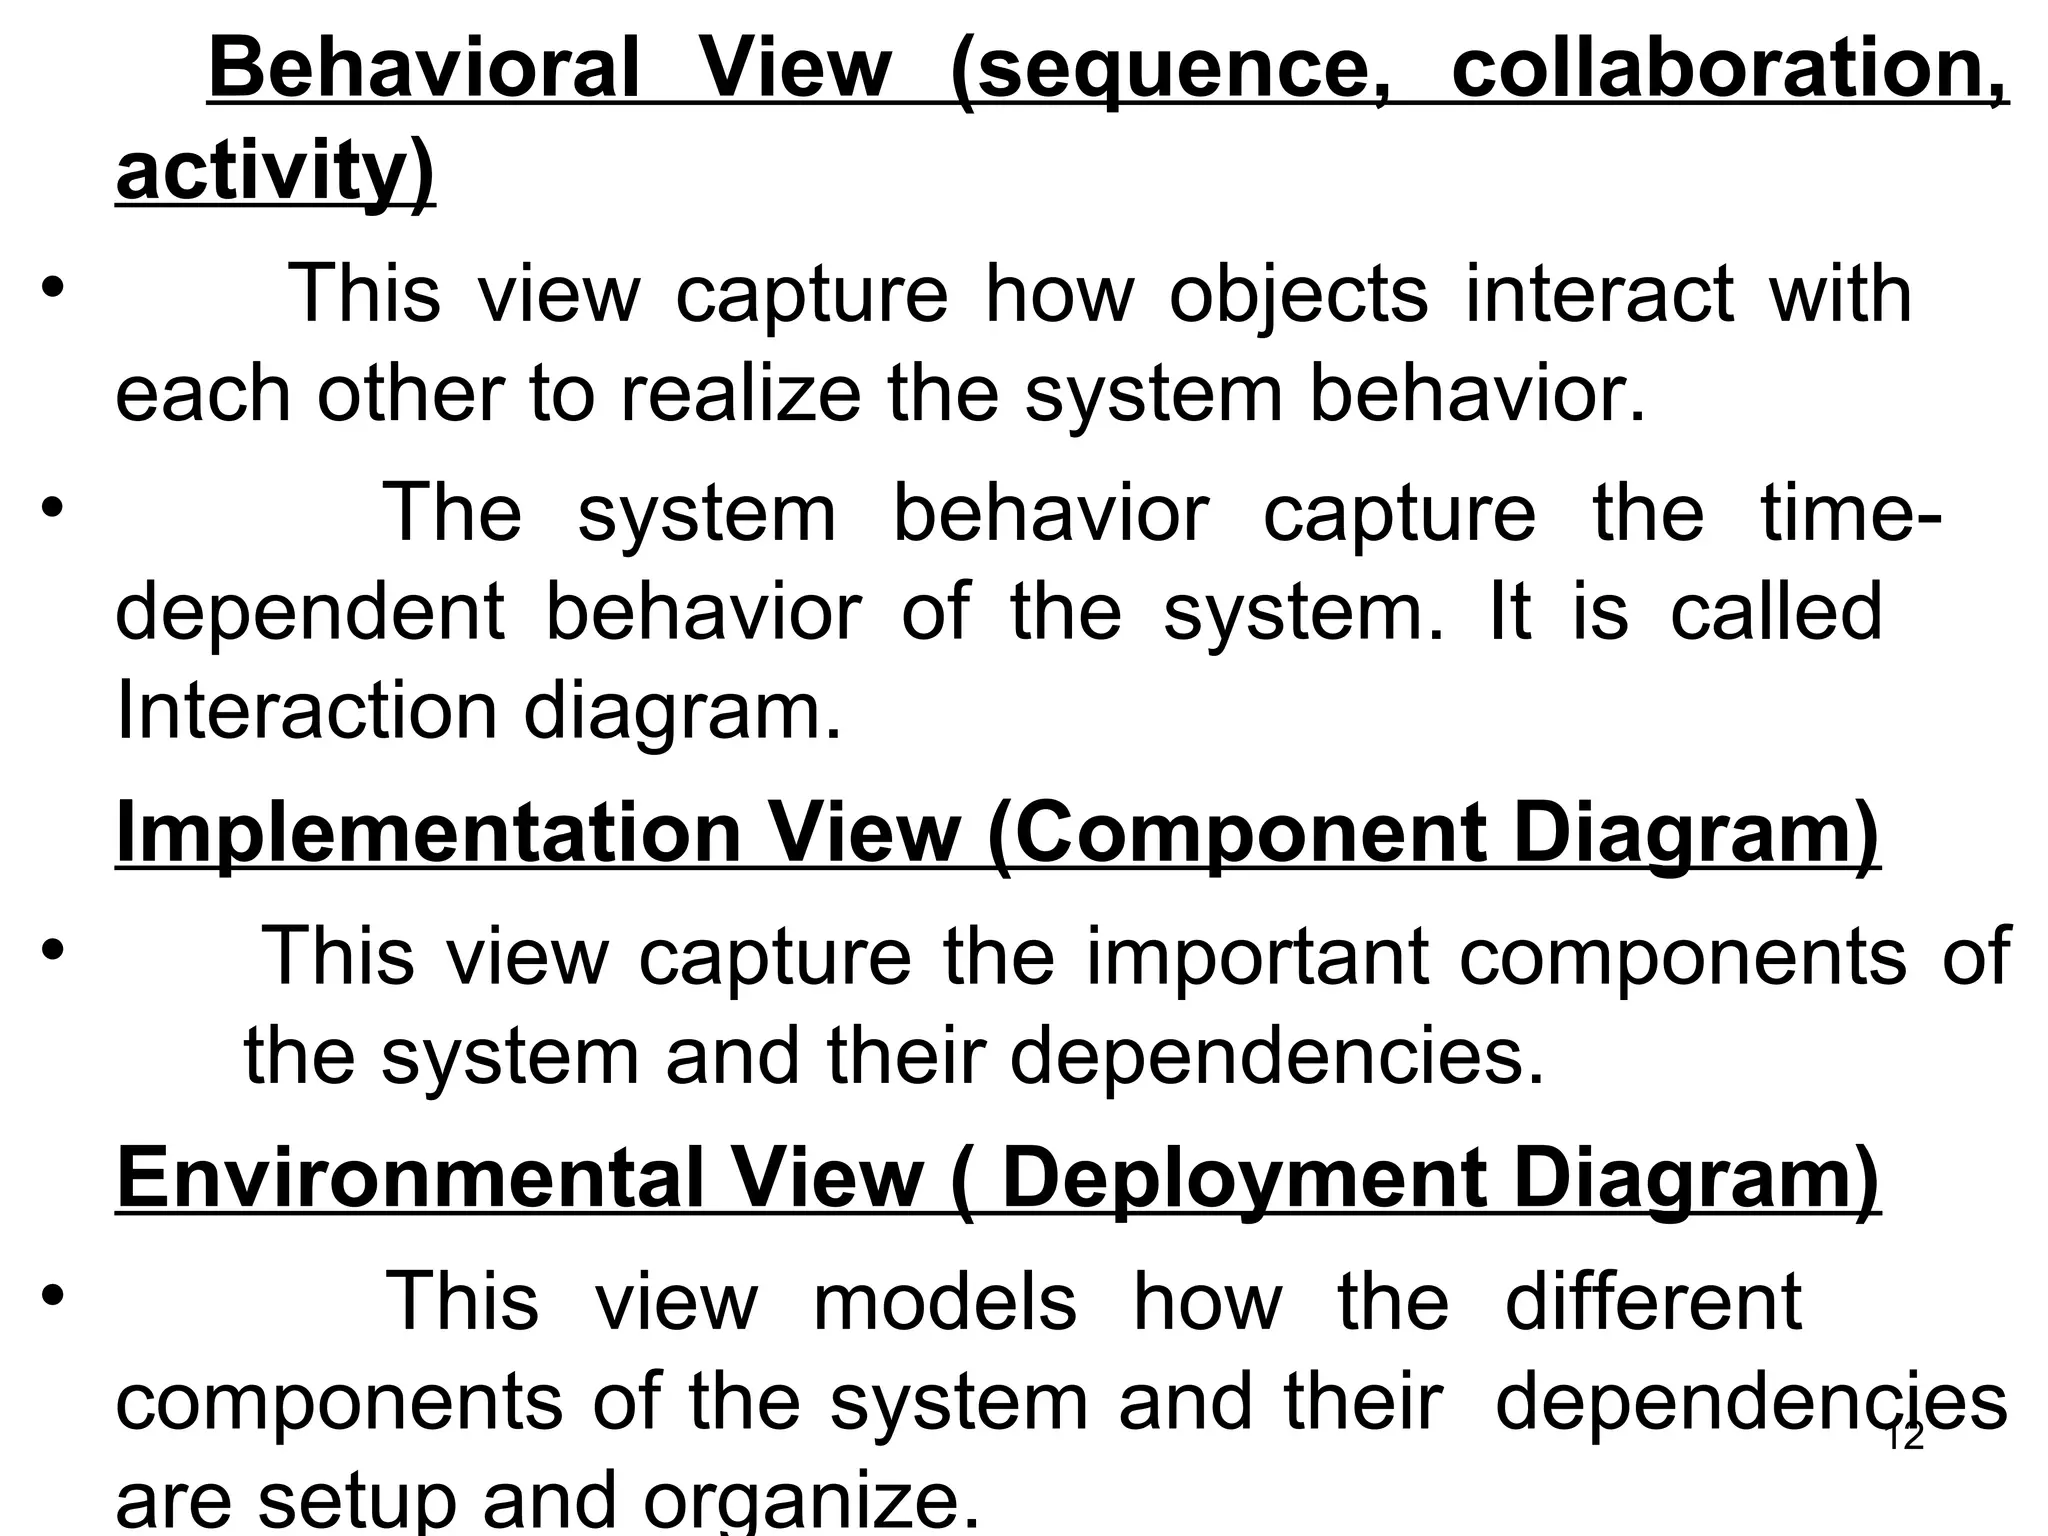
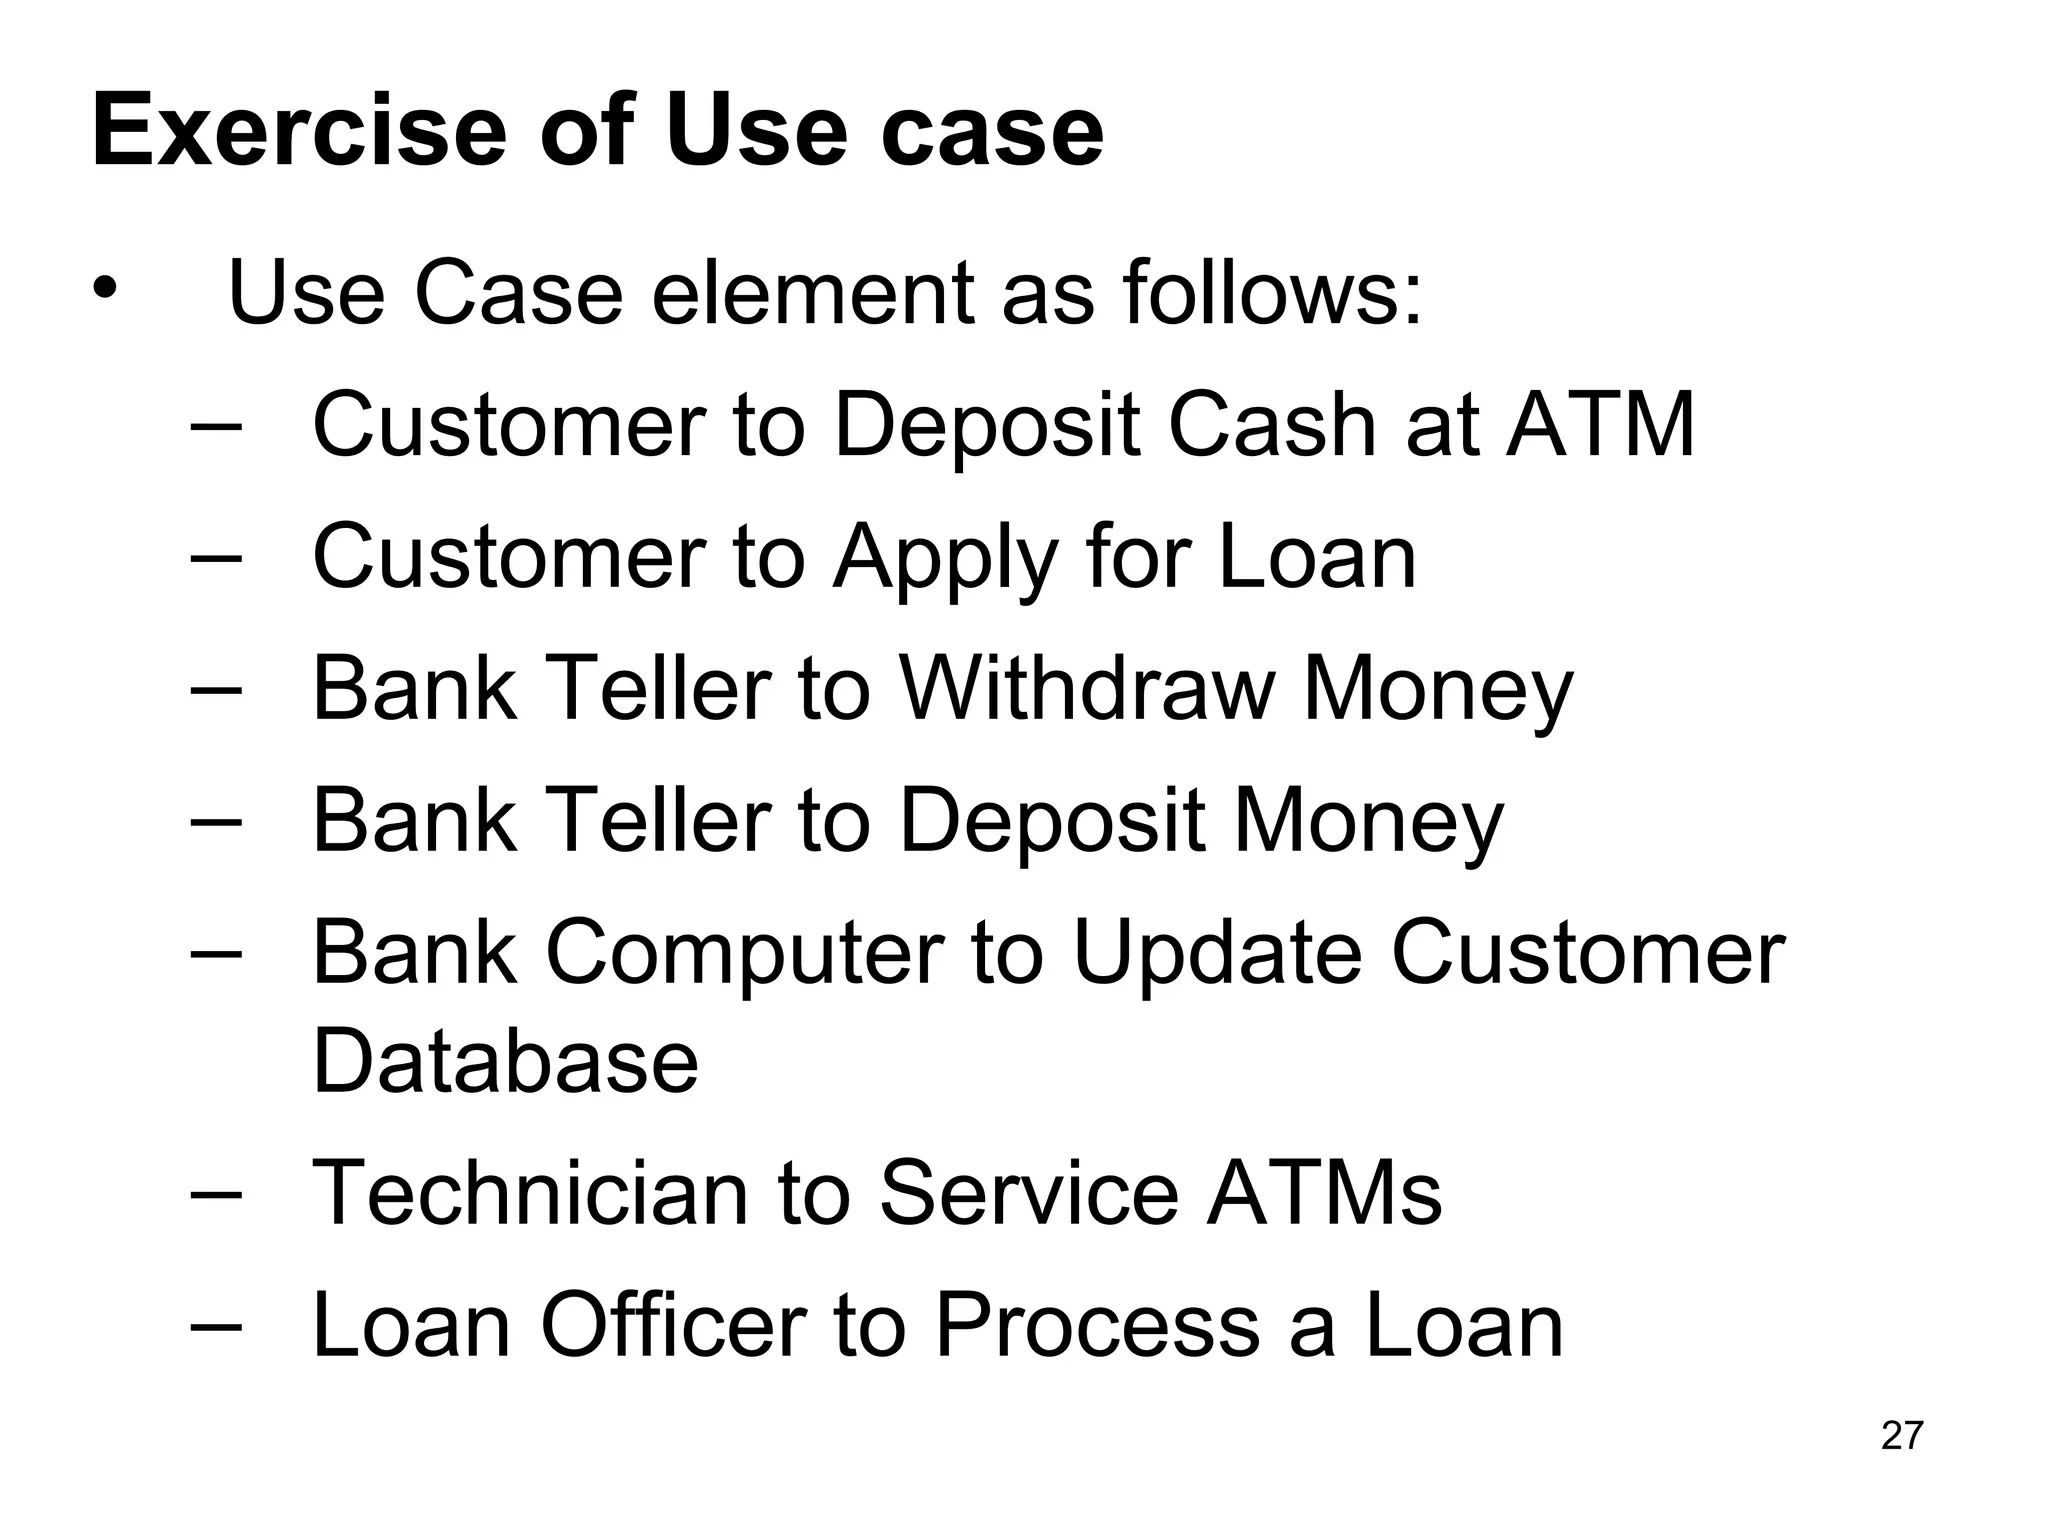
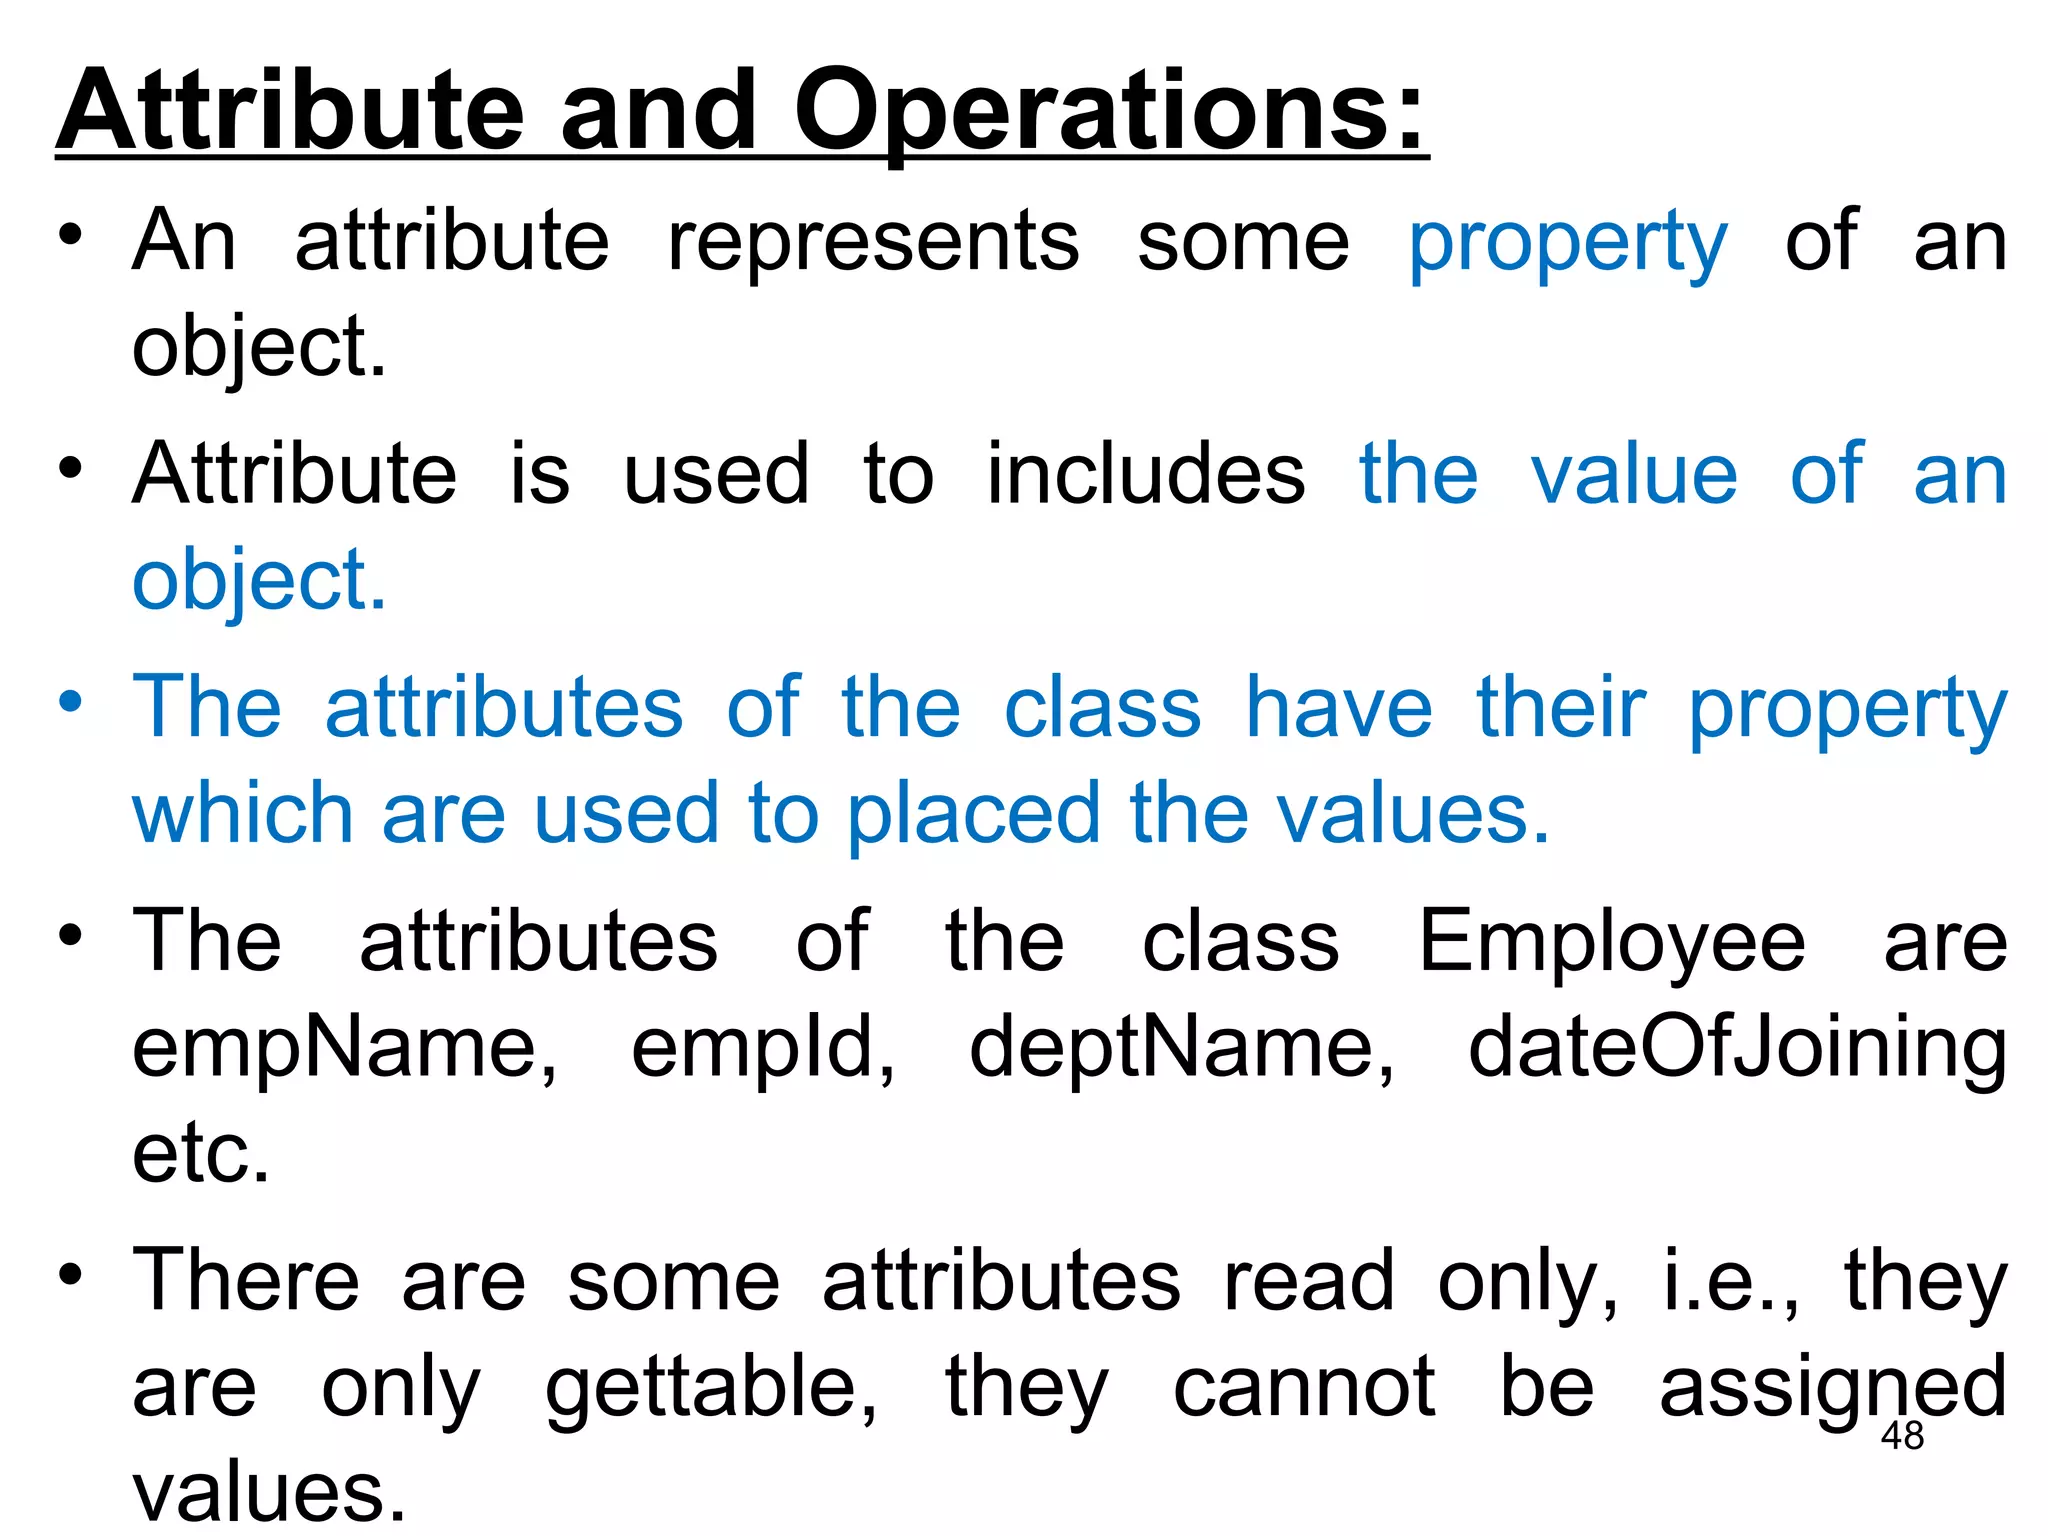
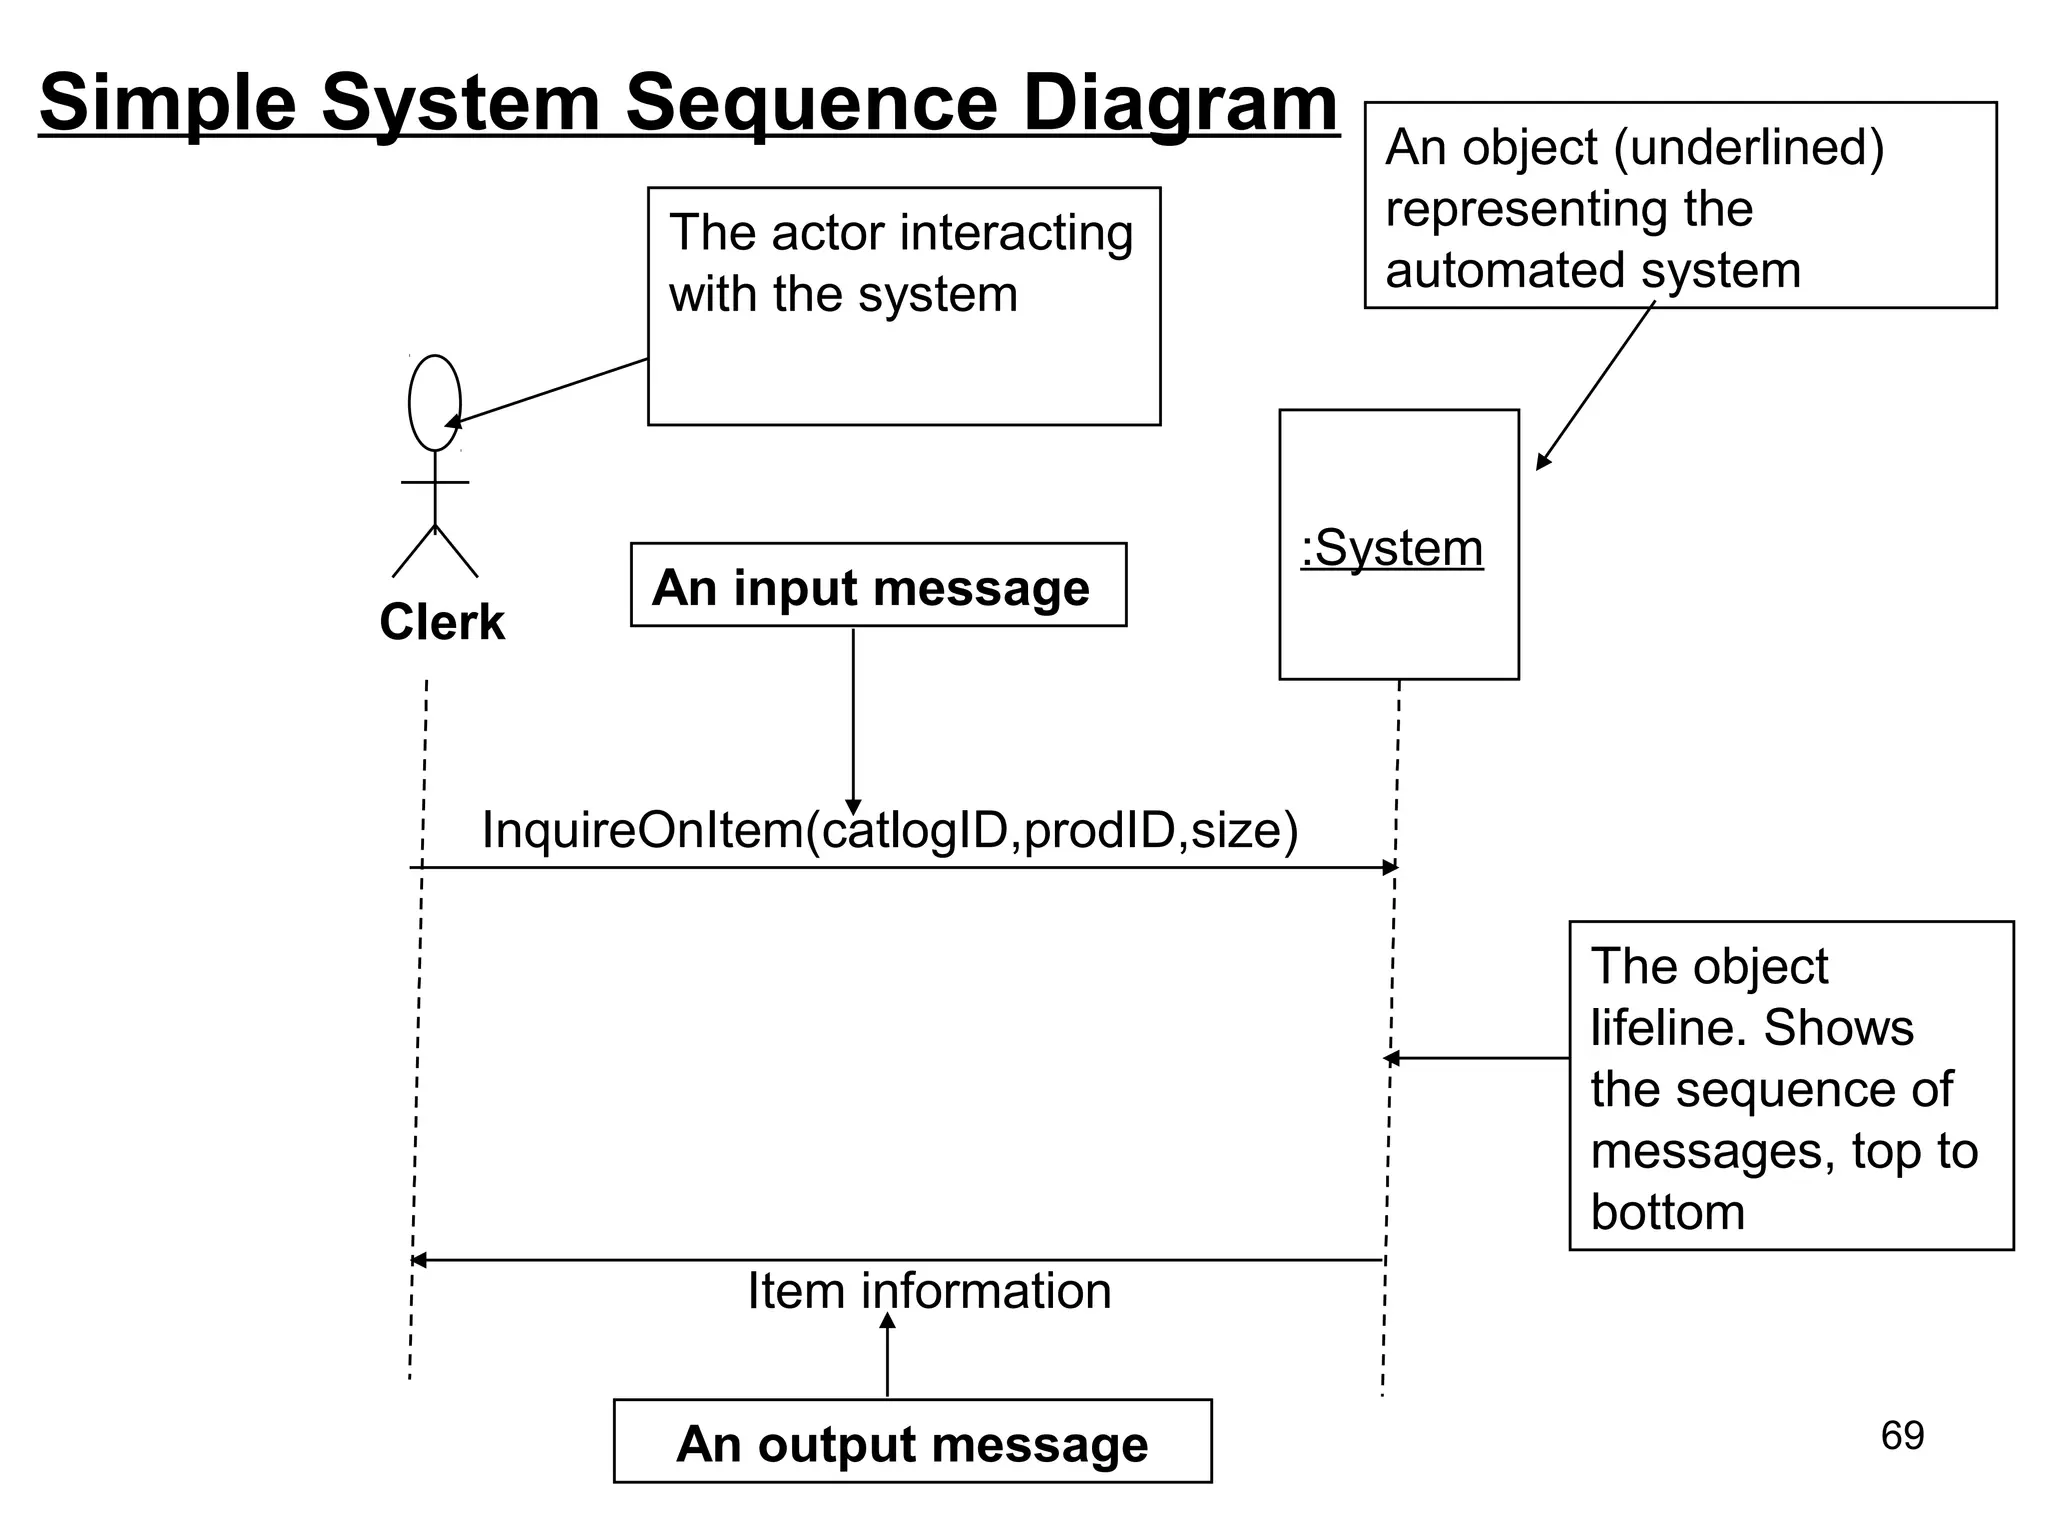
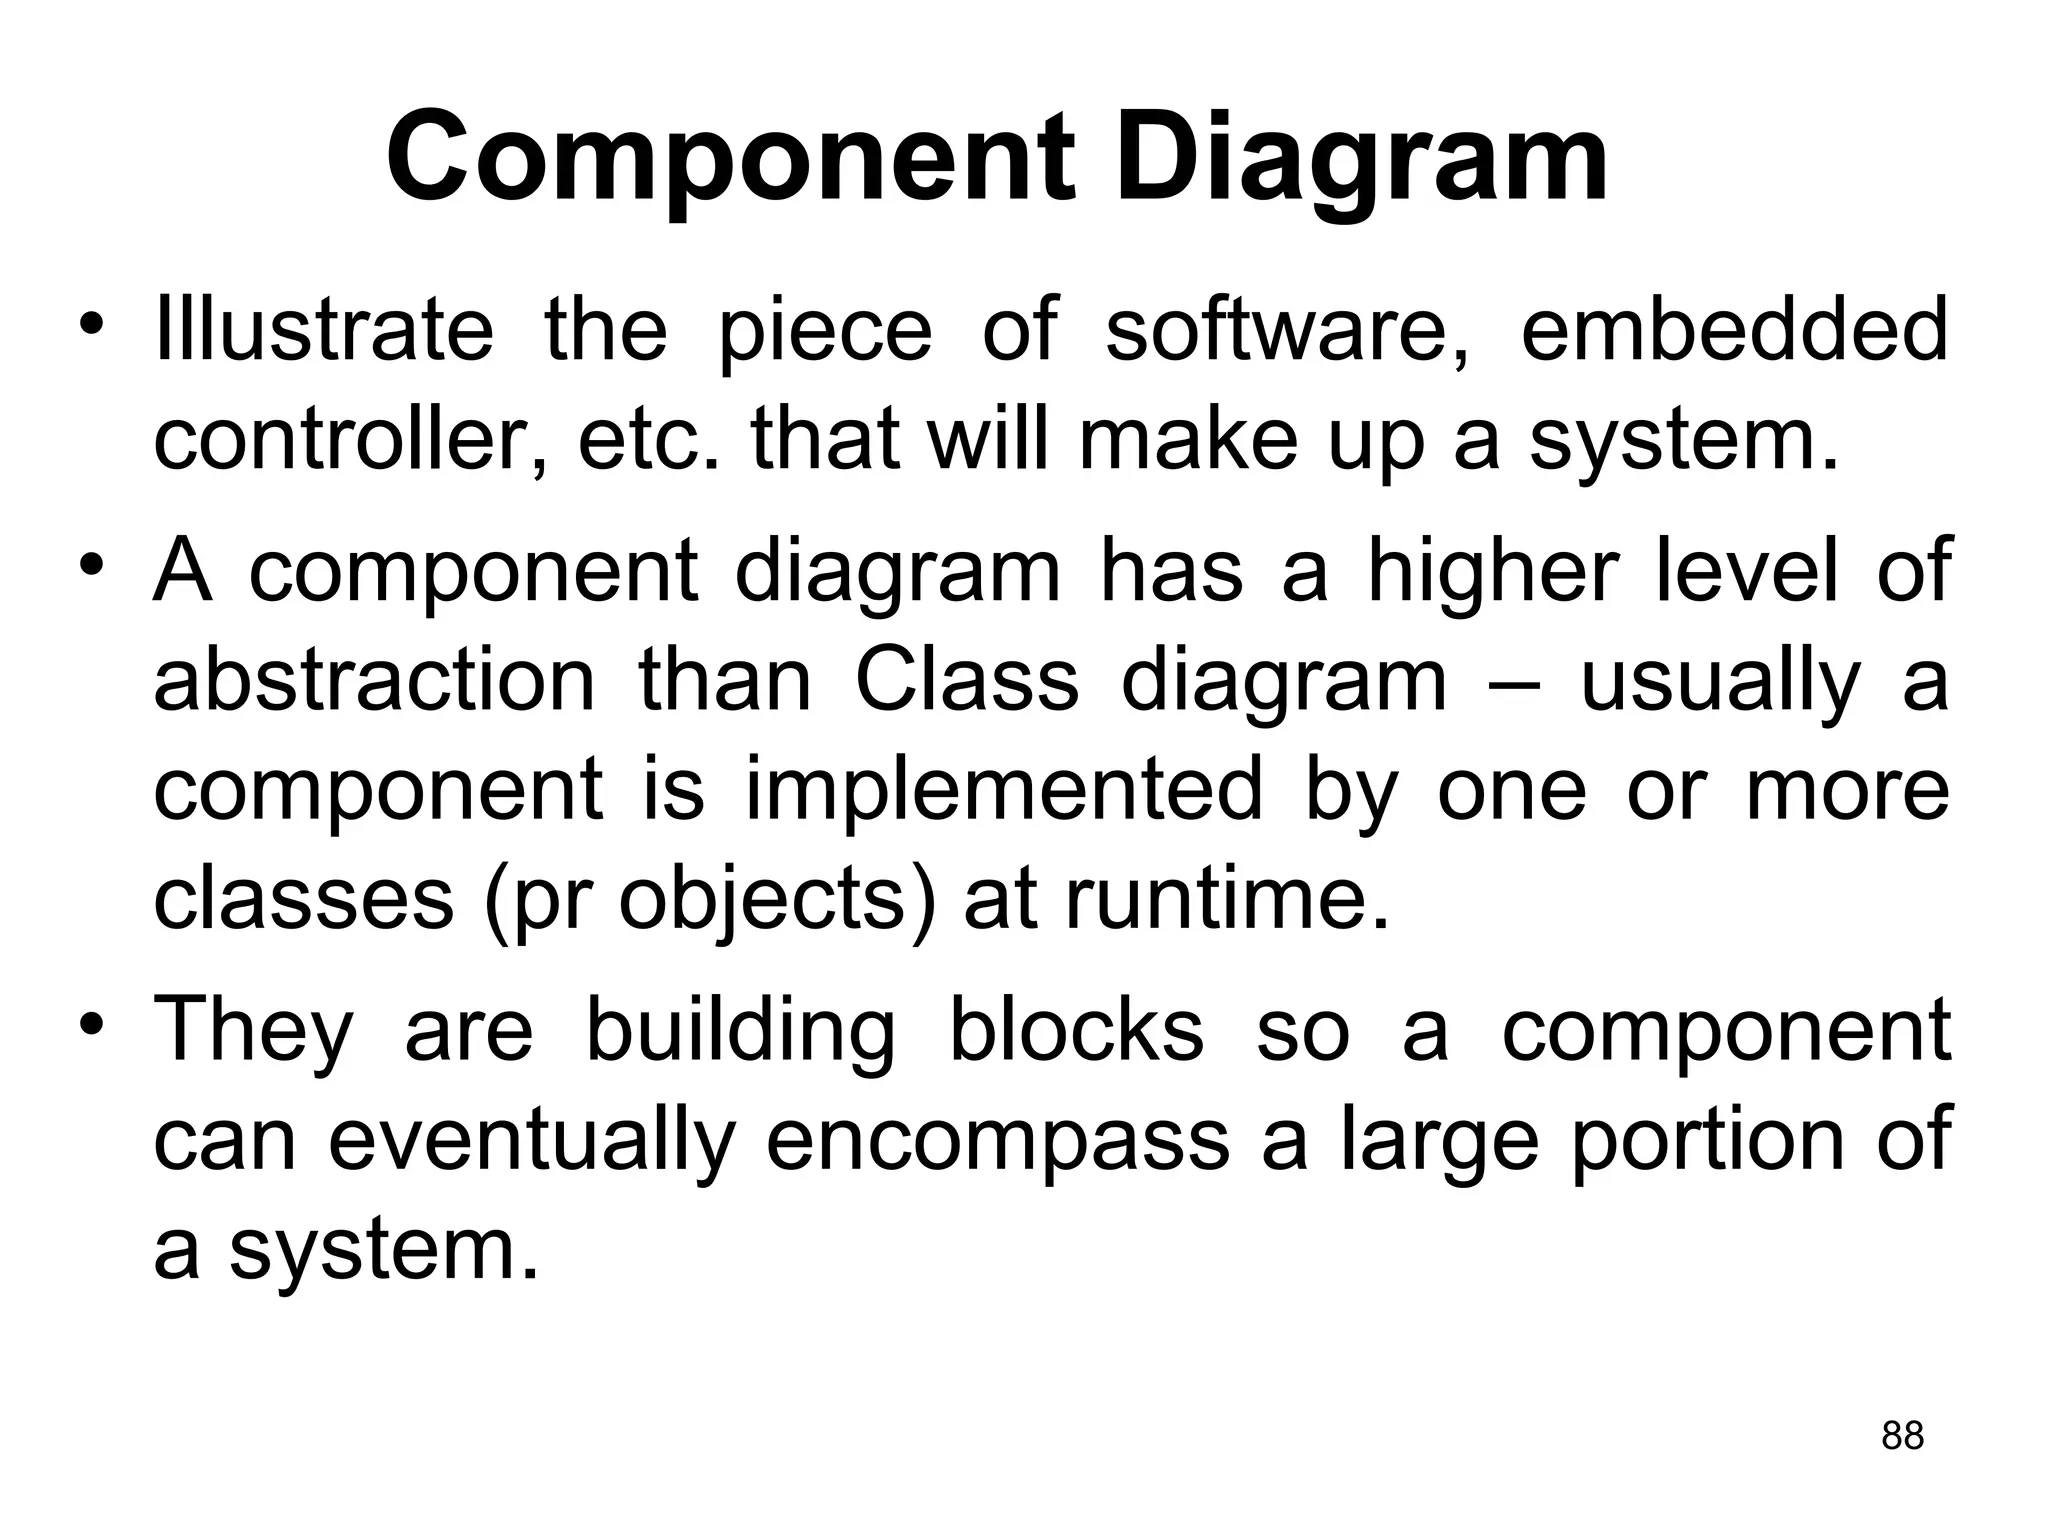
![• This diagram shows the workflow of a system:
Assign tasks
Reschedule
Release work order
[Materials not ready]
[Materials ready]
branch
83](https://image.slidesharecdn.com/chapter00analysisanddesignwithuml-170410035329/75/analysis-and-design-with-uml-83-2048.jpg)


UML (Unified Modeling Language) is a standard language for modeling software systems. It provides notation for visualizing, specifying, constructing and documenting software artifacts. The key components of UML include classes, attributes, operations, relationships, and diagrams. Common UML diagrams are use case diagrams, class diagrams, sequence diagrams, and deployment diagrams. UML is widely used for object-oriented analysis and design. It helps model the problem domain, visualize the system design, and document implementation.


![[RPL2] Pertemuan 3 - UML dan USECASE VIEW](https://cdn.slidesharecdn.com/ss_thumbnails/rpl2pertemuan3-umldanusecaseview-181013010605-thumbnail.jpg?width=640&height=640&fit=bounds)


