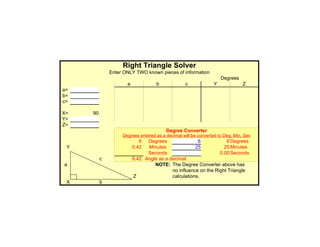
Based on the information provided, there are not enough known values to solve this right triangle. Please enter at least two known values (side lengths or angles) and the remaining values will be automatically calculated.
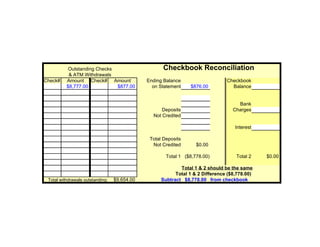
Outstanding Checks Checkbook Reconciliation
& ATM Withdrawals
Check# Amount Check# Amount Ending Balance Checkbook
$8,777.00 $877.00 on Statement $876.00 Balance
Bank
Deposits Charges
Not Credited
Interest
Total Deposits
Not Credited $0.00
Total 1 ($8,778.00) Total 2 $0.00
Total 1 & 2 should be the same
Total 1 & 2 Difference ($8,778.00)
Total withdrawals outstanding: $9,654.00 Subtract $8,778.00 from checkbook
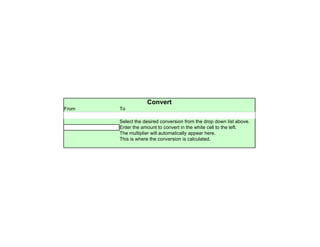
Convert
From To
þÿAbampere <<<>>> Ampere
Select the desired conversion from the drop down list above.
Enter the amount to convert in the white cell to the left.
The multiplier will automatically appear here.
This is where the conversion is calculated.
17.
Right Triangle Solver
Enter ONLY TWO known pieces of information
Degrees
a b c Y Z
a=
b=
c=
X= 90
Y=
Z=
Degree Converter
Degrees entered as a decimal will be converted to Deg, Min, Sec
6 Degrees 6 6 Degrees
Y 0.42 Minutes 25 25 Minutes
Seconds 0.00 Seconds
c 6.42 Angle as a decimal
a NOTE: The Degree Converter above has
no influence on the Right Triangle
Z calculations.
X b
18.
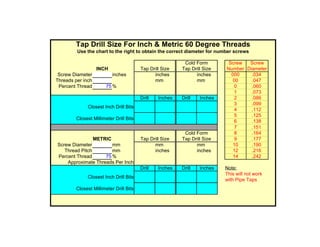
Tap Drill SizeFor Inch & Metric 60 Degree Threads
Use the chart to the right to obtain the correct diameter for number screws
Cold Form Screw Screw
INCH Tap Drill Size Tap Drill Size Number Diameter
Screw Diameter inches inches inches 000 .034
Threads per inch mm mm 00 .047
Percent Thread 75 % 0 .060
1 .073
Drill Inches Drill Inches 2 .086
3 .099
Closest Inch Drill Bits
4 .112
5 .125
Closest Millimeter Drill Bits
6 .138
7 .151
Cold Form 8 .164
METRIC Tap Drill Size Tap Drill Size 9 .177
Screw Diameter mm mm mm 10 .190
Thread Pitch mm inches inches 12 .216
Percent Thread 75 % 14 .242
Approximate Threads Per Inch
Drill Inches Drill Inches Note:
This will not work
Closest Inch Drill Bits
with Pipe Taps
Closest Millimeter Drill Bits
19.
Drill Bit Equivalence
Number
Decimal Fraction & Letter Millimeter
þÿ0.0059 97 0.15
Millimeter Decimal
þÿ0.15 0.01
Number Decimal
þÿ1 0.23
Fraction Decimal
þÿ1/64 0.02
Letter Decimal
þÿA 0.23
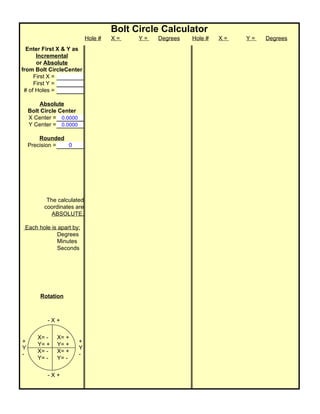
Bolt Circle Calculator
Hole # X= Y= Degrees Hole # X= Y= Degrees
Enter First X & Y as
Incremental
or Absolute
from Bolt CircleCenter
First X =
First Y =
# of Holes =
Absolute
Bolt Circle Center
X Center = 0.0000
Y Center = 0.0000
Rounded
Precision = 0
The calculated
coordinates are
ABSOLUTE.
Each hole is apart by:
Degrees
Minutes
Seconds
Rotation
-X+
X= - X= +
+ +
Y= + Y= +
Y Y
X= - X= +
- -
Y= - Y= -
-X+
23.
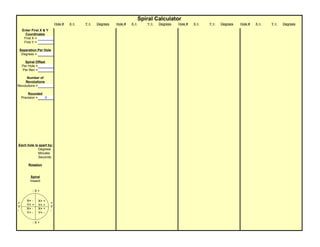
Spiral Calculator
Hole # X= Y= Degrees Hole # X= Y= Degrees Hole # X= Y= Degrees Hole # X= Y= Degrees
Enter First X & Y
Coordinates
First X =
First Y =
Seperation Per Hole
Degrees =
Spiral Offset
Per Hole =
Per Rev =
Number of
Revolutions
Revolutions =
Rounded
Precision = 0
Each hole is apart by:
Degrees
Minutes
Seconds
Rotation
Spiral
Inward
-X+
X= - X= +
+ +
Y= + Y= +
Y Y
X= - X= +
- -
Y= - Y= -
-X+
24.
Rotation of an" X & Y " coordinate
A negative Angle of Rotation is equal to a counter clockwise rotation
Original X = Degrees Move New X New Y
Original Y =
Angle of Rotation (in degrees) =
Number of times rotated = 1 15 max.
Rotating Axis Absolute X Center = 0.0000
Rotating Axis Absolute Y Center = 0.0000
- X +
NOTE:
The Original X & Y X= - X= +
should be entered + Y= + Y= + +
as INCREMENTAL, Y Y
taken from the - X= - X= + -
center of the Y= - Y= -
rotating axis.
The New X & Y will
be ABSOLUTE. - X +
25.
CONE FABRICATION
This will help you to layout a cone on a flat surface.
NOTE: This does not allow for material thickness.
Inside Outside Segment Segment Inside Outside Cone Cone
Radius Radius Angle Width Diameter Diameter Length Angle
Inside Diameter
Outside Diameter
Cone Angle
Cone Length
Segment Width
Degrees in Cone Segment 360
Overlap in Degrees 0
26.
Circle Segment Calculator
Enter TWO knowns
a c h r
Angle in degrees a=
Chord Length c=
Height h=
Radius r=
c
h
h
a r
27.
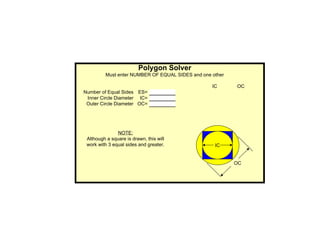
Polygon Solver
Must enter NUMBER OF EQUAL SIDES and one other
IC OC
Number of Equal Sides ES=
Inner Circle Diameter IC=
Outer Circle Diameter OC=
NOTE:
Although a square is drawn, this will
work with 3 equal sides and greater. IC IC
OC
28.
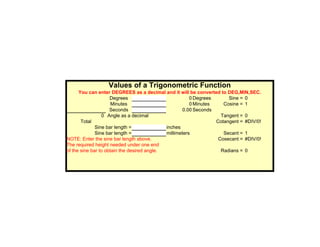
Values of aTrigonometric Function
You can enter DEGREES as a decimal and it will be converted to DEG,MIN,SEC.
Degrees 0 Degrees Sine = 0
Minutes 0 Minutes Cosine = 1
Seconds 0.00 Seconds
0 Angle as a decimal Tangent = 0
Total Cotangent = #DIV/0!
Sine bar length = inches
Sine bar length = millimeters Secant = 1
NOTE: Enter the sine bar length above. Cosecant = #DIV/0!
The required height needed under one end
of the sine bar to obtain the desired angle. Radians = 0


![[From www.metacafe.com] 1464063.7382717.1](https://cdn.slidesharecdn.com/ss_thumbnails/fromwww-metacafe-com1464063-7382717-1-100521064009-phpapp02-thumbnail.jpg?width=640&height=640&fit=bounds)
![[From www.metacafe.com] 1464063.7382717.1](https://cdn.slidesharecdn.com/ss_thumbnails/fromwww-metacafe-com1464063-7382717-1-100521074511-phpapp01-thumbnail.jpg?width=640&height=640&fit=bounds)


