This dissertation examines how the format of health risk information and cognitive cues can influence knowledge and behaviors related to heart disease prevention. A study was conducted using a 3x3 between-subjects factorial design to test the separate and combined effects of more readable heart disease risk information formats and cognitive cues about healthy eating on knowledge of heart disease risks, viewing nutrition facts before meal choices, and selecting healthier meals. The results showed that a more readable risk information format was associated with better understanding of heart disease risks. Cognitive cues about healthy eating increased viewing of nutrition facts and selection of healthier meals. Combining readable risk information and cognitive cues had the strongest effects on promoting prevention behaviors among college students.
![Decision
Making
&
Heart
Disease
48
two participants answered those questions and nothing further, and two others completed
the test of heart disease knowledge before dropping out. In all, 62 people dropped out
without completing the study. The remaining 360 participants all completed the research
protocol. Of the two experimental treatments, group sizes ranged from 97 to 132, and of
the nine possible experimental combinations, group sizes ranged from 31 to 51.
Apparatus and Materials
Stimuli were presented via PsychData, a survey application that enables users to
create and conduct web-based research. This tool is suitable for psychological surveys
and allows for anonymous response.
The first independent variable, Risk Format, was developed by writing two
versions of heart disease risk information (Appendix B and C). Information was focused
on heart disease and included a brief sub-section for women. A test of the readability of
these materials showed that it was written at the Flesch-Kincaid 9th
grade level of reading
ease.
The second independent variable, Cognitive Cue, was used in conjunction with
the meal choices. Participants were instructed, “Before making your choice: think of
some reasons why your preference would benefit your [present/future] state of wellbeing
and list those reasons here.”
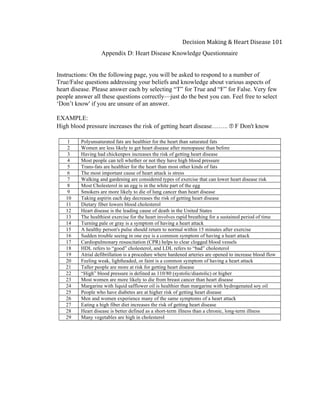
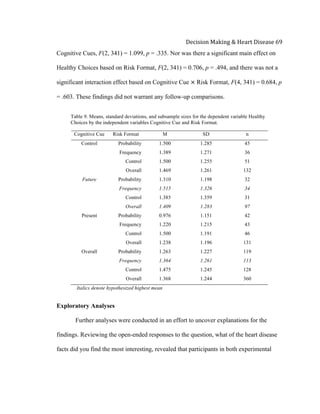
There were seven measures used in this study, one with four distinct factors: HD
Knowledge, View Nutrition Facts, and Healthy Choices were measured as dependent
variables and Future Risk, Body Mass Index (BMI), Future Vitality, and Impulsivity](https://image.slidesharecdn.com/e7ac1084-773d-4f53-b1f7-02a923ee0448-160427172352/85/AlisonKIrvine_Dissertation2016-52-320.jpg)
![Decision
Making
&
Heart
Disease
72
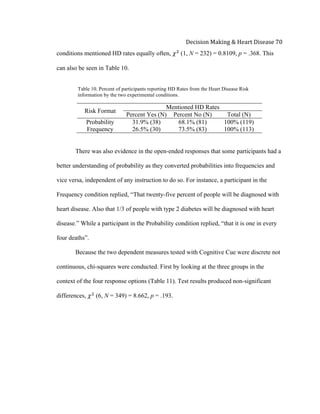
After recoding for simplification (0 = Never choose a healthy meal, 1 = chose at least one
healthy meal) it was found that a greater percentage of people in the Future Cue (62.5%)
versus Present Cue (61.5%) chose at least one healthy meal, but again these differences
were not significant, 𝜒!
(1, N = 226) = 0.891, p = .497.
Responses to Cognitive Cues were also examined for possible explanations and
tested with chi-square. In reviewing the open-ended responses to the cues, think of some
reasons why your preference would benefit your [future/present] state of wellbeing and
list those reasons, two themes emerged. First, often times when people go out to eat they
are less concerned with health and more concerned with treating themselves or eating
something they “want”, this was mentioned in both conditions. Second, participants did
less well at abiding by the intention of their respective cue, some participants in the
Future Cue condition mentioned building muscle, a current state; conversely, some
participants in the Present Cue condition mentioned better eating habits for a healthier
heart, a future state.
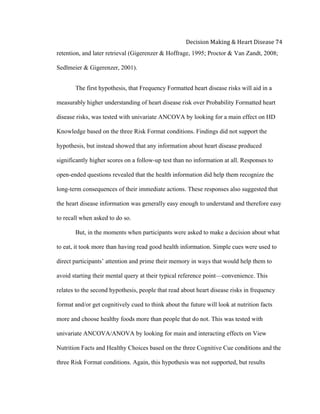
Yet, what proved promising were the mentions of heart disease based on the
different cues. In cuing participants, 77.1% mentioned variations of “Health” in their
responses regardless of the Cognitive Cue. Table 13 supports that there was a significant
difference in the percentage of participants that mentioned “Heart” and/or “Cholesterol”
in the Future Cue condition, participants mentioned these words significantly more than
in the Present Cue condition, 𝜒!
(1, N = 228) = 14.474, p = .0001.](https://image.slidesharecdn.com/e7ac1084-773d-4f53-b1f7-02a923ee0448-160427172352/85/AlisonKIrvine_Dissertation2016-76-320.jpg)