National Education Society®
JNNCollege of Engineering, Shivamogga
Dept. of Information Science and Engineering
03/20/2025 Alogrithm Visualizer 1
Project(21ISP78) presentation on
“Algorithm Visualizer With Tkinter And Pygame”
Under Guidance of :
Dr. Deepa V B BE, M.Tech,Ph.D
Assistant Professor
Presented By :
Shashank H – 4JN21IS091
Shreyas N Gatti– 4JN21IS097
Suchin N H – 4JN21IS108
Chandan B K – 4JN22IS401
2.
Contents
03/20/2025 Alogrithm Visualizer2
1. Introduction
2. Literature Survey
3. Problem Description
4. Objectives
5. System Design & Architecture
6. Results and Analysis
7. Conclusion
8. References
3.
1. Introduction
03/20/2025 AlogrithmVisualizer 3
• In the rapidly evolving world of technology, algorithms form the backbone of most computational
systems. From sorting large datasets to finding the shortest path in a network, algorithms drive
efficiency, making them indispensable to computer science and software development.
• Algorithm Visualizer covers a wide range of algorithms and data structures, including searching
algorithm, sorting algorithms, tree algorithms, and graph algorithms, among others. The platform is
constantly being updated with new algorithms and features to ensure that users have access to the
latest tools and techniques for learning and understanding algorithms.
4.
• The goalof Algorithm Visualizer is to provide a more accessible and intuitive way to understand
complex algorithms. By providing interactive visualizations and real-time code explanations, users
can develop a deeper understanding of how algorithms works and how they can be applied to solve
different problems. The platform also includes customization options that allow users to adjust
parameters and inputs to enhance their understanding of the algorithms.
• There are some platform uses visualization like Python Tutor, Visualgo, GeeksforGeeks, Sorting At,
Visualgo on GitHub, CodeChef etc.
1. Introduction
03/20/2025 Alogrithm Visualizer 4
5.
2. Literature Survey
03/20/2025Alogrithm Visualizer 5
[1]. “ALGORITHM VISUALIZATION – MODERN WEB-BASED VISUALIZATION OF SORTING
AND SEARCHING ALGORITHMS”
Author: Ashish Kumari, Manav Mittal, Vipul Jha, Abhishek Sahu, Manish Kumar, Neeti Sangwan.
Year of Publication: 2022
Publisher: Mili Publications
Description of the work:
• An interactive tool to visualize the step-by-step execution of algorithms.
• Includes features like real-time visual feedback, comparison of algorithm efficiency, and user-
customizable inputs.
• Focuses on a variety of algorithms, including sorting, searching, and graph traversal.
6.
Advantages:
• Enhances understandingof complex algorithms through dynamic visualizations.
• Simplifies learning by providing real-time feedback and practical insights.
• User-friendly interface supports customization, making it adaptable for students and
educators.
Disadvantages:
• Limited scope for real-world scalability as visualizations may be restricted to smaller datasets.
• Limited to predefined algorithms, restricting exploration of user-defined ones.
• May require prior basic knowledge of algorithms to use effectively.
2. Literature Survey
03/20/2025 Alogrithm Visualizer 6
7.
2. Literature Survey
03/20/2025Alogrithm Visualizer 7
[2]. “REVIEW PAPER ON ALGORITHM VISUALIZER”
Author : Rohit L, Ritesh B. Barure, Gajanan S. Sawant, Prof. Laxmikant Malphedwar.
Year of Publication : 2022
Publisher: International Research Journal of Modernization in Engineering Technology and Science.
Description of the work :
• Algorithm visualizers are educational tools that simplify the understanding of algorithms such as
sorting, searching, and pathfinding through graphical representation.
• Focuses on enhancing comprehension for students and assisting educators in teaching core concepts
of algorithms and data structures.
8.
Advantages:
• Interactive visualshold students' attention better than theoretical methods.
• Improved Learning:
• Enables active participation, leading to better retention of concepts.
• Facilitates independent exploration and understanding of algorithm behavior.
Disadvantages:
• Limited Scope: Current visualizers may lack features for comprehensive engagement,
especially for advanced algorithms.
• Implementation Challenges: Developing intuitive and effective interaction mechanisms can be
complex.
2. Literature Survey
03/20/2025 Alogrithm Visualizer 8
9.
2. Literature Survey
03/20/2025Alogrithm Visualizer 9
[3]. “VISUAL RENDERING OF PATH FINDING ALGORITHM”
Author : Akash Athare, Omkar Gulave, Divvij Jaitly, Akshay Sharma, Prof. R. S. Waghole.
Year of Publication : 2023
Publisher: International Journal of Creative Research Thoughts (IJCRT)
Description of the work :
• Algorithm visualization is a tool designed to graphically demonstrate the step-by-step execution of
algorithms such as Breadth-First Search (BFS), Depth First Search (DFS), Dijkstra’s.
• Designed to be user-friendly, allowing students to experiment with algorithms on custom datasets.
10.
Advantages:
• Improves Comprehension:Makes complex algorithms easier to understand by showing their
working visually.
• Customizable: Supports various algorithms and allows input customization, enhancing
flexibility in learning.
Disadvantages:
• Limited Complexity: Current tools often focus on basic algorithms, limiting their usefulness
for advanced concepts.
• High Resource Dependency: Interactive visualizations may require significant computational
power for large datasets.
2. Literature Survey
03/20/2025 Alogrithm Visualizer 10
11.
2. Literature Survey
03/20/2025Alogrithm Visualizer 11
[4]. “VISUALIZER FOR ALGORITHMS AND PATH FINDING WITH USER INTERFACE DESIGN ”
Author : Leena I. Sakri, Deepa Bendigeri, Sachin Joshi, Arpita Hiremagadi, Pooja Gurumurti.
Year of Publication : 2023
Publisher: International Journal for Research in Applied Science & Engineering Technology (IJRASET)
Description of the work :
The project bridges the gap between theoretical understanding and practical application of
algorithms, offering an innovative approach to mastering fundamental programming concepts.
12.
Advantages:
• User-Friendly Interface:The design allows easy navigation and operation for users.
• Adjustable Learning Speed: Users can control the animation speed to suit their learning pace
(slow, medium, or fast).
Disadvantages:
• Limited Scope: Focuses primarily on educational purposes and lacks direct application in real-
world problem-solving.
• Resource Intensive: Animations and real-time updates may demand more system resources,
limiting its use on low-end devices.
2. Literature Survey
03/20/2025 Alogrithm Visualizer 12
13.
2. Literature Survey
03/20/2025Alogrithm Visualizer 13
[5]. “GRAPH ALGORITHM VISUALIZER”
Author : Sarvesh Arora, Dr. K. C. Tripathi, Dr. M. L. Sharma.
Year of Publication : 2022
Publisher: Iconic Research And Engineering Journals
Description of the work :
The "Graph Algorithm Visualizer" is a web application designed to simplify the understanding
and teaching of graph algorithms like Dijkstra’s, A*, Breadth-First Search (BFS), Depth-First Search
(DFS), and more. It offers an interactive 2D grid where users can visualize pathfinding in real-time. The
application aims to enhance learning by providing hands-on experience and visual aids, making
algorithms engaging and easier to grasp.
14.
Advantages:
• Interactive Learning:Provides a hands-on platform to explore and understand graph
algorithms visually.
• User-Friendly: The web app is intuitive, suitable for users of all ages.
• Enhanced Understanding: Helps in better retention and comprehension of complex algorithms.
Disadvantages:
• Limited Algorithms: Currently supports only a few graph algorithms.
• Resource-Intensive Development: Requires specialized skills to create and expand
visualizations.
• Accessibility Constraints: May require reliable internet access and compatible devices.
2. Literature Survey
03/20/2025 Alogrithm Visualizer 14
15.
• This projectaddresses the problem by developing an interactive algorithm visualization
platform that allows users to observe how various algorithms function in real-time. The
platform will visually demonstrate the step-by-step execution of different types of algorithms,
including sorting, searching, and pathfinding algorithms.
• The visualizations will include key operations such as element comparisons, swaps, and node
traversals, displayed through animations that depict the algorithm's progress on a dataset.
• This project is aimed at students, educators, and anyone looking to gain a deeper
understanding of algorithms. By allowing users to experiment with different algorithms and
observe how they work under various conditions.
3. Problem Description
03/20/2025 Alogrithm Visualizer 15
16.
Problem statement:
Aim ofthis project is to design and develop an interactive tool, Algorithm Visualizer, to
provide step-by-step visualizations of algorithmic processes, enabling learners to better
understand the behavior, decision-making and efficiency of various algorithms. The tool will
bridge the gap between theoretical concepts and practical application by dynamically
visualizing data manipulation and optimization techniques in real-time, aiding students and
educators in mastering complex algorithms effectively.
3. Problem Description
03/20/2025 Alogrithm Visualizer 16
17.
The objectives ofthe proposed work are to design and develop methods:
1. Integrate various algorithms, such as sorting and searching for visualization.
2. Develop an interactive and dynamic visualization framework using Python libraries like Tkinter and
Pygame.
3. Enable real-time feedback with comparative analysis of algorithm efficiency.
4. Deploy an accessible and user-friendly tool for educators and learners to enhance computer science
education.
4. Objectives
03/20/2025 Alogrithm Visualizer 17
18.
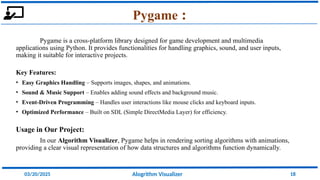
Pygame is across-platform library designed for game development and multimedia
applications using Python. It provides functionalities for handling graphics, sound, and user inputs,
making it suitable for interactive projects.
Key Features:
• Easy Graphics Handling – Supports images, shapes, and animations.
• Sound & Music Support – Enables adding sound effects and background music.
• Event-Driven Programming – Handles user interactions like mouse clicks and keyboard inputs.
• Optimized Performance – Built on SDL (Simple DirectMedia Layer) for efficiency.
Usage in Our Project:
In our Algorithm Visualizer, Pygame helps in rendering sorting algorithms with animations,
providing a clear visual representation of how data structures and algorithms function dynamically.
Pygame :
03/20/2025 Alogrithm Visualizer 18
19.
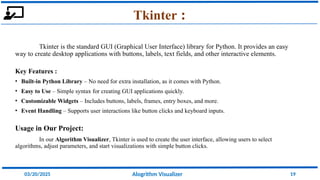
Tkinter is thestandard GUI (Graphical User Interface) library for Python. It provides an easy
way to create desktop applications with buttons, labels, text fields, and other interactive elements.
Key Features :
• Built-in Python Library – No need for extra installation, as it comes with Python.
• Easy to Use – Simple syntax for creating GUI applications quickly.
• Customizable Widgets – Includes buttons, labels, frames, entry boxes, and more.
• Event Handling – Supports user interactions like button clicks and keyboard inputs.
Usage in Our Project:
In our Algorithm Visualizer, Tkinter is used to create the user interface, allowing users to select
algorithms, adjust parameters, and start visualizations with simple button clicks.
Tkinter :
03/20/2025 Alogrithm Visualizer 19
20.
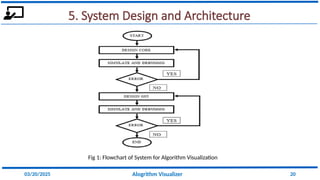
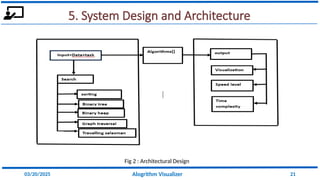
5. System Designand Architecture
03/20/2025 Alogrithm Visualizer 20
Fig 1: Flowchart of System for Algorithm Visualization
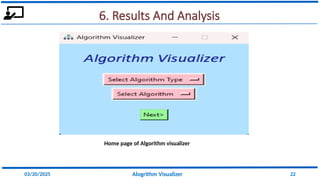
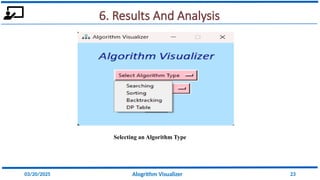
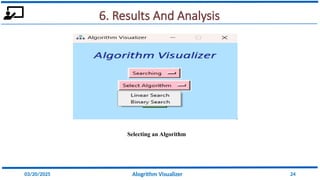
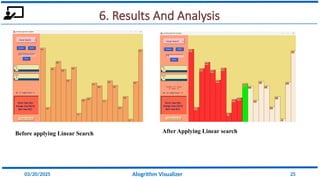
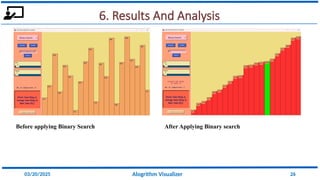
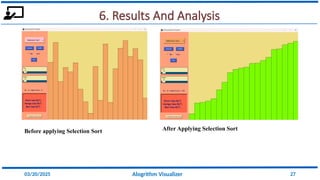
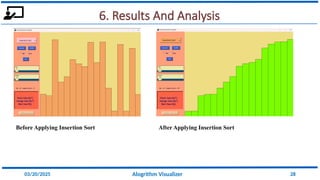
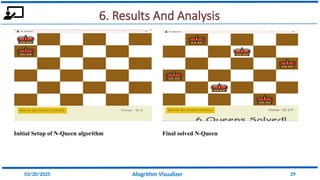
6. Results AndAnalysis
03/20/2025 Alogrithm Visualizer 29
Initial Setup of N-Queen algorithm Final solved N-Queen
30.
6. Conclusion
03/20/2025 AlogrithmVisualizer 30
The "Algorithm Visualizer" project bridges the gap between theoretical understanding and
practical application of algorithms by providing interactive, step-by-step visualizations.
This tool enhances learning, teaching, and comparative analysis of algorithms, making complex concepts
more accessible and engaging.
31.
7. References
03/20/2025 AlogrithmVisualizer 31
[1]. Ashish Kumari, Manav Mittal, Vipul Jha, Abhishek Sahu, “Algorithm Visualization – Modern Web-Based Visualization Of
Sorting And Searching Algorithms”, In Mili Publications, Vol. 21, No. 5, pp. 2721 – 2726, 2022.
[2]. Rohit L. Ugile, Ritesh B. Barure, Gajanan S. Sawant, “Review Paper On Algorithm Visualizer ”, In International Research
Journal of Modernization in Engineering Technology and Science, Vol. 04, No. 11, pp. 2582 – 5208, 2022.
[3]. Akash Athare, Omkar Gulave, Divvij Jaitly, Akshay Sharma, Prof. R. S. Waghole, “Visual Rendering Of Path Finding
Algorithm”, In International Journal of Creative Research Thoughts (IJCRT), Vol. 11, No. 5, pp. 2320 – 2882, 2023.
[4]. Leena I. Sakri, Deepa Bendigeri, Sachin Joshi, Arpita Hiremagadi, Pooja Gurumurti, “Visualizer For Algorithms And Path
Finding With User Interface Design ”, In International Journal for Research in Applied Science & Engineering Technology
(IJRASET), Vol. 11, No. 05, pp. 2321 – 9653, 2023.
[5]. Sarvesh Arora, Dr. K. C. Tripathi, Dr. M. L. Sharma, “Graph Algorithm Visualizer”, In Iconic Research And Engineering
Journals, Vol. 06, No. 06, pp. 2456 – 8880, 2022.

![2. Literature Survey
03/20/2025 Alogrithm Visualizer 5
[1]. “ALGORITHM VISUALIZATION – MODERN WEB-BASED VISUALIZATION OF SORTING
AND SEARCHING ALGORITHMS”
Author: Ashish Kumari, Manav Mittal, Vipul Jha, Abhishek Sahu, Manish Kumar, Neeti Sangwan.
Year of Publication: 2022
Publisher: Mili Publications
Description of the work:
• An interactive tool to visualize the step-by-step execution of algorithms.
• Includes features like real-time visual feedback, comparison of algorithm efficiency, and user-
customizable inputs.
• Focuses on a variety of algorithms, including sorting, searching, and graph traversal.](https://image.slidesharecdn.com/batch-15-250320093631-4b573d2d/85/Algorithm-visualization-using-pygame-and-tkinter-5-320.jpg)
![2. Literature Survey
03/20/2025 Alogrithm Visualizer 7
[2]. “REVIEW PAPER ON ALGORITHM VISUALIZER”
Author : Rohit L, Ritesh B. Barure, Gajanan S. Sawant, Prof. Laxmikant Malphedwar.
Year of Publication : 2022
Publisher: International Research Journal of Modernization in Engineering Technology and Science.
Description of the work :
• Algorithm visualizers are educational tools that simplify the understanding of algorithms such as
sorting, searching, and pathfinding through graphical representation.
• Focuses on enhancing comprehension for students and assisting educators in teaching core concepts
of algorithms and data structures.](https://image.slidesharecdn.com/batch-15-250320093631-4b573d2d/85/Algorithm-visualization-using-pygame-and-tkinter-7-320.jpg)
![2. Literature Survey
03/20/2025 Alogrithm Visualizer 9
[3]. “VISUAL RENDERING OF PATH FINDING ALGORITHM”
Author : Akash Athare, Omkar Gulave, Divvij Jaitly, Akshay Sharma, Prof. R. S. Waghole.
Year of Publication : 2023
Publisher: International Journal of Creative Research Thoughts (IJCRT)
Description of the work :
• Algorithm visualization is a tool designed to graphically demonstrate the step-by-step execution of
algorithms such as Breadth-First Search (BFS), Depth First Search (DFS), Dijkstra’s.
• Designed to be user-friendly, allowing students to experiment with algorithms on custom datasets.](https://image.slidesharecdn.com/batch-15-250320093631-4b573d2d/85/Algorithm-visualization-using-pygame-and-tkinter-9-320.jpg)
![2. Literature Survey
03/20/2025 Alogrithm Visualizer 11
[4]. “VISUALIZER FOR ALGORITHMS AND PATH FINDING WITH USER INTERFACE DESIGN ”
Author : Leena I. Sakri, Deepa Bendigeri, Sachin Joshi, Arpita Hiremagadi, Pooja Gurumurti.
Year of Publication : 2023
Publisher: International Journal for Research in Applied Science & Engineering Technology (IJRASET)
Description of the work :
The project bridges the gap between theoretical understanding and practical application of
algorithms, offering an innovative approach to mastering fundamental programming concepts.](https://image.slidesharecdn.com/batch-15-250320093631-4b573d2d/85/Algorithm-visualization-using-pygame-and-tkinter-11-320.jpg)
![2. Literature Survey
03/20/2025 Alogrithm Visualizer 13
[5]. “GRAPH ALGORITHM VISUALIZER”
Author : Sarvesh Arora, Dr. K. C. Tripathi, Dr. M. L. Sharma.
Year of Publication : 2022
Publisher: Iconic Research And Engineering Journals
Description of the work :
The "Graph Algorithm Visualizer" is a web application designed to simplify the understanding
and teaching of graph algorithms like Dijkstra’s, A*, Breadth-First Search (BFS), Depth-First Search
(DFS), and more. It offers an interactive 2D grid where users can visualize pathfinding in real-time. The
application aims to enhance learning by providing hands-on experience and visual aids, making
algorithms engaging and easier to grasp.](https://image.slidesharecdn.com/batch-15-250320093631-4b573d2d/85/Algorithm-visualization-using-pygame-and-tkinter-13-320.jpg)
![7. References
03/20/2025 Alogrithm Visualizer 31
[1]. Ashish Kumari, Manav Mittal, Vipul Jha, Abhishek Sahu, “Algorithm Visualization – Modern Web-Based Visualization Of
Sorting And Searching Algorithms”, In Mili Publications, Vol. 21, No. 5, pp. 2721 – 2726, 2022.
[2]. Rohit L. Ugile, Ritesh B. Barure, Gajanan S. Sawant, “Review Paper On Algorithm Visualizer ”, In International Research
Journal of Modernization in Engineering Technology and Science, Vol. 04, No. 11, pp. 2582 – 5208, 2022.
[3]. Akash Athare, Omkar Gulave, Divvij Jaitly, Akshay Sharma, Prof. R. S. Waghole, “Visual Rendering Of Path Finding
Algorithm”, In International Journal of Creative Research Thoughts (IJCRT), Vol. 11, No. 5, pp. 2320 – 2882, 2023.
[4]. Leena I. Sakri, Deepa Bendigeri, Sachin Joshi, Arpita Hiremagadi, Pooja Gurumurti, “Visualizer For Algorithms And Path
Finding With User Interface Design ”, In International Journal for Research in Applied Science & Engineering Technology
(IJRASET), Vol. 11, No. 05, pp. 2321 – 9653, 2023.
[5]. Sarvesh Arora, Dr. K. C. Tripathi, Dr. M. L. Sharma, “Graph Algorithm Visualizer”, In Iconic Research And Engineering
Journals, Vol. 06, No. 06, pp. 2456 – 8880, 2022.](https://image.slidesharecdn.com/batch-15-250320093631-4b573d2d/85/Algorithm-visualization-using-pygame-and-tkinter-31-320.jpg)