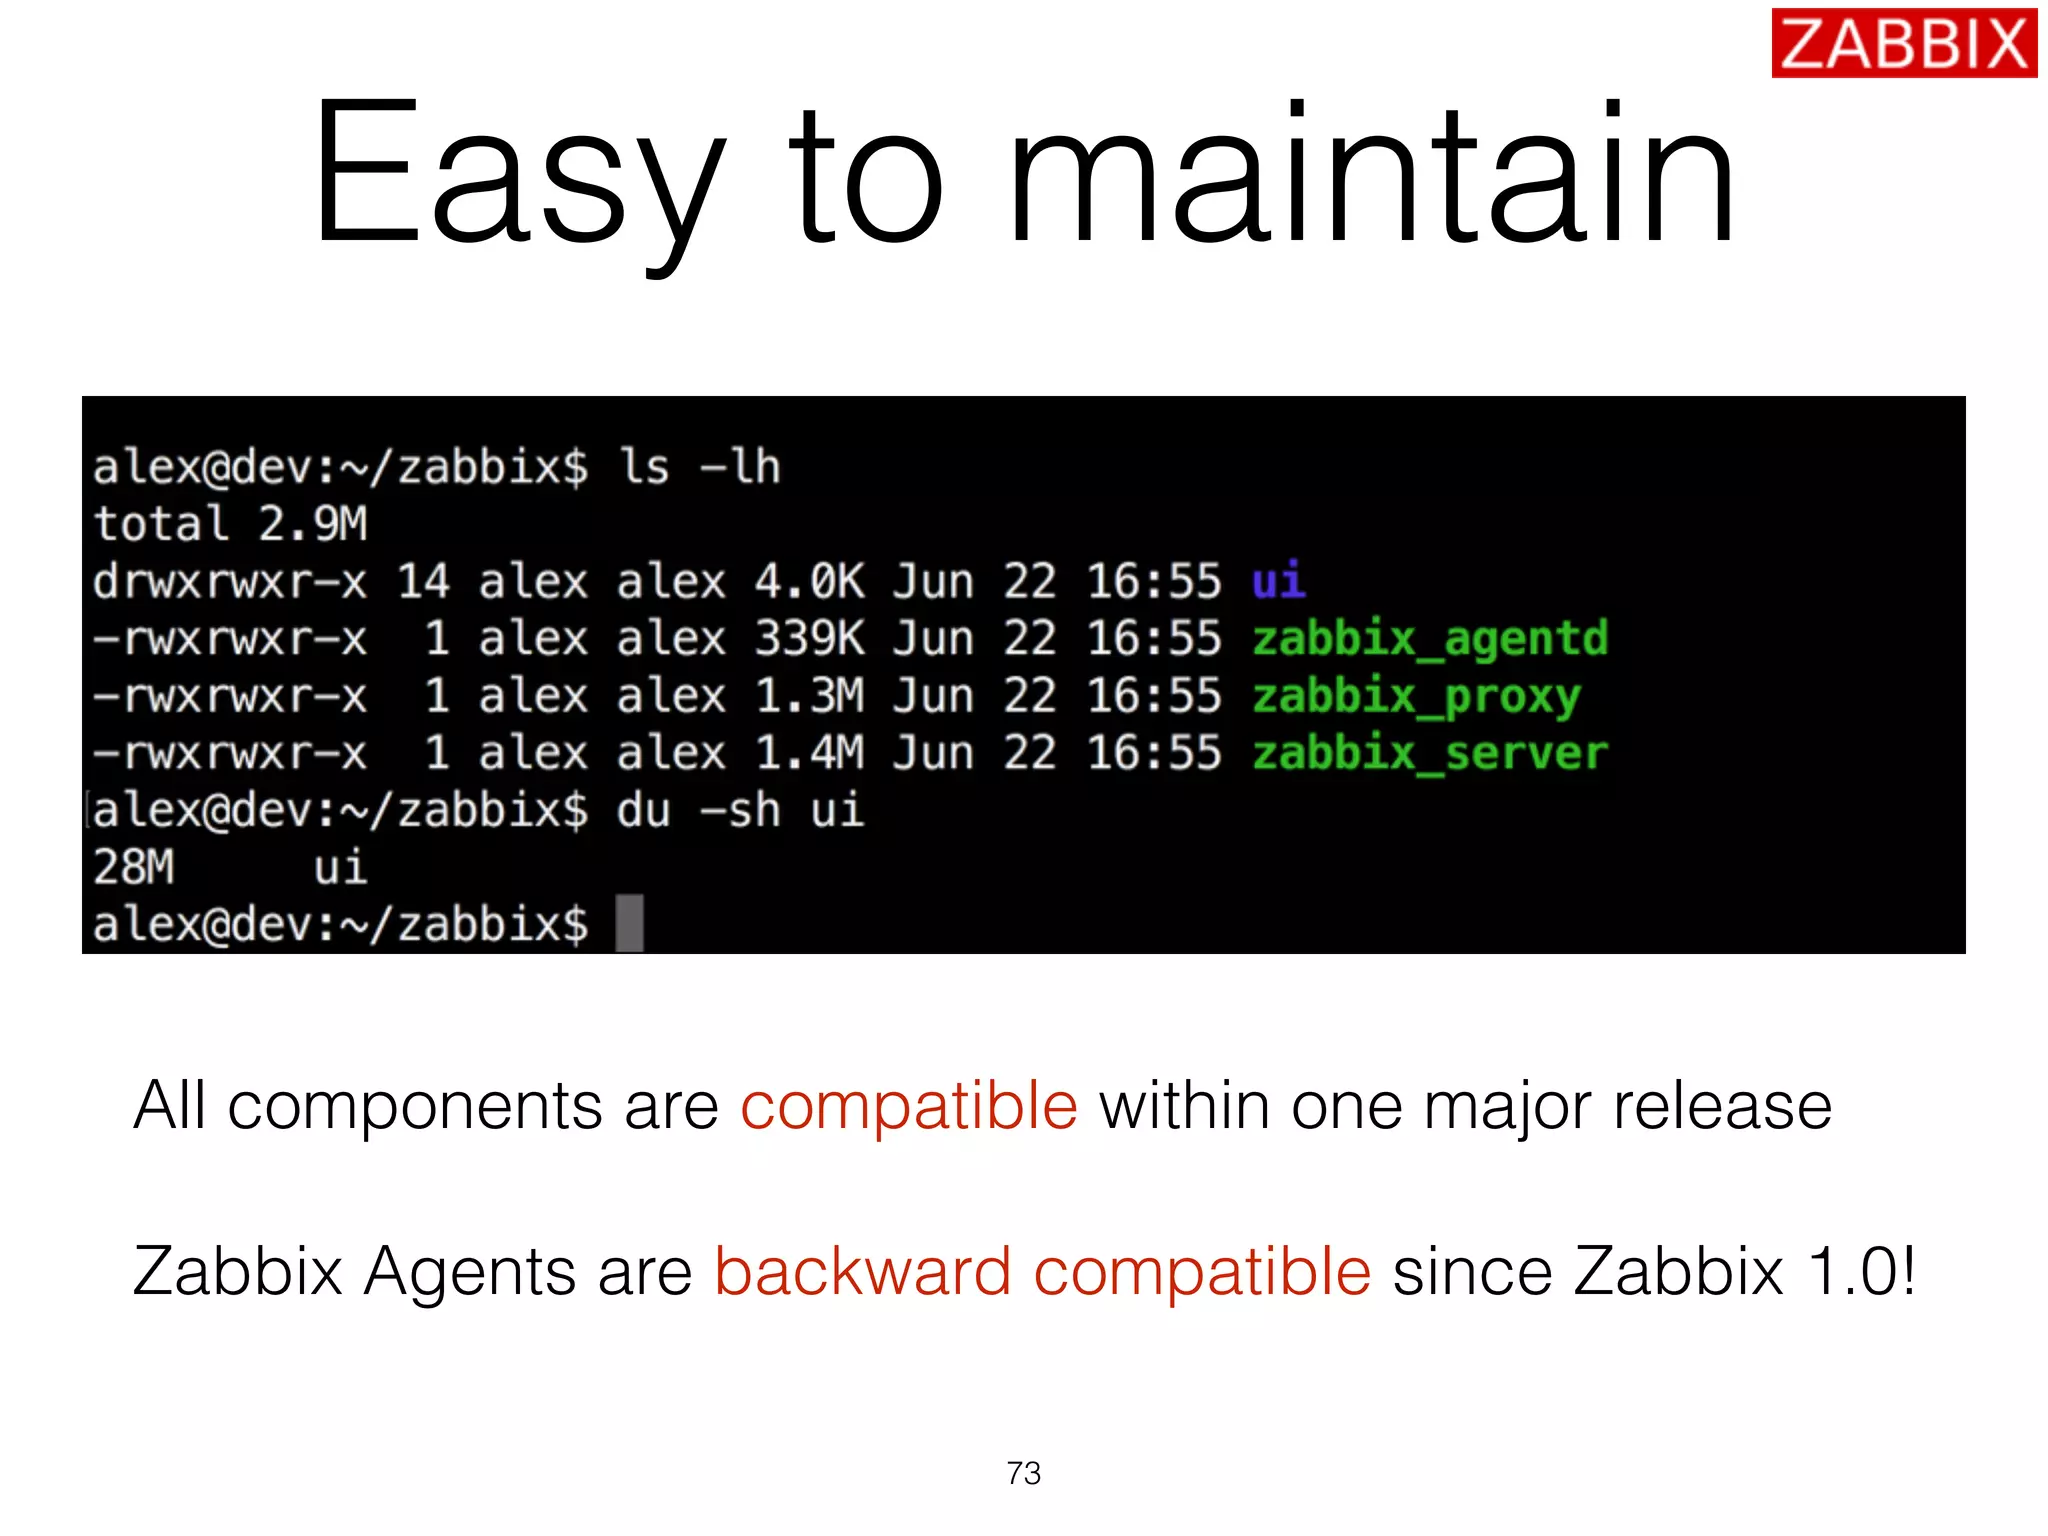
Downloaded 796 times

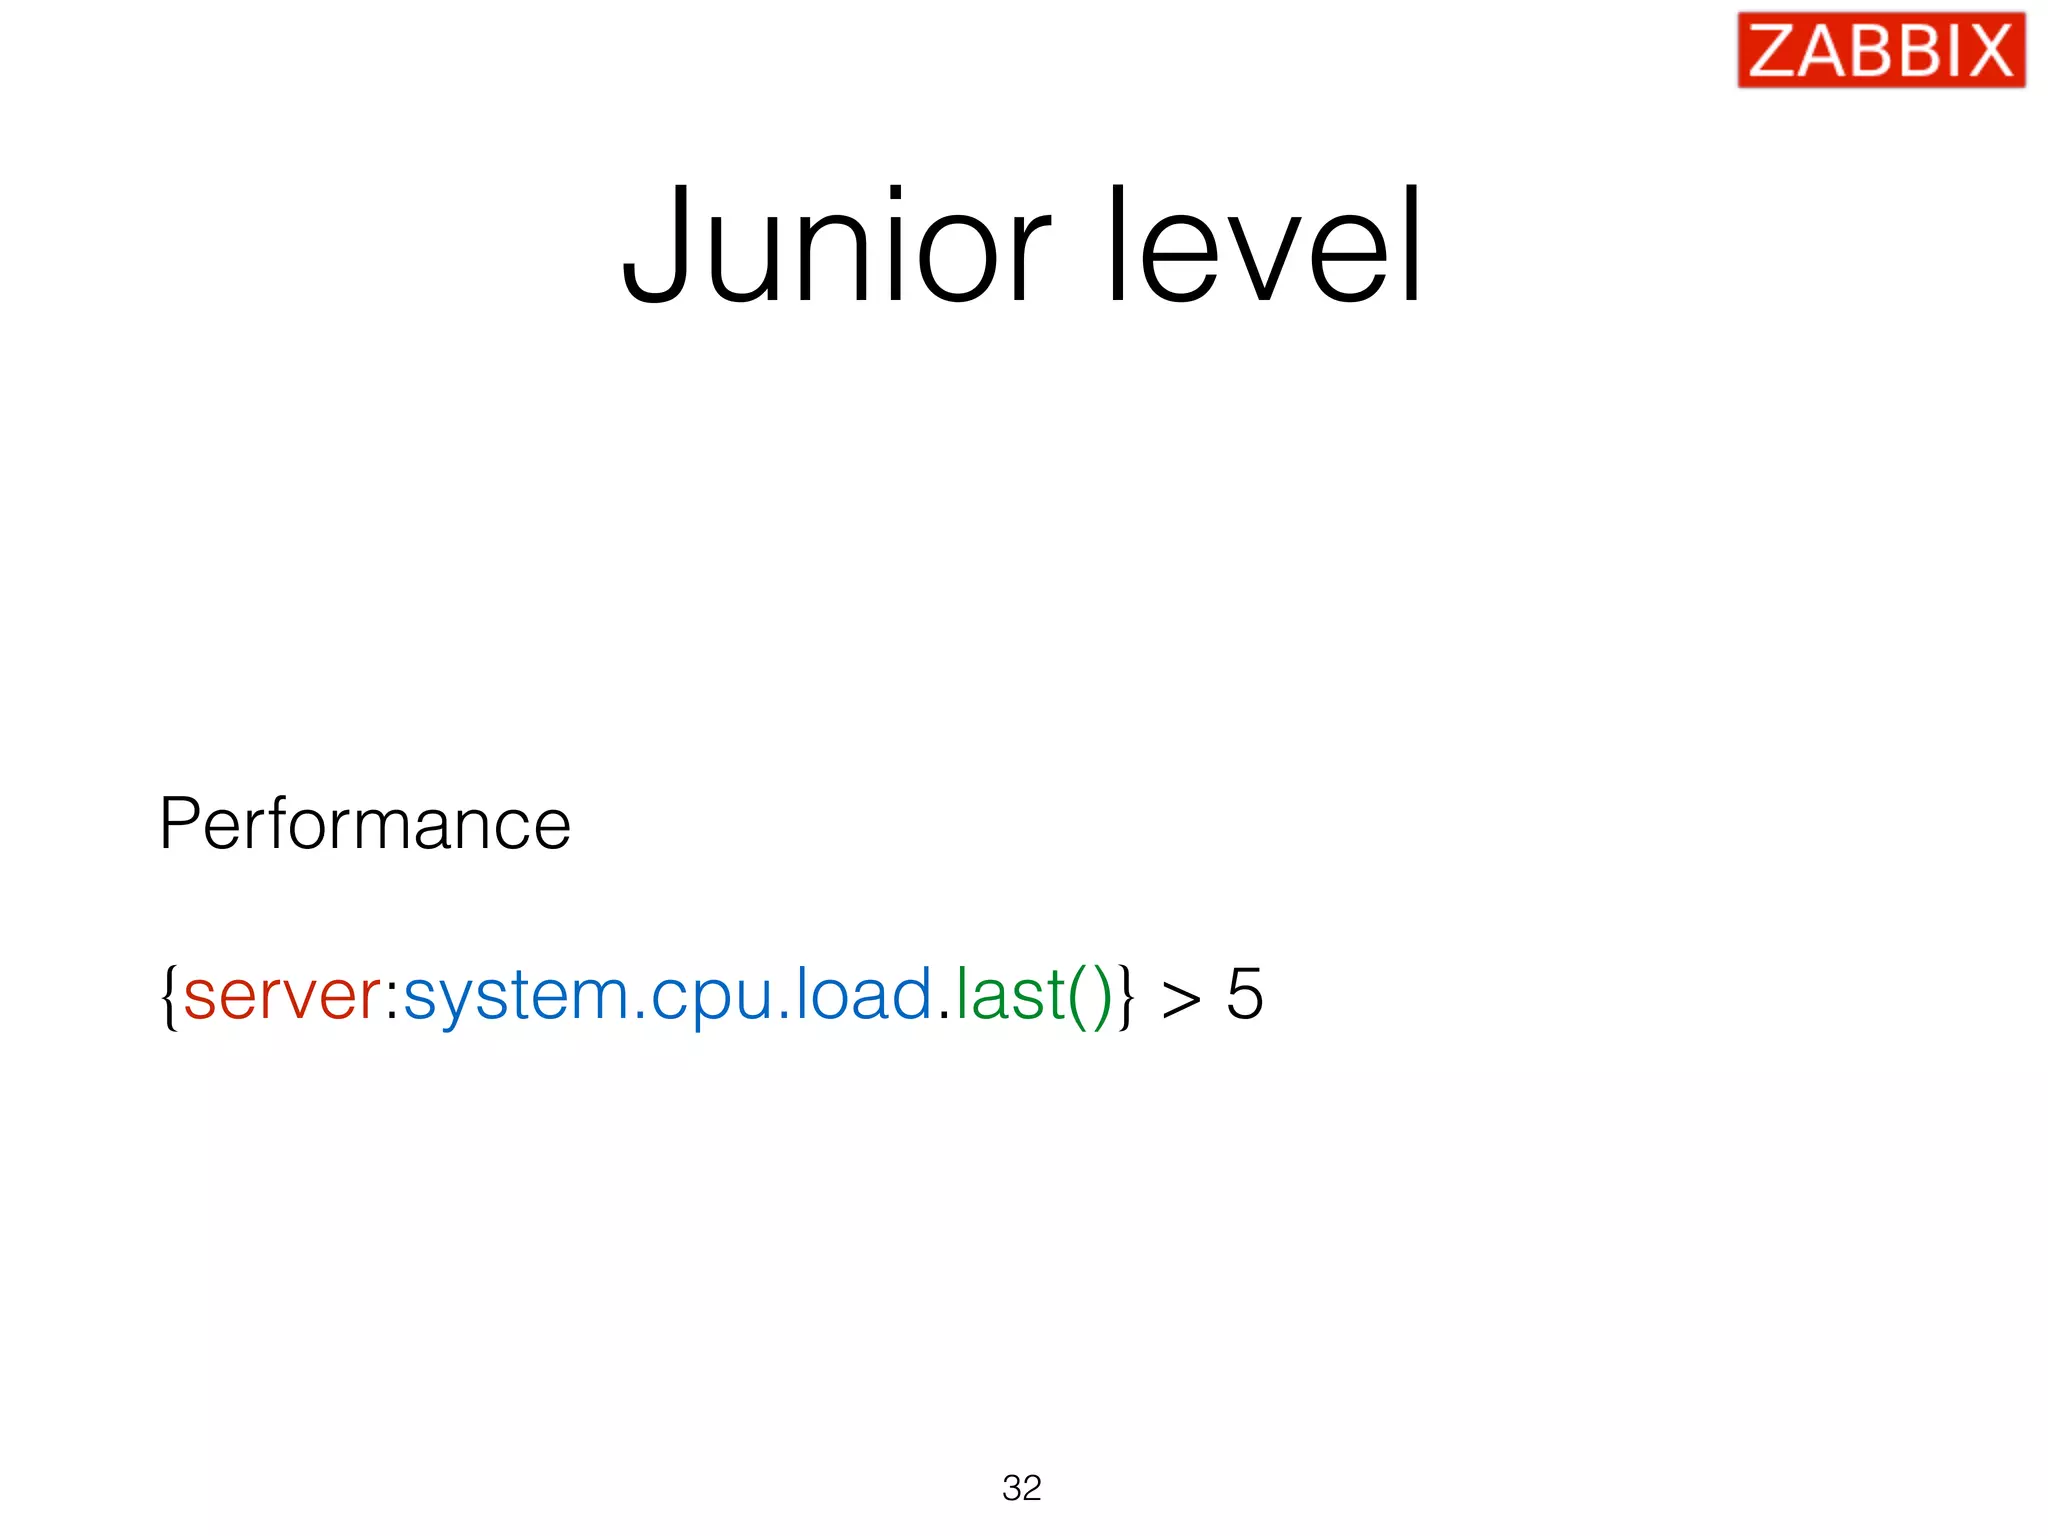
![Junior level
Availability
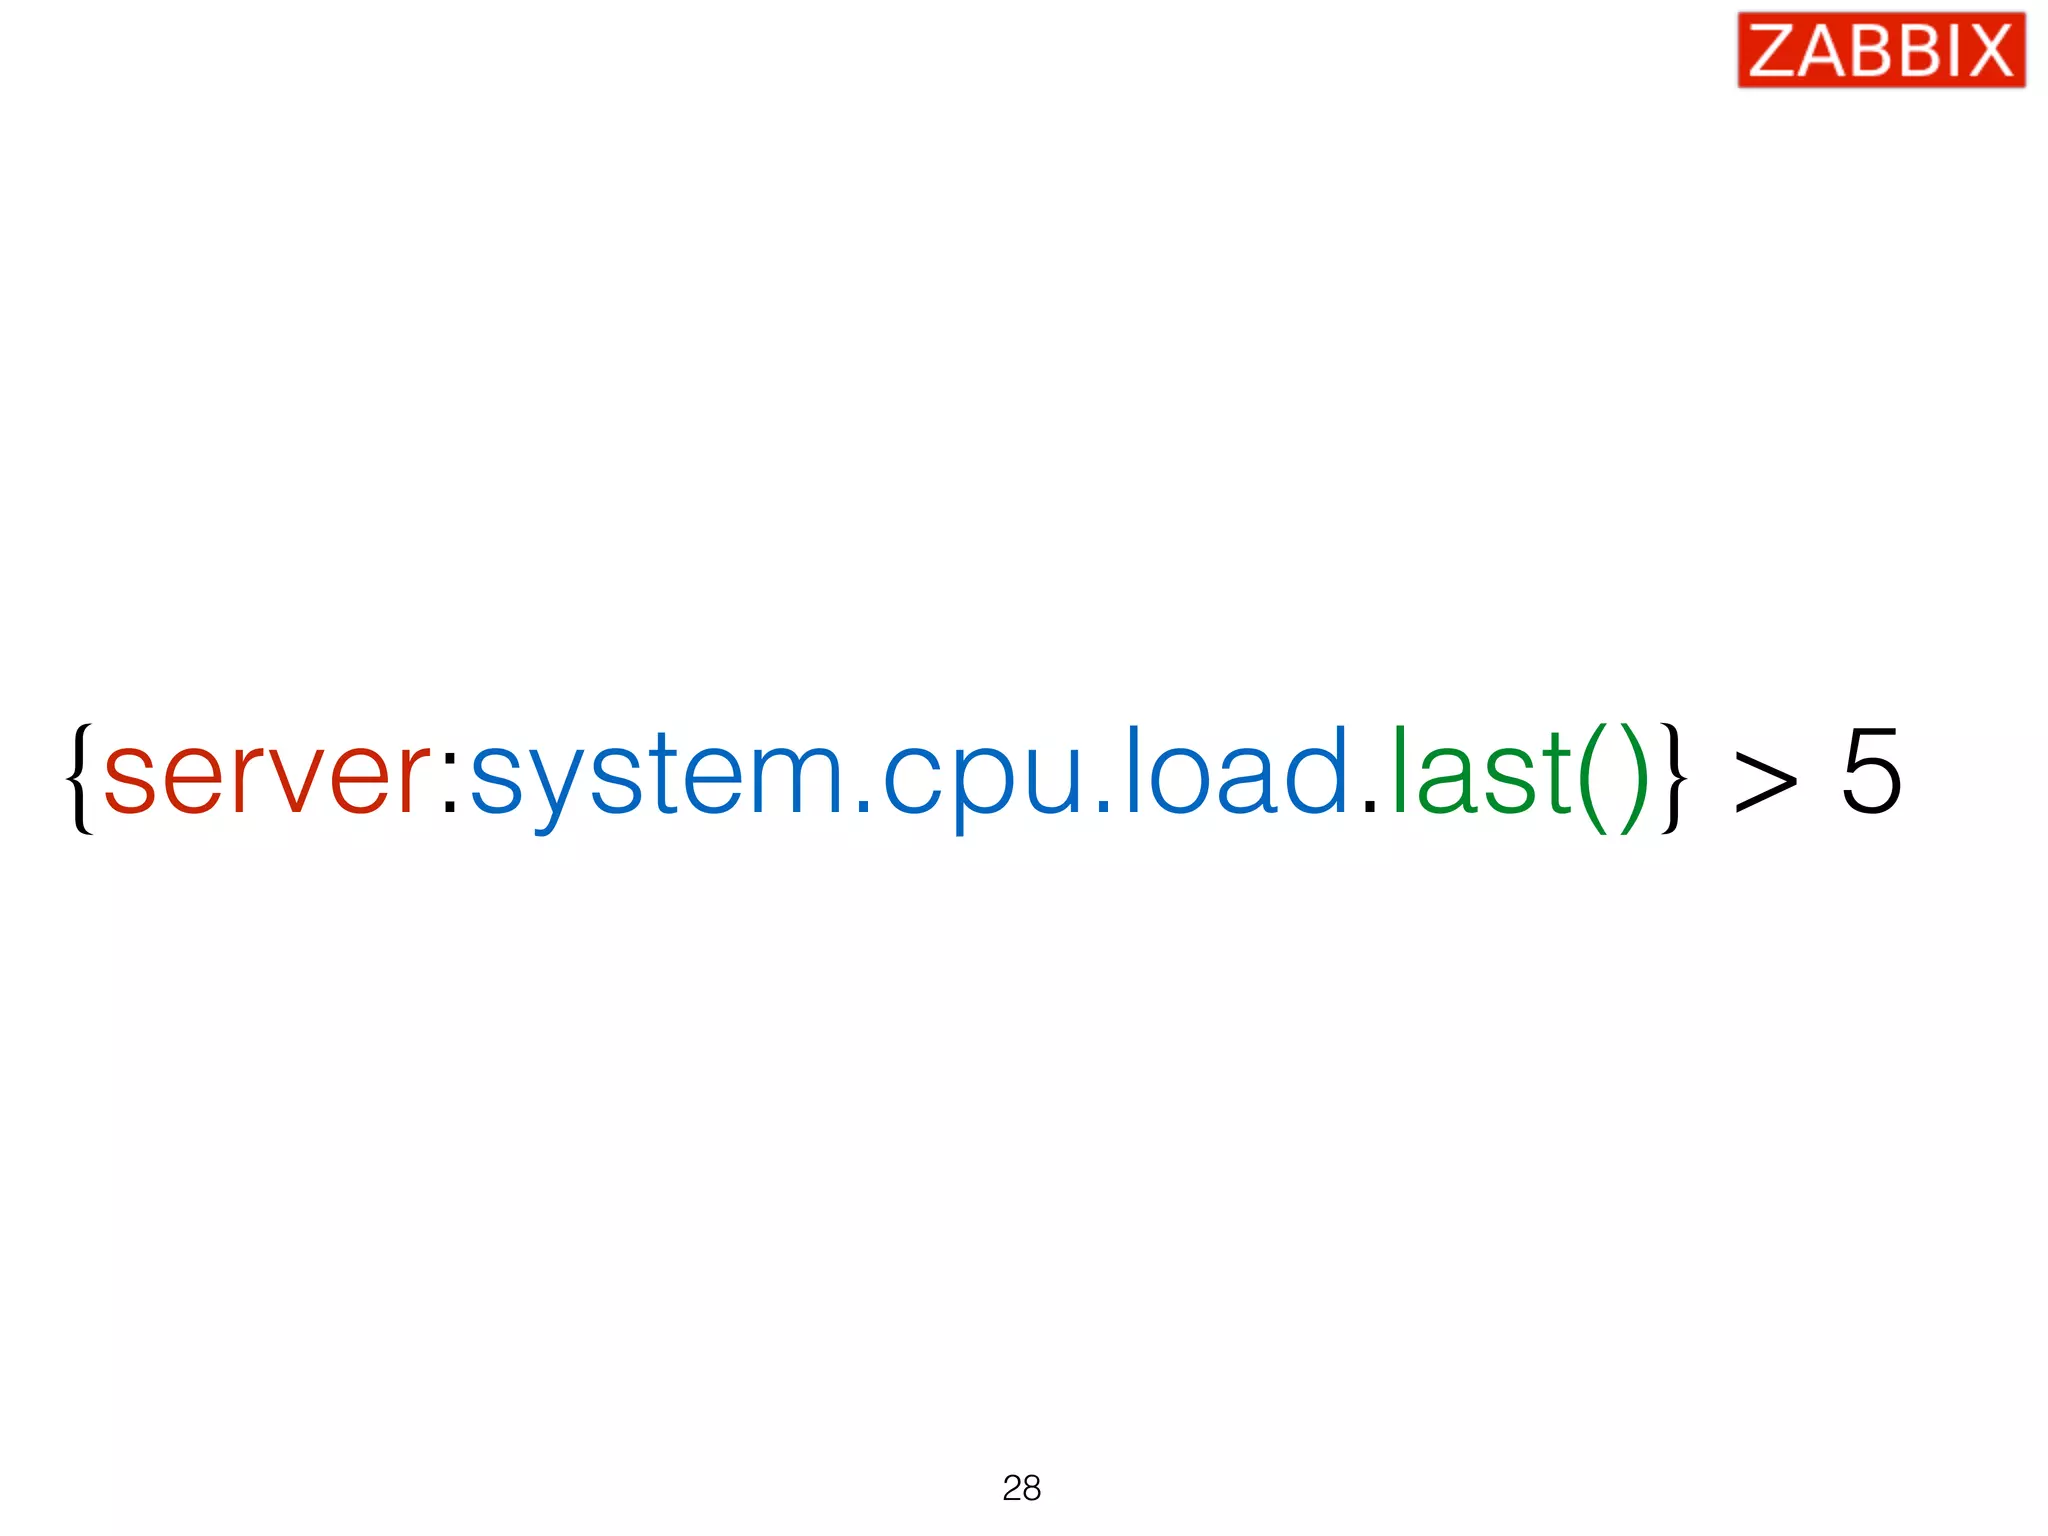
{server:net.tcp.service[http].last()} = 0
34](https://image.slidesharecdn.com/zabbix-monitoringsolutionforeveryone-160628094030/75/Alexei-Vladishev-Zabbix-Monitoring-Solution-for-Everyone-34-2048.jpg)
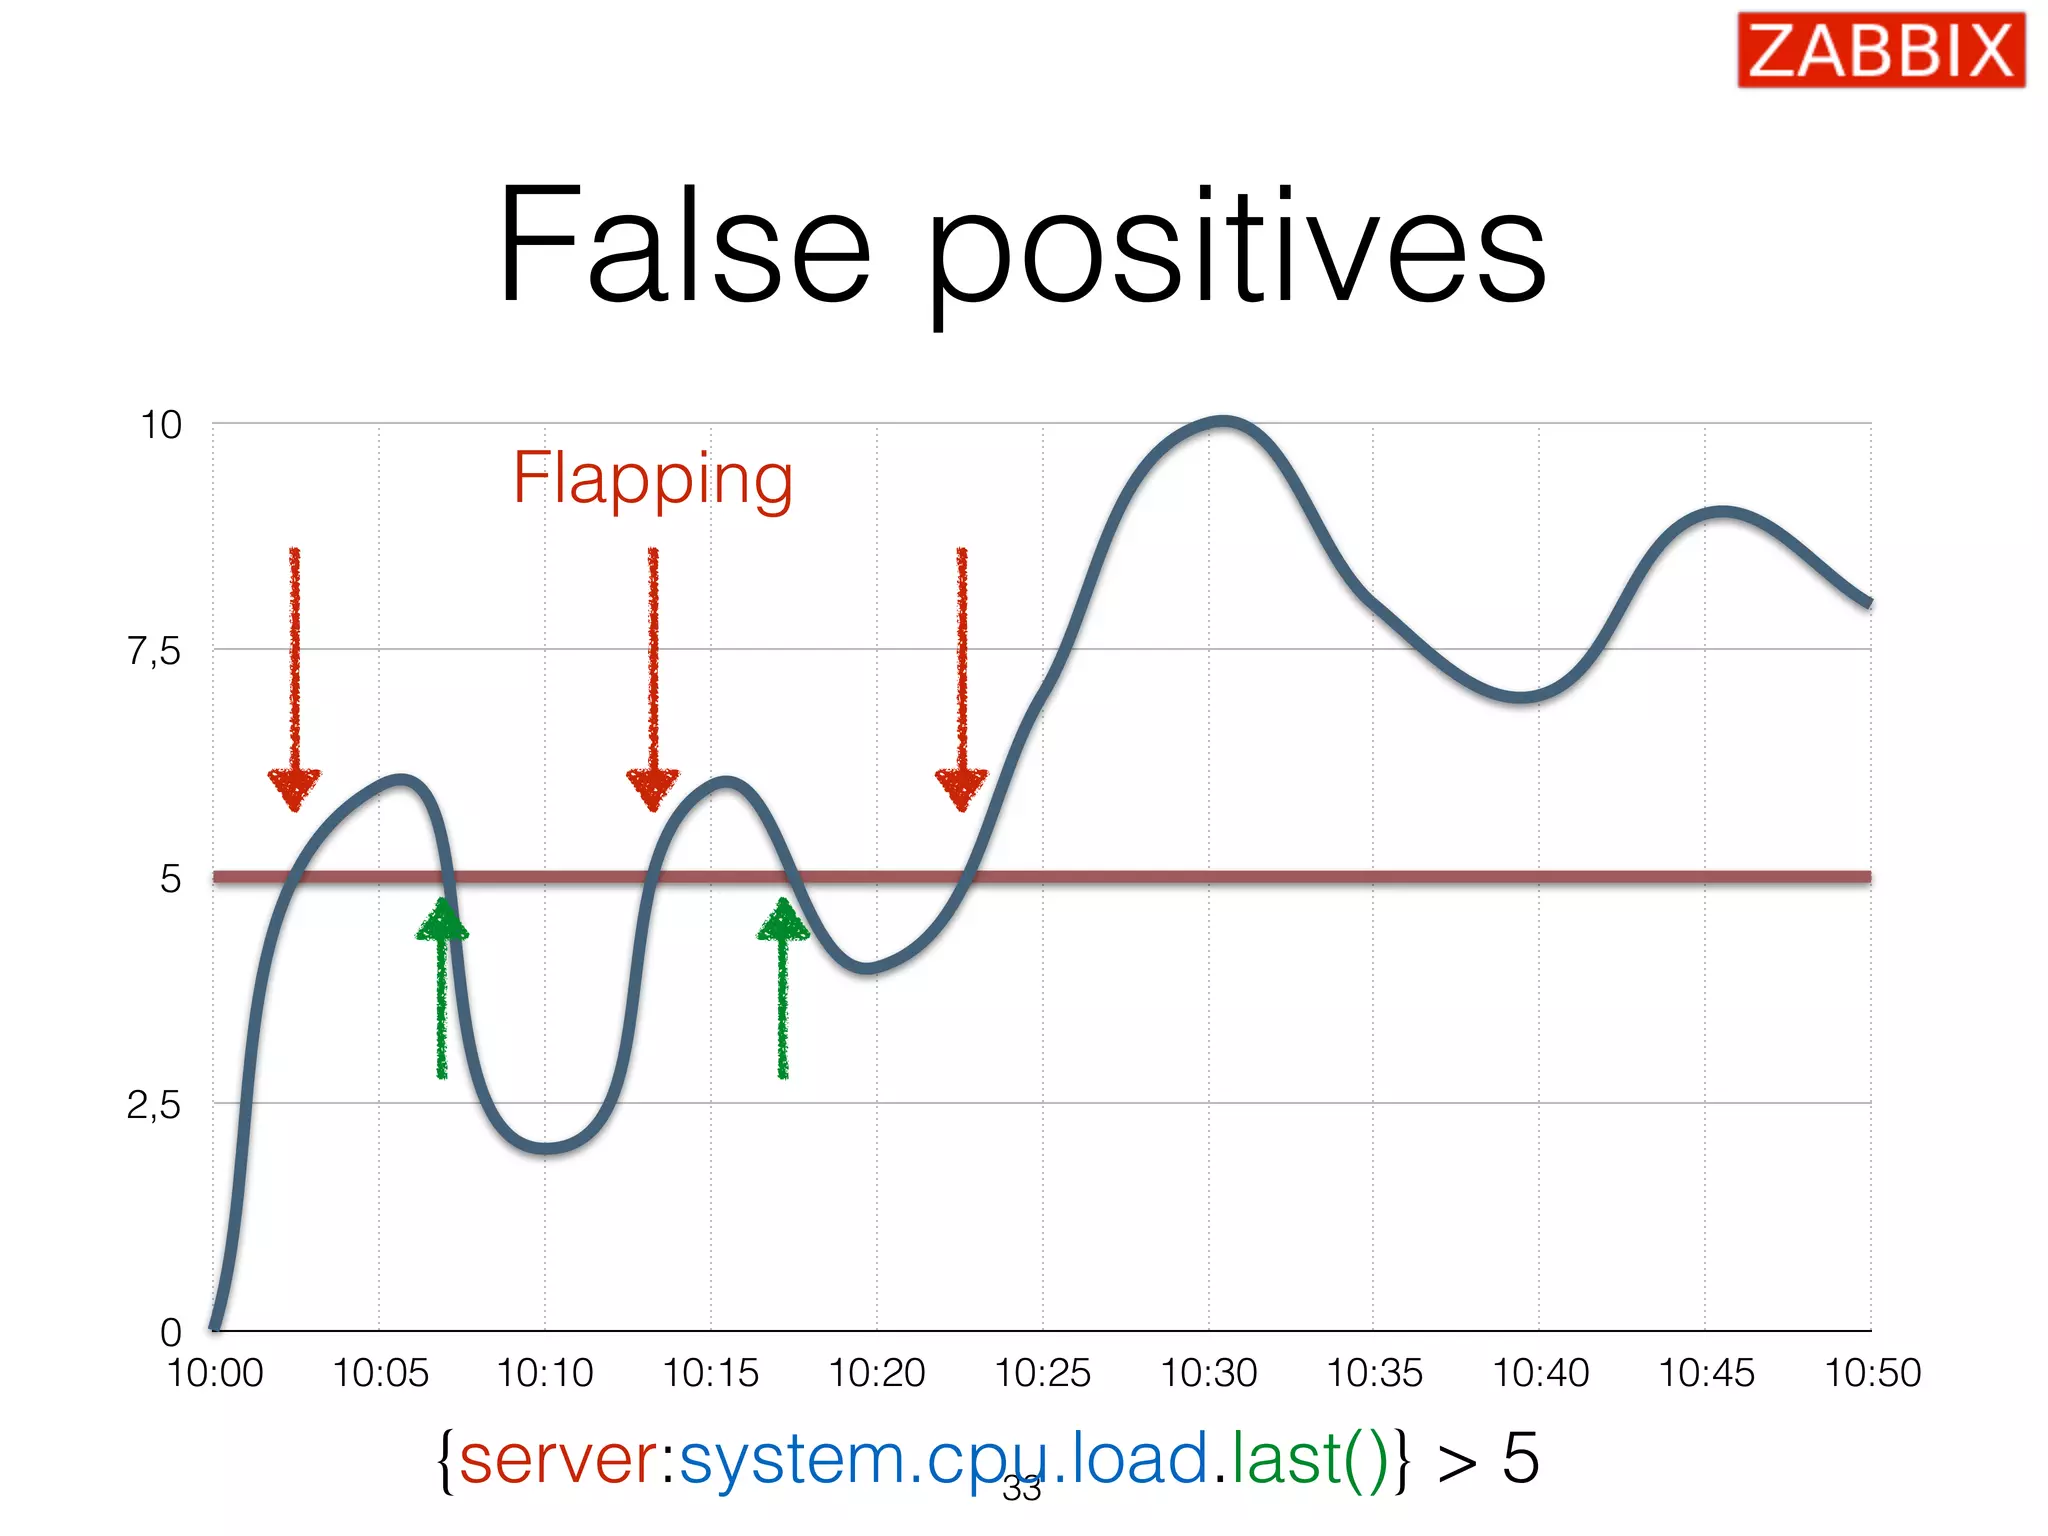
![Too sensitive
35
0
0,25
0,5
0,75
1
10:01 10:02 10:03 10:04 10:05 10:06 10:07 10:08 10:09 10:10 10:11 10:12 10:13 10:14
{server:net.tcp.service[http].last()} = 0](https://image.slidesharecdn.com/zabbix-monitoringsolutionforeveryone-160628094030/75/Alexei-Vladishev-Zabbix-Monitoring-Solution-for-Everyone-35-2048.jpg)
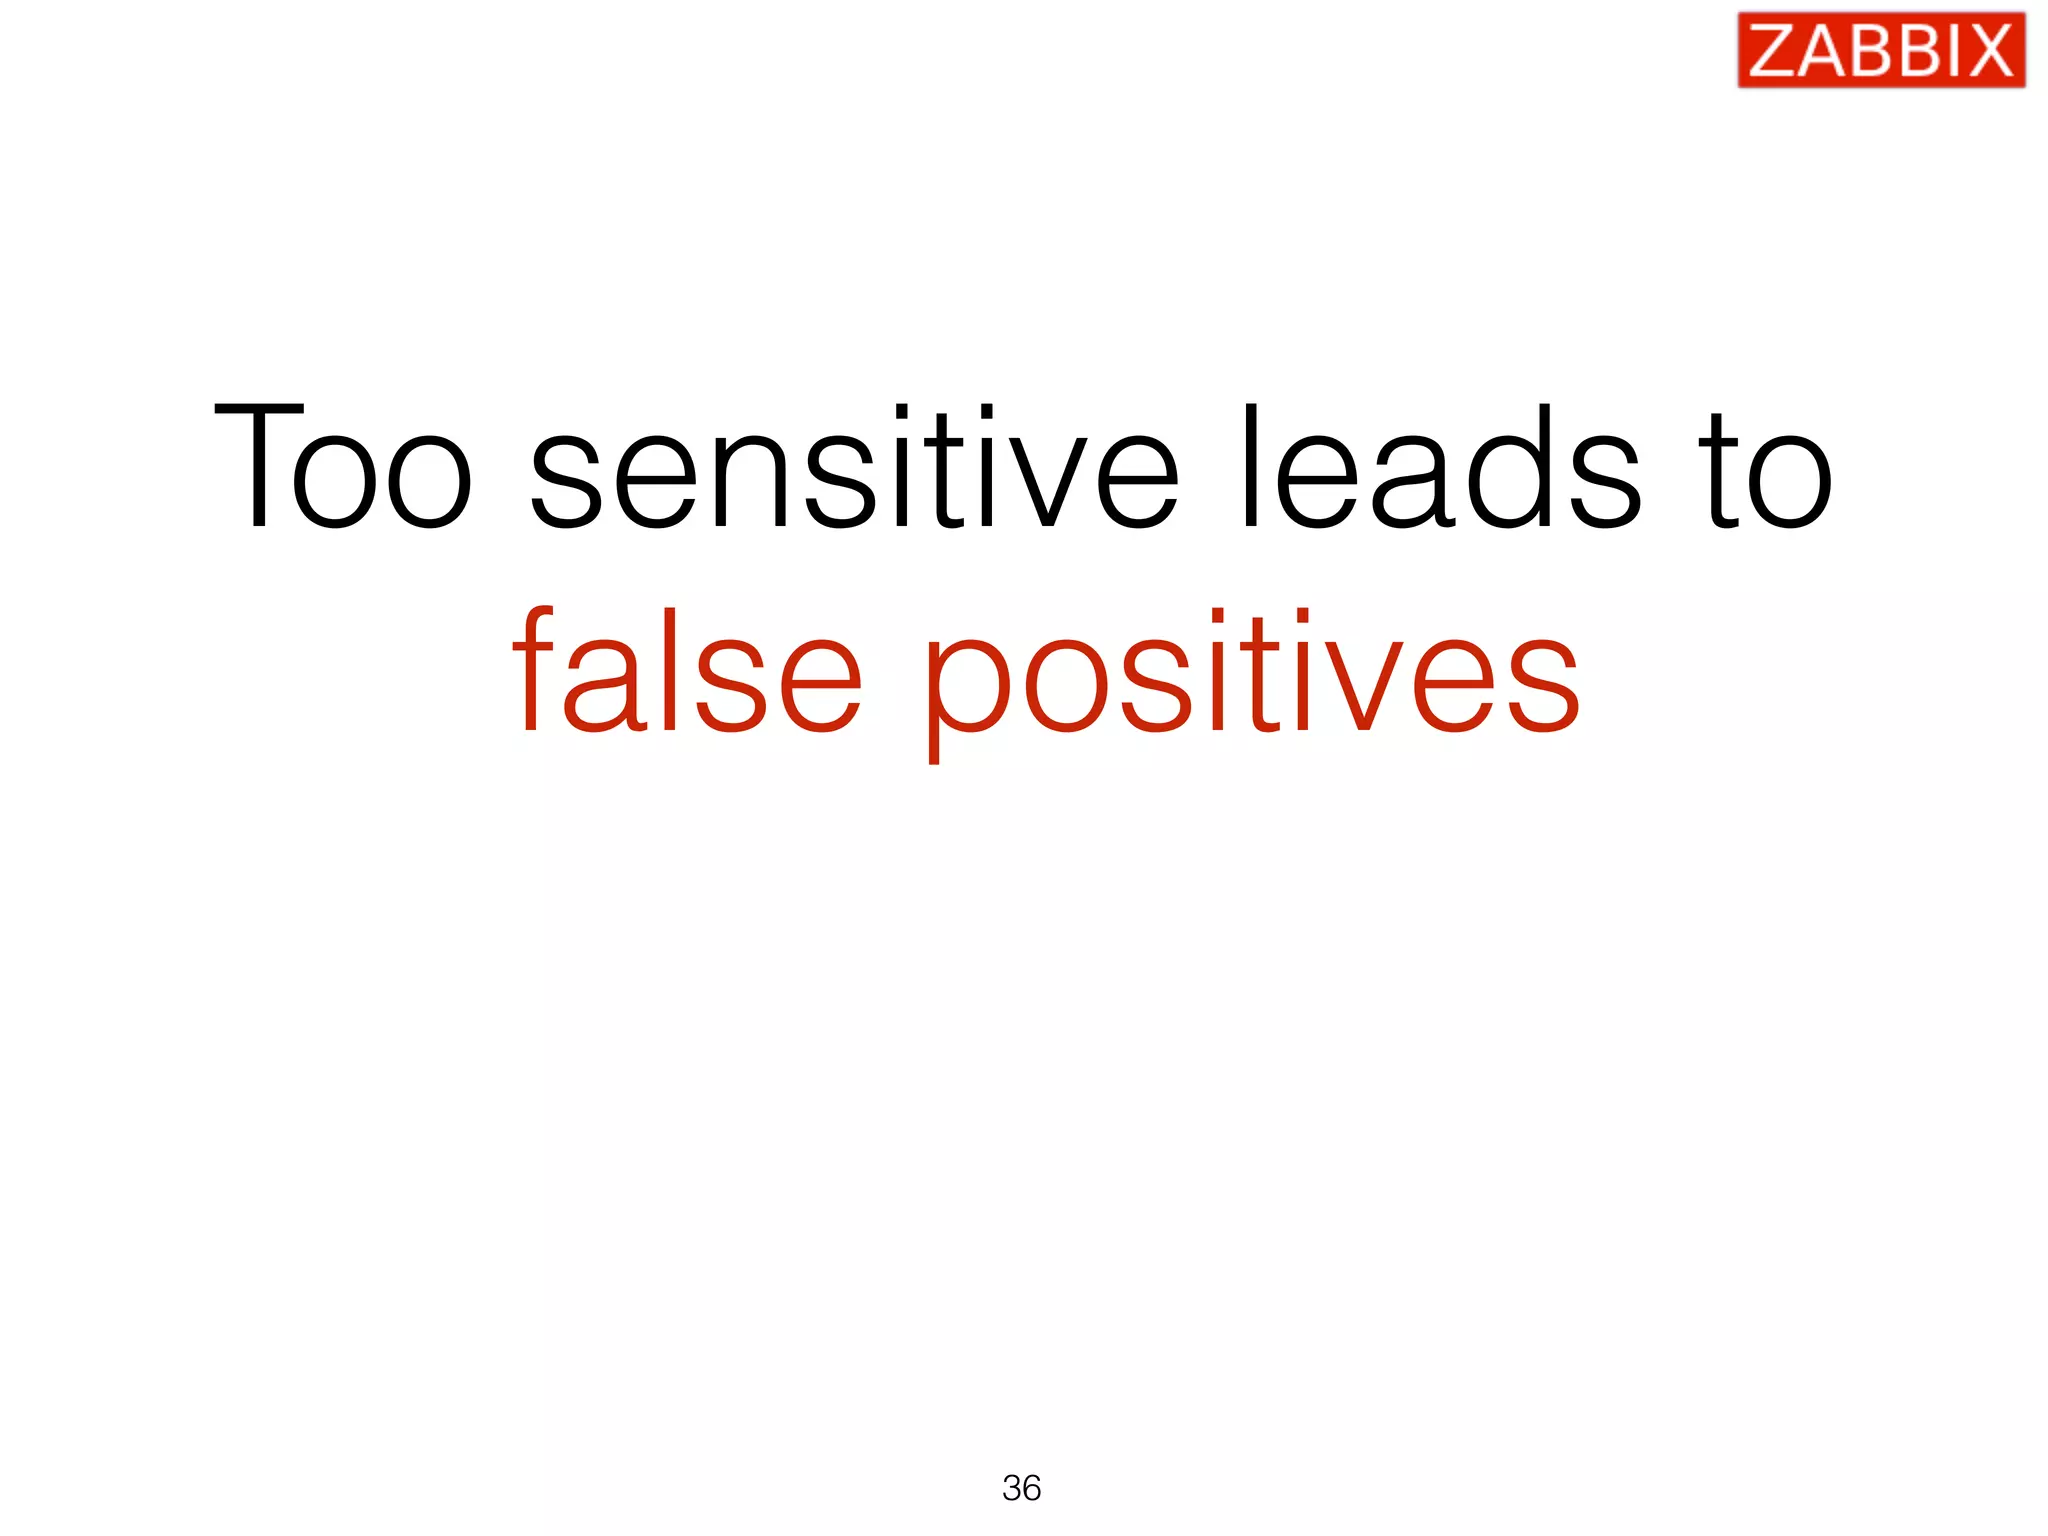

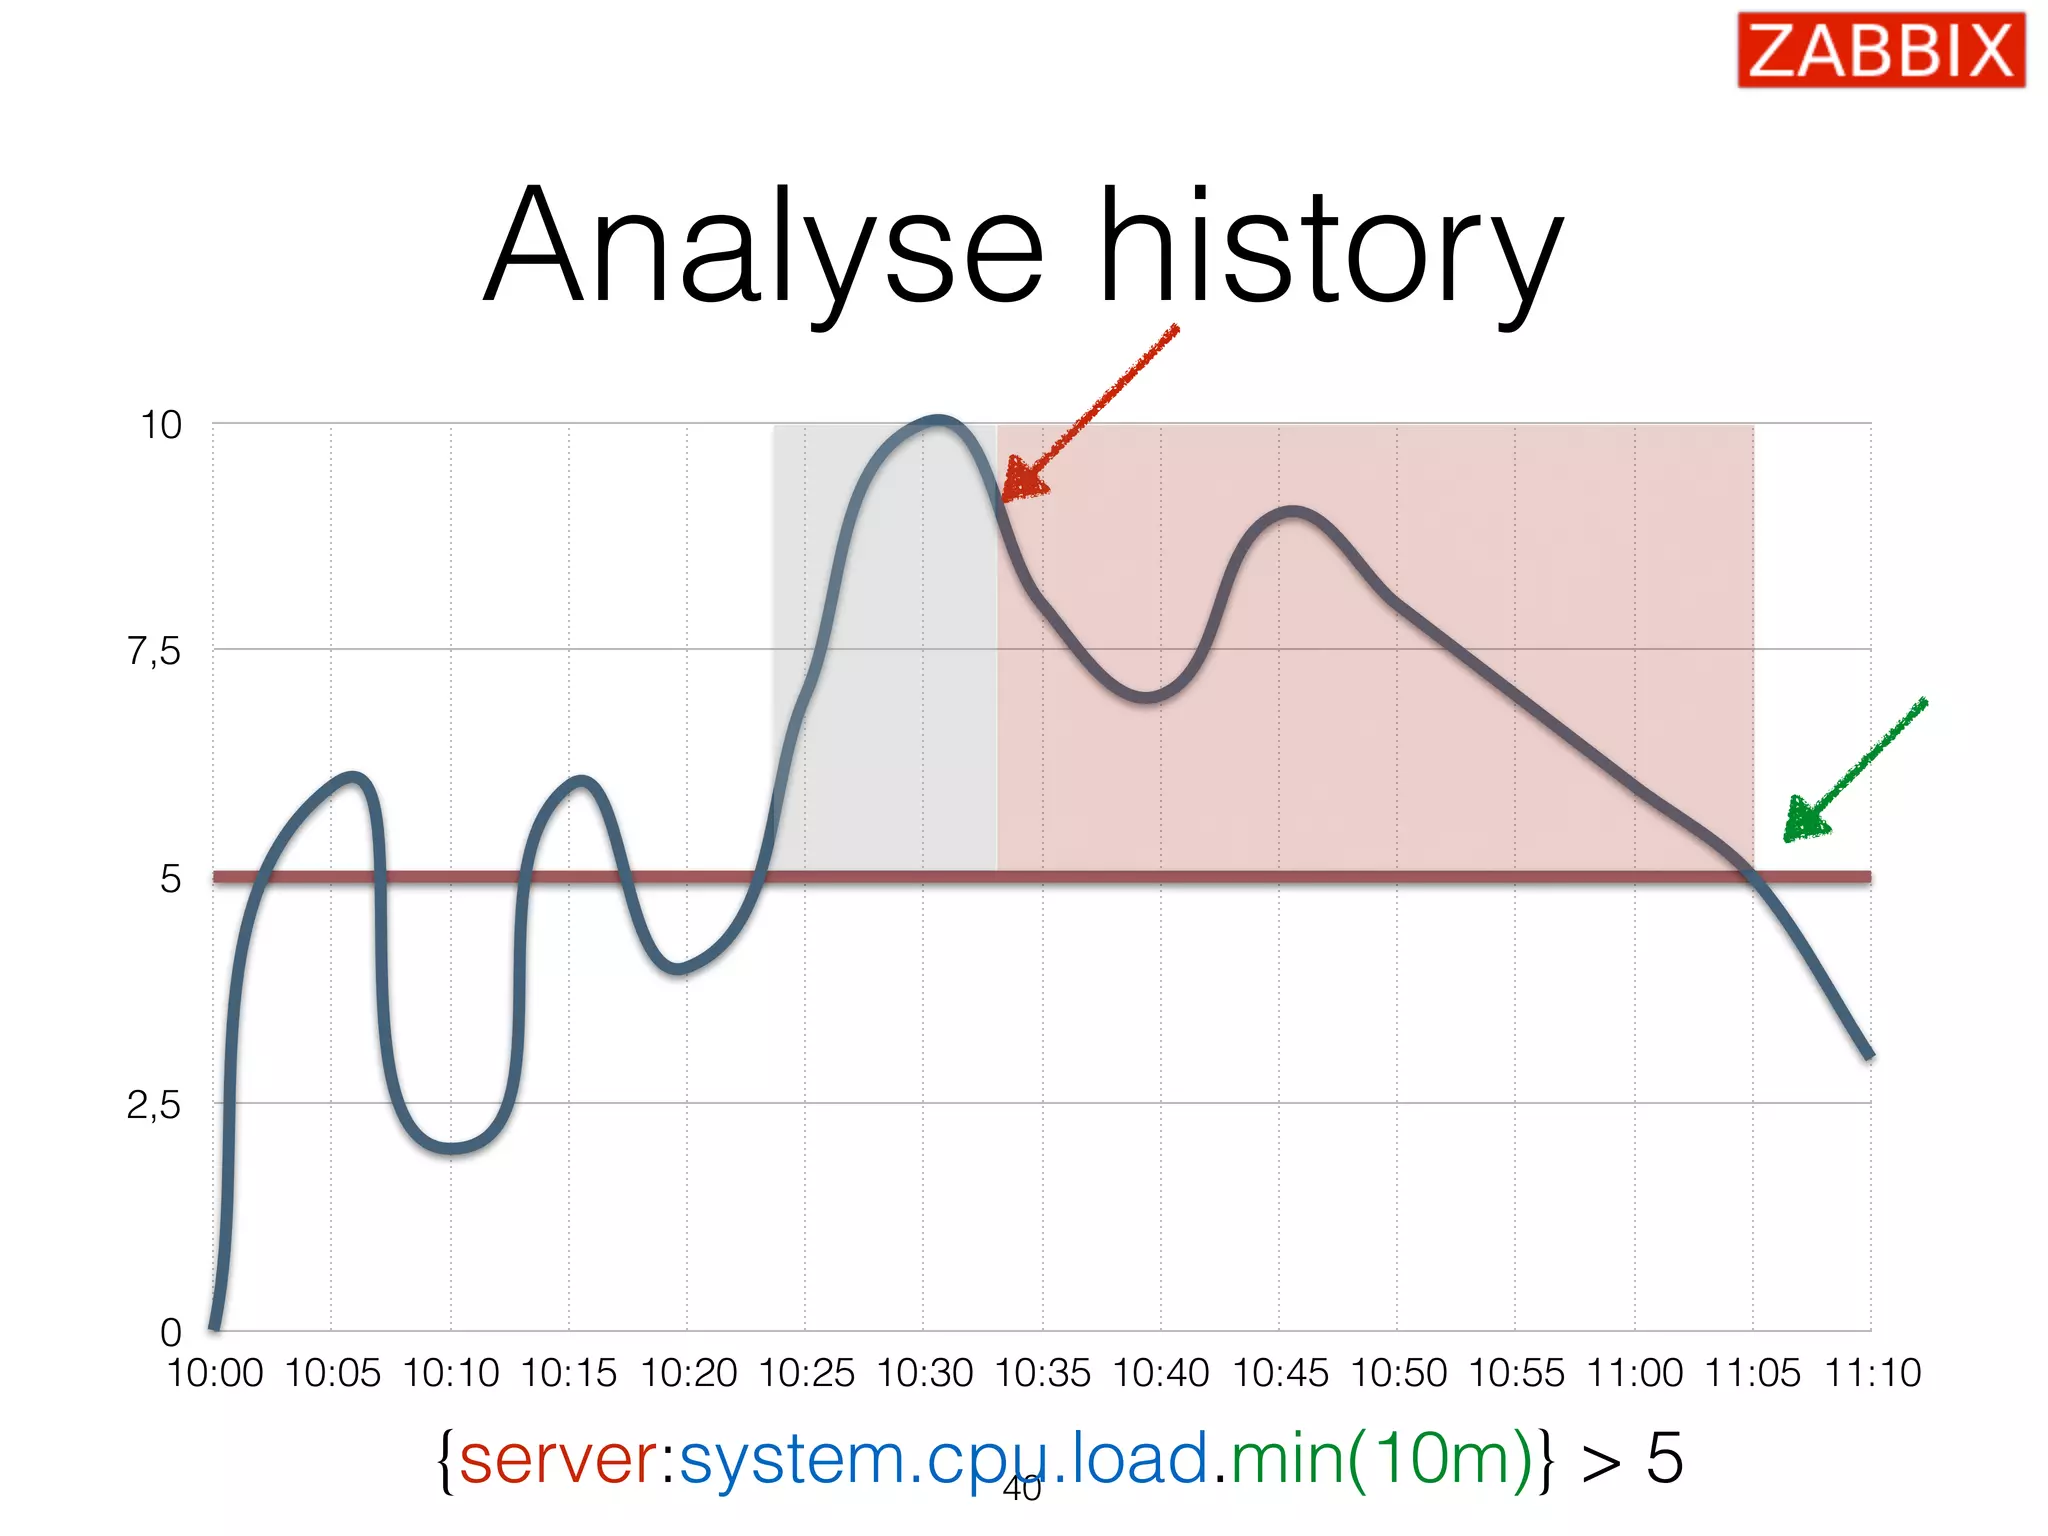
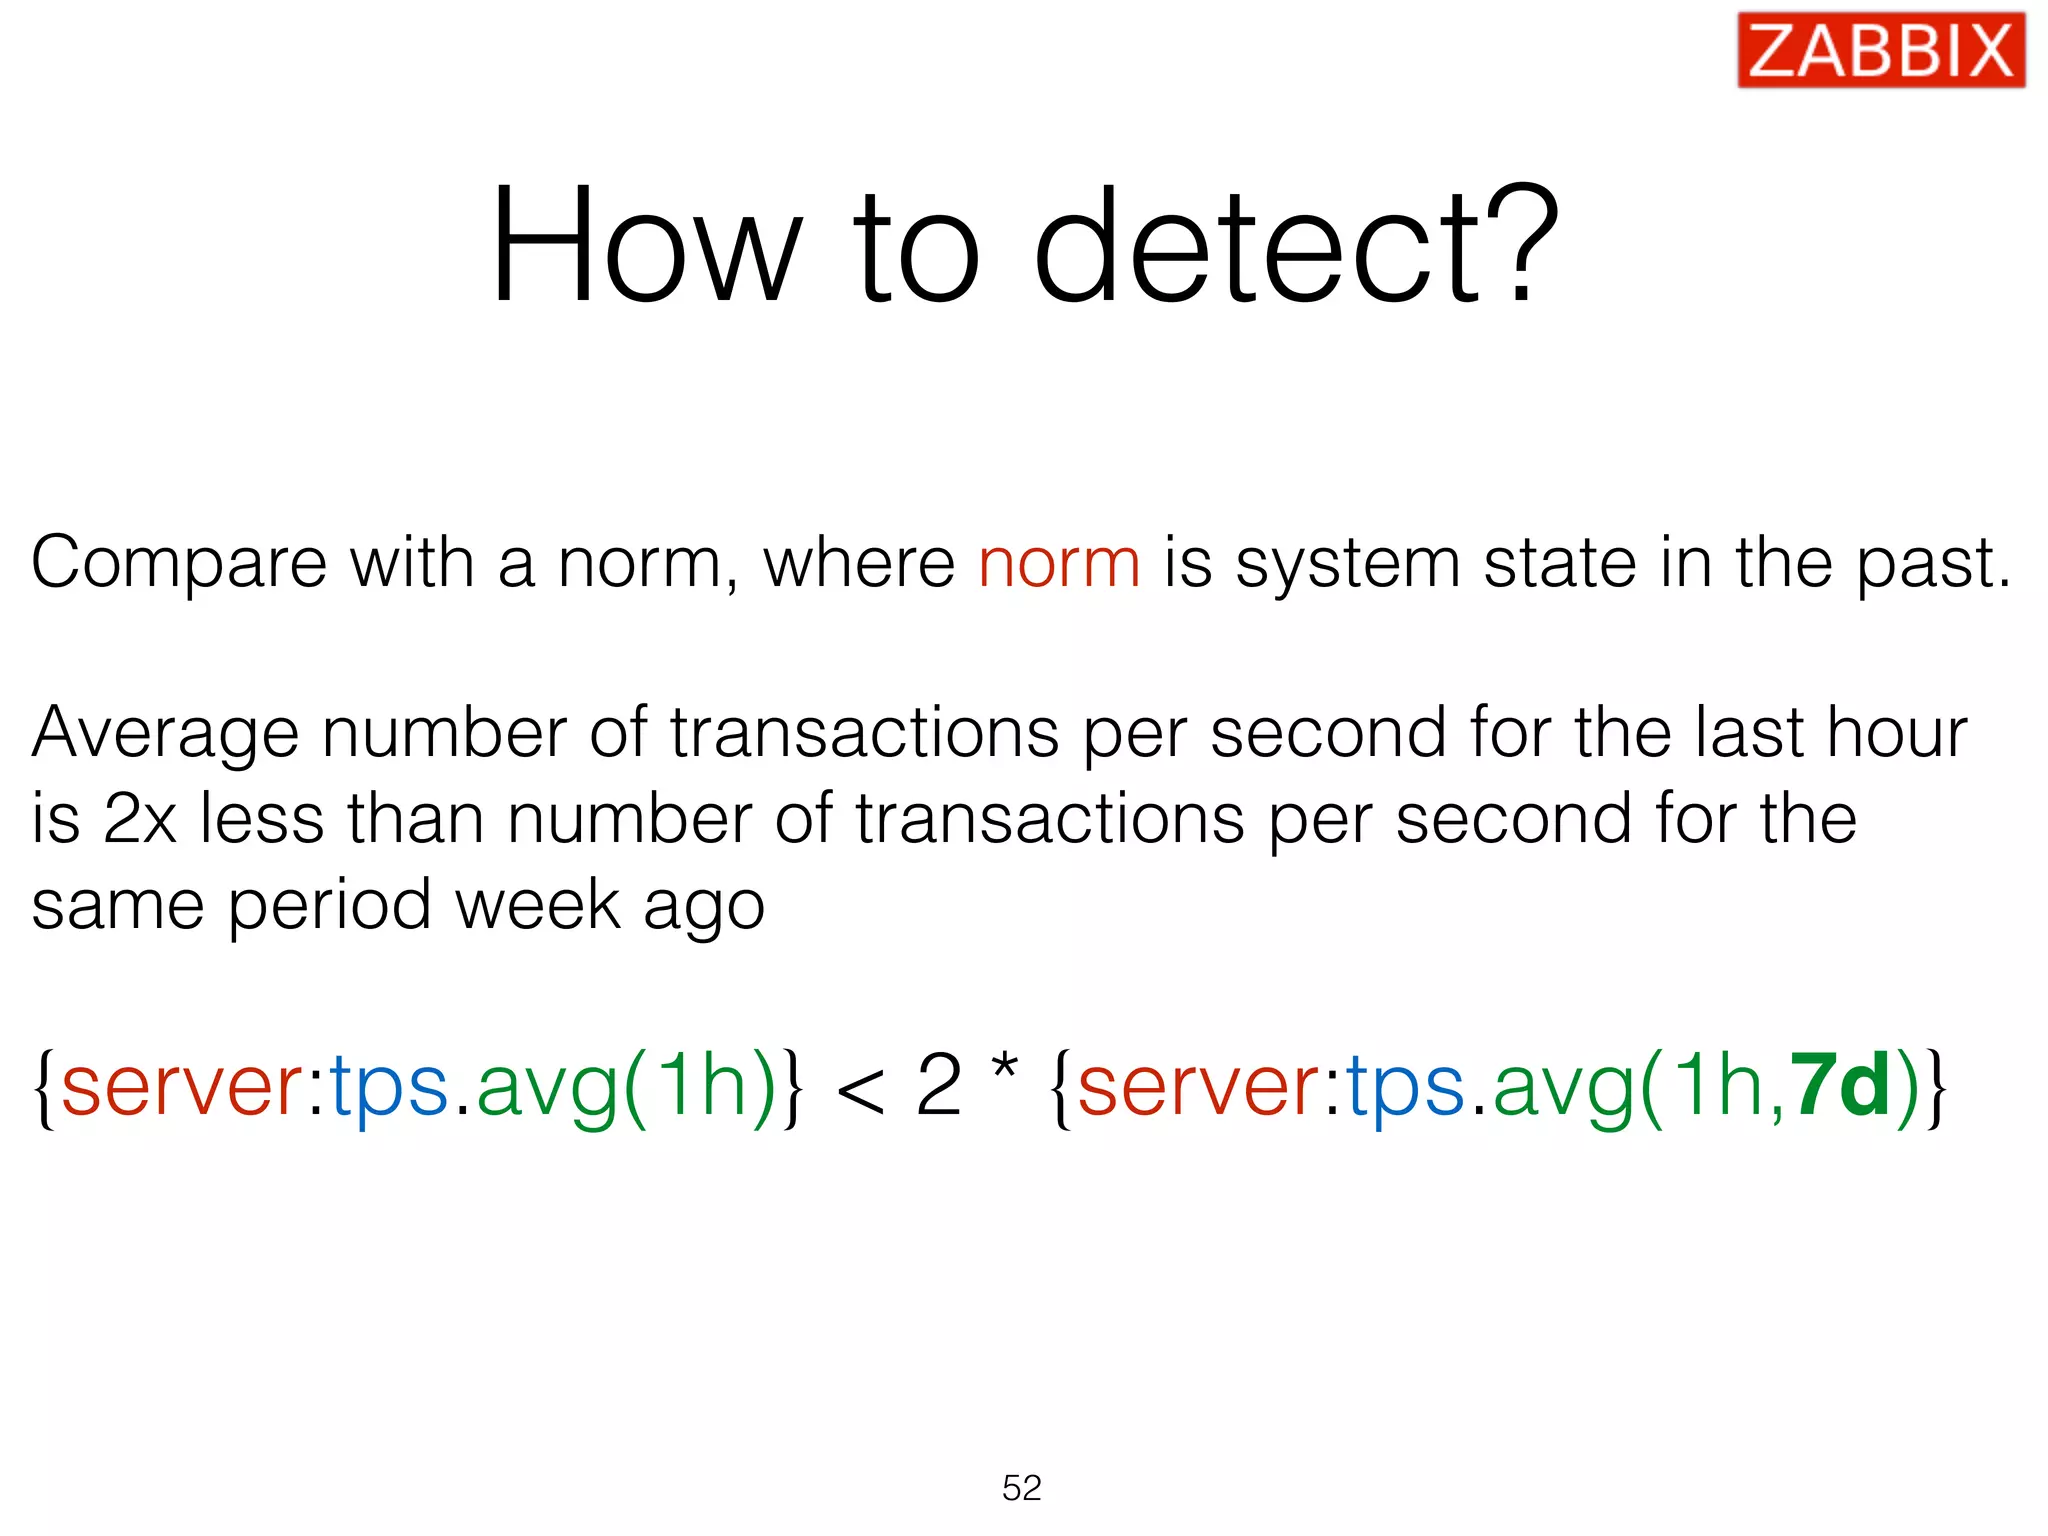
![Take advantage of history
System performance
{server:system.cpu.load.min(10m)} > 5
Service availability
{server:net.tcp.service[http].max(5m)} = 0
{server:net.tcp.service[http].max(#3)} = 0
39](https://image.slidesharecdn.com/zabbix-monitoringsolutionforeveryone-160628094030/75/Alexei-Vladishev-Zabbix-Monitoring-Solution-for-Everyone-39-2048.jpg)
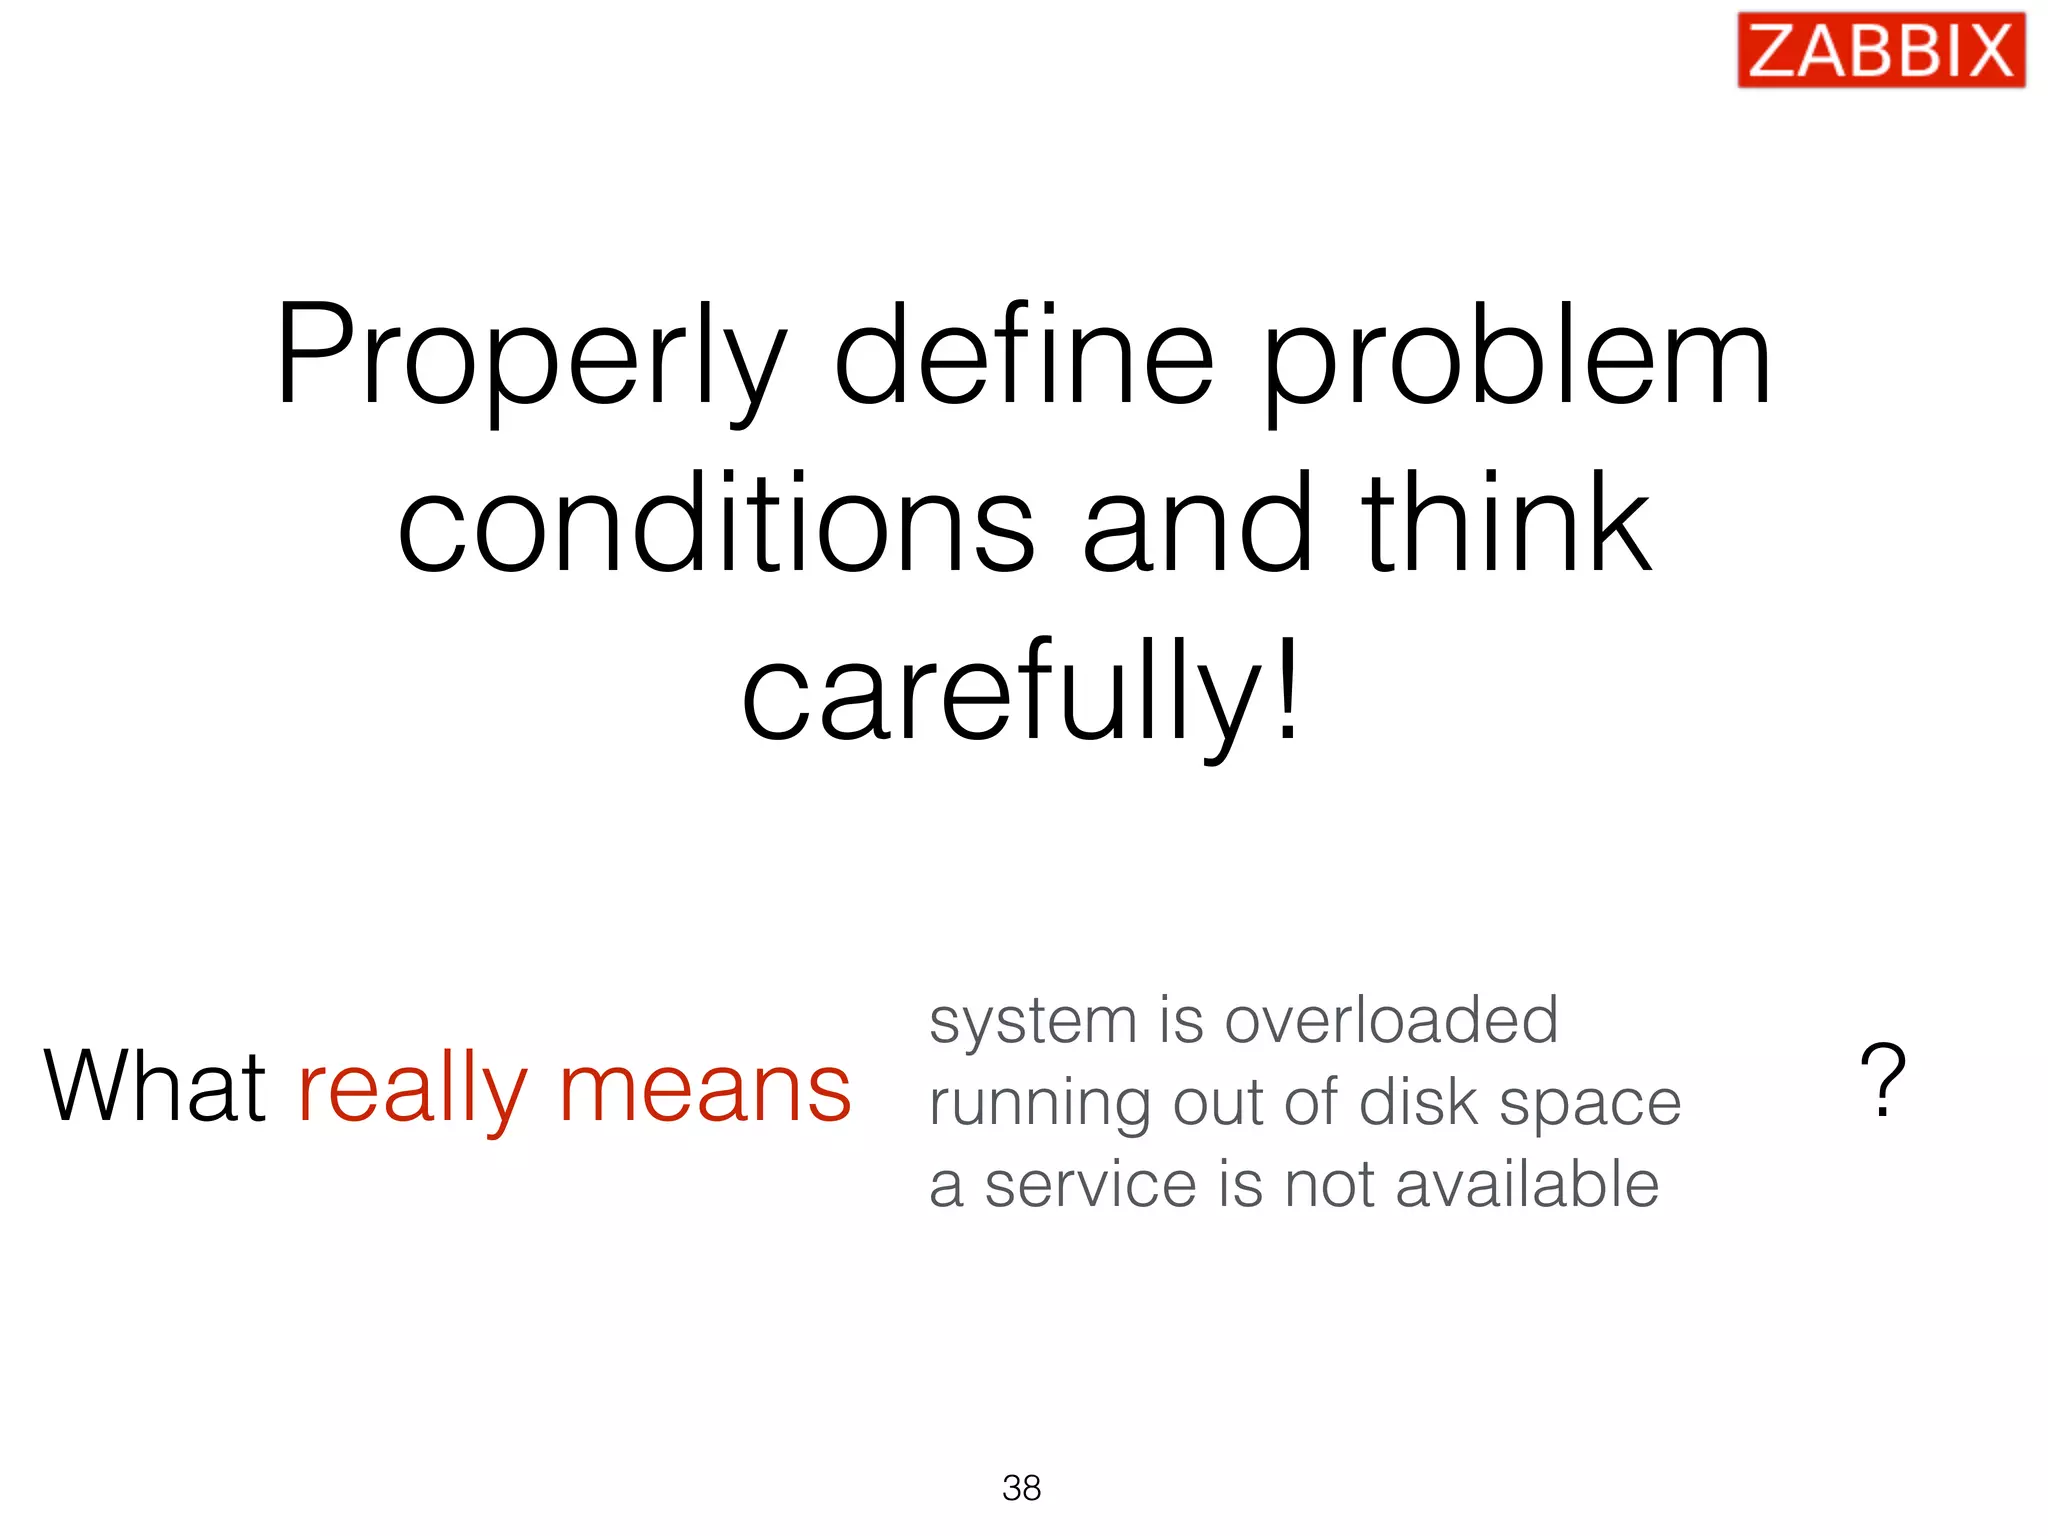
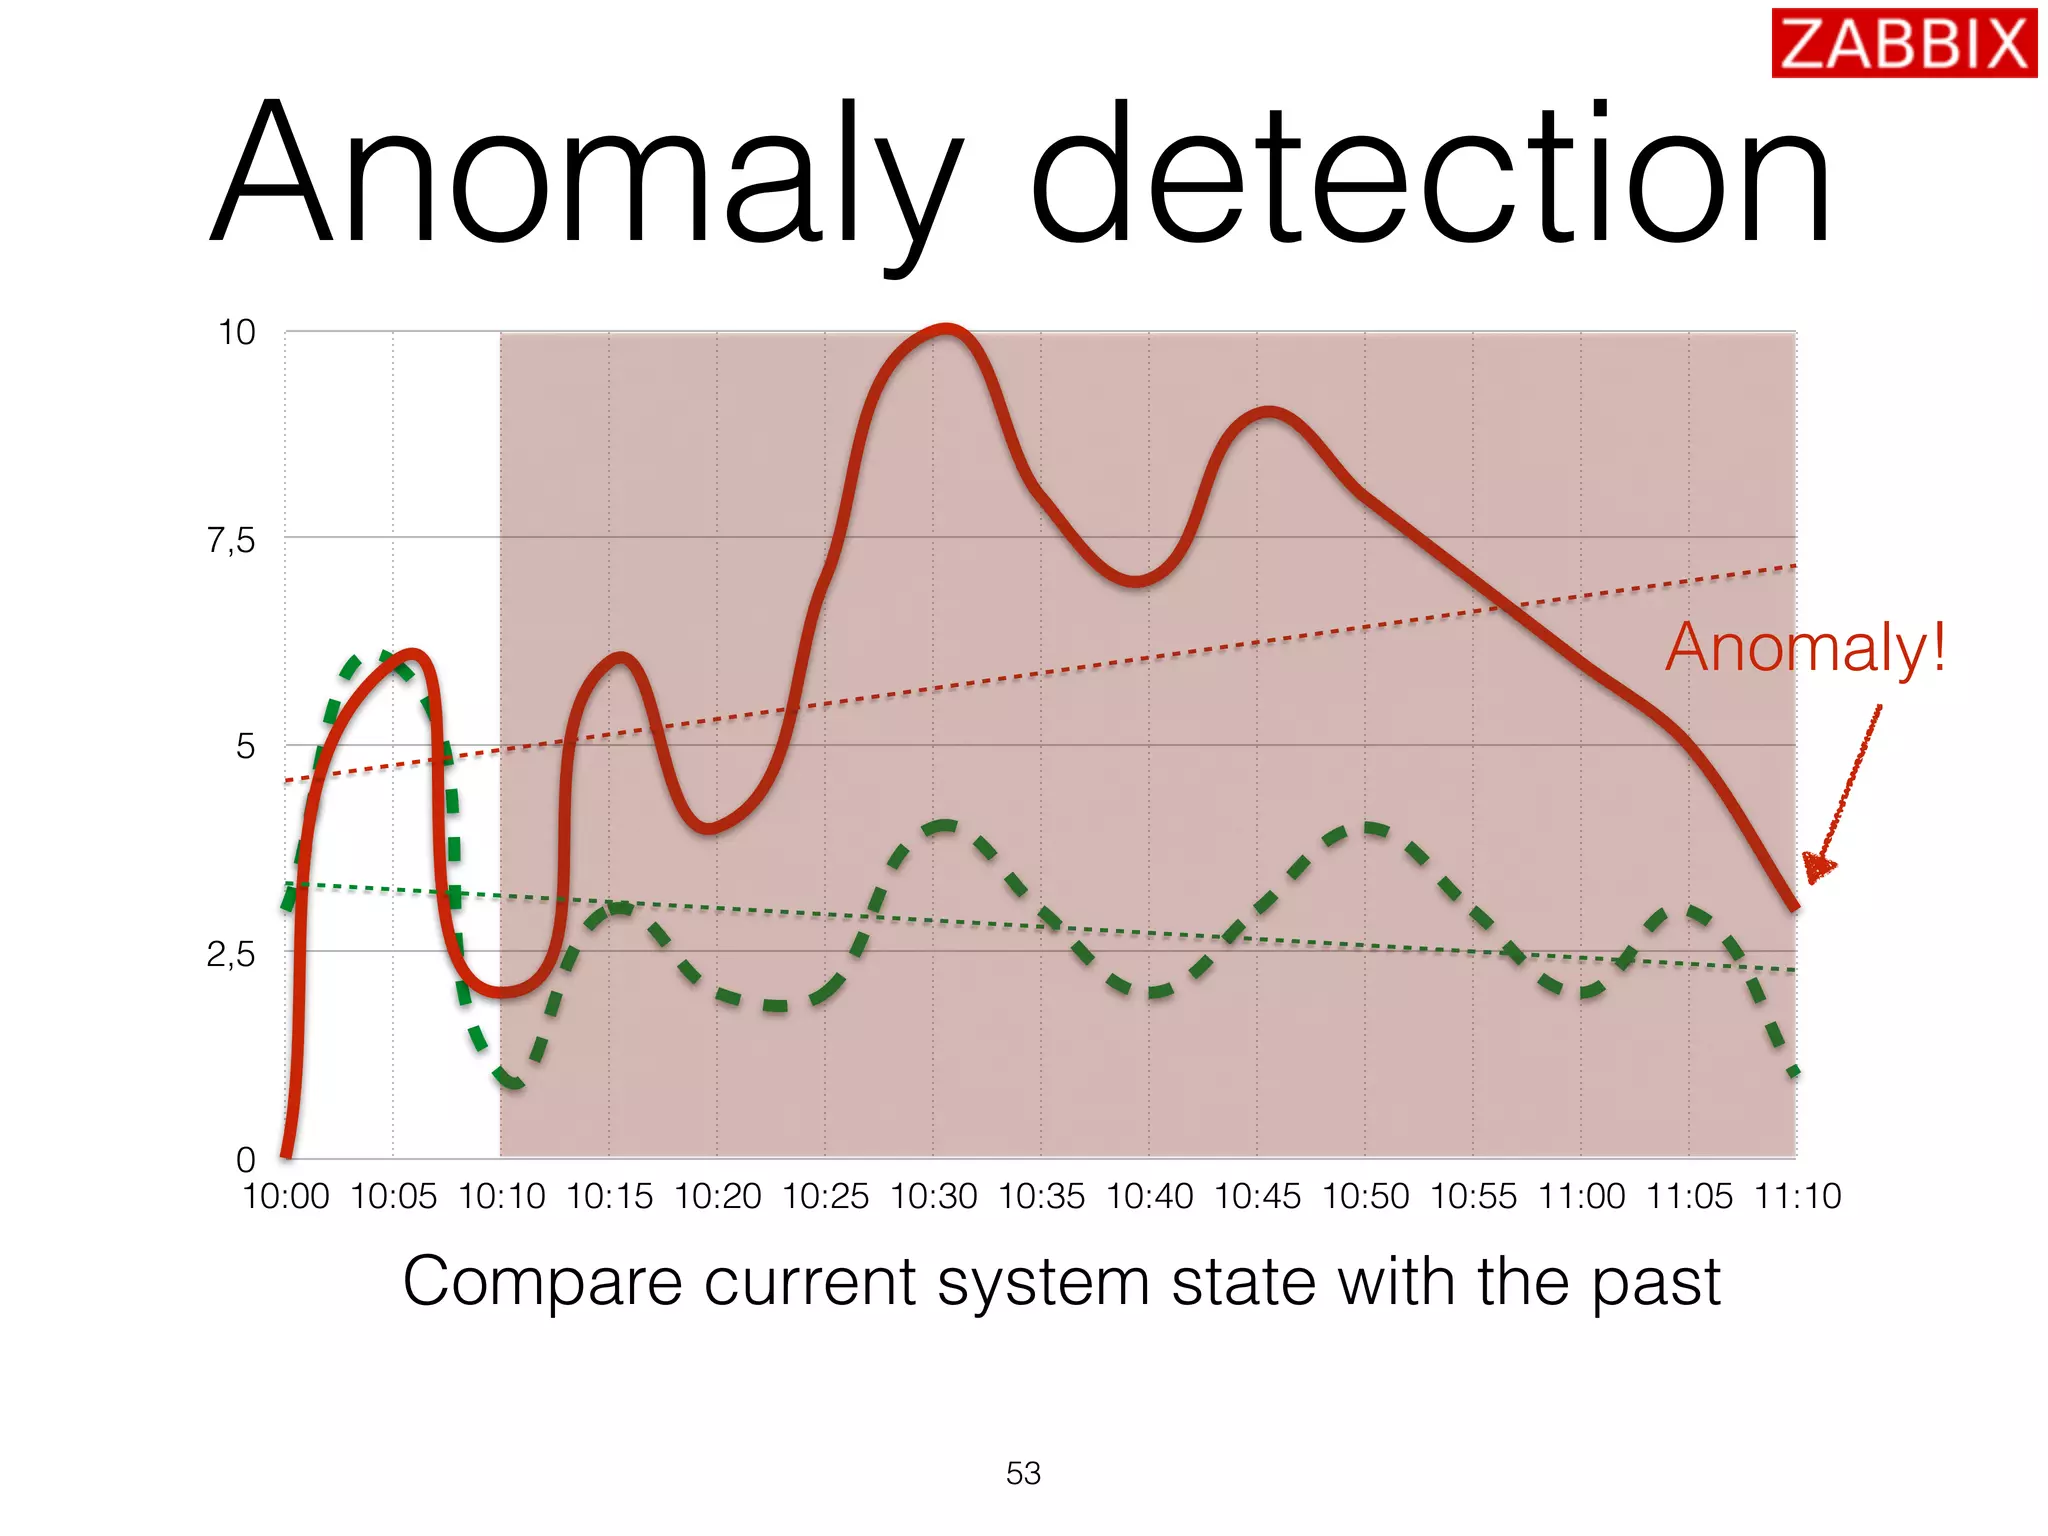
![Analyse history
41
0
0,25
0,5
0,75
1
10:01 10:02 10:03 10:04 10:05 10:06 10:07 10:08 10:09 10:10 10:11 10:12 10:13 10:14 10:15
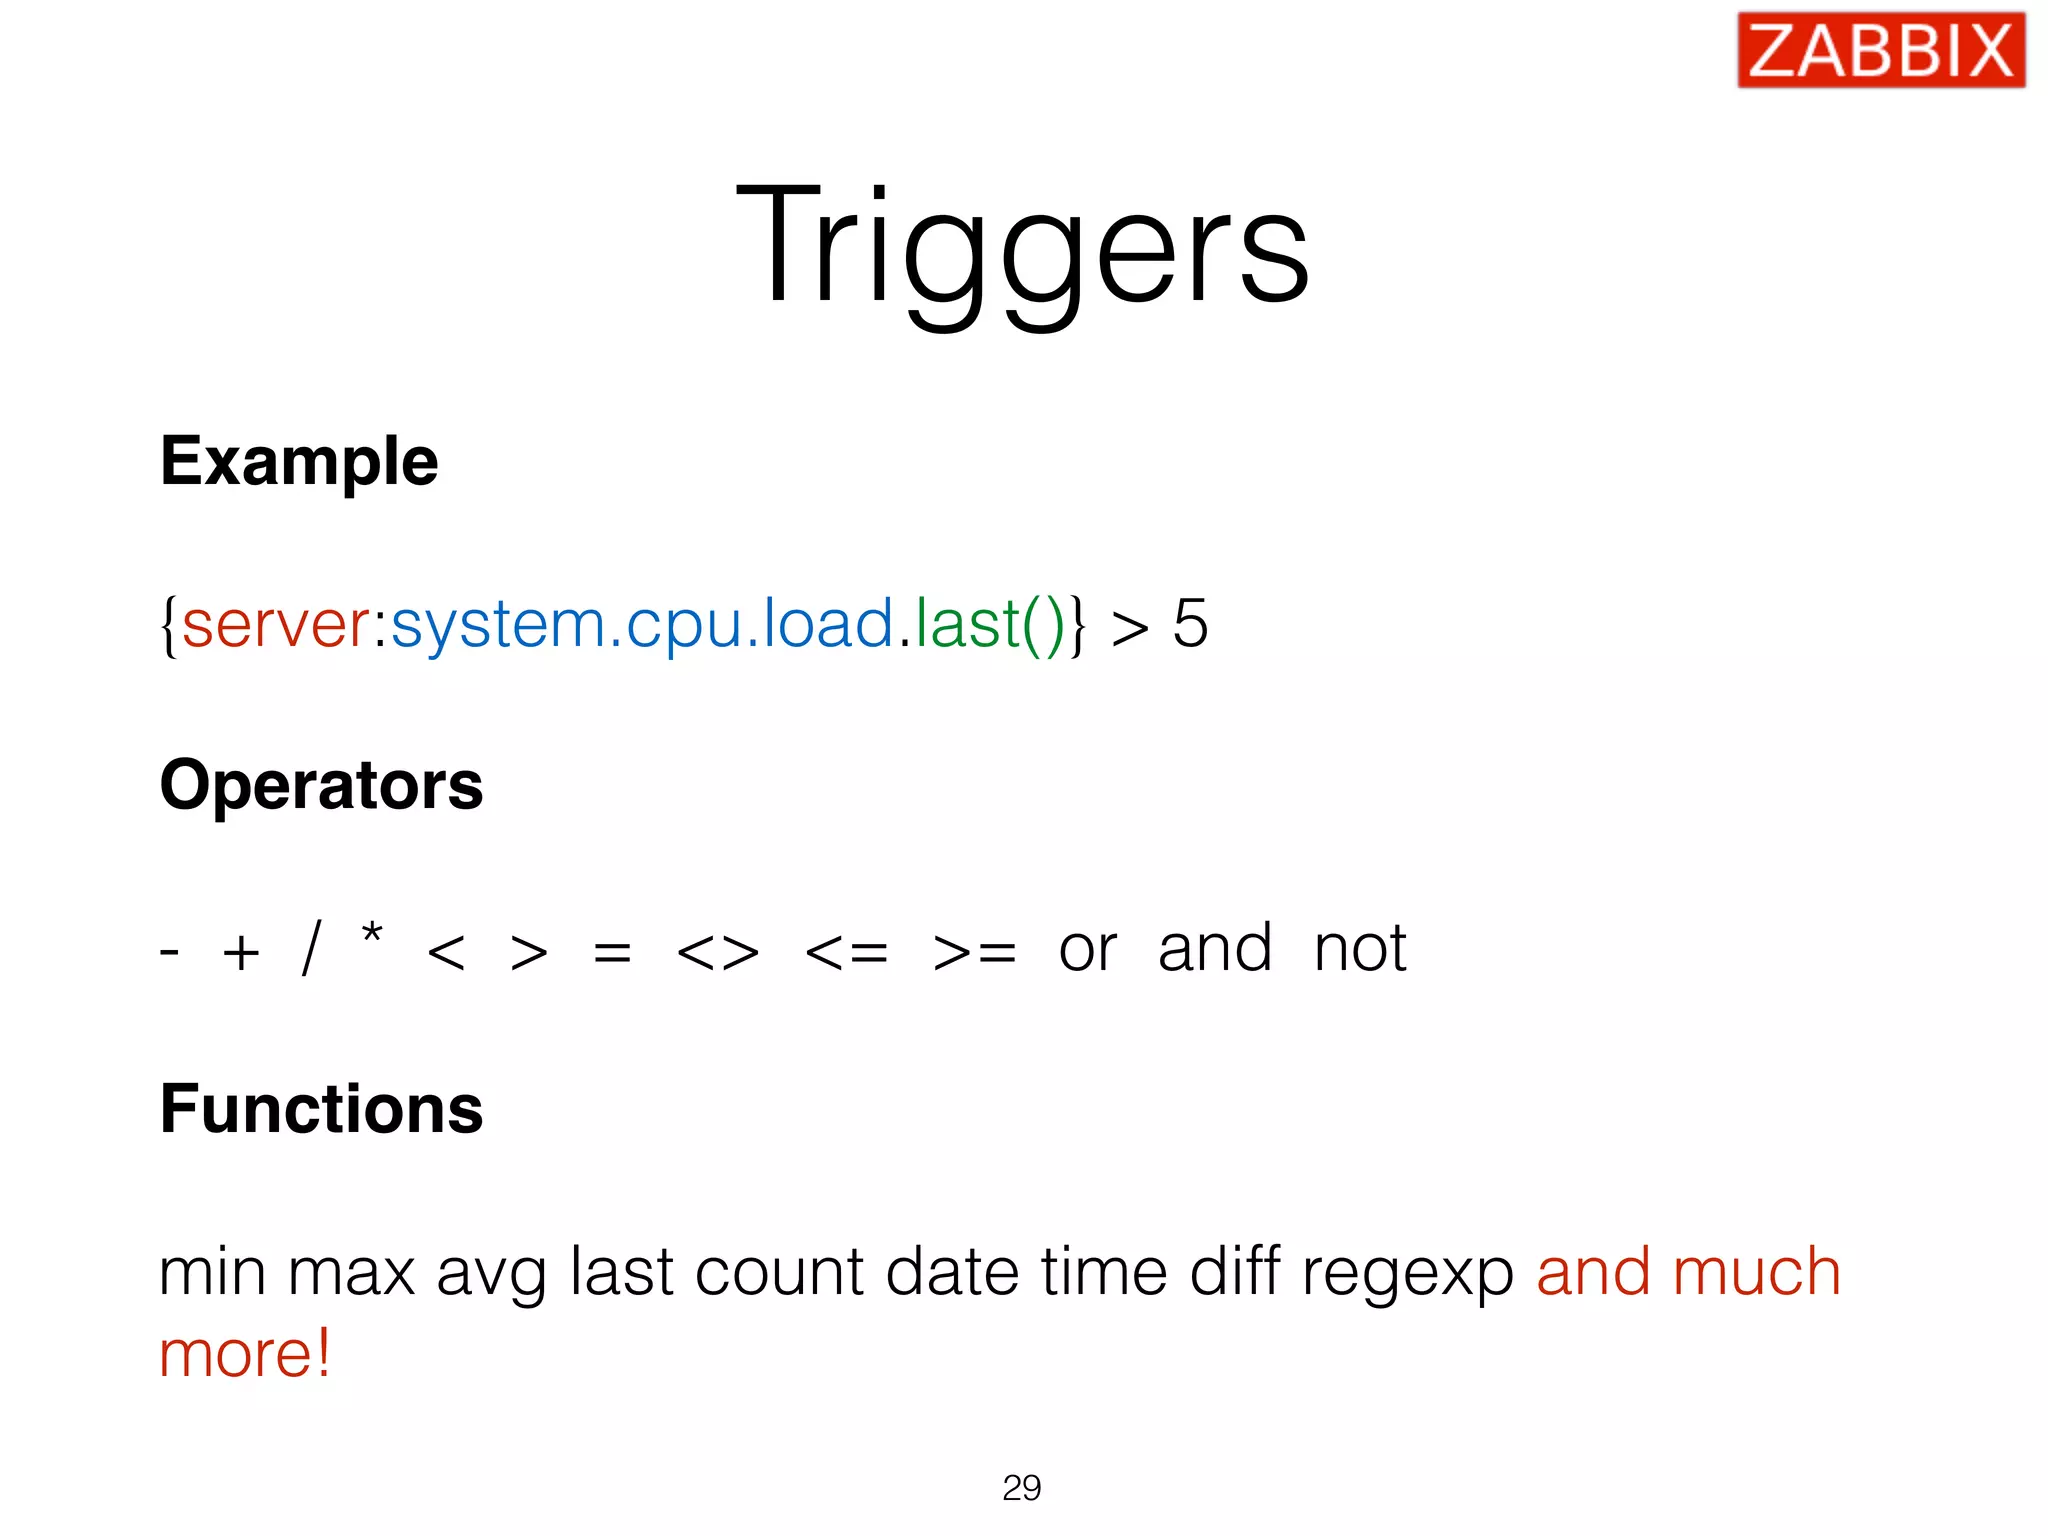
{server:net.tcp.service[http].max(#3)} = 0](https://image.slidesharecdn.com/zabbix-monitoringsolutionforeveryone-160628094030/75/Alexei-Vladishev-Zabbix-Monitoring-Solution-for-Everyone-41-2048.jpg)
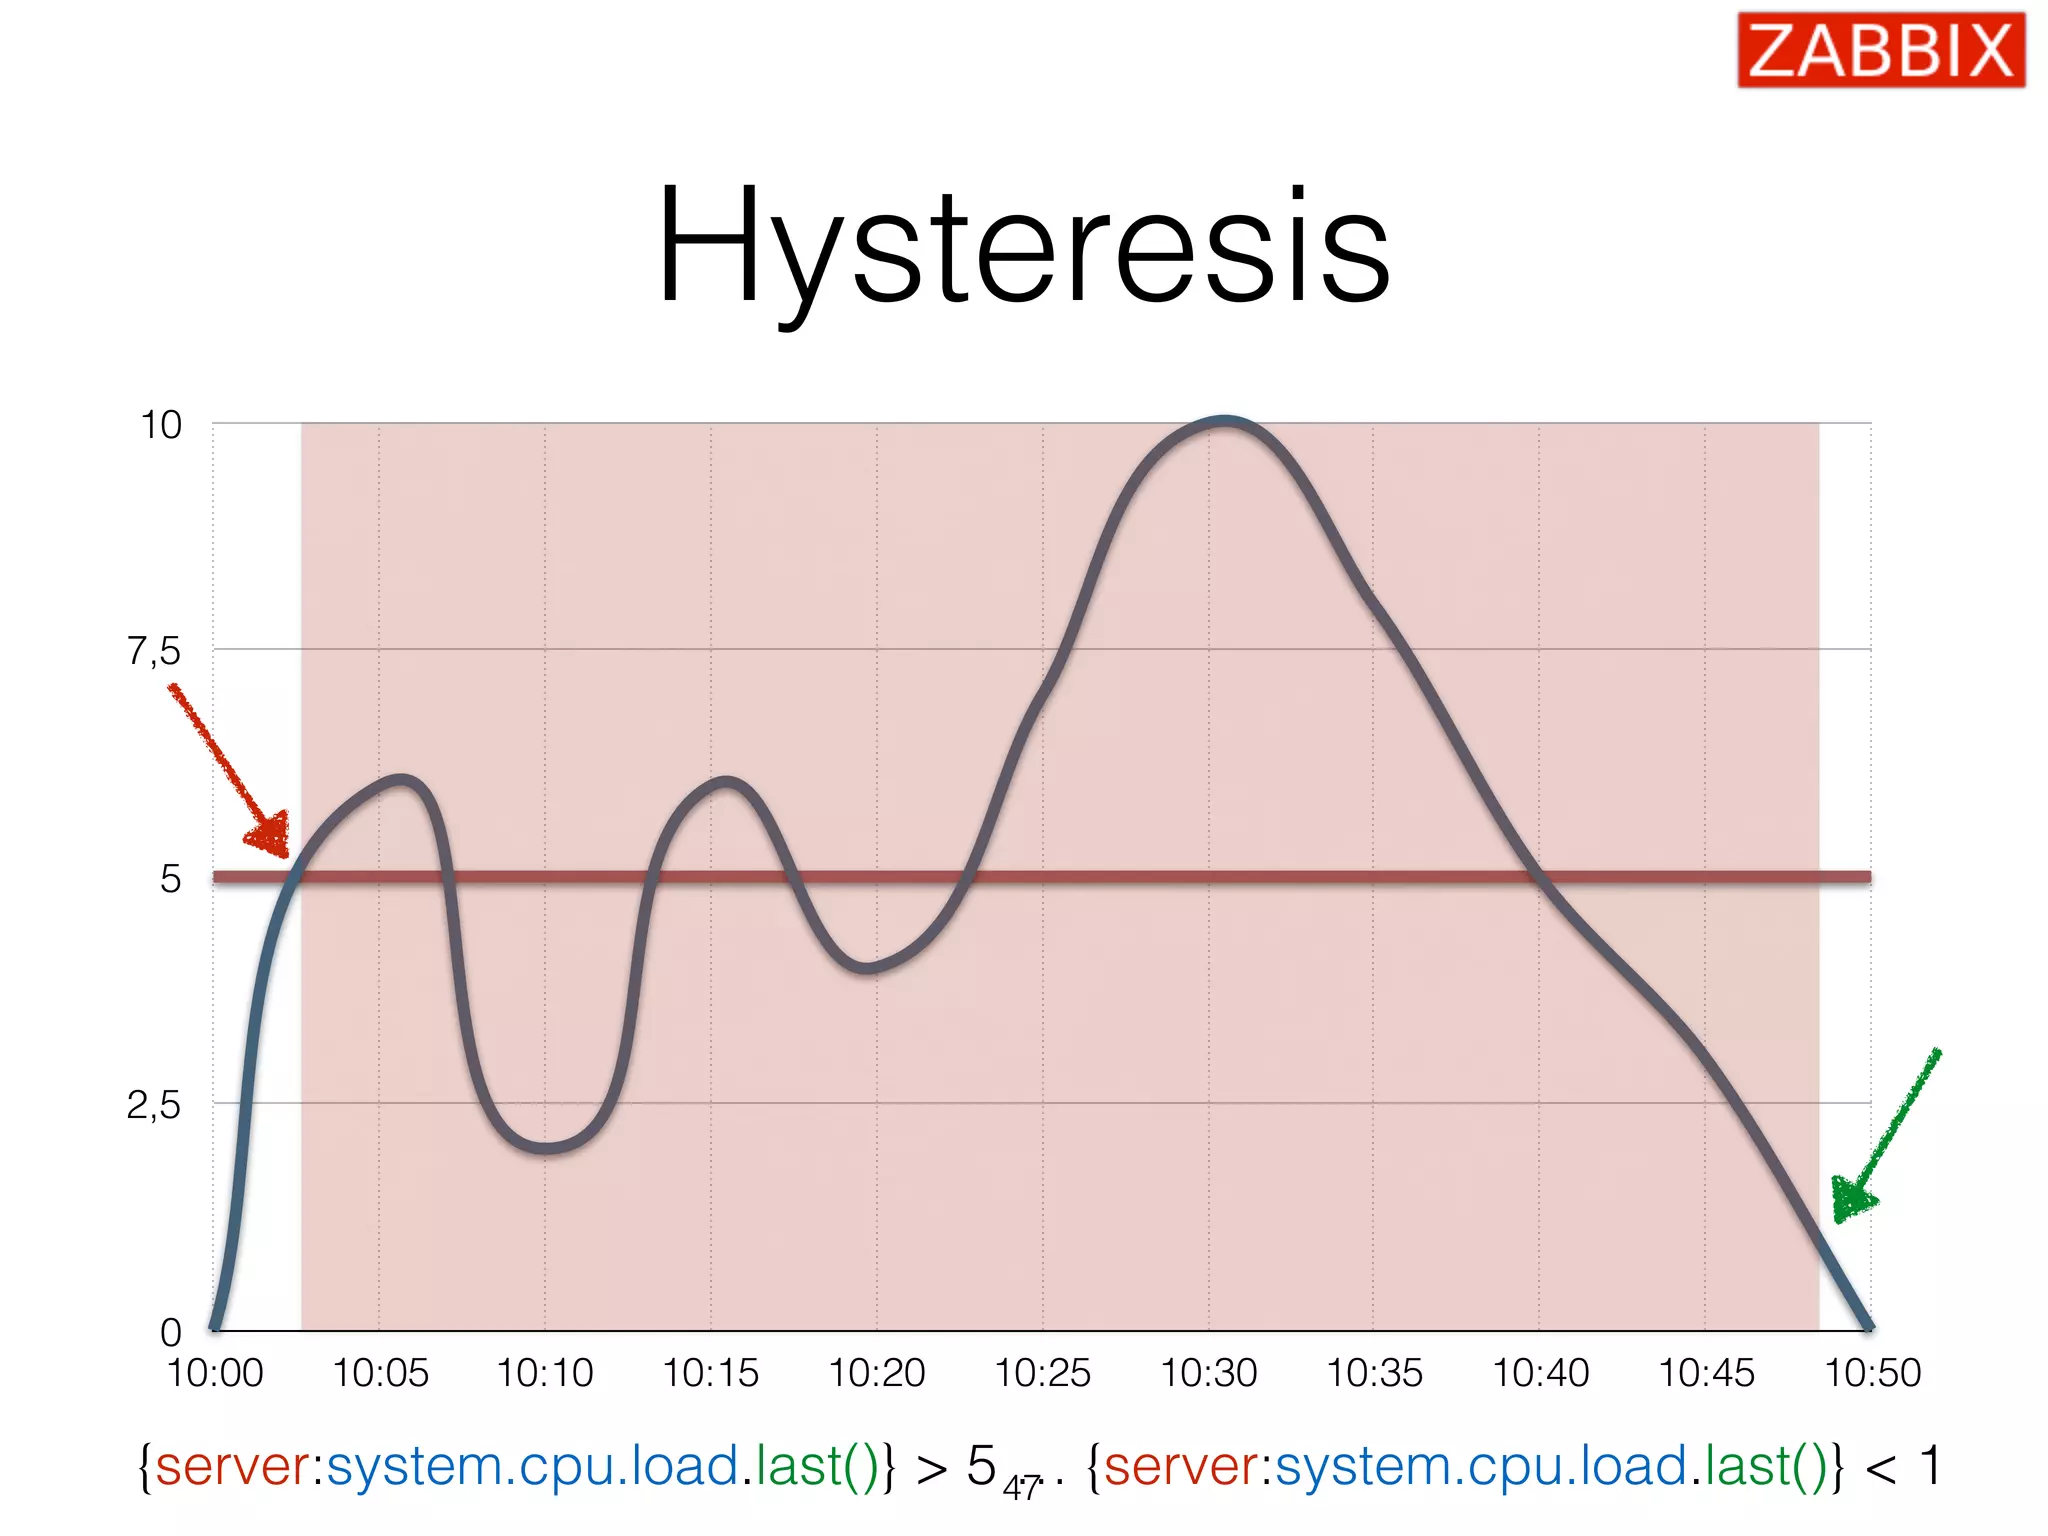

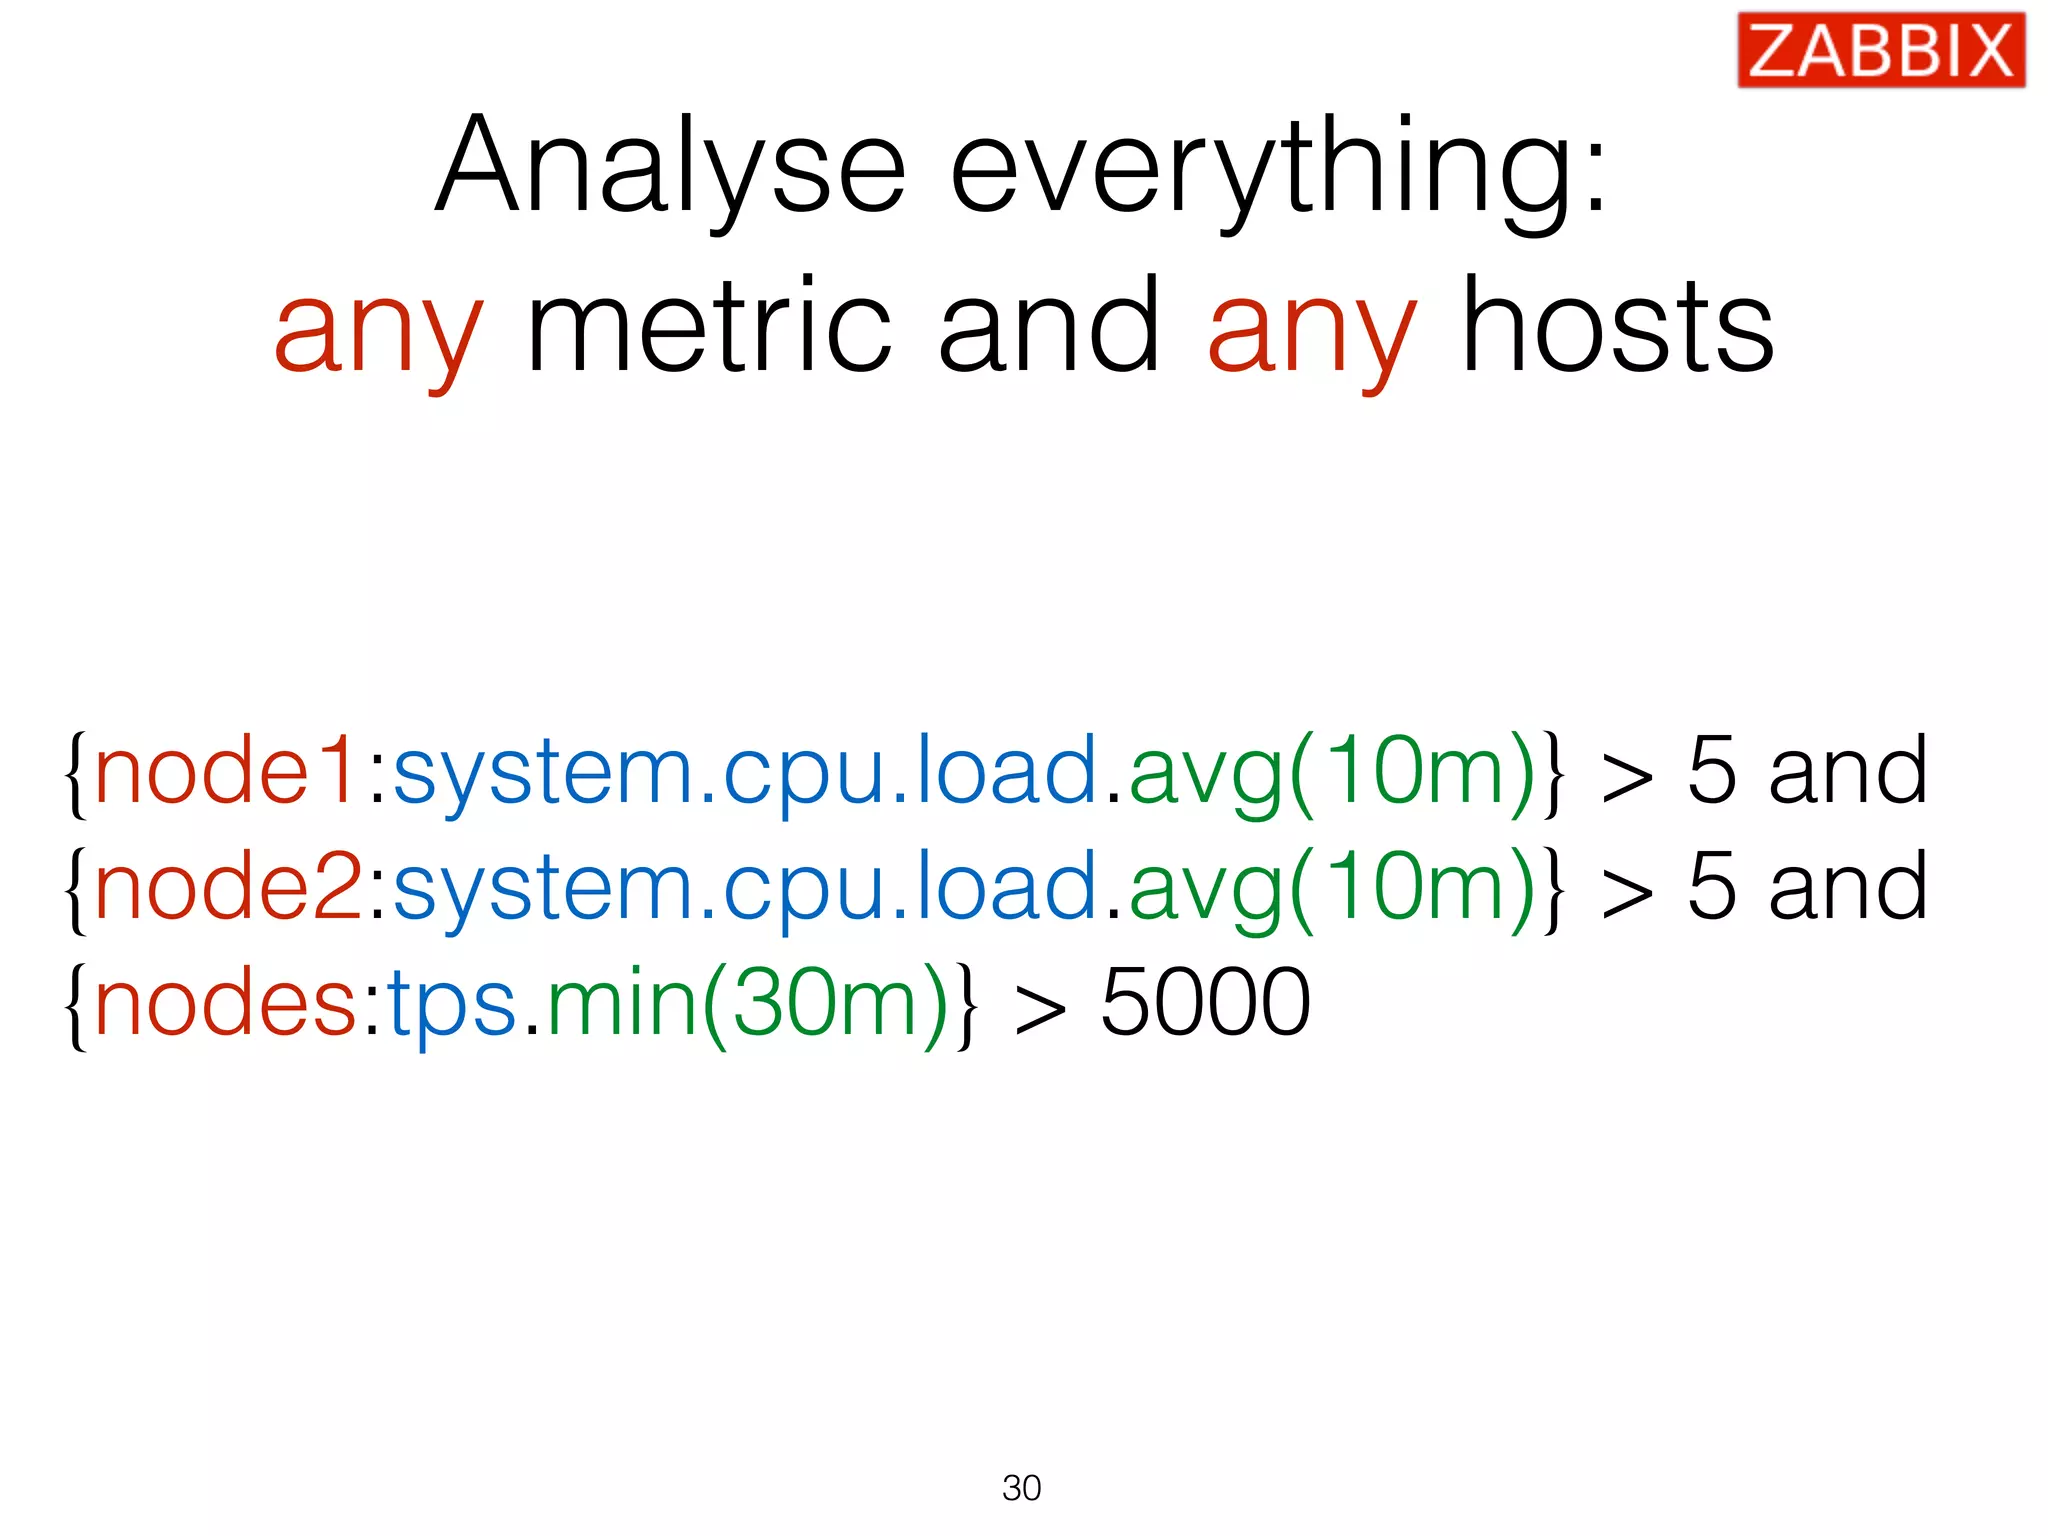
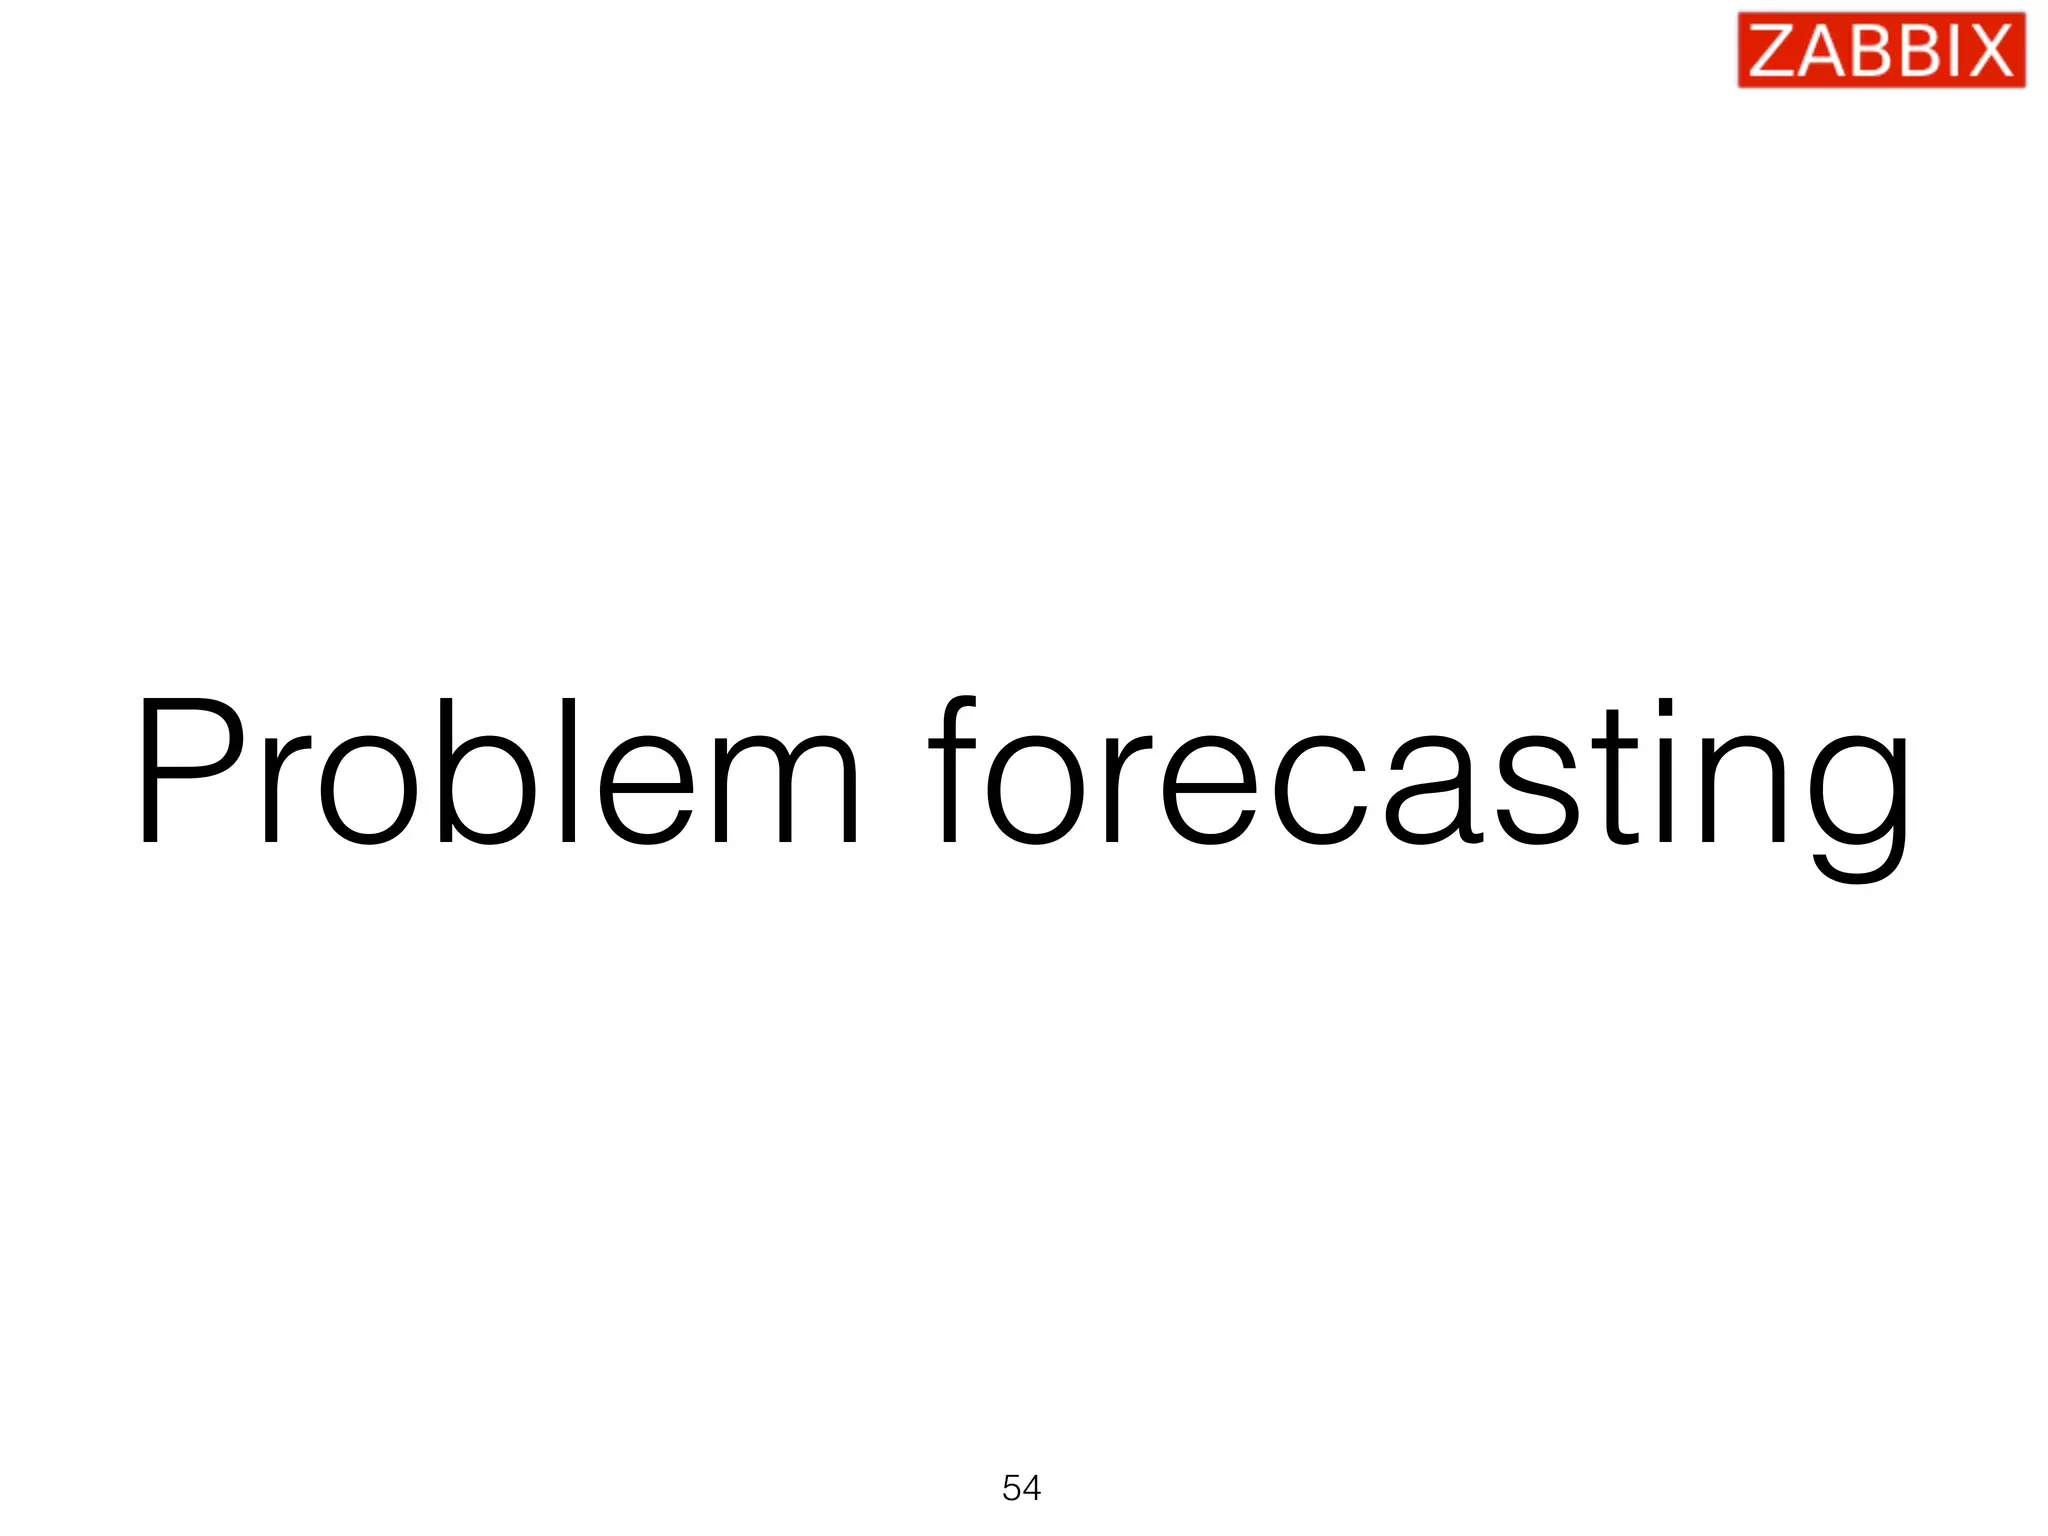
![Several examples
System is overloaded
Problem: {server:system.cpu.load.min(5m)}>3
Recovery: {server:system.cpu.load.min(2m)}<1
No free disk space on /
Problem: {server:vfs.fs.size[/,pfree].last()}<10
Recovery: {server:vfs.fs.size[/,pfree].min(15m)}>30
SSH server is not available
Problem: {server:net.tcp.service[ssh].max(#3)}=0
Recovery: {server:net.tcp.service[ssh].min(#10)}=1
49](https://image.slidesharecdn.com/zabbix-monitoringsolutionforeveryone-160628094030/75/Alexei-Vladishev-Zabbix-Monitoring-Solution-for-Everyone-49-2048.jpg)
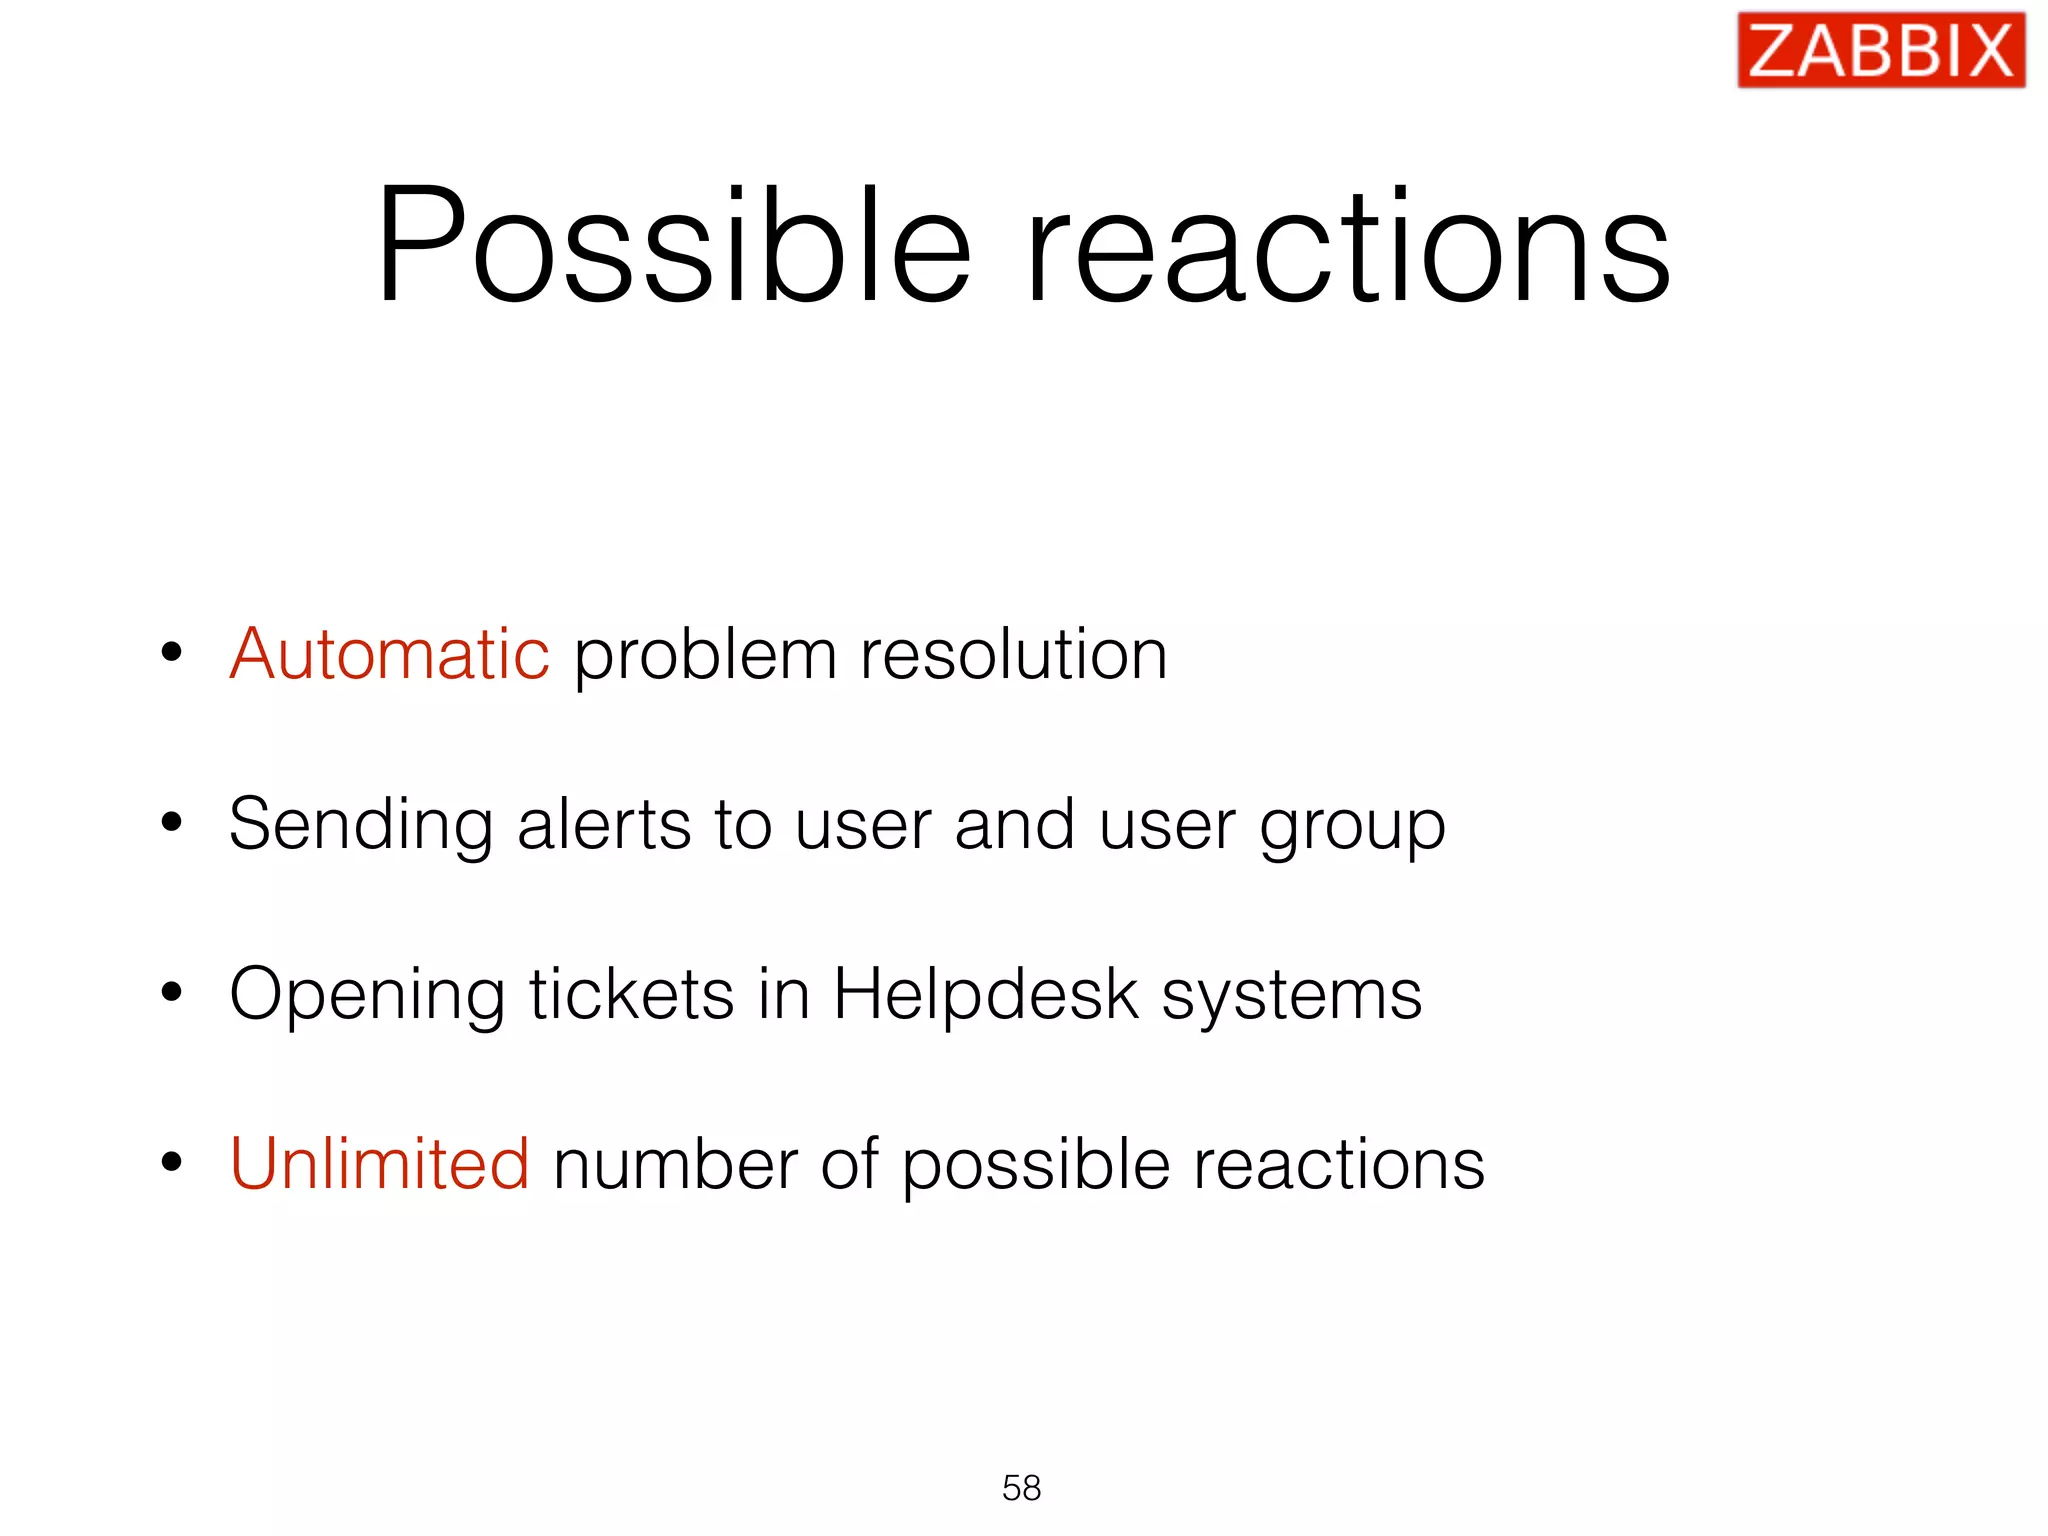

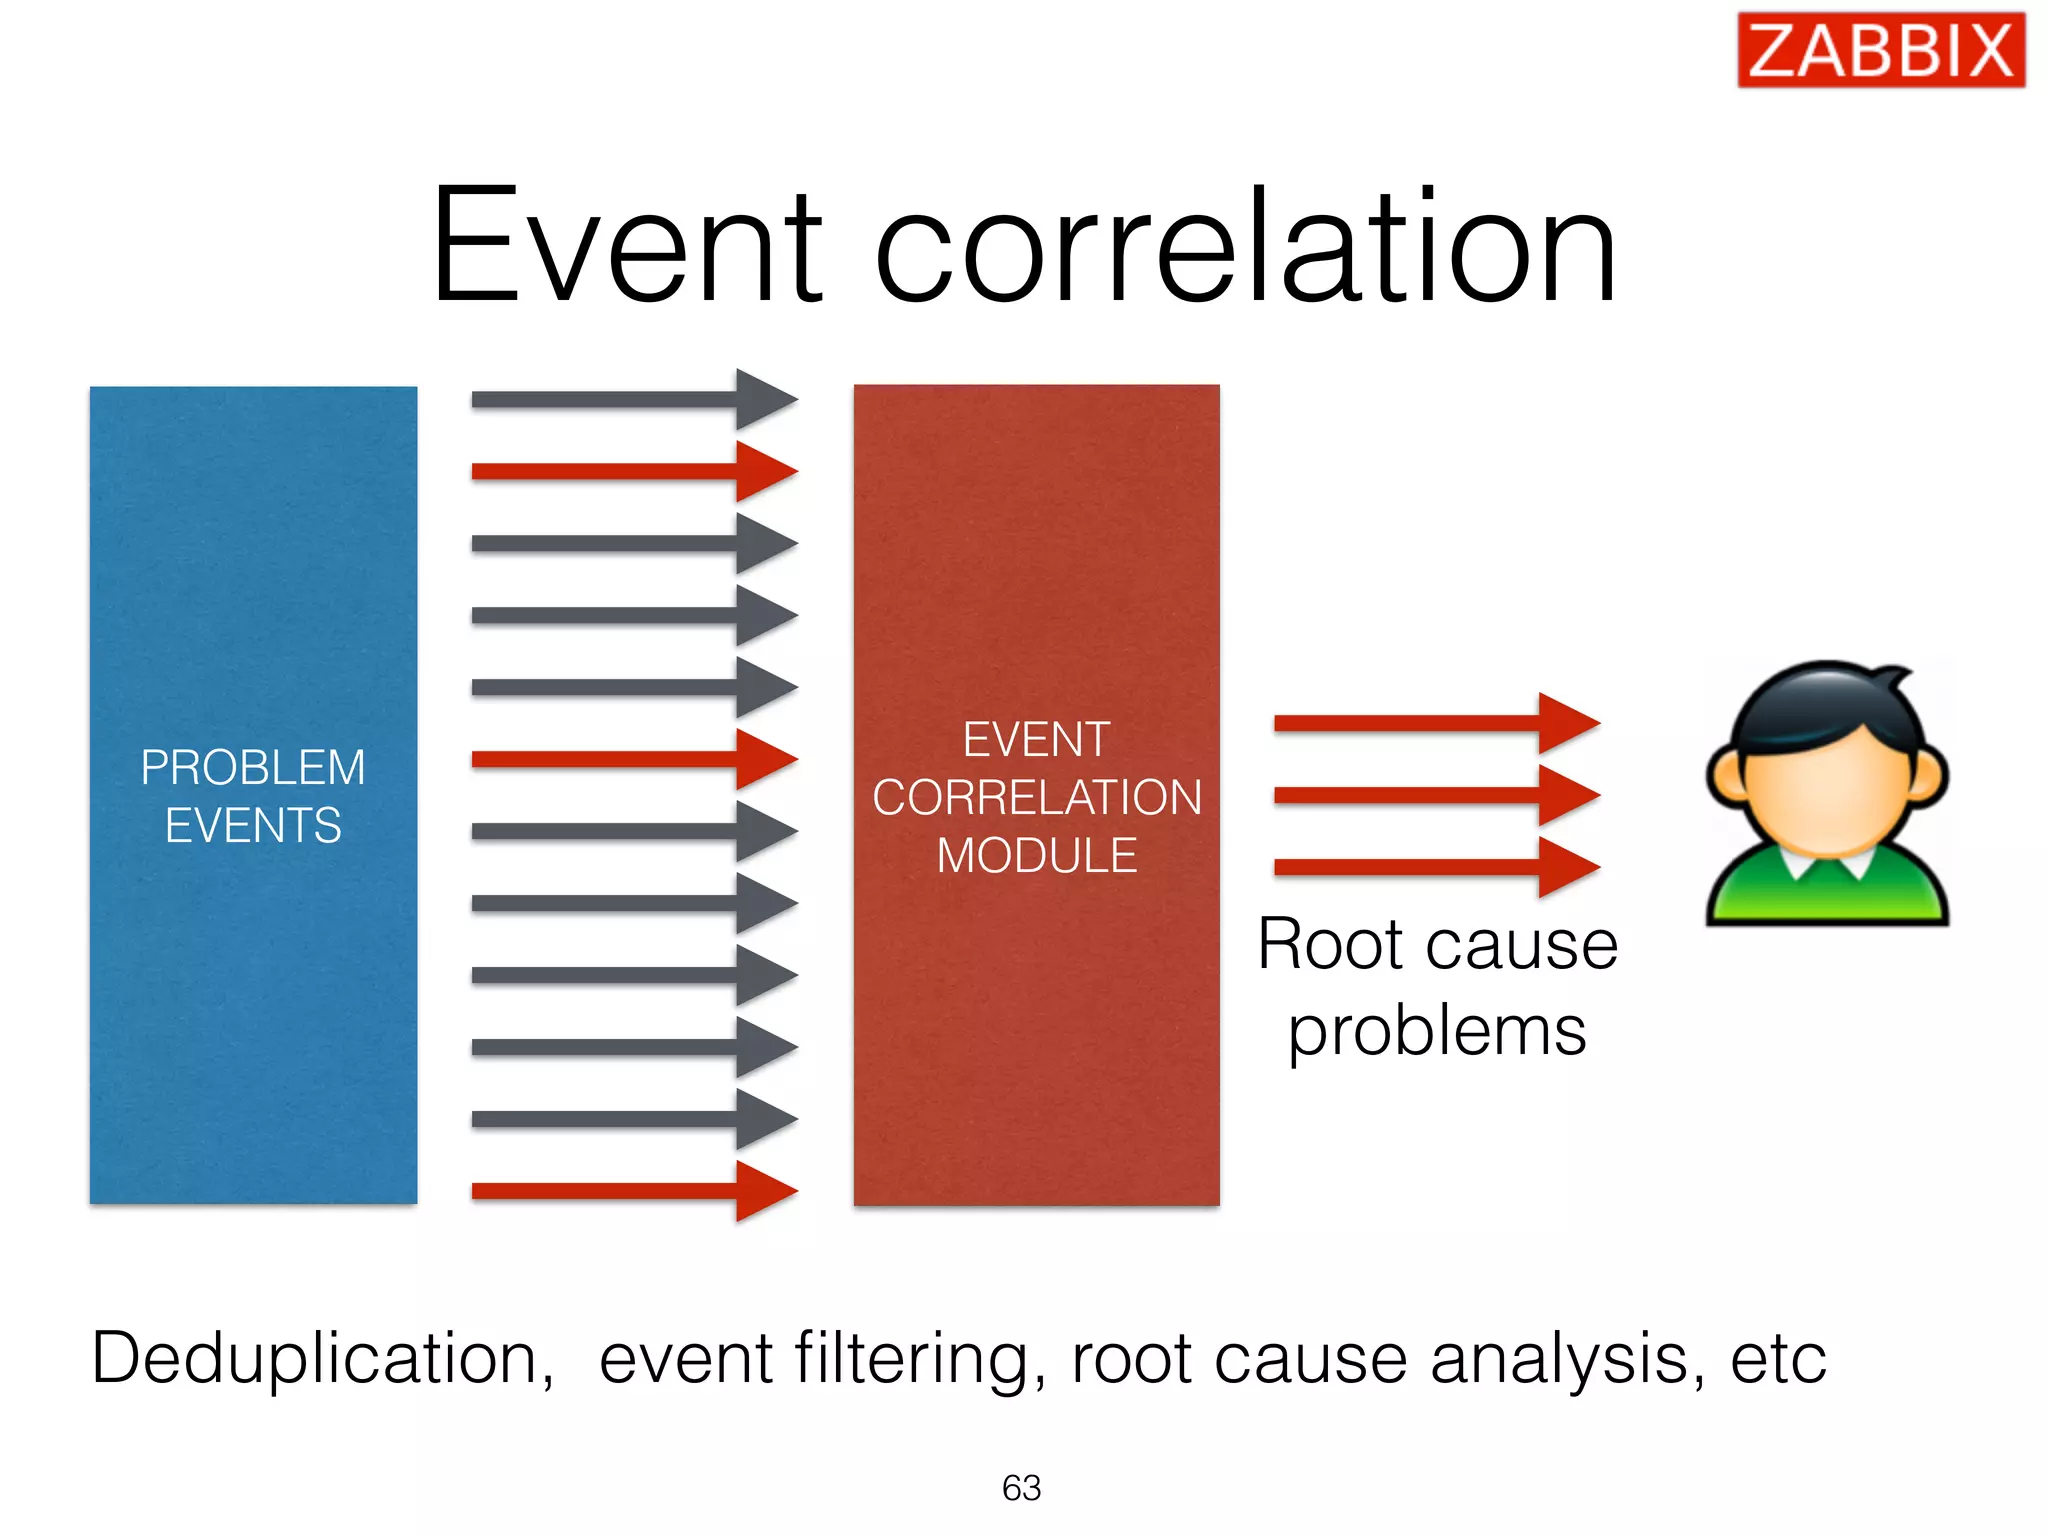

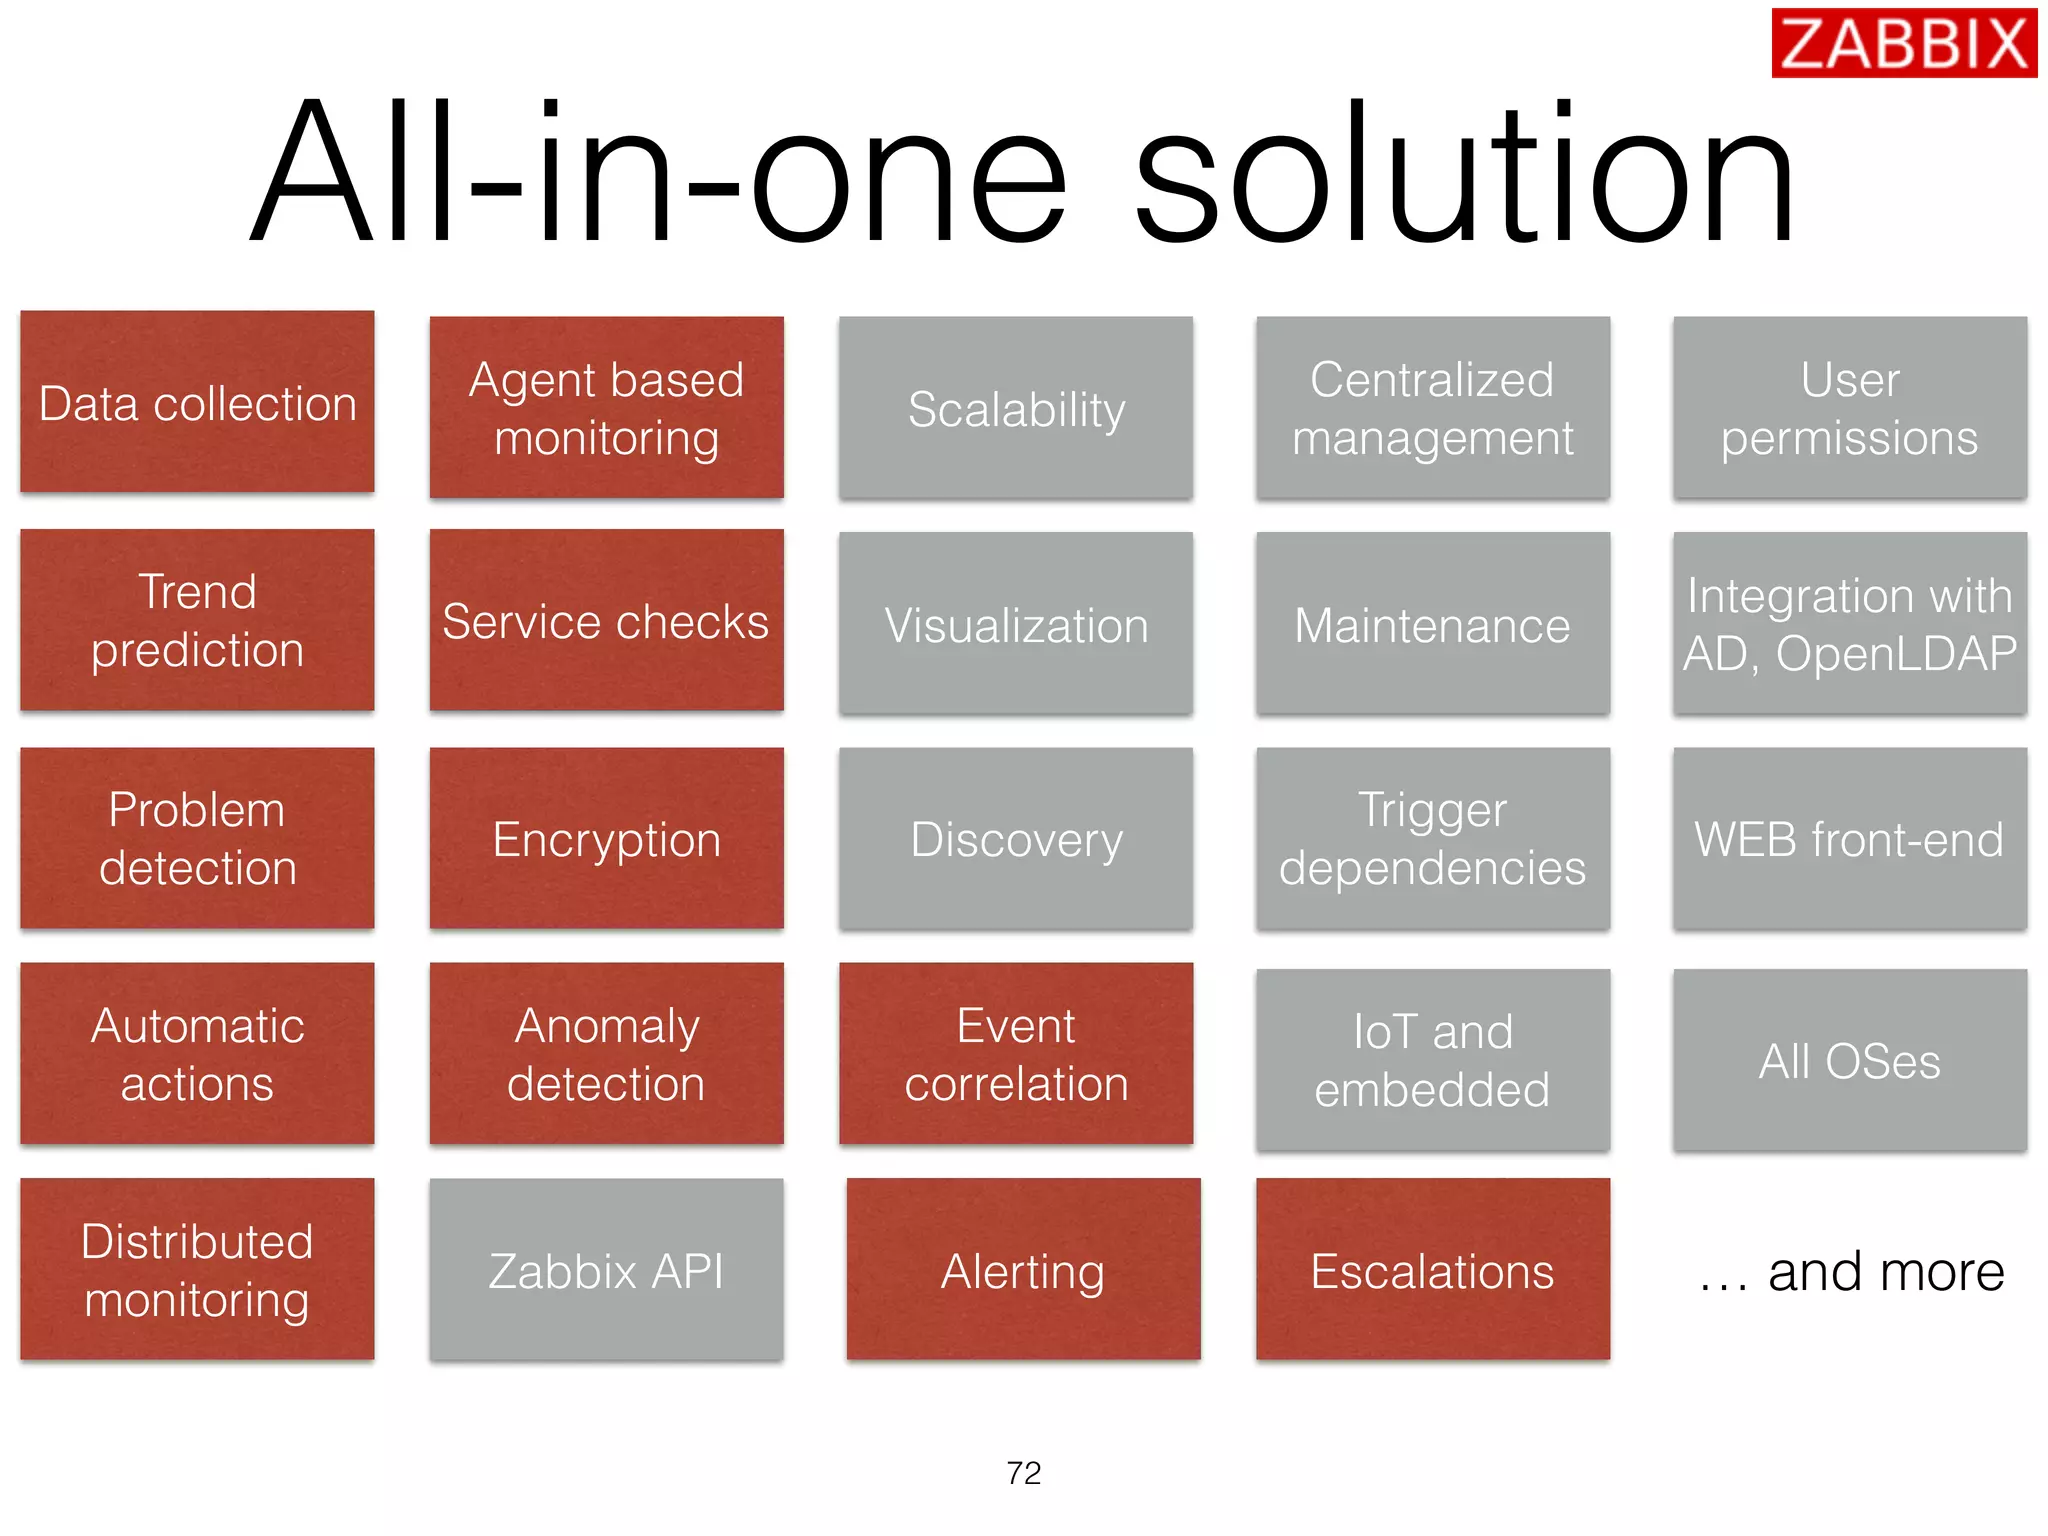


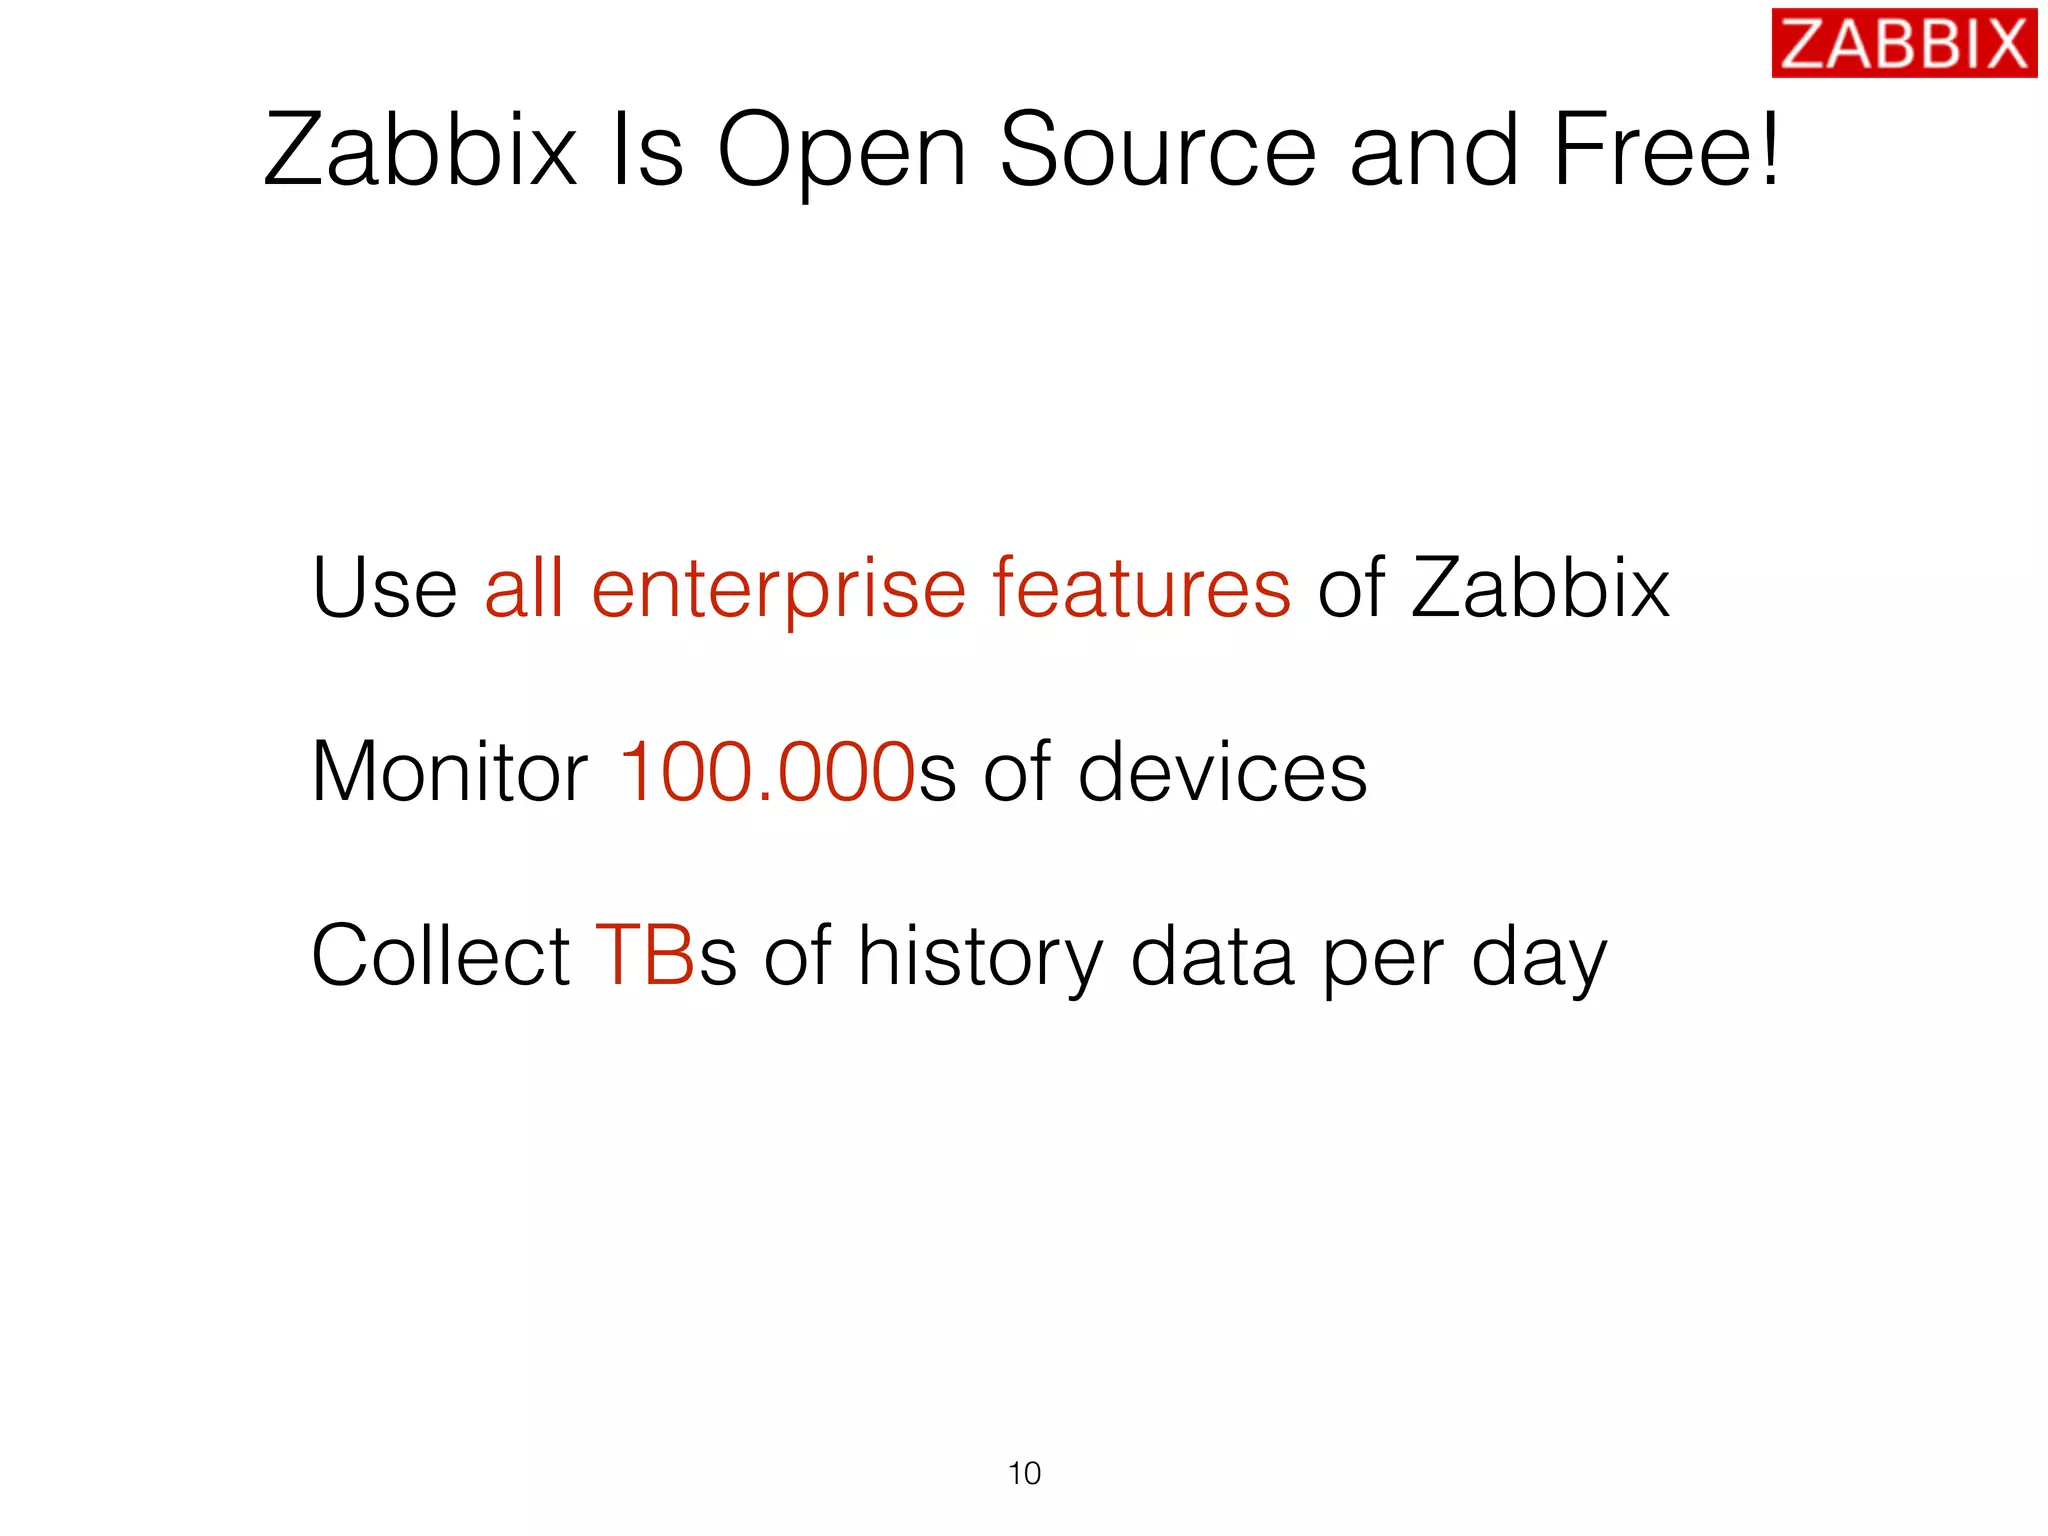
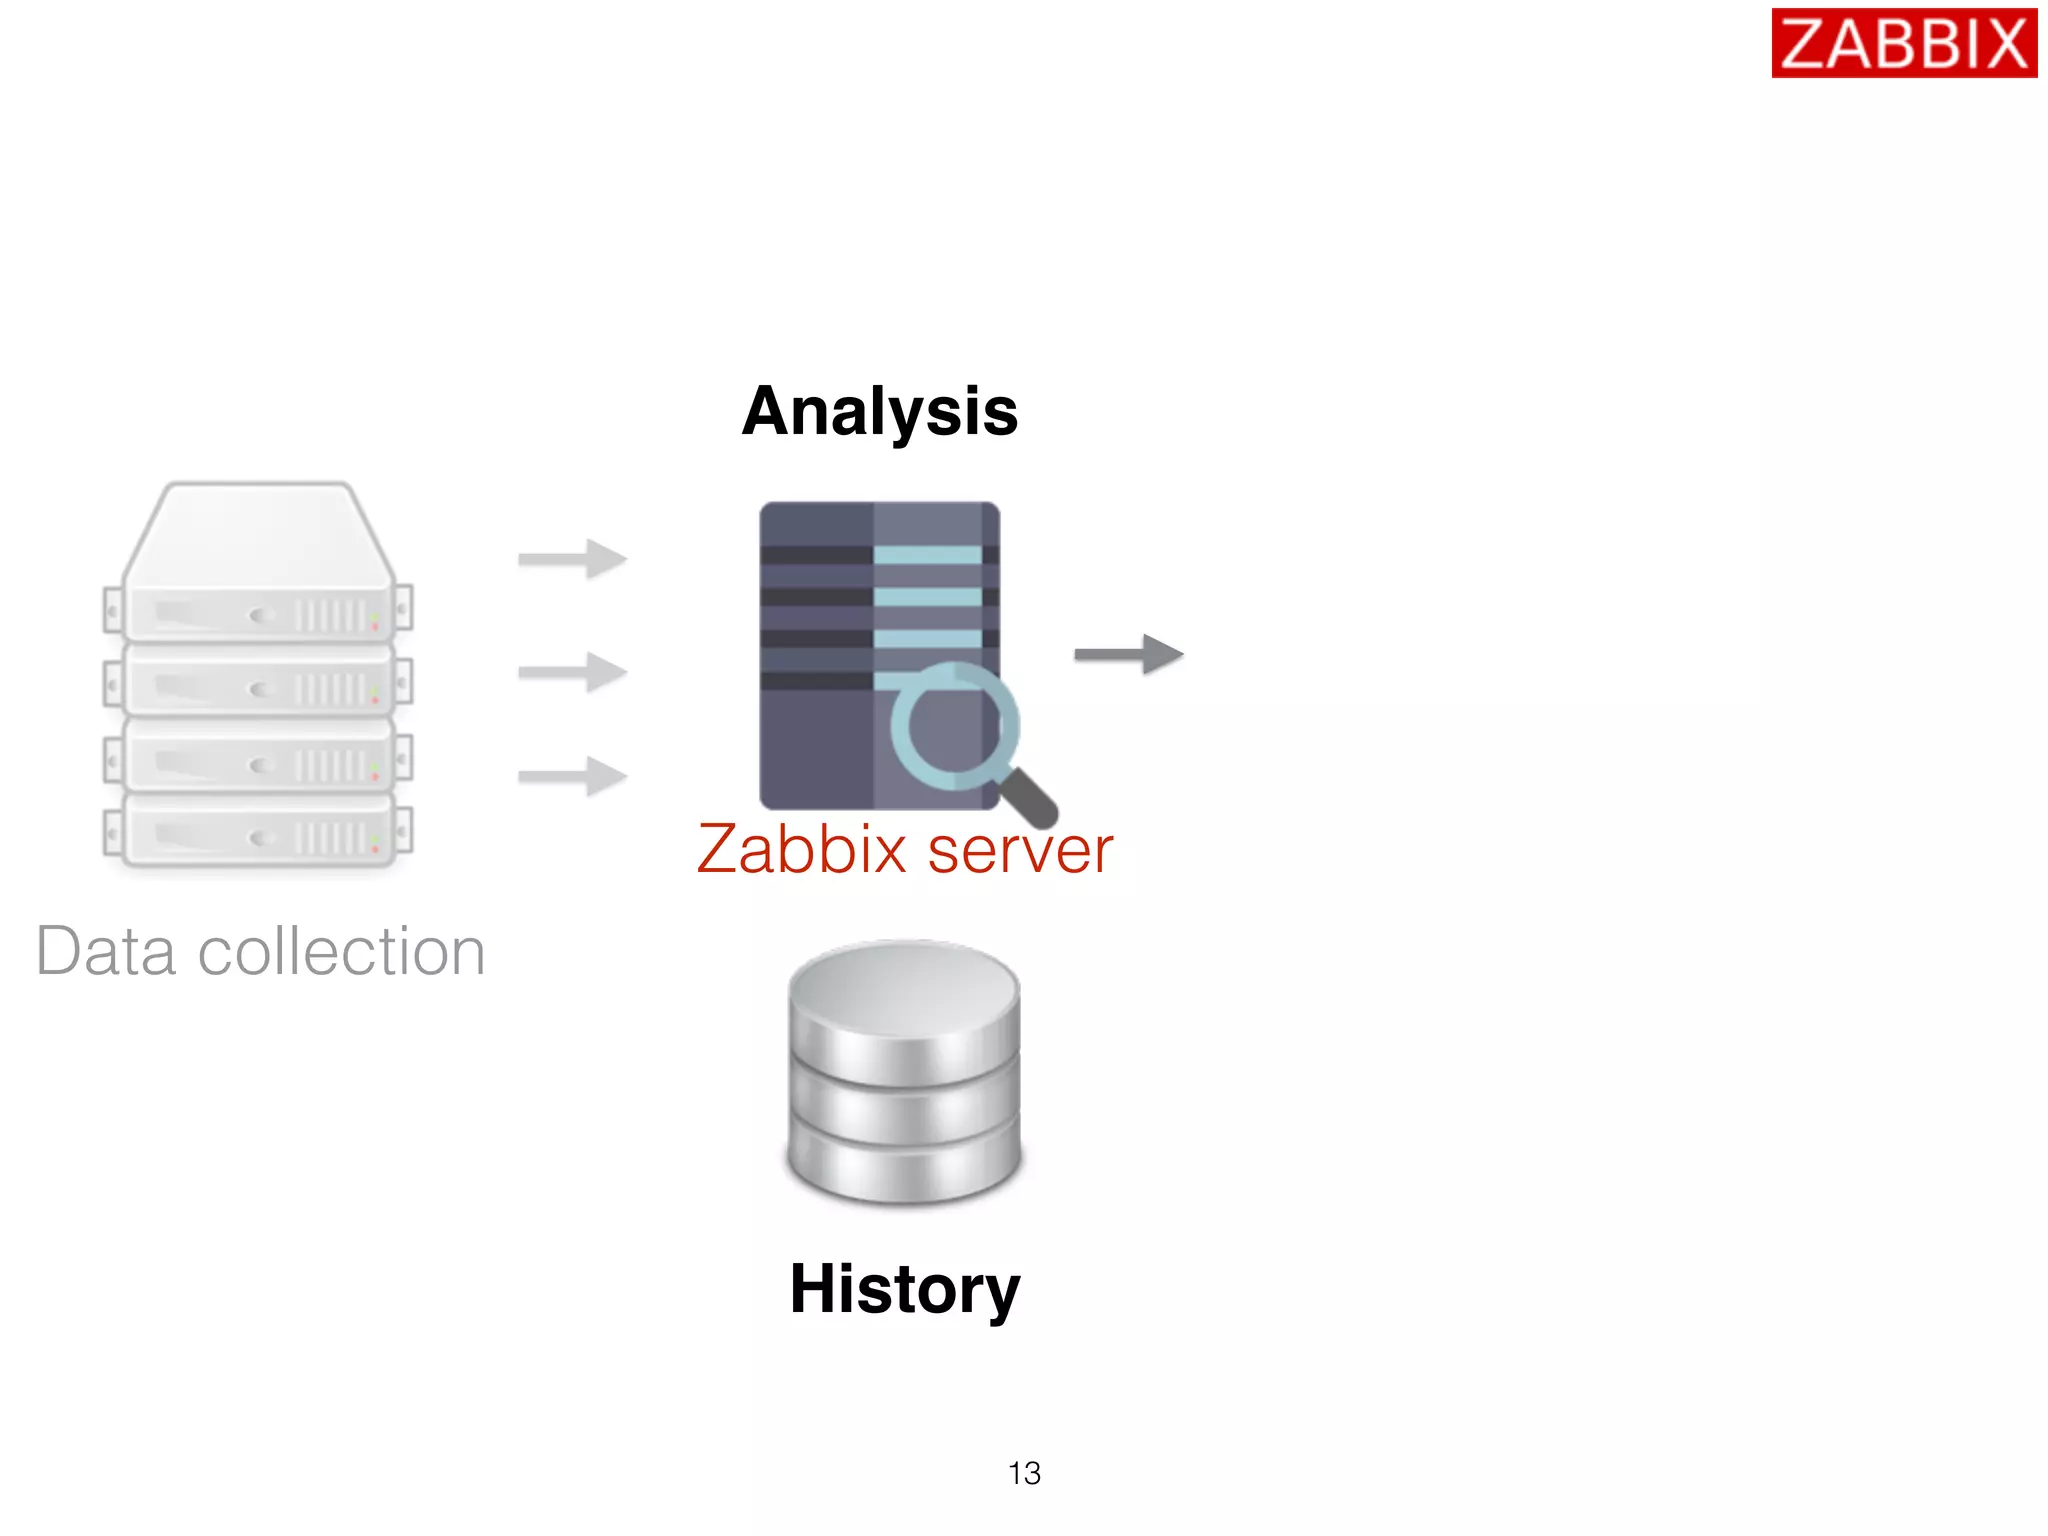
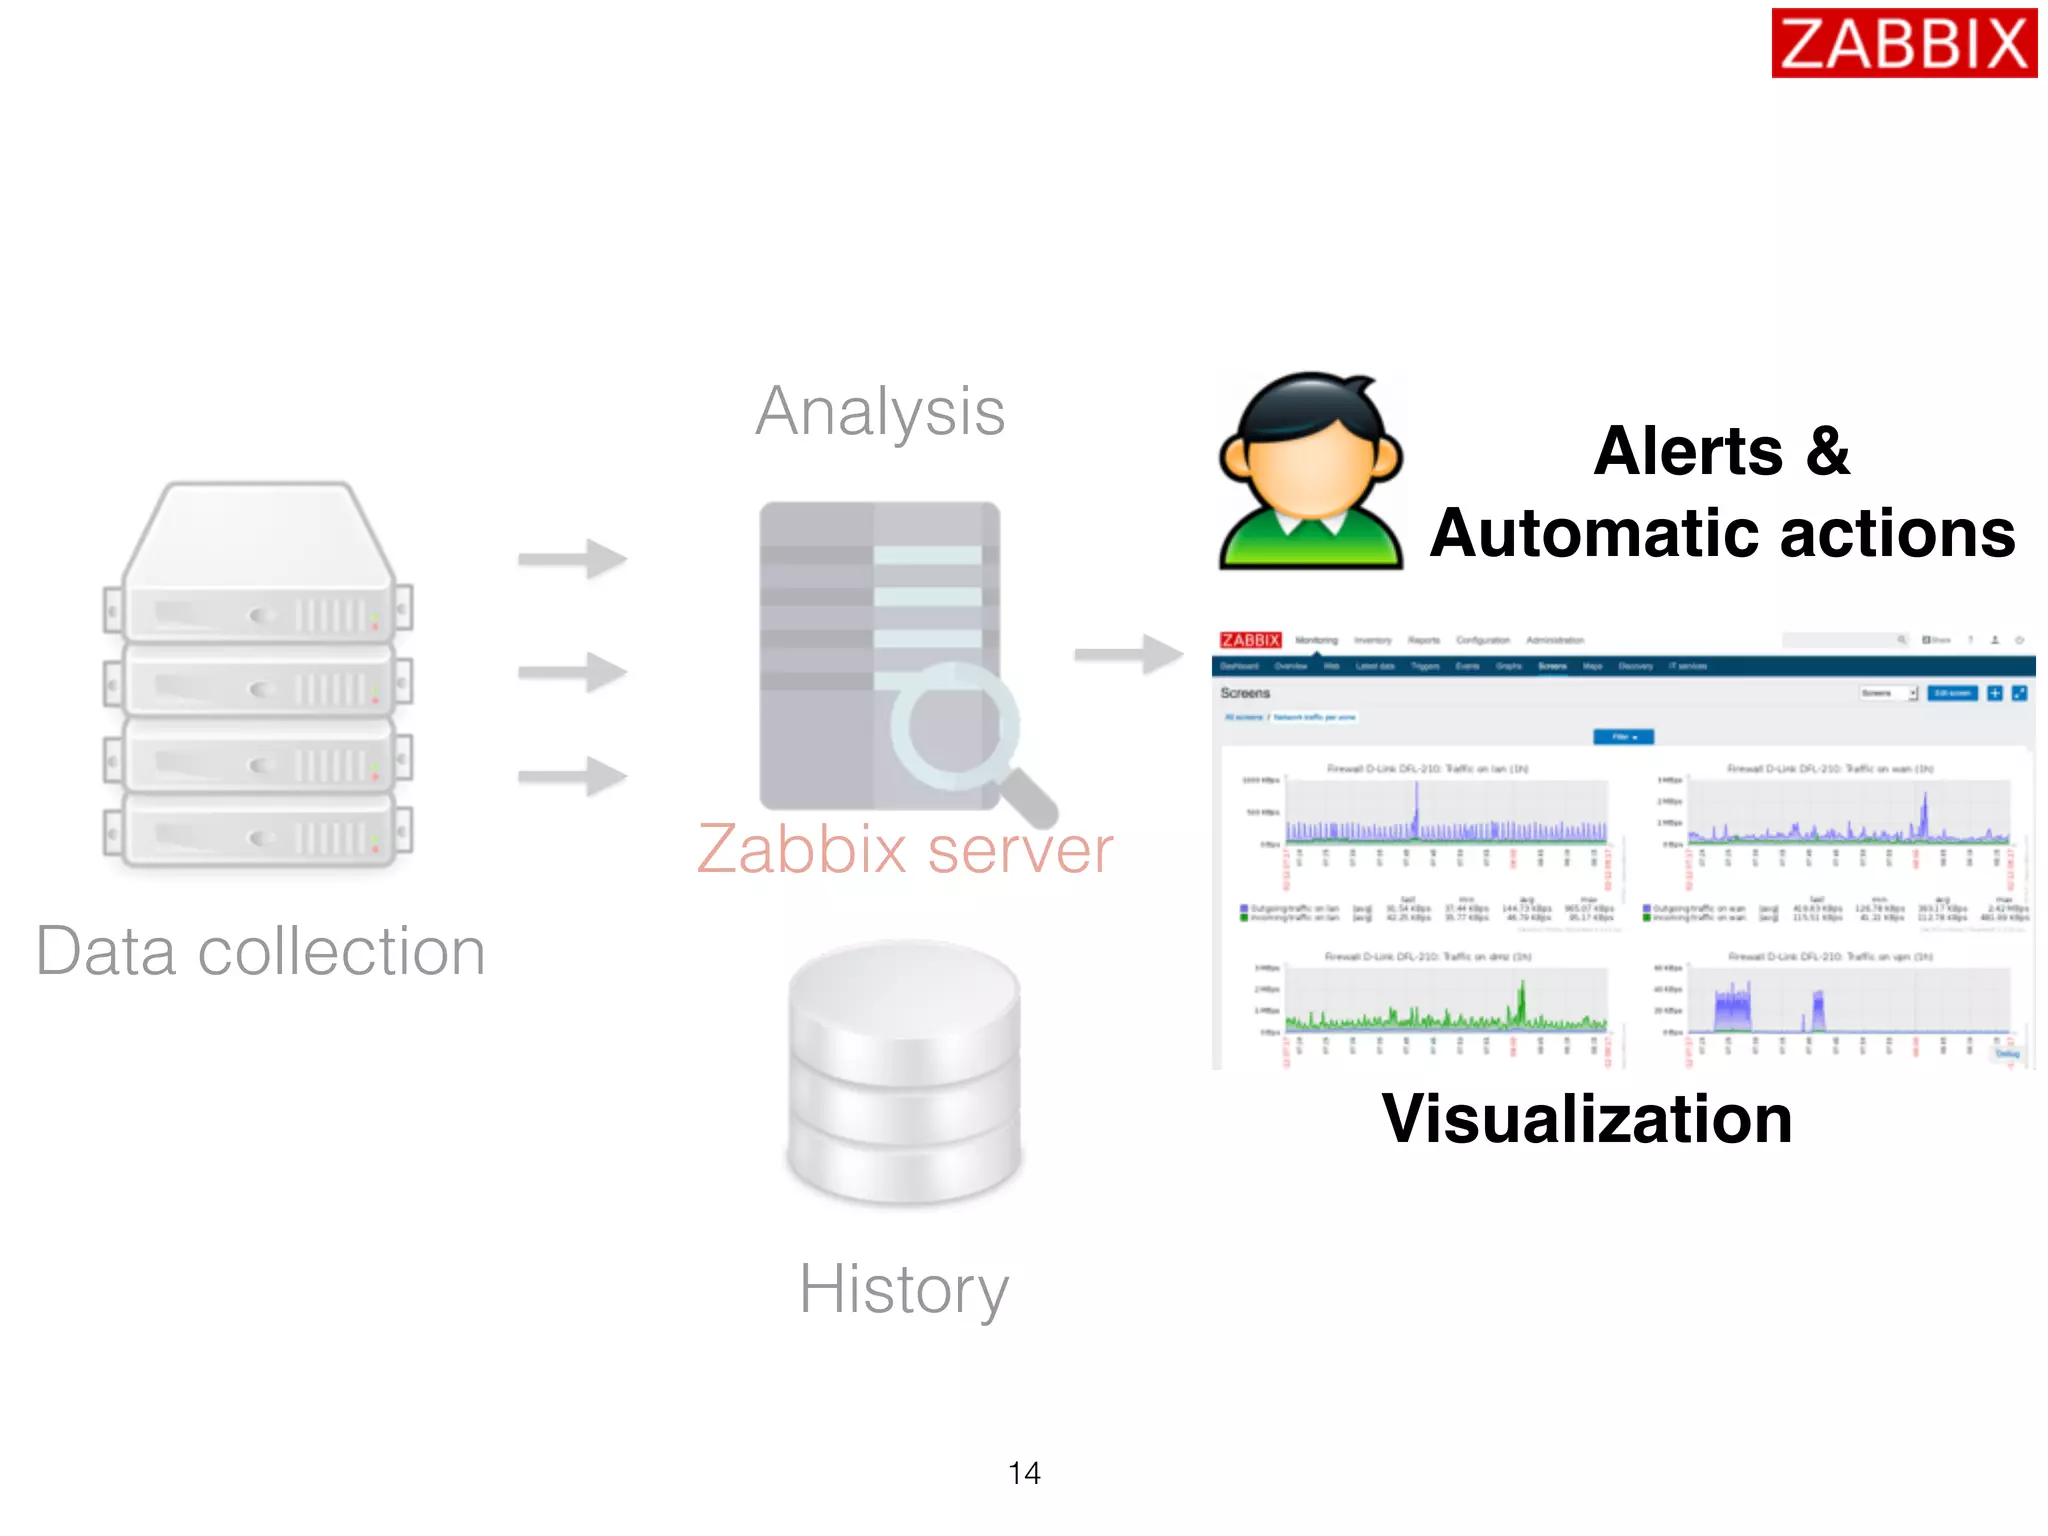
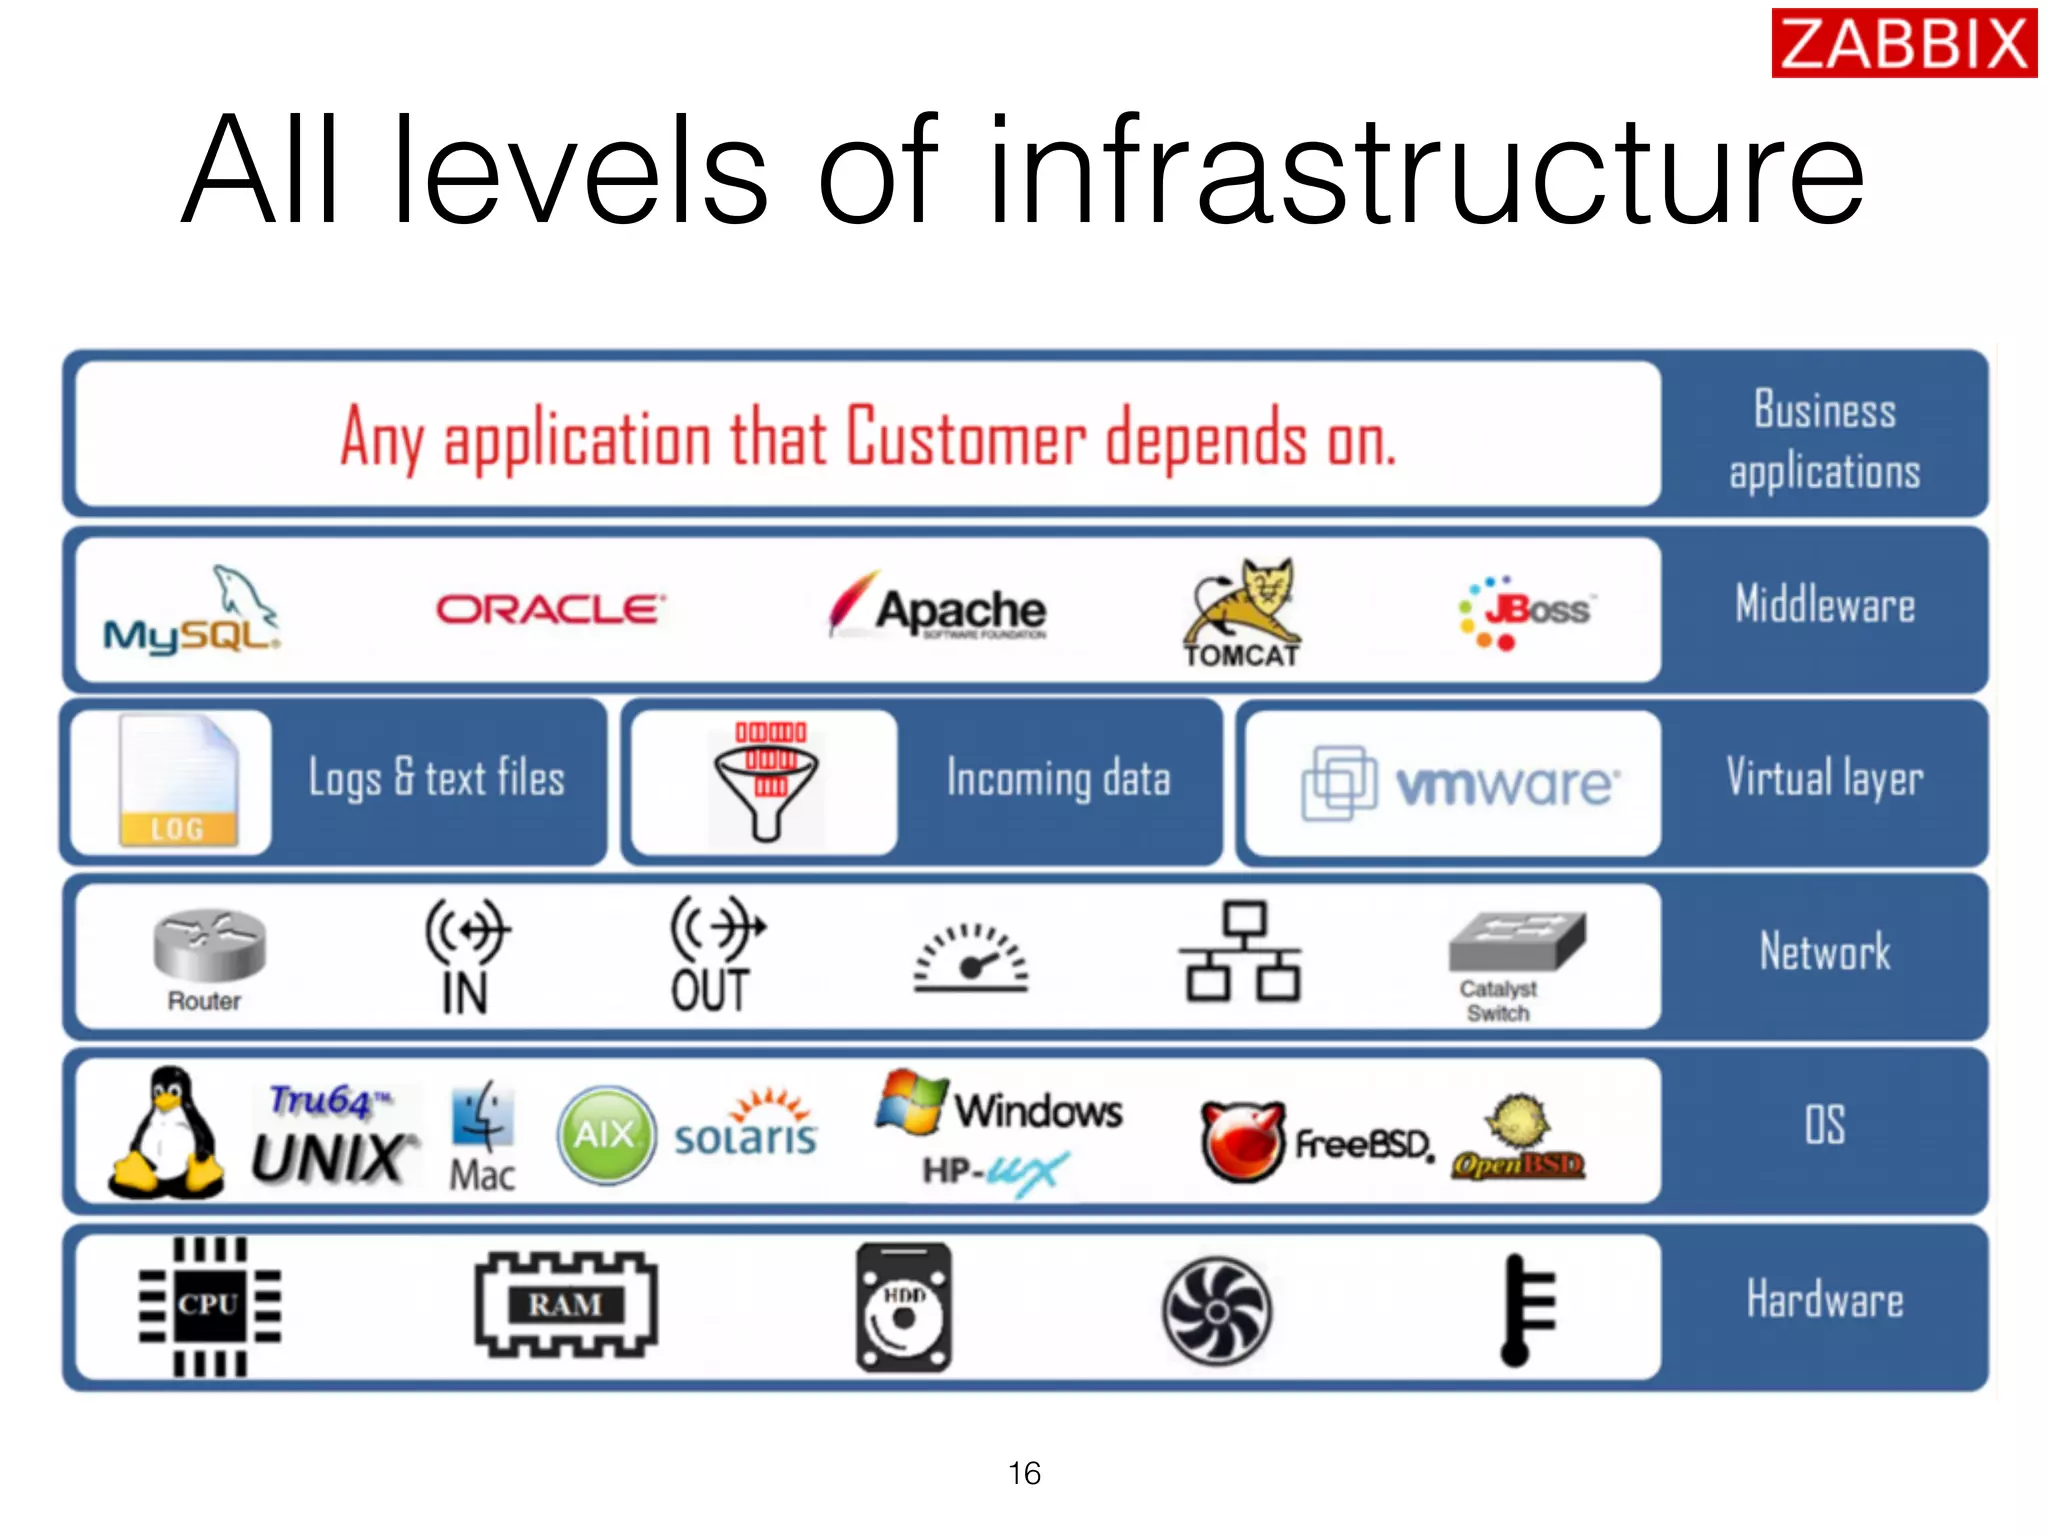
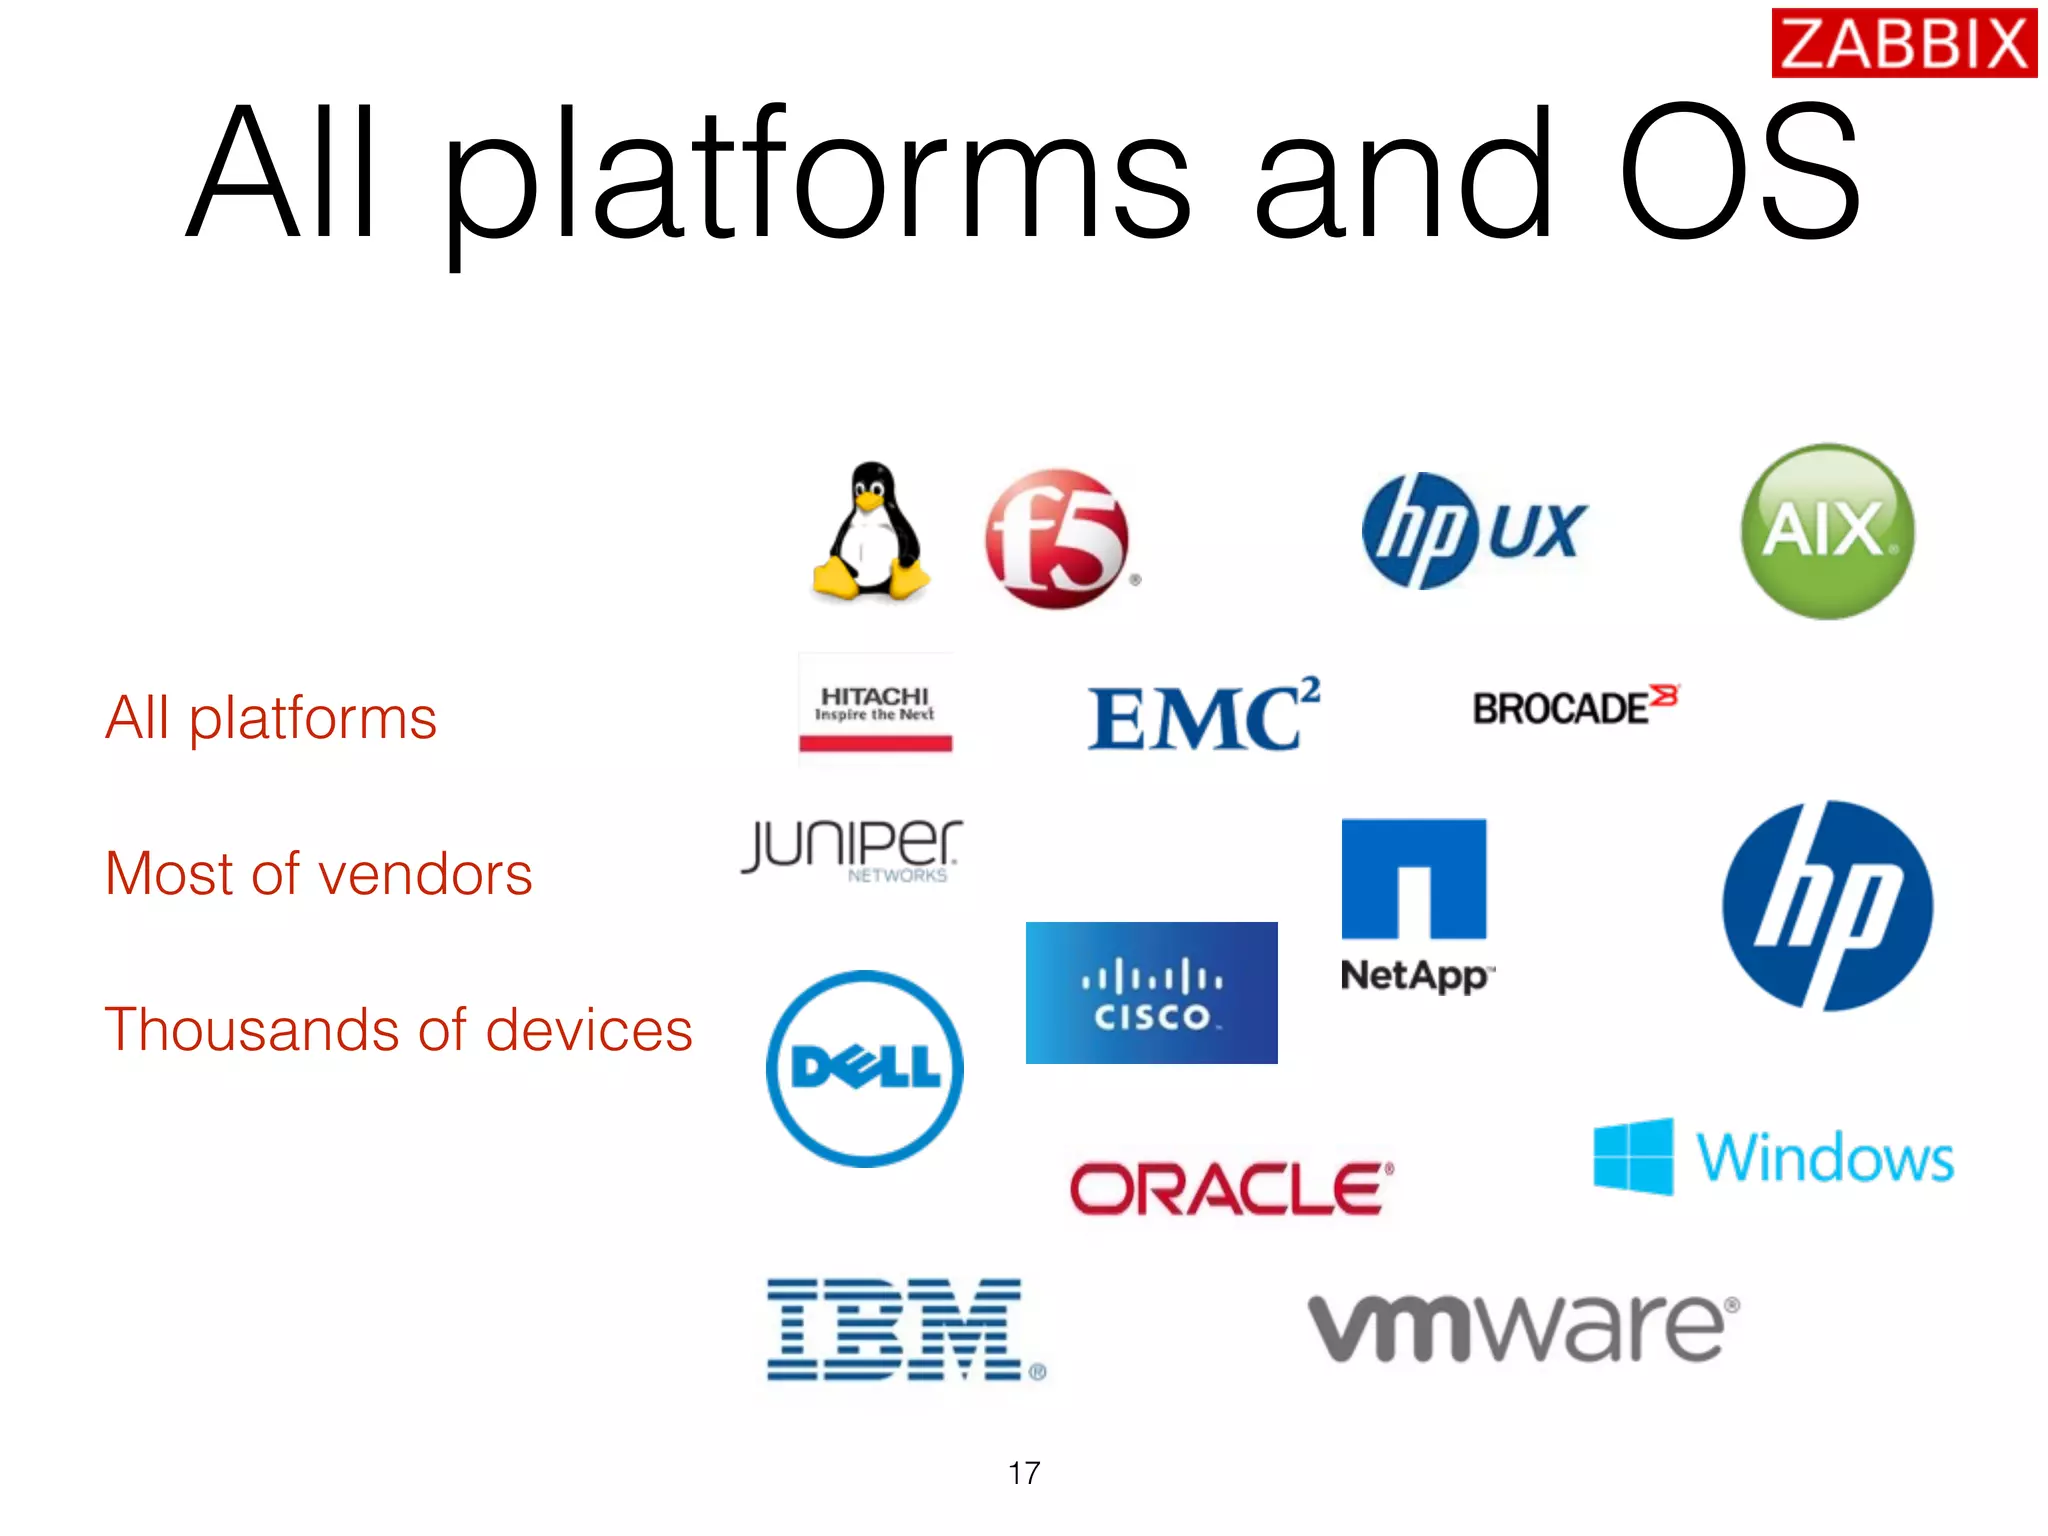
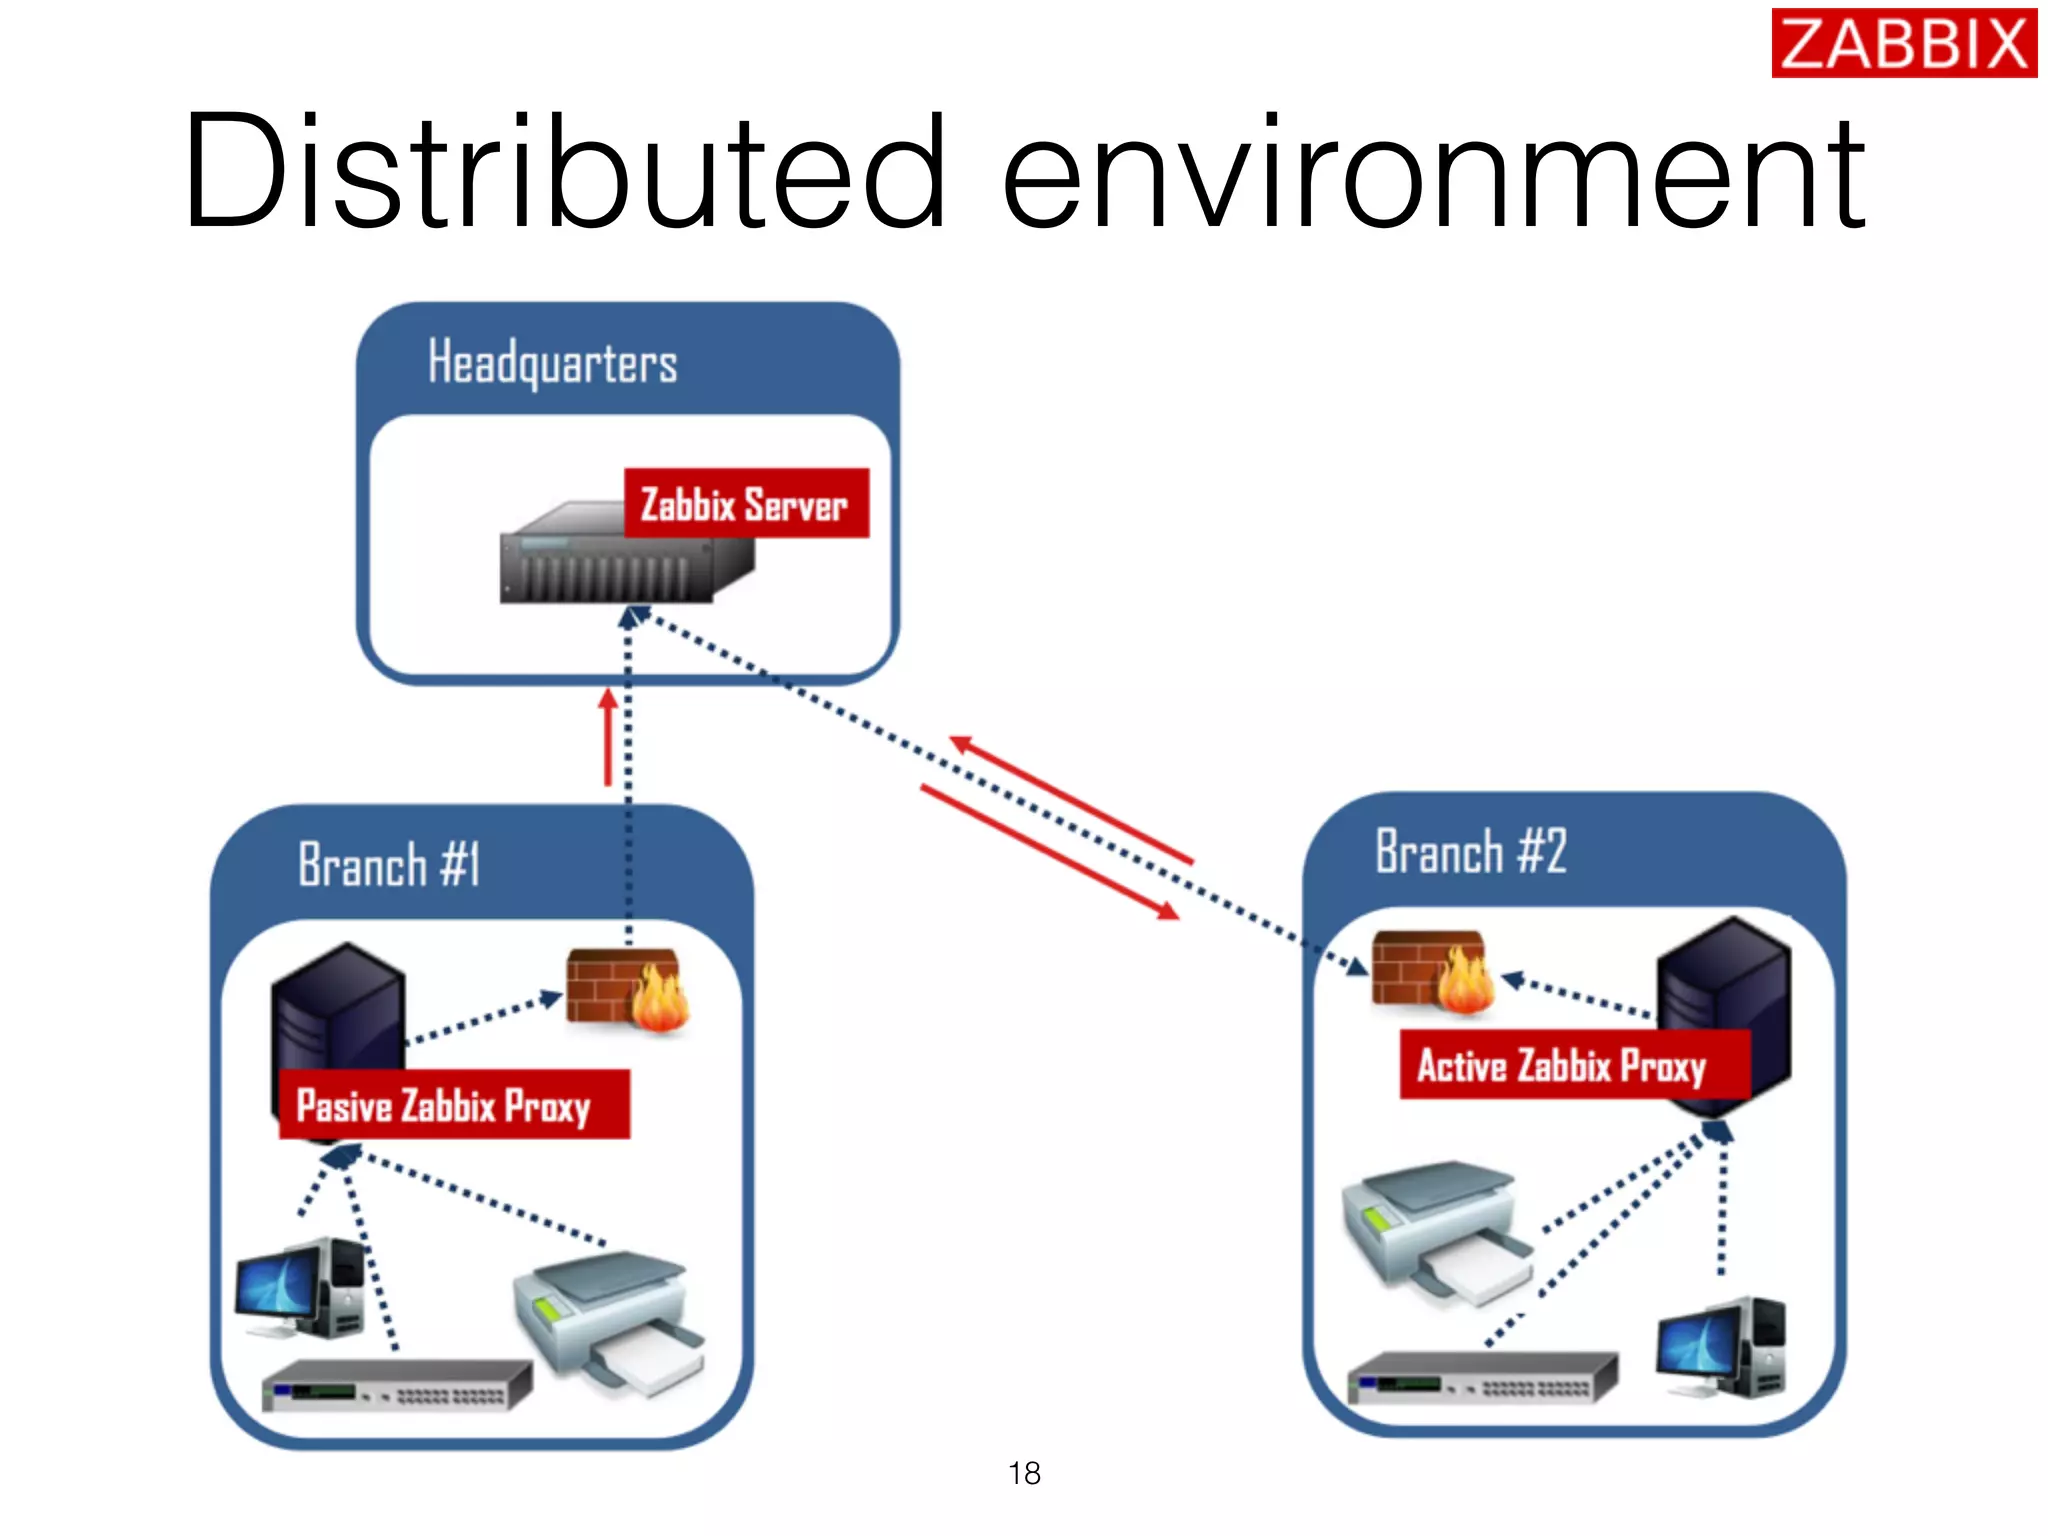
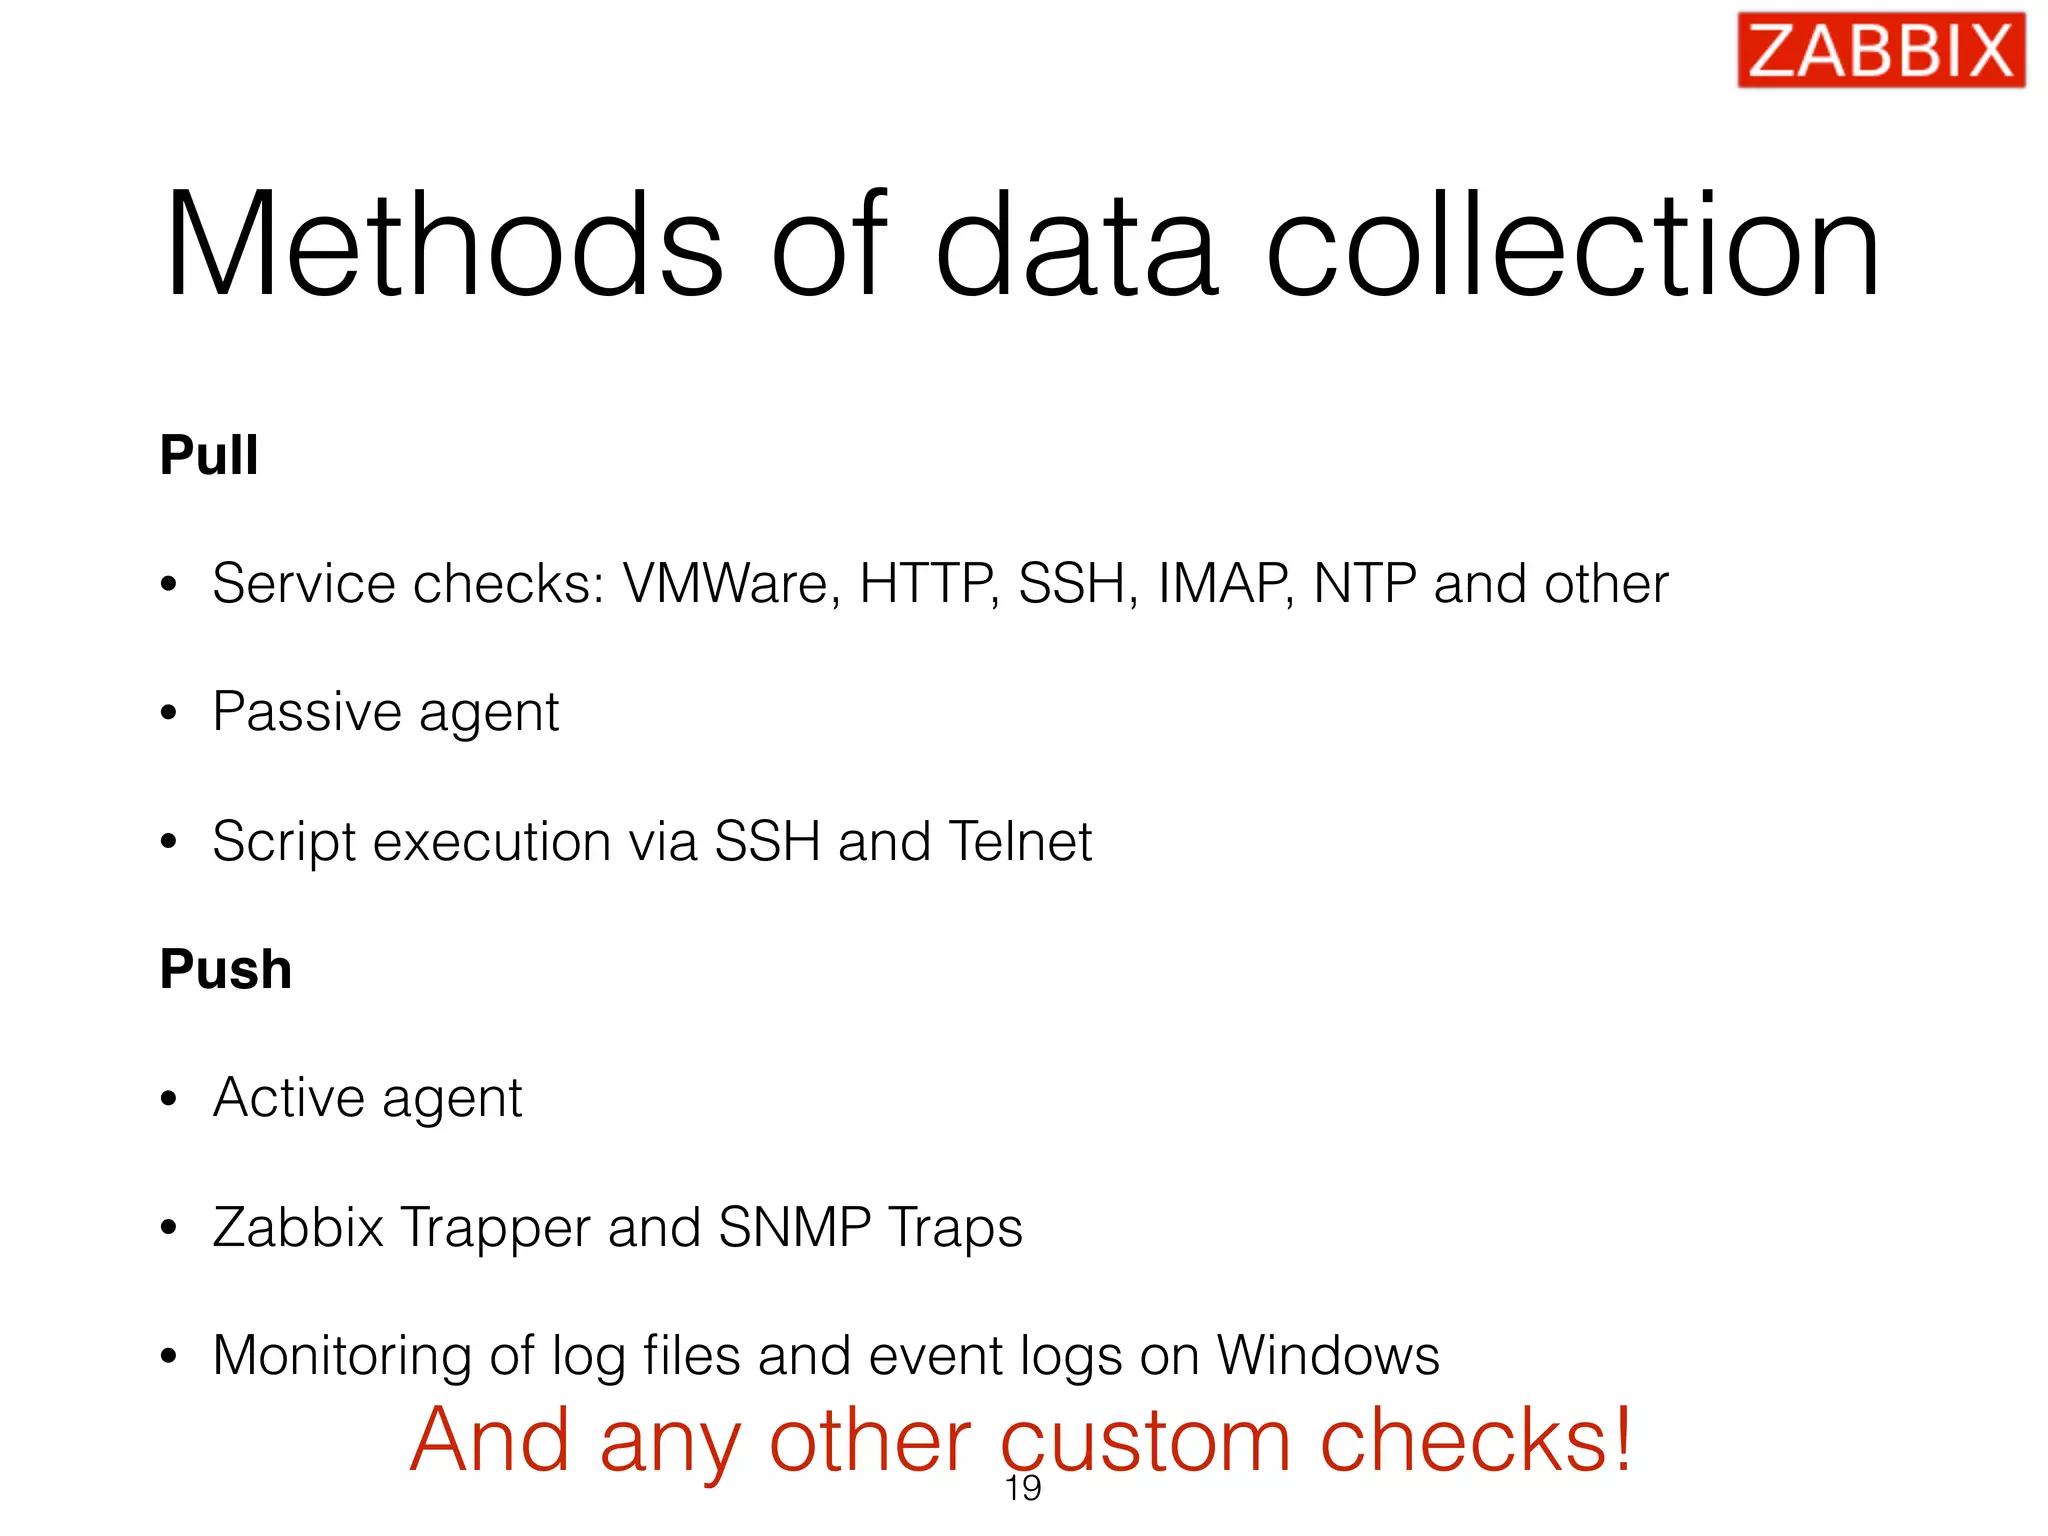
Zabbix is an open source monitoring solution that can monitor all levels of infrastructure across various platforms. It uses triggers to define problems and collects data through active and passive agents to analyze metrics and detect issues. When problems occur, Zabbix can automatically react through escalation procedures that include notifications, tickets, and restarts. It is highly scalable and offers features like anomaly detection, forecasting, and event correlation for complex environments.


![쿠키런: 킹덤 대규모 인프라 및 서버 운영 사례 공유 [데브시스터즈 - 레벨 200] - 발표자: 용찬호, R&D 엔지니어, 데브시스터즈 ...](https://cdn.slidesharecdn.com/ss_thumbnails/t3s3-221108102039-c0f48289-thumbnail.jpg?width=640&height=640&fit=bounds)


![[오픈소스컨설팅] Open Stack Ceph, Neutron, HA, Multi-Region](https://cdn.slidesharecdn.com/ss_thumbnails/openstackoscv0-160718105826-thumbnail.jpg?width=640&height=640&fit=bounds)