Download as PDF, PPTX


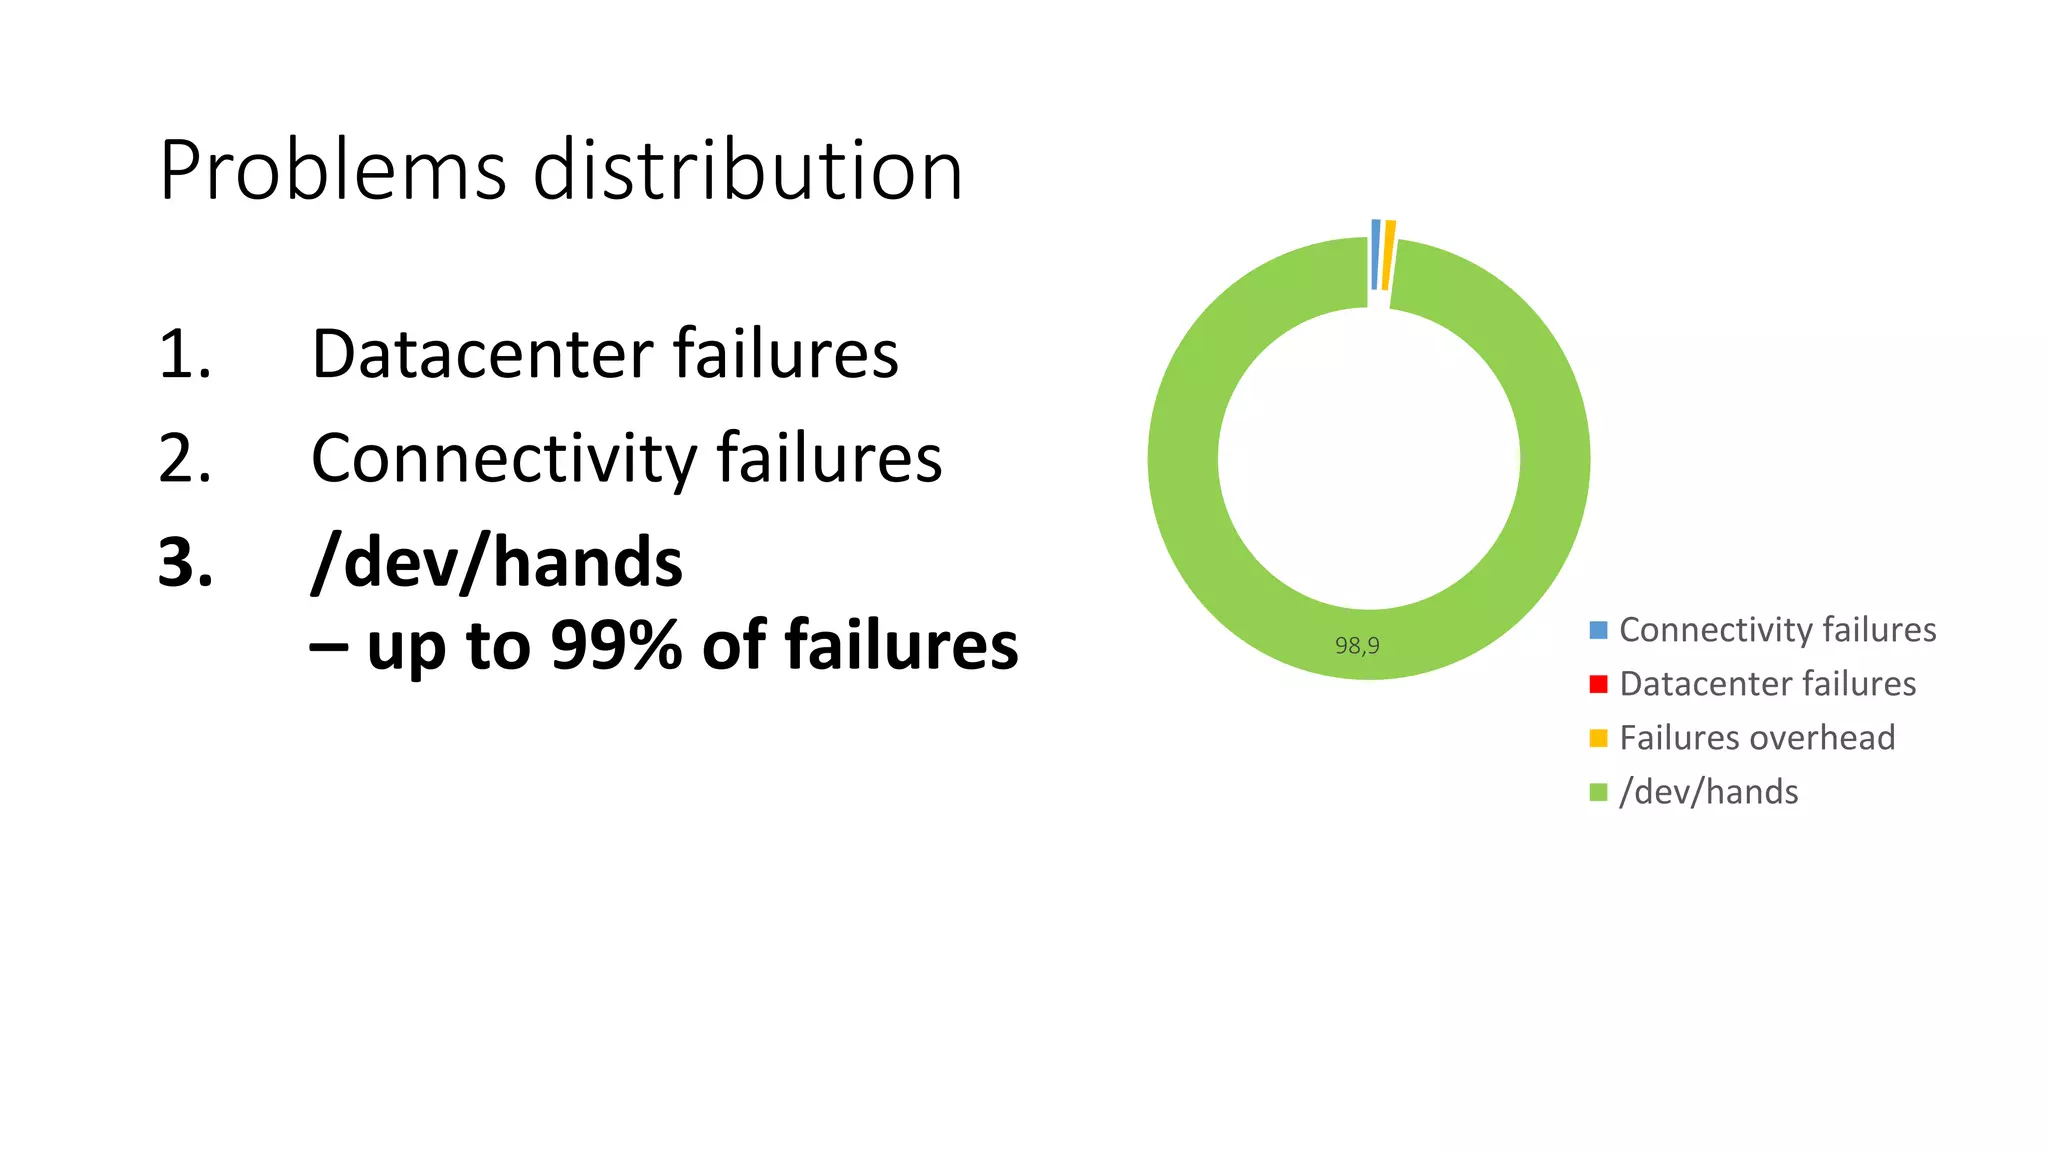
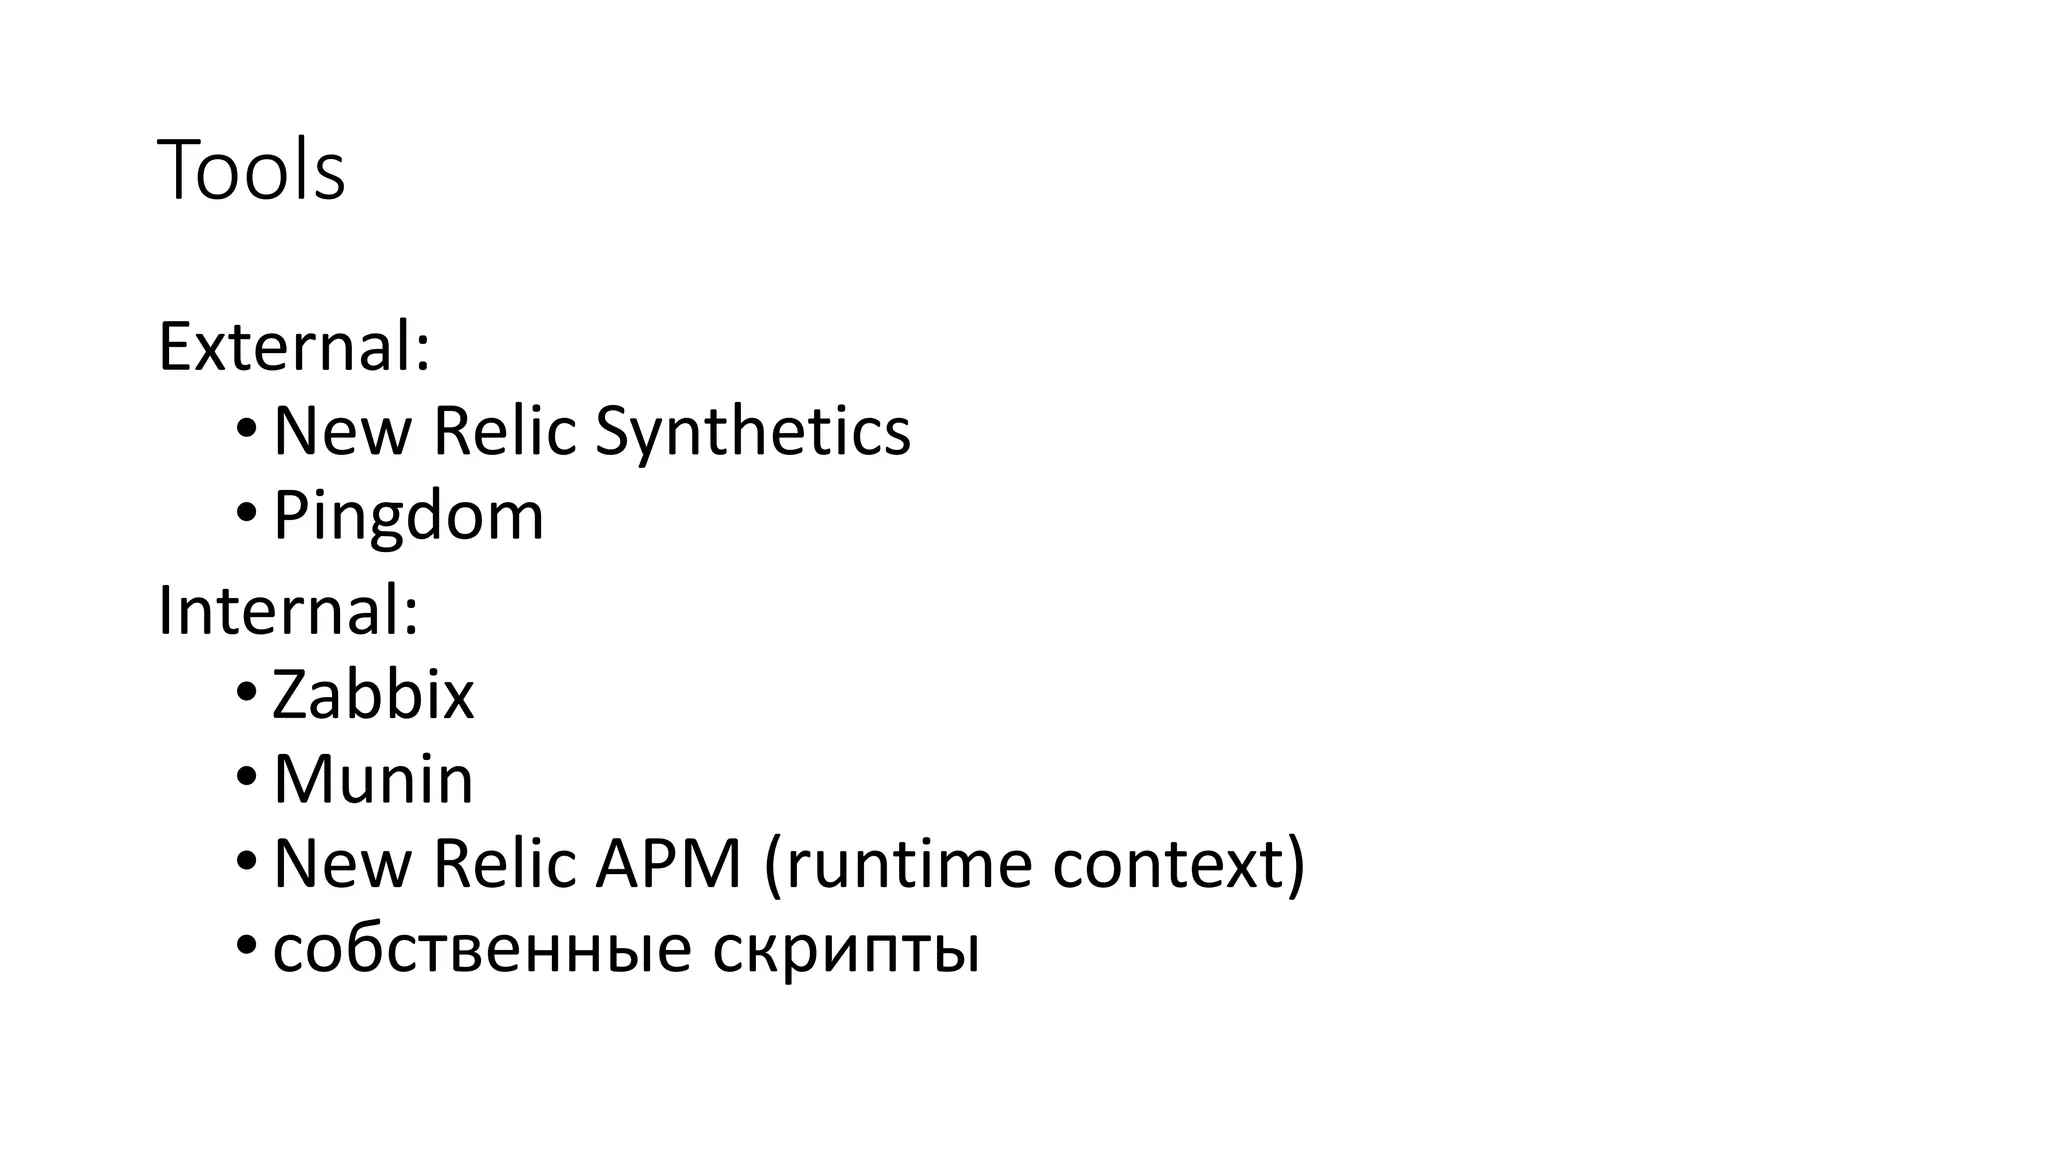


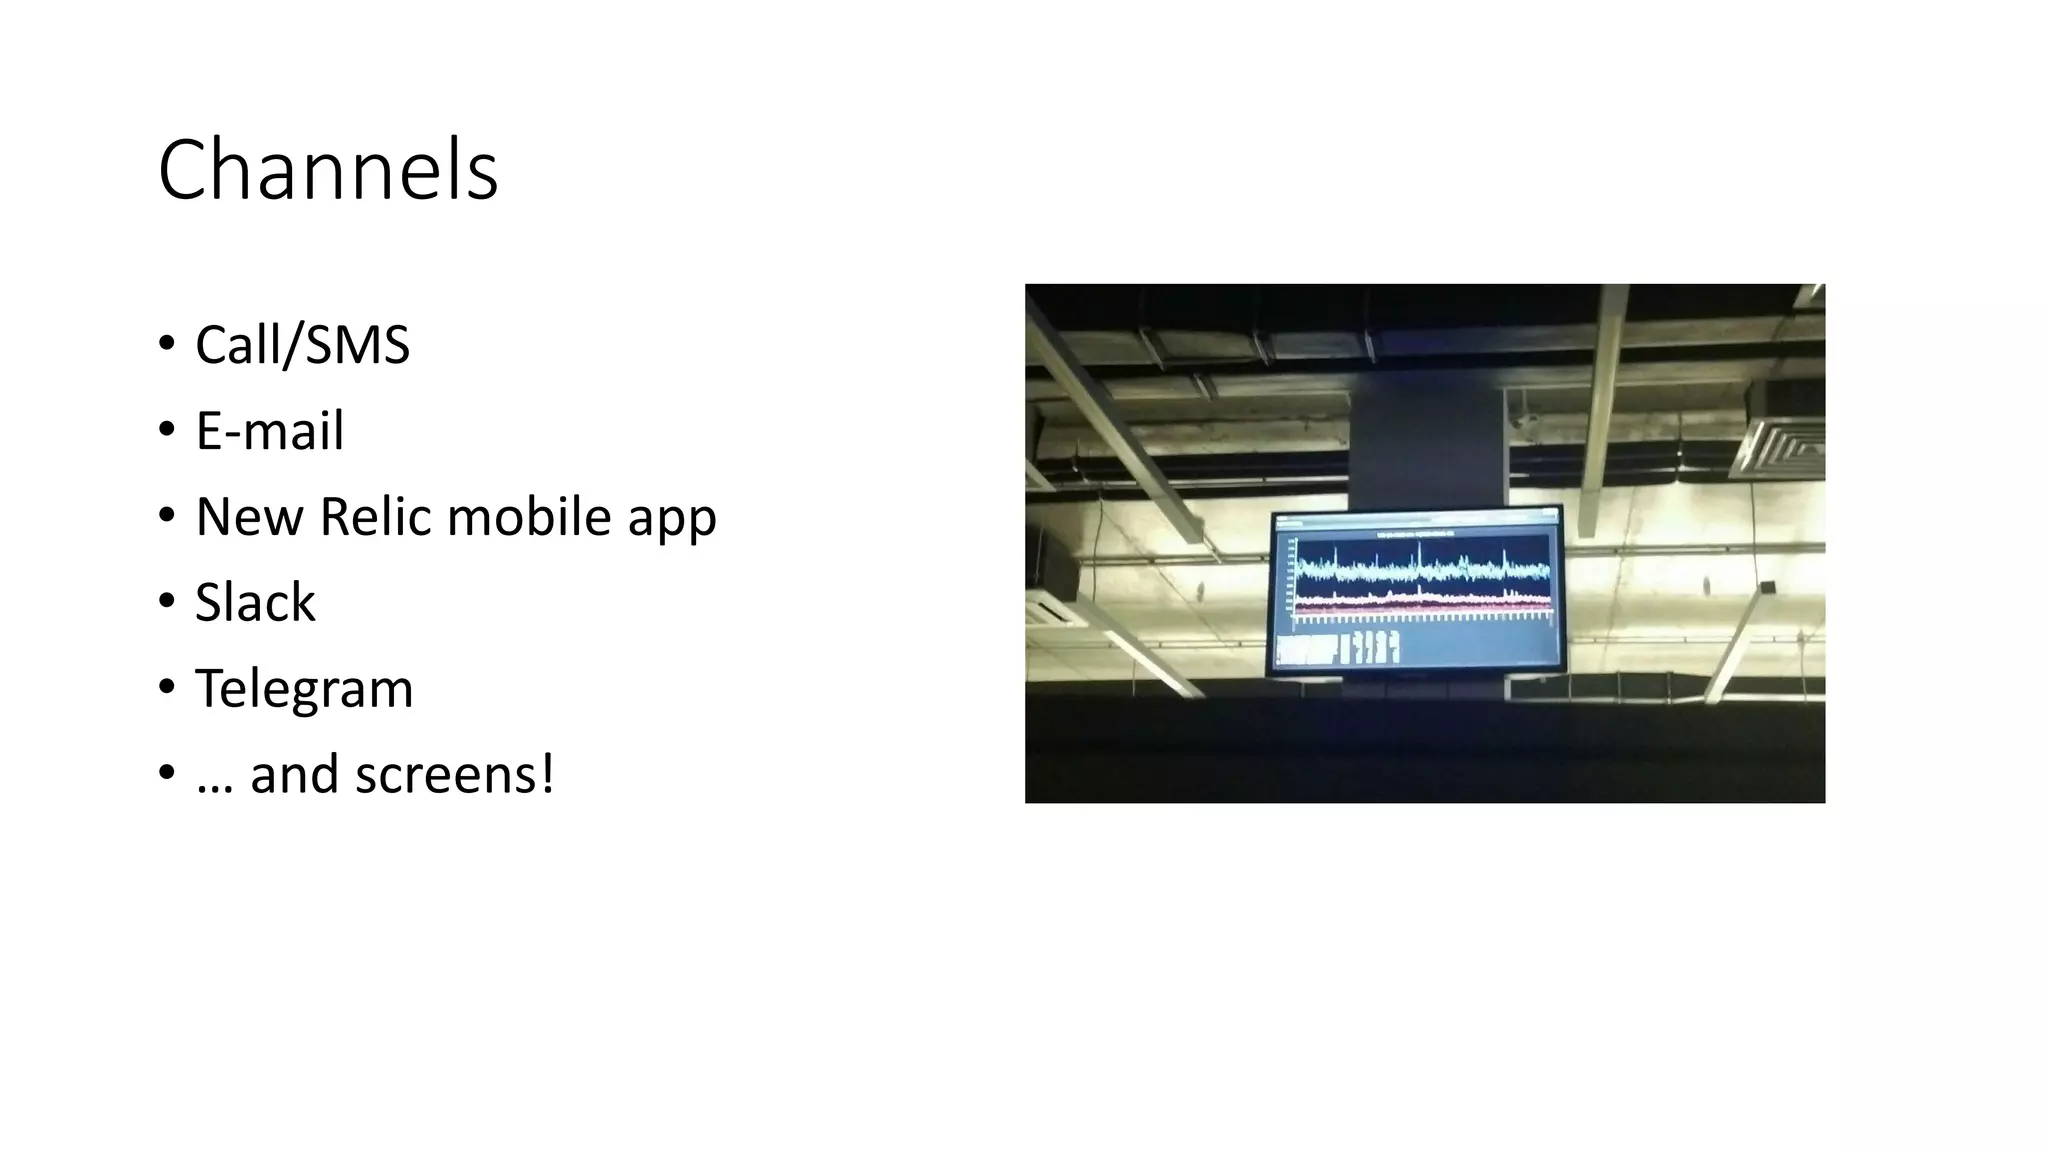


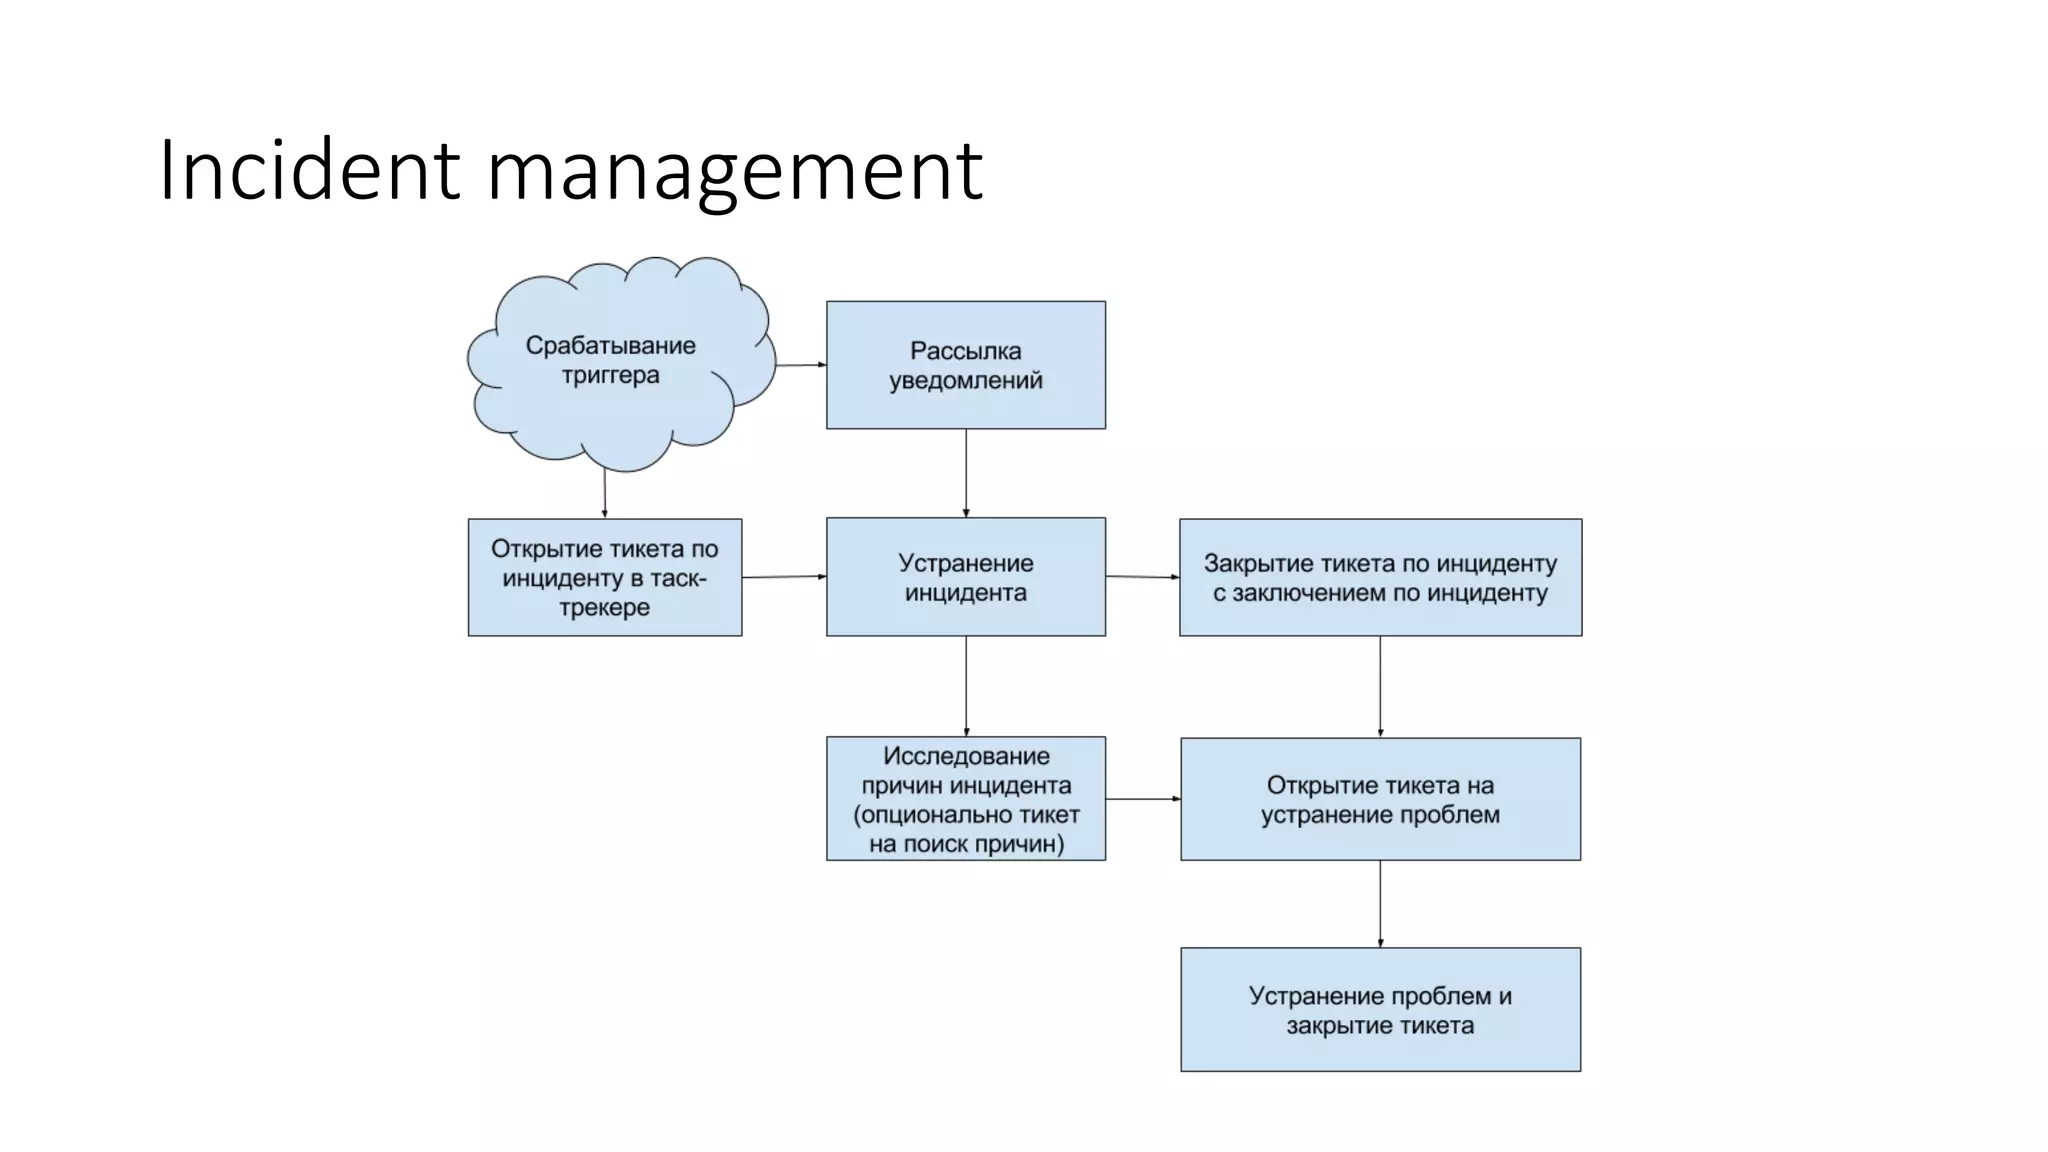


The document, authored by Stanislav Osipov, discusses strategies for monitoring in the online advertising industry, highlighting various failure types, tools, and the importance of incident management. It outlines a three-layer metric system for Zabbix monitoring and recommends escalation procedures for operational issues. Additionally, it emphasizes the need for improved communication channels and integrations for effective management of deployments and incident reporting.


