The document discusses the use of the Elastic Stack as a Security Information and Event Management (SIEM) tool, detailing its components, functionalities, and benefits for threat detection and incident response. John Hubbard, a security expert, outlines the architecture, features, and use cases for the Elastic Stack, highlighting its adaptability, log management capabilities, and visualization tools. Furthermore, it addresses the technical requirements for optimal implementation and various logging strategies to enhance performance and data processing.


![Who Am I?
John Hubbard [@SecHubb]
• Previous SOC Lead @ GlaxoSmithKline
• Certified SANS Instructor
• Author
• SEC450: Blue Team Fundamentals – Security Analysis and Operations
• SEC455: SIEM Design & Implementation (Elasticsearch as a SIEM)
• Instructor
• SEC511: Continuous Monitoring & Security Operations
• SEC555: SIEM with Tactical Analytics
• Mission: Make life awesome for the blue team
• Data for this talk: https://github.com/SecHubb/SecShell_Demo](https://image.slidesharecdn.com/theelasticstackasasiem-190223124355/85/The-Elastic-Stack-as-a-SIEM-2-320.jpg)
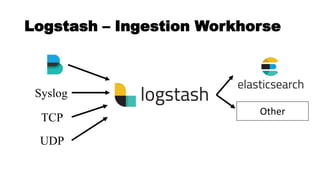
![What is a SIEM?
• A central log repository that enriches
logs and assists threat detection
• Components
• Log Sources
• Log Aggregator
• Log Storage & Indexing
• Search & Viz. Interface + Alerting Engine
Log Sources
Log Aggregation
/ Queue
Log Storage &
Indexing
Search,
Visualization, &
Alerting
John Hubbard [@SecHubb] 3](https://image.slidesharecdn.com/theelasticstackasasiem-190223124355/85/The-Elastic-Stack-as-a-SIEM-3-320.jpg)
![What is the
Elastic Stack?
• Open source, real-time
search and analytics engine
• Made up of 4 pieces:
collection, ingestion,
storage, and visualization
John Hubbard [@SecHubb] 4](https://image.slidesharecdn.com/theelasticstackasasiem-190223124355/85/The-Elastic-Stack-as-a-SIEM-4-320.jpg)
![History of
Elastic 2010
Created by Shay Bannon
Recipe search engine for his wife in
culinary school
Inspired by Minority Report
2012
Elastic Co. Founded
2019
Used by Wikipedia, Stack Overflow,
GitHub, Netflix, LinkedIn, …
One of the most popular projects
on GitHub
Iterating versions rapidly with
awesome new features
John Hubbard [@SecHubb] 5](https://image.slidesharecdn.com/theelasticstackasasiem-190223124355/85/The-Elastic-Stack-as-a-SIEM-5-320.jpg)
![Elastic Stack vs. SIEM
Log Sources
Log Aggregation /
Queue
Log Storage &
Indexing
Search, Visualization,
& Alerting
John Hubbard [@SecHubb] 6](https://image.slidesharecdn.com/theelasticstackasasiem-190223124355/85/The-Elastic-Stack-as-a-SIEM-6-320.jpg)
![Elastic stack as a SIEM
Used for many different use cases
• NOT a SIEM out of the box
• Not in the magic quadrant as one
• Can do the things a SIEM does
Gartner's definition of a SIEM:
"supports threat detection and security incident response through the real-
time collection and historical analysis of security events from a wide variety
of event and contextual data sources. It also supports compliance reporting
and incident investigation through analysis of historical data from these
sources."
John Hubbard [@SecHubb] 7](https://image.slidesharecdn.com/theelasticstackasasiem-190223124355/85/The-Elastic-Stack-as-a-SIEM-7-320.jpg)
![Elasticsearch as a SIEM
• Collects, indexes, and stores high volumes of logs
• Functional visualizations and dashboards
• Reporting and alerting
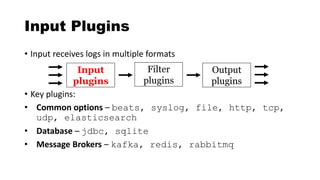
• Log enrichment through plugins
• Compatible with almost every format
• Log retention settings
• Anomaly detection via machine learning
• RBAC securable
John Hubbard [@SecHubb] 8](https://image.slidesharecdn.com/theelasticstackasasiem-190223124355/85/The-Elastic-Stack-as-a-SIEM-8-320.jpg)
![Elastic Stack Overview
Raw
Logs
Raw
Logs
Log Ingestion
& Parsing
Log Storage
Search &
Visualization
John Hubbard [@SecHubb] 9](https://image.slidesharecdn.com/theelasticstackasasiem-190223124355/85/The-Elastic-Stack-as-a-SIEM-9-320.jpg)
![Winlogbeat
Beats Agents
Lightweight log agents written in Go
• Filebeat
• Winlogbeat
• Packetbeat
• Auditbeat
• Functionbeat
• Journalbeat
• Community Beats
FilebeatPacketbeat
John Hubbard [@SecHubb] 10](https://image.slidesharecdn.com/theelasticstackasasiem-190223124355/85/The-Elastic-Stack-as-a-SIEM-10-320.jpg)
![Elasticsearch
Architecture
John Hubbard [@SecHubb] 11](https://image.slidesharecdn.com/theelasticstackasasiem-190223124355/85/The-Elastic-Stack-as-a-SIEM-11-320.jpg)
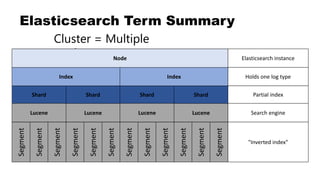
![Clusters, Nodes, and Indices
Cluster Node Indices
John Hubbard [@SecHubb] 12](https://image.slidesharecdn.com/theelasticstackasasiem-190223124355/85/The-Elastic-Stack-as-a-SIEM-12-320.jpg)
![Index Creation Across Time
Firewall-2018-01 Firewall-2018-02 Firewall-2018-03
IDS-2018-01 IDS-2018-02 IDS-2018-03
John Hubbard [@SecHubb] 13](https://image.slidesharecdn.com/theelasticstackasasiem-190223124355/85/The-Elastic-Stack-as-a-SIEM-13-320.jpg)
![Shards and Documents
Index Shards Documents
John Hubbard [@SecHubb] 14](https://image.slidesharecdn.com/theelasticstackasasiem-190223124355/85/The-Elastic-Stack-as-a-SIEM-14-320.jpg)
![John Hubbard [@SecHubb] 15](https://image.slidesharecdn.com/theelasticstackasasiem-190223124355/85/The-Elastic-Stack-as-a-SIEM-15-320.jpg)
![Reason 1: Schema on Ingest
Many SIEMs:
Schema applied at search time
Elasticsearch:
Schema applied at ingestion
John Hubbard [@SecHubb] 16](https://image.slidesharecdn.com/theelasticstackasasiem-190223124355/85/The-Elastic-Stack-as-a-SIEM-16-320.jpg)
![Reason 2: Data is distributed
Index
Shards
Nodes
John Hubbard [@SecHubb] 17](https://image.slidesharecdn.com/theelasticstackasasiem-190223124355/85/The-Elastic-Stack-as-a-SIEM-17-320.jpg)
![Shard Types
Primary Shards
• Like RAID 0 – Need all shards to make the whole index
Replica Shards
• Like RAID 1
• Each primary shard has arbitrary number of copies
• Each copy can be polled to balance search load
John Hubbard [@SecHubb] 18](https://image.slidesharecdn.com/theelasticstackasasiem-190223124355/85/The-Elastic-Stack-as-a-SIEM-18-320.jpg)
![Shards
• All shards belong to and make up an index
• Enables arbitrary horizontal scaling
• Spread evenly across all available hardware
• Designated a Primary or Replica Primary Shard 1
Primary Shard 2
Primary Shard 3
Replica Shard 1
Replica Shard 2
Replica Shard 3
Full
Index
Data
John Hubbard [@SecHubb] 19](https://image.slidesharecdn.com/theelasticstackasasiem-190223124355/85/The-Elastic-Stack-as-a-SIEM-19-320.jpg)
![Primaries and Replicas
Copy 2
Shards
Nodes
P0 P1 R0 R1
Copy 1
John Hubbard [@SecHubb] 20](https://image.slidesharecdn.com/theelasticstackasasiem-190223124355/85/The-Elastic-Stack-as-a-SIEM-20-320.jpg)
![Primaries and Replicas
Copy 2
Shards
Nodes
P0 P1 R0 R1
Copy 1 Copy 3
R0 R1
John Hubbard [@SecHubb] 21](https://image.slidesharecdn.com/theelasticstackasasiem-190223124355/85/The-Elastic-Stack-as-a-SIEM-21-320.jpg)
![Balancing Writes
Incoming Logs
Shards
Nodes
P0 P1 P2 P3 P4 P5
John Hubbard [@SecHubb] 22](https://image.slidesharecdn.com/theelasticstackasasiem-190223124355/85/The-Elastic-Stack-as-a-SIEM-22-320.jpg)
![Balancing Searches
Search Requests
Shards
Nodes
P0 R0 R0 R0 R0 R0
John Hubbard [@SecHubb] 23](https://image.slidesharecdn.com/theelasticstackasasiem-190223124355/85/The-Elastic-Stack-as-a-SIEM-23-320.jpg)
![Balancing Searches: multi-shard
Search 2
Shards
Nodes
P0 P1 R0 R1
Search 1 Search 3
R0 R1
John Hubbard [@SecHubb] 24](https://image.slidesharecdn.com/theelasticstackasasiem-190223124355/85/The-Elastic-Stack-as-a-SIEM-24-320.jpg)
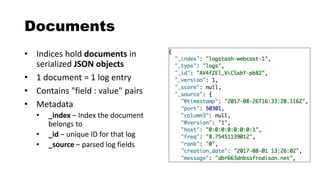
![Documents to Fields
Document Single Log
(Converted to JSON
by Logstash)
Fields
John Hubbard [@SecHubb] 25](https://image.slidesharecdn.com/theelasticstackasasiem-190223124355/85/The-Elastic-Stack-as-a-SIEM-25-320.jpg)
![Fields and Mappings
• Field – A key-value pair inside a document
• username: admin
• hostname: web-server1
• Mapping - Defines information about the fields
• Think "database schema"
• The data type for each field (integer, ip, keyword, etc.)
John Hubbard [@SecHubb] 27](https://image.slidesharecdn.com/theelasticstackasasiem-190223124355/85/The-Elastic-Stack-as-a-SIEM-27-320.jpg)
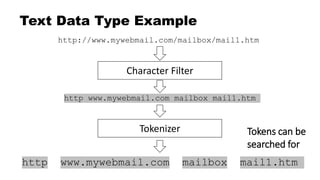
![Key Concept: Keyword vs. Text
String datatypes are either text or keyword, or both!
• Keyword indexes the exact values
• Example: Usernames, ID numbers, tags, FQDNs
• Binary search results – full exact matches, or not
• Text type breaks things up into pieces
• Example: "http://www.mywebmail.com/mailbox/mail1.htm"
• Allows searching for "http", "www.mywebmail.com", "mailbox", "mail1.htm"
• Fed through an "analyzer"
• This data type cannot be aggregated / visualized
John Hubbard [@SecHubb] 28](https://image.slidesharecdn.com/theelasticstackasasiem-190223124355/85/The-Elastic-Stack-as-a-SIEM-28-320.jpg)
![Where Tokens Go: Inverted Index
Lucene builds "inverted index" of
tokens in text field data
Doc 1: "The woman is walking down
the street."
Doc 2: "The man is walking into the
store."
Tokens Doc 1 Doc 2
the x x
woman x
is x x
walking x x
down x
street x
man x
into x
store x
John Hubbard [@SecHubb] 30](https://image.slidesharecdn.com/theelasticstackasasiem-190223124355/85/The-Elastic-Stack-as-a-SIEM-30-320.jpg)
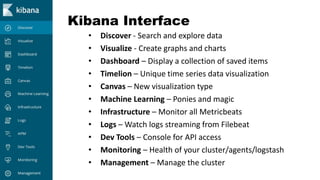
![Kibana
John Hubbard [@SecHubb] 32](https://image.slidesharecdn.com/theelasticstackasasiem-190223124355/85/The-Elastic-Stack-as-a-SIEM-32-320.jpg)
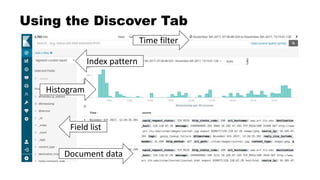
![Index Patterns
• Kibana must be told to show an index for searching
• Searching can be performed on more than 1 index at once
Example usage:
• "*" - Search ALL indices
• "firewall-*"
• "firewall-pfsense-*"
• "firewall-pfsense-2019-*"
• "alexa-top1M"
John Hubbard [@SecHubb] 36](https://image.slidesharecdn.com/theelasticstackasasiem-190223124355/85/The-Elastic-Stack-as-a-SIEM-36-320.jpg)
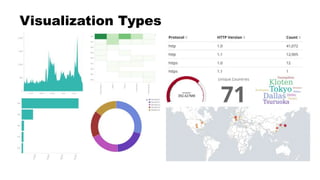
![Creating Visualizations
• Metrics: What to calculate
• Buckets: How to group it
"I want to see <metric> per <bucket>"
• "Total bytes"
• "Total bytes per username"
• "Request count, bytes per HTTP method"
• "Requests per user per site"
John Hubbard [@SecHubb] 38](https://image.slidesharecdn.com/theelasticstackasasiem-190223124355/85/The-Elastic-Stack-as-a-SIEM-38-320.jpg)
![Bucket Options
• Date Histogram (time)
• Date Range
• Filters
• Histogram
• IPv4 Range
• Range
• Significant Terms
• Terms (log fields)
John Hubbard [@SecHubb] 39](https://image.slidesharecdn.com/theelasticstackasasiem-190223124355/85/The-Elastic-Stack-as-a-SIEM-39-320.jpg)
![Visualization Demo
John Hubbard [@SecHubb] 40](https://image.slidesharecdn.com/theelasticstackasasiem-190223124355/85/The-Elastic-Stack-as-a-SIEM-40-320.jpg)
![Default Elasticsearch Security
Elasticsearch is completely open by default
John Hubbard [@SecHubb] 41](https://image.slidesharecdn.com/theelasticstackasasiem-190223124355/85/The-Elastic-Stack-as-a-SIEM-41-320.jpg)
![Options for Security
•N00b mode: nginx reverse proxy with basic auth
•Better:
•Best:
John Hubbard [@SecHubb] 42](https://image.slidesharecdn.com/theelasticstackasasiem-190223124355/85/The-Elastic-Stack-as-a-SIEM-42-320.jpg)
![Logstash
John Hubbard [@SecHubb] 43](https://image.slidesharecdn.com/theelasticstackasasiem-190223124355/85/The-Elastic-Stack-as-a-SIEM-43-320.jpg)
![Logstash Config Files
John Hubbard [@SecHubb] 48
For our premade configs, see:
https://github.com/HASecuritySolutions/Logstash](https://image.slidesharecdn.com/theelasticstackasasiem-190223124355/85/The-Elastic-Stack-as-a-SIEM-48-320.jpg)
![Data Ingestion Demo
John Hubbard [@SecHubb] 49](https://image.slidesharecdn.com/theelasticstackasasiem-190223124355/85/The-Elastic-Stack-as-a-SIEM-49-320.jpg)
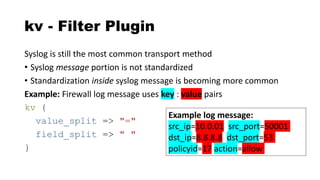
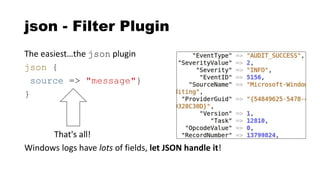
![csv - Filter Plugin
Delimited values can be automatically extracted
csv {
columns => ["src_ip","src_port","dst_ip",
"method","virtual_host","uri"]
}
"10.4.55.1","50001","8.8.8.8","GET"
,"sec455.com","/page.php"](https://image.slidesharecdn.com/theelasticstackasasiem-190223124355/85/The-Elastic-Stack-as-a-SIEM-56-320.jpg)
![Full Elastic Stack In a Nutshell
1. Send things to Logstash via agents or forwarding
2. Parse them in whatever way you want
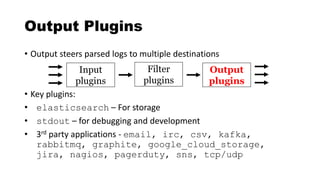
3. Send them to Elasticsearch for storage
4. Query Elasticsearch via Kibana
John Hubbard [@SecHubb] 60](https://image.slidesharecdn.com/theelasticstackasasiem-190223124355/85/The-Elastic-Stack-as-a-SIEM-60-320.jpg)
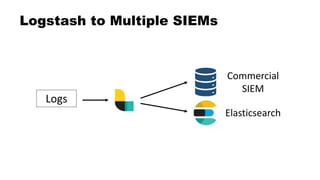
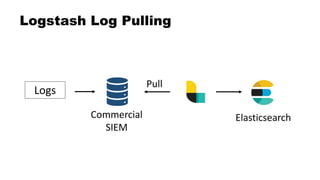
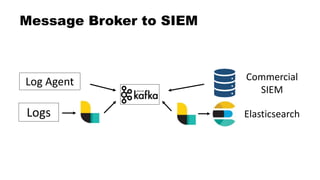
![Dual Stack SIEM
John Hubbard [@SecHubb] 62](https://image.slidesharecdn.com/theelasticstackasasiem-190223124355/85/The-Elastic-Stack-as-a-SIEM-62-320.jpg)
![The Full Layout
John Hubbard [@SecHubb] 66
https://www.elastic.co/assets/blt2614227bb99b9878/architecture-best-practices.pdf](https://image.slidesharecdn.com/theelasticstackasasiem-190223124355/85/The-Elastic-Stack-as-a-SIEM-66-320.jpg)
![Hardware
Backup Slides
John Hubbard [@SecHubb] 67](https://image.slidesharecdn.com/theelasticstackasasiem-190223124355/85/The-Elastic-Stack-as-a-SIEM-67-320.jpg)
![CPU and Memory
• How much CPU and memory are required?
Memory will run out first
• Use as much as possible
• 8GB+ per node
• 64GB = sweet spot (Java limitations)
• <=31GB dedicated to Java max
• /etc/elasticsearch/jvm.options file
CPU – multi-core/node, 64bit
• More cores better than faster speed
Heap
OS / Lucene
Node RAM
<=31GB
John Hubbard [@SecHubb] 68
All
other
RAM
See: https://www.elastic.co/guide/en/elasticsearch/reference/current/heap-size.html](https://image.slidesharecdn.com/theelasticstackasasiem-190223124355/85/The-Elastic-Stack-as-a-SIEM-68-320.jpg)
![Networking
• You can never have too much bandwidth!
• Moving 50GB shards node to node
• Returning large query results
• Restoring from backup
• Network Setup:
• 1GB is required
• 10GB is better!
• Minimize latency
• Jumbo frames enabled
John Hubbard [@SecHubb] 69](https://image.slidesharecdn.com/theelasticstackasasiem-190223124355/85/The-Elastic-Stack-as-a-SIEM-69-320.jpg)
![Hard Drives
• Disk speed for logging clusters is VERY important
• Lots of hard drives for high IO, not one big one
• RAID0 setup, replica shards take care of availability
John Hubbard [@SecHubb] 70](https://image.slidesharecdn.com/theelasticstackasasiem-190223124355/85/The-Elastic-Stack-as-a-SIEM-70-320.jpg)
![Thanks!
John Hubbard [@SecHubb] 71](https://image.slidesharecdn.com/theelasticstackasasiem-190223124355/85/The-Elastic-Stack-as-a-SIEM-71-320.jpg)


![Overview of the Cyber Kill Chain [TM]](https://cdn.slidesharecdn.com/ss_thumbnails/cybersecuritykillchain8-161209191549-thumbnail.jpg?width=640&height=640&fit=bounds)