Download as PDF, PPTX
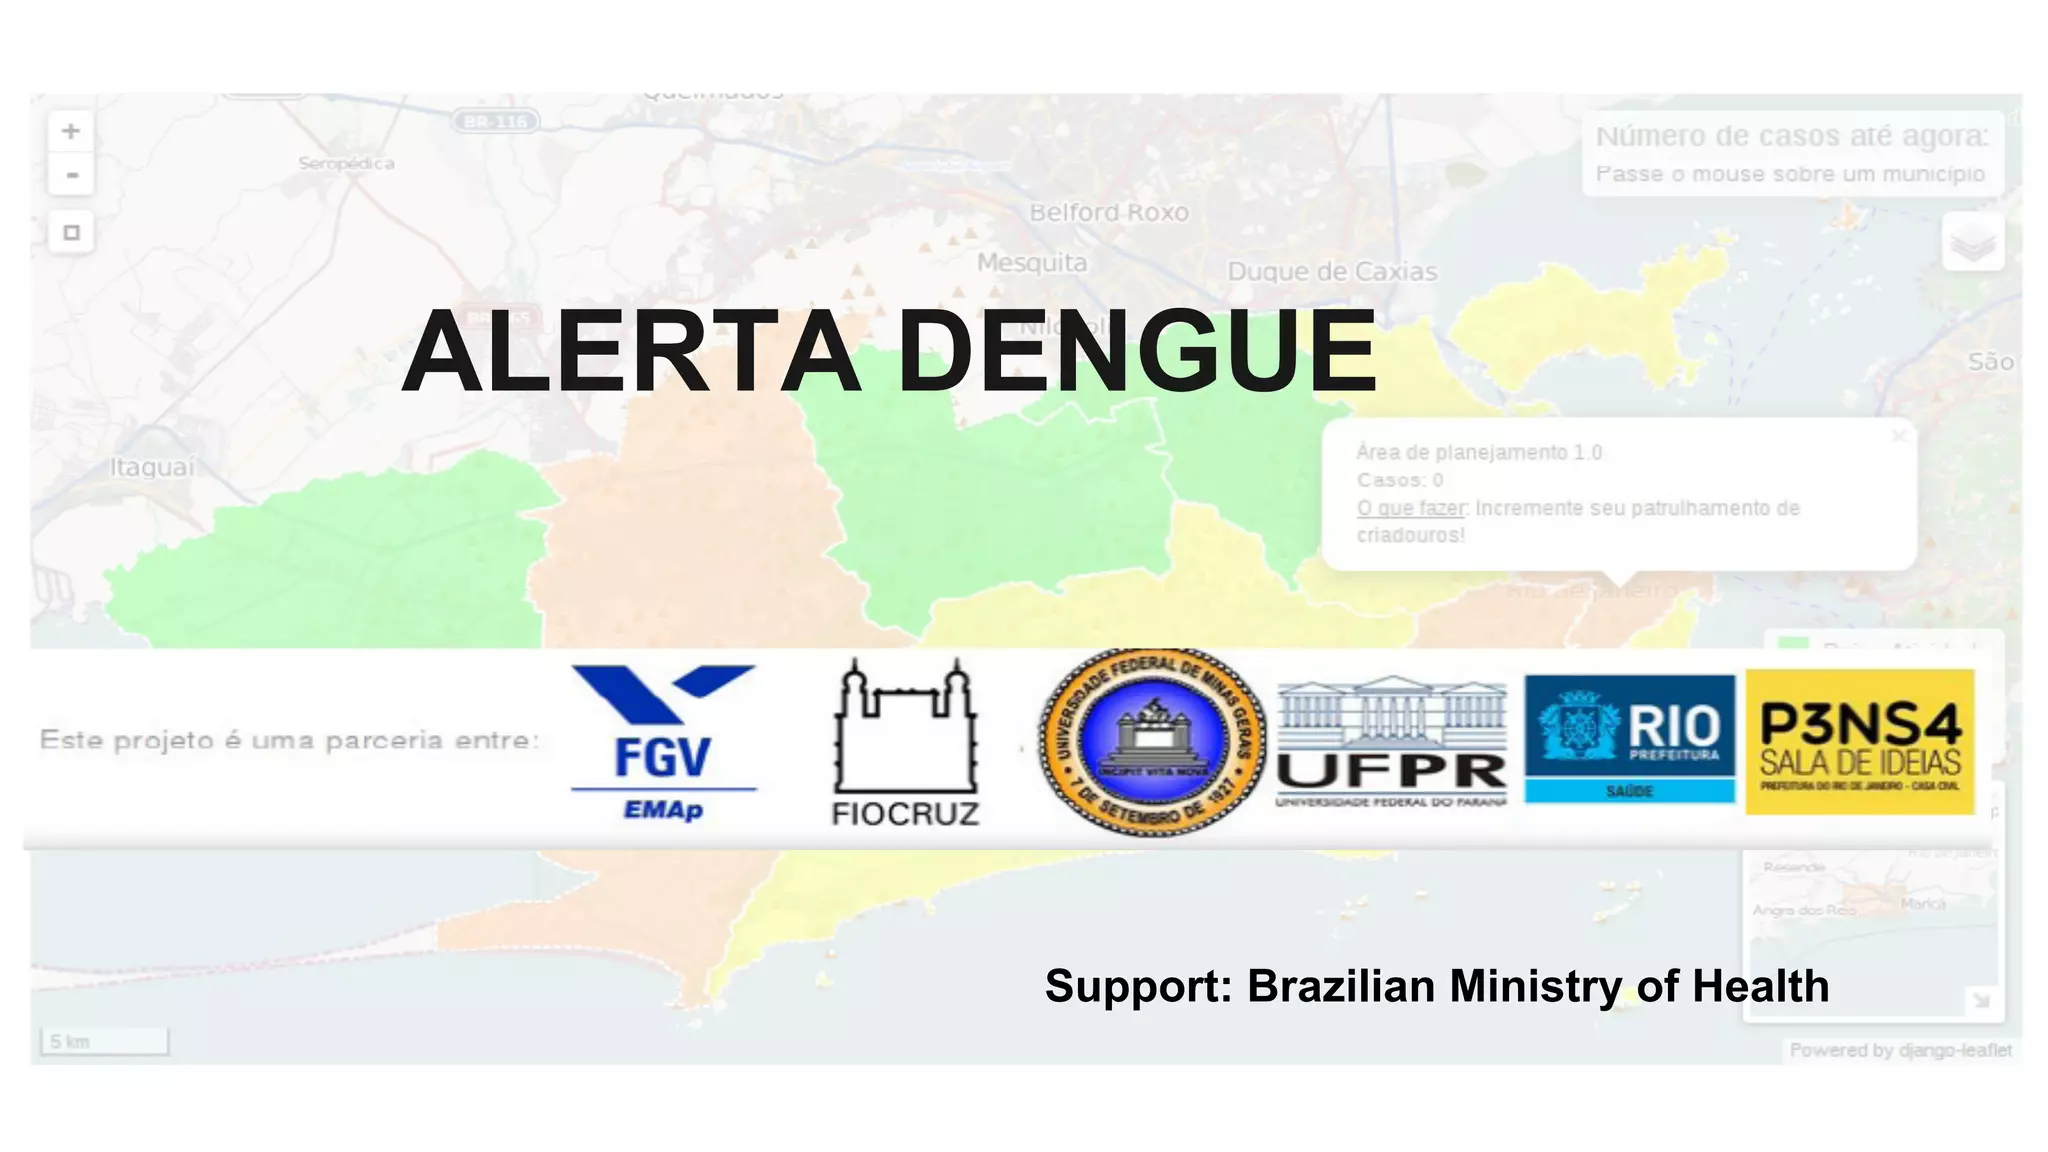
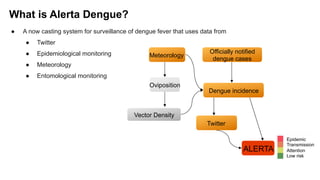
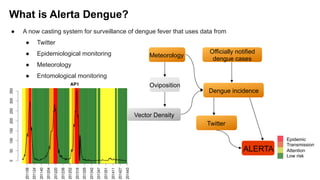
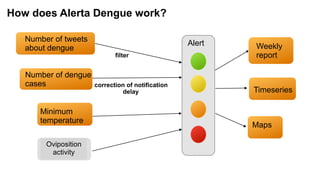
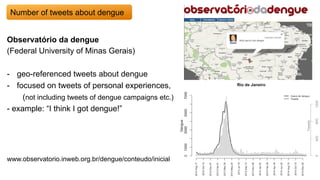
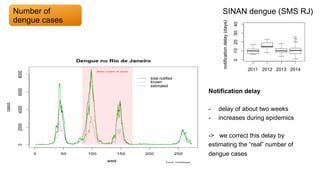
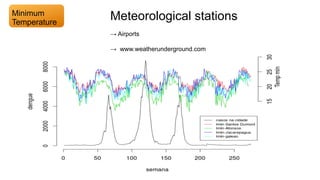
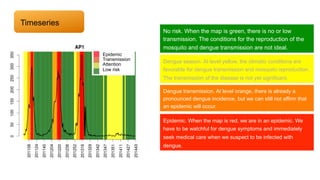
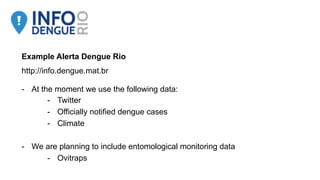
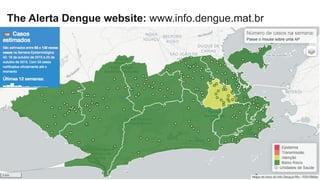
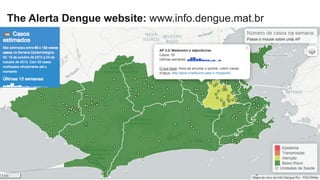
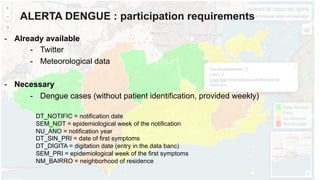

Alerta Dengue is a nowcasting system that uses data from Twitter, epidemiological monitoring, meteorology, and entomological monitoring to provide surveillance of dengue fever in Brazil. It analyzes the number of tweets about dengue, official dengue case numbers, temperature data, and mosquito ovitrap data to assign alert levels - green for low risk, yellow for dengue season, orange for active transmission, and red for an epidemic. The system provides weekly reports and maps to track dengue activity and issue alerts.


