Download to read offline

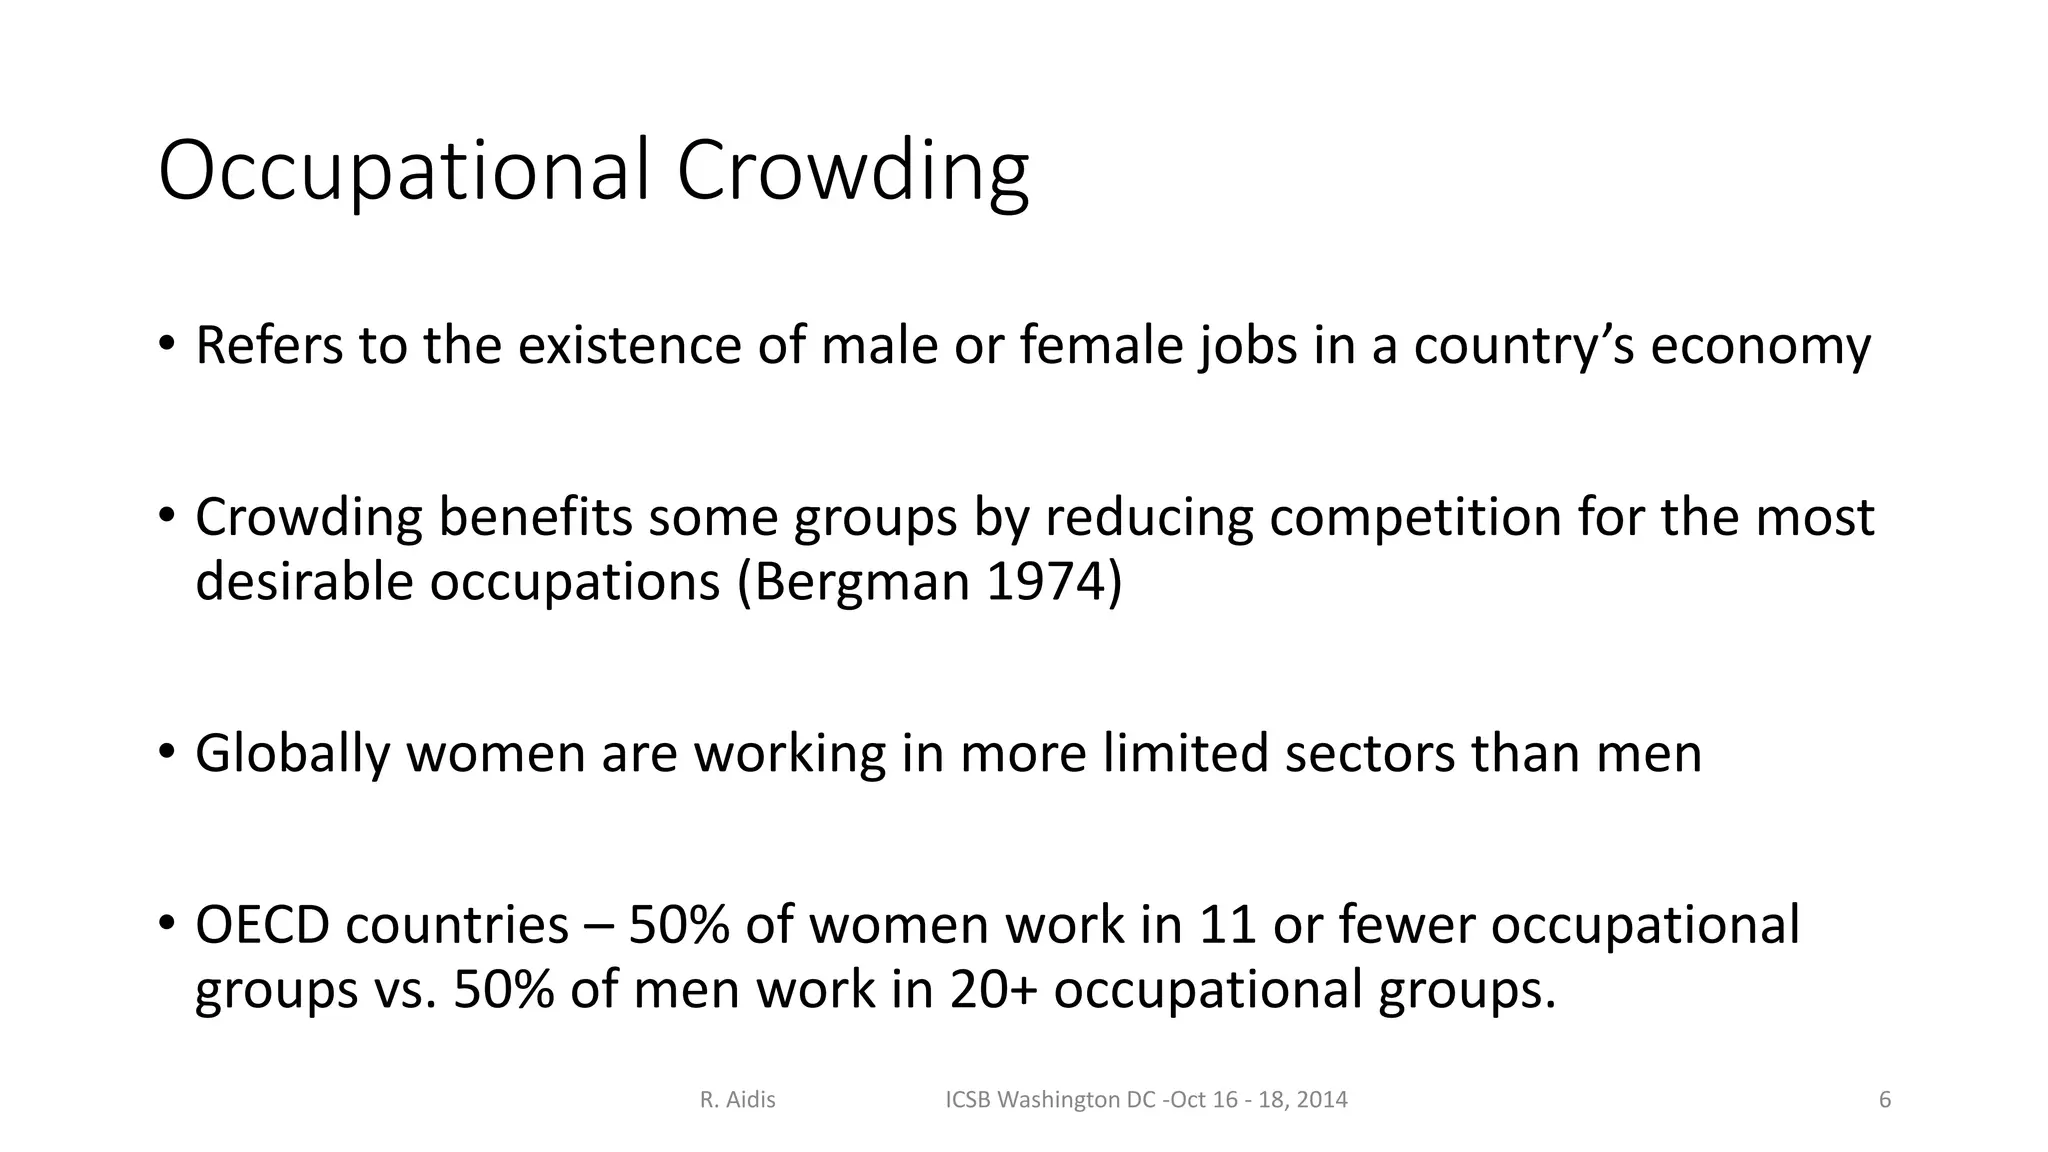
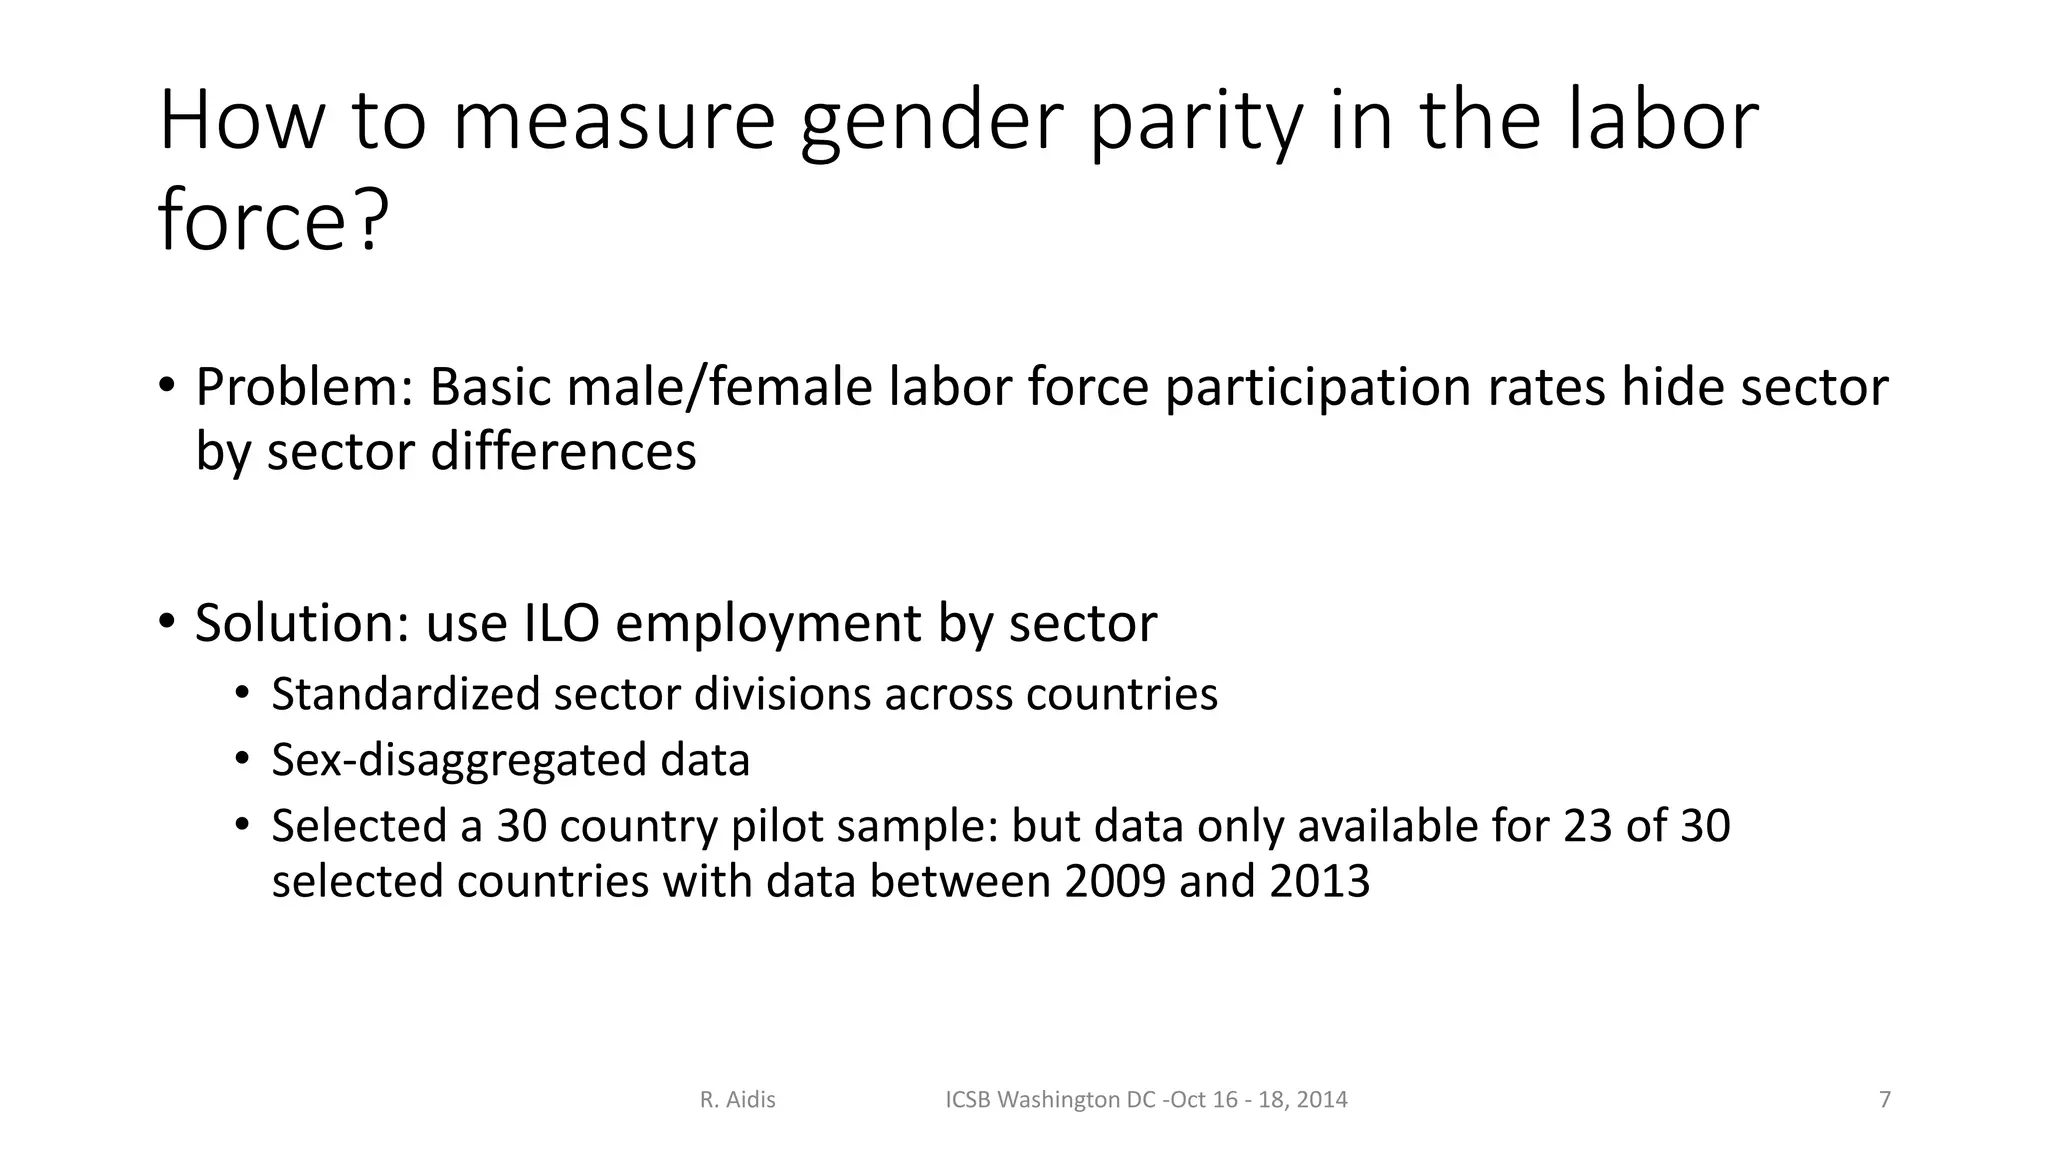
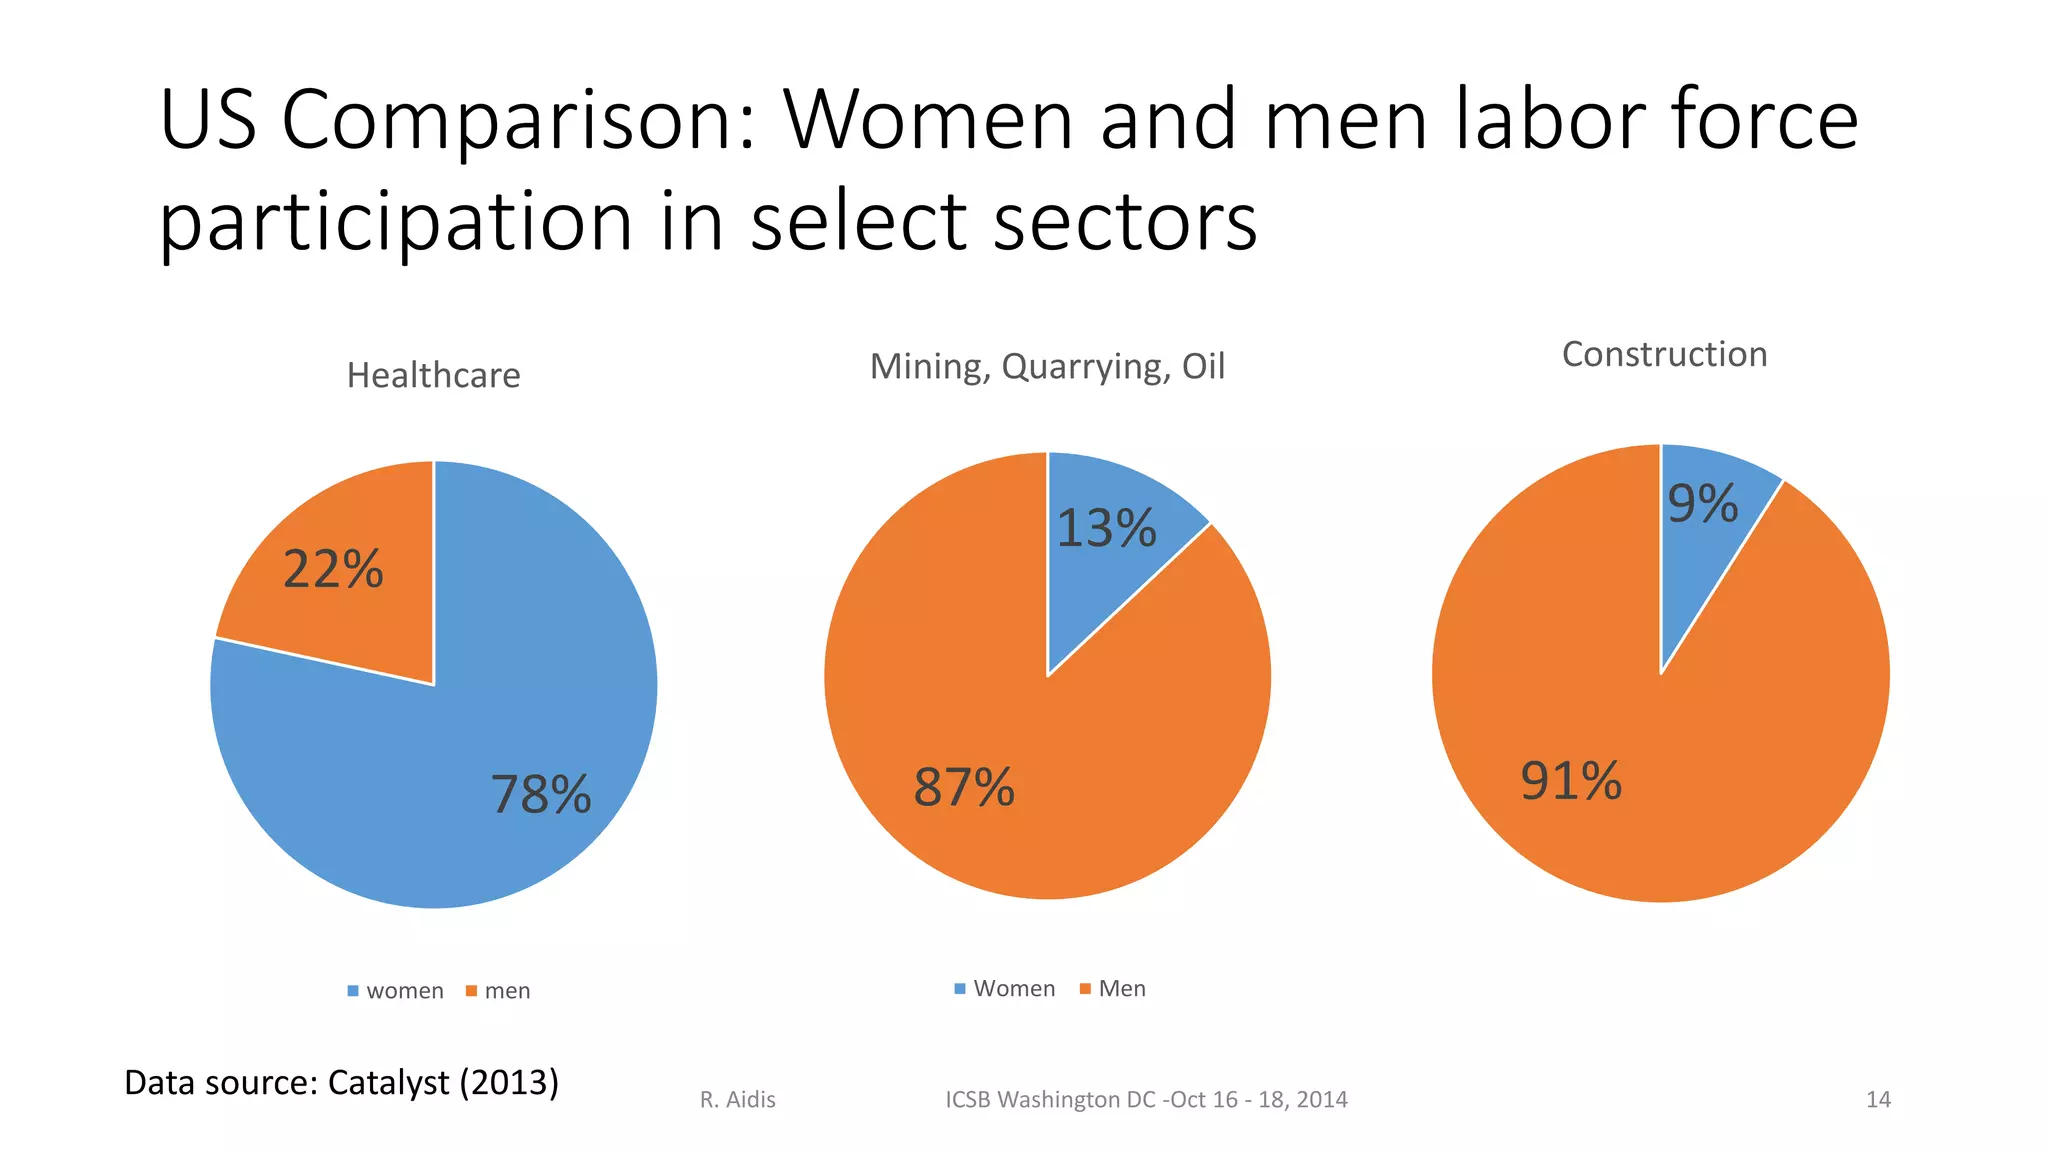
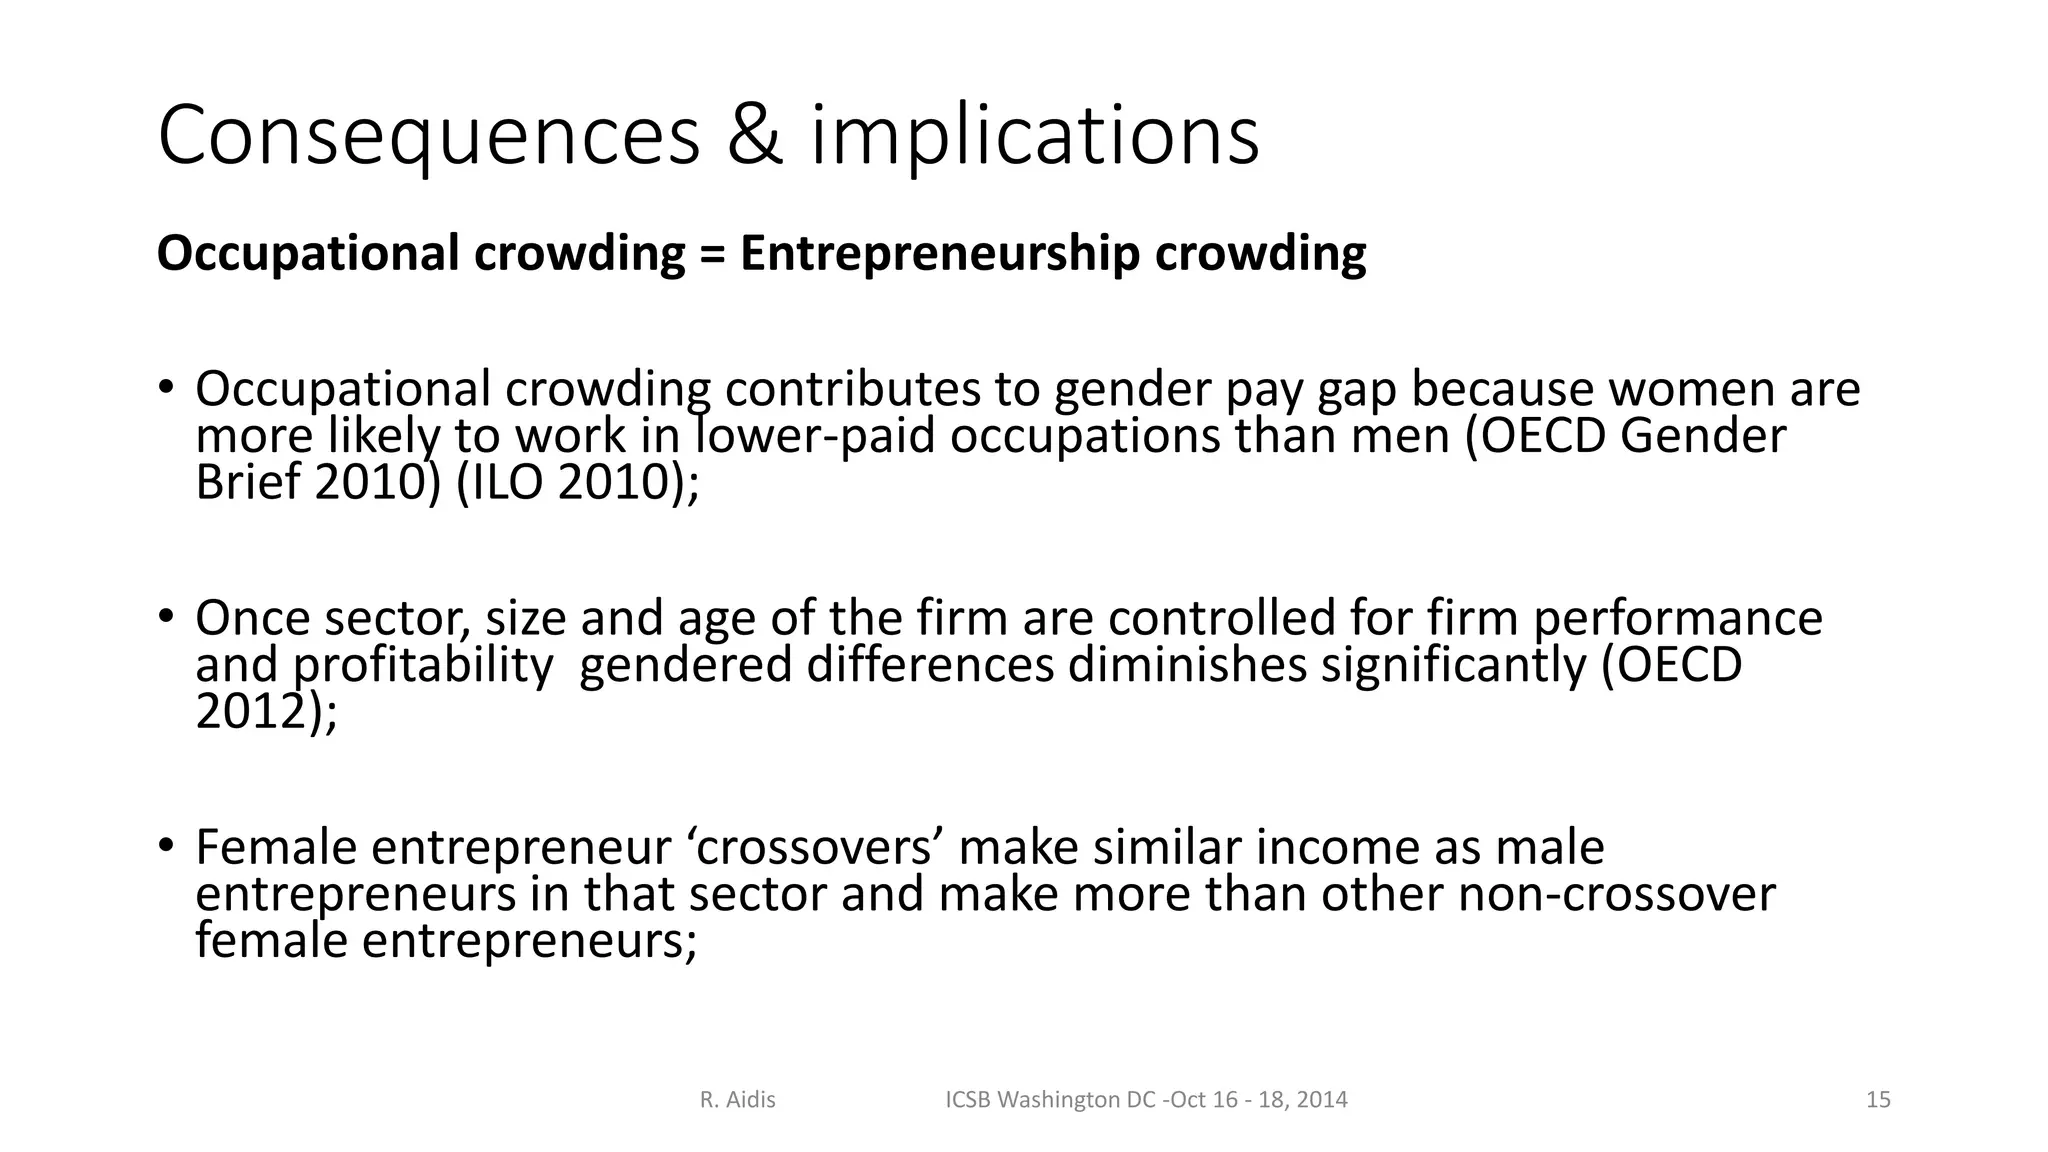
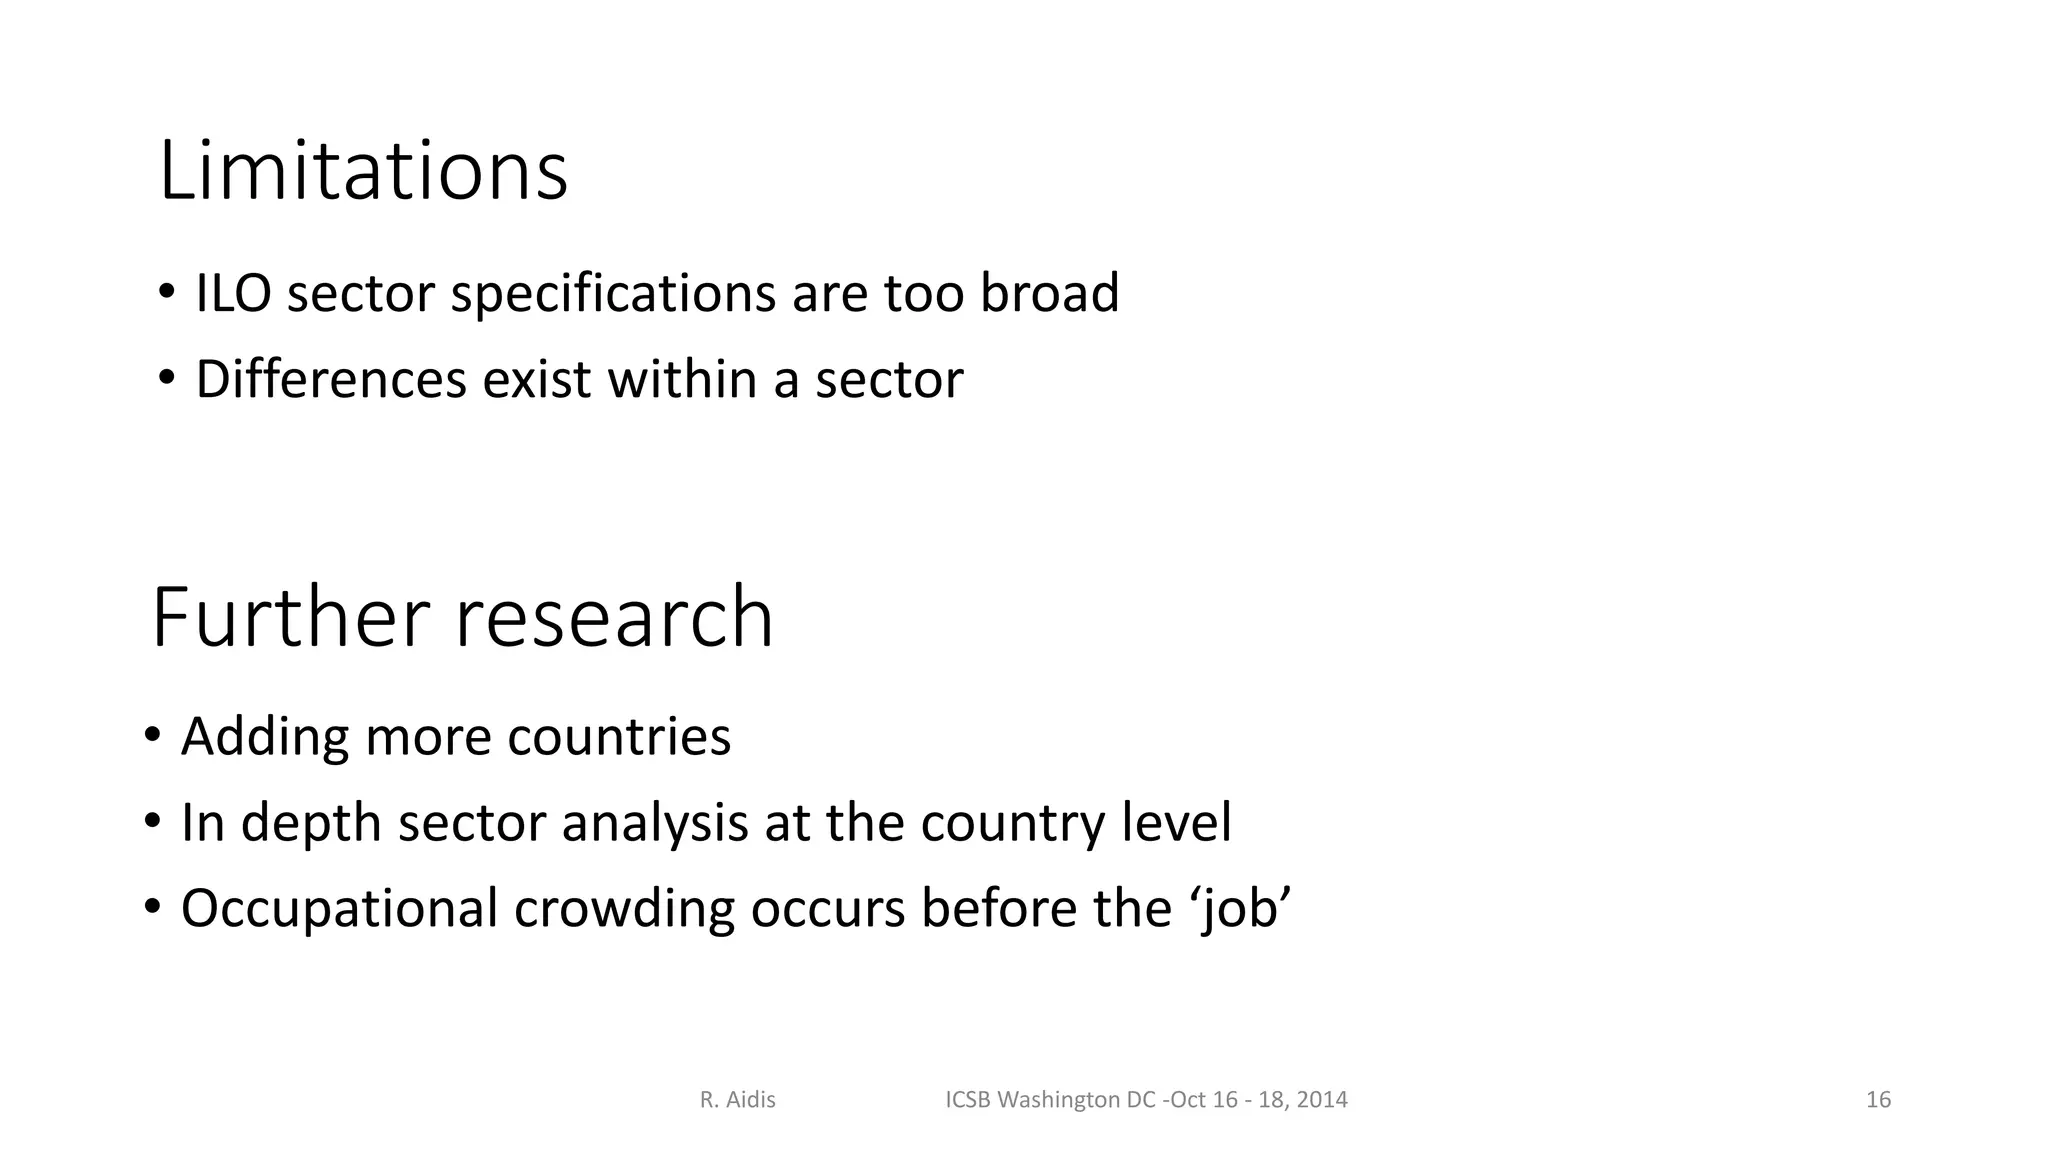

The document explores female occupational crowding and its impact on entrepreneurial outcomes, highlighting the need for better measurement tools to assess labor force differences between genders. It presents a pilot study involving 23 countries to analyze occupational sectors and gender balance, revealing significant disparities that contribute to the gender pay gap. The findings suggest that occupational crowding affects entrepreneurship and calls for further in-depth research to understand these dynamics better.


