1. The document provides a weekly update on employee hours worked including their name, last name, shift (Day or Night), and number of hours.
2. It includes information on 16 employees with hours ranging from 1 to 26 hours worked.
3. The
The document discusses the evolution of the banking structure in India and provides details on the various components of the Indian banking system. It summarizes the key recommendations of the Narasimham Committee reports which aimed to reform the banking sector and enhance efficiency. It also explains some basic banking concepts like PLR, repo rate, reverse repo rate, CRR, and SLR.
The document appears to contain monthly stock market data over several years, including figures for high, low, opening and closing prices as well as totals for volume and value traded. Specific dates ranging from 2011 to early 2000s are listed in the first column. Corresponding price and trading data are provided in subsequent columns.
The document contains daily stock price data for 9 companies (ACC, BPCL, etc.) and the Nifty index over multiple dates. The prices range from over 1,000 to under 200 for individual stocks, while the Nifty index ranges from around 6,000 to under 1,000. The data is presented in tabular format with company stock symbols in the left column and daily closing prices listed horizontally for each date.
The document contains statistical data and metrics for Infosys and Nifty stock prices over multiple months. It includes values such as count, mean, median, standard deviation, minimum, maximum and monthly returns. The data shows stock price fluctuations, growth metrics and correlations between the two stocks over time.
This document summarizes the results of a sensitivity analysis and optimization model run in Microsoft Excel. The adjustable cells, constraints, and target cell value are reported from the original model run. The limits report shows the adjustable cells meeting lower, target, and upper limits while achieving the target utility value. Variance and covariance values are also presented.
The document appears to contain statistical data across 8 rows for various metrics including ER, Beta, Sharp Ratio, cumulative returns, and risk-adjusted performance ratios. The data includes figures for each metric, along with cumulative columns summing related values across rows.
The document contains information about the expected returns and standard deviations of various securities and portfolios consisting of a risk-free asset and security X. It provides the expected returns and standard deviations for portfolios with different proportions of the risk-free asset and security X, ranging from 100% risk-free asset to 100% security X. A table also shows the expected returns, standard deviations, betas, and expected returns of various risky securities.
The document appears to contain stock price data for various companies listed column-wise with dates listed row-wise. There are daily closing price figures ranging from large positive to large negative numbers listed for companies like ACC, BPCL, Dr. Reddy, HUL, ICICI Bank, Reliance, Tata Motors and stock indices like Nifty.
The document contains information about the net asset value (NAV), units, and returns of a fund over 3 time periods. It also contains the corresponding information for a stock market index as well as calculations of various risk metrics for the fund and index returns. In summary:
1) The fund's NAV increased from Rs. 10 to Rs. 18.15 over 3 time periods while its units outstanding rose from 10 to 30.3.
2) Risk metrics like standard deviation, variance, and coefficient of variation were calculated for both the fund and index returns.
3) The correlation between the fund and index returns was found to be 0.9258, indicating a high positive correlation. The fund's
The document analyzes 5 stocks - Infosys, MRPL, Tata Steel, Tata Motors, and Karnataka Bank - over a 10 year period from April 1998 to March 2008. It uses two models - Harry Markowitz's model and the market model - to calculate the return, risk, and performance of an equally weighted portfolio of these stocks. For the market model, it calculates the beta, expected return, variance and random error of each stock to determine the systematic and unique risks of the portfolio.
The document provides a tutorial on how to conduct a valuation of a company using the McKinsey model. It outlines all the key steps of the model, including calculating free cash flow, forecasting future financial statements, and discounting the free cash flow. The tutorial uses a worked example of valuing a company called McKay as an illustration. It discusses forecasting assumptions regarding operations, capital expenditures, taxes, and discount rates. The tutorial also compares the McKinsey model to alternative valuation approaches.
This document contains historical and forecasted income statements and balance sheets for McKay Valuation. Table 1 shows the company's revenues, expenses, operating income, earnings before taxes and net income from years -6 to 12. Table 2 displays assets including cash, receivables, inventories, property and equipment from years -6 to 0. Tables 5 and 6 forecast these same line items for years 1 to 12. The document provides financial details to analyze McKay Valuation using free cash flow and abnormal earnings valuation models.
The document contains data and analysis from a linear regression model comparing Variable 1 to an outcome variable Y. It includes a regression table showing Variable 1 is a significant predictor of Y. Graphs of the regression line, residuals, and normal probability plot are presented to assess the fit of the model.
This document discusses formulas and functions in Excel. It defines a formula as an equation that performs operations on worksheet data using cell references. It explains the syntax of formulas and how they calculate values from left to right based on calculation order. It also discusses cell and range references in formulas. Functions are predefined formulas that perform calculations using arguments. Common logical, counting, and summing functions like AND, OR, IF, COUNTIF, and SUMIF are explained along with examples. Nested IF and using multiple conditions with COUNTIF and SUMIF are also covered.
Conditional formatting allows users to format cells differently depending on their values. Users can apply formatting like cell shading to highlight cells where sales exceed or fall short of forecasts. To set conditional formatting, users select the cells to format, specify the formatting conditions, and select formatting options for things like font, border, and fill. Advanced filtering allows users to filter lists to display only rows that meet criteria specified for one or multiple columns, including criteria based on formulas. Users can filter lists in-place or copy matching rows to another location.
This document discusses formulas and functions in Excel. It defines a formula as an equation that performs operations on worksheet data using cell references. It explains that formulas begin with an equal sign and are calculated from left to right based on order of operations. The document also defines functions as predefined formulas that perform calculations using specific arguments in a defined order or structure. It provides examples of logical functions like AND, OR, and IF and explains how to use cell references in formulas to refer to other cells or worksheets.
This document contains examples of financial calculations using Excel functions. It shows the syntax, data inputs, and outputs for the PV, FV, RATE, NPER, and PMT functions. The examples calculate things like the present value and future value of annuities, loan interest rates, number of payment periods, and monthly loan payments.
The document discusses financial functions in Excel such as PV, RATE, PMT, FV, NPER, PPMT, IPMT, and NPV. It provides the syntax and description of how each function works, including examples of formulas and how to interpret the results. Key inputs for the functions include interest rate, number of periods, payment amounts, present/future values. The functions allow calculating present/future values, interest/principal payments, and number of periods for loans and investments.
Sustainable competitive advantage cs & notes toyota csiipmff2
Toyota has built a sustainable competitive advantage through its Toyota Production System which depends on efficient suppliers and a loyal, creative workforce. Building on core competencies and focusing resources in areas of strength while partnering for other needs allows companies to address technical gaps. Companies must own their competitive advantage to continuously improve and stay ahead of competitors who would need a decade to replicate a well-trained workforce. Barriers like brands, technology patents, locations, low costs and distribution systems can protect companies from new competition.
This document discusses developing competitive advantages for small businesses. It begins by explaining the importance of identifying a sustainable competitive advantage, especially for new small businesses entering existing markets. The document then examines various strategies small businesses can use to develop competitive advantages, including leveraging different elements of the marketing mix like product, price, place, promotion, and people. It provides examples of how both large and small companies have effectively developed competitive advantages in these areas. The document concludes by discussing some key issues for small businesses to consider related to developing a competitive advantage, such as costs, management leadership, and organizational culture.
Michael Porter suggests three winning competitive strategies that companies can follow - overall cost leadership, differentiation, and focus. The document then discusses these strategies and provides examples of companies that employ each strategy. It also discusses the concepts of target market selection and identifying a company's competitors from both an industry and market point of view.
This document discusses various marketing strategies and concepts. It covers topics such as understanding customers, the purpose of marketing, developing a strategy to achieve goals, gaining competitive advantages, analyzing the marketing environment and competition, and using the marketing mix. It provides information on segmentation, positioning, the product life cycle stages and developing appropriate strategies for each stage.
Porter's generic strategies framework outlines three types of competitive advantage - cost leadership, differentiation, and focus. Firms can pursue one of these advantages across a broad or narrow scope. Competitive advantage is created through value chain activities that are difficult for competitors to imitate. It is sustained through durable sources of advantage, multiple distinct sources, and continuous upgrading. Alternatively, the core competence framework emphasizes developing dynamic capabilities rather than positioning within an industry. Core competencies allow firms to enter new markets and are sustained through continuous investment. Both frameworks provide guidance for analyzing competitive advantage but must be tailored to a specific company's challenges.
The document discusses various aspects of services marketing. It begins by defining key terms like marketing, services, and customer expectations. It then covers characteristics of services like intangibility, heterogeneity, inseparability, and perishability. The challenges of services marketing are discussed along with potential solutions. Key frameworks for understanding customer expectations and service quality are introduced, including the SERVQUAL model. Strategic issues like market segmentation, targeting, positioning, and differentiation strategies are also summarized.
The document provides an overview of business environment, its nature, components, dynamics and importance. It discusses the internal and external factors affecting a business. The external environment includes micro factors like suppliers, customers, competitors and macro factors like economic, political, social, technological, demographic and international elements. It also outlines the risks faced from the business environment and various measures to manage such risks.
The document discusses key changes occurring in the service sector and their impact on competition. Technological advances and changes in customer needs are driving service innovation. Effective strategic leadership is important for success in navigating these challenges. Understanding threats and opportunities from increasing competition is vital for developing marketing strategies. The service sector is an important part of modern economies and its growth reflects social and economic changes.
This document summarizes a case study on service quality in the banking industry. It discusses key dimensions of service quality and presents results from a survey of customers at two large regional banks. The main findings are:
1) Reliability and responsiveness were found to be the two most critical dimensions of service quality for customers and directly related to overall quality.
2) Customers at one bank (Bank A) rated the quality higher across all dimensions compared to the other bank (Bank B).
3) Within banks, some branches received higher ratings than others for certain dimensions like responsiveness and empathy.
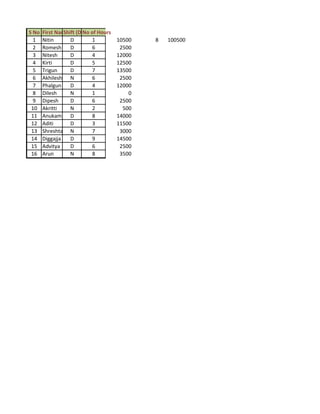
1. S No First Name (D/N) of Hours
Shift No
1 Nitin D 1 10500 8 100500
2 Romesh D 6 2500
3 Nitesh D 4 12000
4 Kirti D 5 12500
5 Trigun D 7 13500
6 Akhilesh N 6 2500
7 Phalgun D 4 12000
8 Dilesh N 1 0
9 Dipesh D 6 2500
10 Akritti N 2 500
11 Anukampa D 8 14000
12 Aditi D 3 11500
13 Shreshta N 7 3000
14 Diggajja D 9 14500
15 Advitya D 6 2500
16 Arun N 8 3500
2. Weekly Employee Work Update
S No First Name Last Name Shift (D/N) No of Hours
1 Nitin Thappar D 1
2 Romesh Tharpal D 6
3 Nitesh Kashyap N 1
4 Kirti Kachuki N 5
5 Trigun Suryavanshi D 7
6 Akhilesh Lakhanpal N 6
7 Phalgun Lagan D 7
8 Dilesh Surothiya N 1
9 Dipesh Moriya D 6
10 Akritti Magnesha N 2
11 Anukampa Dheer D 8
12 Aditi Mahesh D 3
13 Shreshta Digpal N 7
14 Diggajja Sharma D 9
15 Advitya Gupta D 6
16 Arun Saini N 8
4. Weekly Employee Work Update
S No First Name Last Name Shift (D/N) No of Hours
1 Nitin Thappar D 7
2 Romesh Tharpal D 6
3 Nitesh Kashyap N 4
4 Kirti Kachuki N 5
5 Trigun Suryavanshi D 7
6 Akhilesh Lakhanpal N 6
7 Phalgun Lagan D 4
8 Dilesh Surothiya N 1
9 Dipesh Moriya D 6
10 Akritti Magnesha N 2
11 Anukampa Dheer D 8
12 Aditi Mahesh D 3
13 Shreshta Digpal N 7
14 Diggajja Sharma D 9
15 Advitya Gupta D 6
16 Arun Saini N 8
6. Weekly Employee Work Update
S No First Name Last Name Shift (D/N) No of Hours
1 Nitin Thappar D 7
2 Romesh Tharpal D 6
3 Nitesh Kashyap N 4
4 Kirti Kachuki N 5
5 Trigun Suryavanshi D 7
6 Akhilesh Lakhanpal N 6
7 Phalgun Lagan D 4
8 Dilesh Surothiya N 1
9 Dipesh Moriya D 6
10 Akritti Magnesha N 2
11 Anukampa Dheer D 8
12 Aditi Mahesh D 3
13 Shreshta Digpal N 7
14 Diggajja Sharma D 9
15 Advitya Gupta D 6
16 Arun Saini N 8
8. Weekly Employee Work Update
S No First Name Last Name Shift (D/N) No of Hours
3 Nitesh Kashyap N 4
4 Kirti Kachuki N 5
6 Akhilesh Lakhanpal N 6
10 Akritti Magnesha N 2
13 Shreshta Digpal N 7
16 Arun Saini N 8
Shift (D/N) No of Hours
N >1
10. S No First Name Last Name Shift (D/N)
8 Dilesh Surothiya N
10 Akritti Magnesha N
12 Aditi Mahesh D
3 Nitesh Kashyap N
7 Phalgun Lagan D
4 Kirti Kachuki N
2 Romesh Tharpal D
6 Akhilesh Lakhanpal N
9 Dipesh Moriya D
15 Advitya Gupta D
1 Nitin Thappar D
5 Trigun Suryavanshi D
13 Shreshta Digpal N
11 Anukampa Dheer D
16 Arun Saini N
14 Diggajja Sharma D
12. Sr No Expenses First Name Last Name Shift (D/N)
AE Total
6 OE Dilesh Surothiya N
7 OE Akritti Magnesha N
8 OE Aditi Mahesh D
9 OE Phalgun Lagan D
10 OE Akhilesh Lakhanpal N
11 OE Dipesh Moriya D
12 OE Advitya Gupta D
13 OE Shreshta Digpal N
14 OE Anukampa Dheer D
15 OE Arun Saini N
16 OE Diggajja Sharma D
OE Total
Grand Total
14. S No First Name Last Name Shift (D/N)
1 Nitin Thappar D
2 Romesh Tharpal D
3 Nitesh Kashyap N
10 Akritti Magnesha N
11 Anukampa Dheer D
12 Aditi Mahesh D
13 Shreshta Digpal N
14 Diggajja Sharma D
15 Advitya Gupta D
16 Arun Saini N
16. First Name No of Hours Shift
Nitin 7 D
Romesh 6 D
Nitesh 4 D
Kirti 5 N
Trigun 7 D
Akhilesh 6 N
Romesh 4 D
Romesh 1 D
Kirti 6 N
Akritti 2 D
Anukampa 8 D
Romesh 3 D
Shreshta 7 D
Kirti 9 D
Kirti 6 D
Romesh 8 D
17. Agent Name No of Contacts Transferred No of Contacts Handled
A 6 2
ONE VARIABLE DATA TABLE
1500
2 500
6 1500
4 1000
8 2000
1 250
2 500
7 1750
2 500
5 1250