More Related Content
Similar to Acute cardiorespiratory responses to inspiratory pressure threshold loading
Similar to Acute cardiorespiratory responses to inspiratory pressure threshold loading (20)
Acute cardiorespiratory responses to inspiratory pressure threshold loading
- 1. Acute Cardiorespiratory Responses to
Inspiratory Pressure Threshold Loading
ALISON K. MCCONNELL1
and LISA A. GRIFFITHS2
1
Centre for Sports Medicine and Human Performance, Brunel University, Uxbridge, England, UNITED KINGDOM; and
2
School of Sport, Leisure and Travel, Buckinghamshire New University, High Wycombe, England, UNITED KINGDOM
ABSTRACT
MCCONNELL, A. K. and L. A. GRIFFITHS. Acute Cardiorespiratory Responses to Inspiratory Pressure Threshold Loading. Med. Sci.
Sports Exerc., Vol. 42, No. 9, pp. 1696–1703, 2010. Purpose: We tested the acute responses to differing pressure threshold inspiratory
loading intensities in well-trained rowers. The purpose of this study was to evaluate 1) how the magnitude of inspiratory pressure
threshold loading influences repetition maximum (RM), tidal volume (VT), and external work undertaken by the inspiratory muscle;
and 2) whether the inspiratory muscle metaboreflex is activated during acute inspiratory pressure threshold loading. Methods: Eight
males participated in seven trials. Baseline measurements of maximal inspiratory pressure (PImax), resting tidal volume (VT), and forced
vital capacity (FVC) were made. During the remaining sessions, participants undertook a series of resistive inspiratory breathing tasks
at loads corresponding to 50%, 60%, 70%, 80%, and 90% of PImax using a pressure threshold inspiratory muscle trainer. The num-
ber of repetitions completed at each load, VT, heart rate ( fc), and measures of arterial blood pressure was assessed continuously during
each trial. Results: A standardized cutoff of 10% FVC was used to define the RM, which decreased as loading intensity increased
(P G 0.05). This response was nonlinear, with an abrupt decrease in RM occurring at loads Q70% of PImax. The most commonly used
inspiratory muscle training regimen of 30RM corresponded to 62.5% T 4.6% of PImax and also resulted in the highest external work
output. Tidal volume (VT) decreased significantly over time at 60%, 70%, and 80% of PImax (P G 0.05), as did the amount of external
work completed (P G 0.05). Conclusions: Although all loads elicited a sustained increase in fc, only the 60% load elicited a sustained
rise in mean arterial blood pressure (P = 0.016), diastolic blood pressure (P = 0.015), and systolic blood pressure (P = 0.002), providing
evidence for a metaboreflex response at this load. Key Words: RESPIRATORY MUSCLE LOADING, REPETITION MAXIMUM,
INSPIRATORY MUSCLE METABOREFLEX, VENTILATORY TASK FAILURE
S
everal studies have now shown that moderate-intensity
(50%–60% of maximal inspiratory pressure) pressure
threshold of inspiratory muscle training (IMT) im-
proves inspiratory muscle strength, power, and endurance
(18). Those studies undertaking IMT using inspiratory
pressure threshold loading, and with the appropriate outcome
measures (17), have also demonstrated improvements in
exercise tolerance in healthy young athletes (17) and in
patients with respiratory (7) and cardiovascular (5) disease.
Furthermore, recent evidence points to attenuation of the
inspiratory muscle metaboreflex as an important mechanism
underlying post-IMT improvements in exercise tolerance
(4,16,26).
The inspiratory muscle metaboreflex has typically been
examined using flow-resistive loading, and its activation is
manifest as a time-dependent increase in mean arterial
blood pressure (MAP) and heart rate ( fc) (16,20,22,26).
However, it is unclear whether the metaboreflex is activated
during acute inspiratory pressure threshold loading (of the
type used during IMT) or, indeed, whether this is an ob-
ligatory stimulus to the adaptations that result in changes to
the activation of this reflex after pressure threshold IMT.
One of the unique features of pressure threshold loading
is its fixed-magnitude, flow-independent load. Although
this characteristic offers advantages in the reliability of the
training stimulus, it is not without its drawbacks, the prin-
cipal of which is the interaction of the fixed load with the
inspiratory muscle length–tension (pressure–volume) rela-
tionship. This interaction is such that, the greater the mag-
nitude of the inspiratory pressure threshold load, the smaller
the tidal volume excursion that can be achieved. Thus, not
only do higher loads result in a smaller number of repe-
titions to task failure, they may also be associated with a
reduction in the amount of external work undertaken by the
inspiratory muscles. The latter may have important impli-
cations for the design of IMT protocols because there may
be a minimum amount of inspiratory work required to elicit
the changes in function, which underpin increases in the
metaboreflex threshold.
Thus, the purpose of this study was to characterize the
acute physiological responses to pressure threshold loading
Address for correspondence: Alison K. McConnell, Ph.D., Centre for
Sports Medicine and Human Performance, Brunel University, Uxbridge,
UB8 3PH, United Kingdom; E-mail: Alison.mcconnell@brunel.ac.uk.
Submitted for publication October 2009.
Accepted for publication January 2010.
0195-9131/10/4209-1696/0
MEDICINE & SCIENCE IN SPORTS & EXERCISEÒ
Copyright Ó 2010 by the American College of Sports Medicine
DOI: 10.1249/MSS.0b013e3181d435cf
1696
BASICSCIENCES
Copyright © 2010 by the American College of Sports Medicine. Unauthorized reproduction of this article is prohibited.
- 2. across a range of inspiratory loads. Specifically, we sought
to evaluate 1) how the magnitude of the inspiratory pressure
threshold load influences repetition maximum (RM), tidal
volume (VT), and inspiratory muscle work; and 2) whether
the inspiratory muscle metaboreflex is activated during
acute inspiratory pressure threshold loading. We hypothe-
size that 1) the limit of tolerance (Tlim) will decrease with
increasing loads, 2) VT will decrease with increasing loads,
and 3) one or more of the loading protocols will activate the
inspiratory muscle metaboreflex.
METHODS
Participants. Eight healthy competitive male rowers vol-
unteered to participate in this study that was approved by the
Brunel University Ethics Committee. Before testing, all par-
ticipants completed a health questionnaire and gave written
informed consent.
Participants were requested to maintain their normal diet
in the few days that preceded testing. Participants were also
requested to avoid alcohol and vigorous exercise 2 d before
testing and to avoid caffeinated beverages on test day. To
minimize the effects of inspiratory muscle fatigue, partici-
pants were limited to one test session per day.
General design. Each participant attended six testing
sessions. During session 1, maximal inspiratory mouth pres-
sure (PImax), resting VT, and forced vital capacity (FVC) were
assessed. During the subsequent sessions, participants under-
took a series of loaded breathing tasks at five loads (50%,
60%, 70%, 80%, and 90% of PImax) using a pressure thresh-
old inspiratory muscle trainer. Participants breathed against
each load to the Tlim at a breathing frequency of 15 breaths
per minute, which was paced by metronome. Ventilatory
and cardiovascular responses were monitored throughout
each breathing task.
Participant characteristics. Stature, body mass, and
respiratory function were assessed at session 1, and these
are presented in Table 1.
Inspiratory warm-up. Before inspiratory muscle
strength testing, participants were instructed on the proper
usage of the pressure threshold loading device for the in-
spiratory ‘‘warm-up’’ (POWERbreathe; HaB International
Ltd, Southam, UK). Participants were instructed to perform
two sets of 30 breaths at a resistance equivalent to 40%
PImax. This protocol has been shown to attenuate the effect of
repeated measurement on PImax and to improve within-day
and between-day reliability, as quantified by limits of agree-
ment, coefficient of variation, and intraclass correlation
coefficients (15,24).
Inspiratory muscle strength. Maximal inspiratory
pressure was assessed using a portable handheld mouth
pressure meter (Morgan Medical, Hertford, UK) according
to the American Thoracic Society guidelines (1). The assess-
ment of PImax required a sharp, forceful effort maintained
for a minimum of È2 s. The pressure meter incorporated a
1-mm leak to prevent glottic closure (2). Measurements
were repeated until three technically acceptable maneuvers
were achieved within 5 cm H2O; the best of these three was
recorded.
Pulmonary function. FVC and loaded breath volumes
were assessed using an online computer software package
(BIOPAC MP30; BIOPAC Systems, Inc., Goleta, CA) ac-
cording to the American Thoracic Society guidelines (1).
Participants breathed through a flow meter that measured
flow using a differential pressure transducer and integrated
this signal to derive volume.
Participants undertook a series of inspiratory loaded
breathing tasks using a pressure threshold training device
(POWERbreathe; HaB International Ltd.). The breathing
tasks consisted of loads of 50%, 60%, 70%, 80%, and 90%
of PImax performed in a randomized order. Participants were
requested to undertake each load to the Tlim, but no encour-
agement was provided during the task, and no indication
was provided as to how many breaths they should perform.
A metronome was used to regulate breathing frequency to
15 breaths per minute. The target duty cycle was 0.5, but in
practice, this ranged from 0.3 to 0.5 because of the inertial
properties of the threshold load and the influence of the
force–velocity relationship of the inspiratory muscles. After
15 min, any participant who was able to maintain the
resistive breathing load was stopped. Participants were not
informed of the cutoff time of 15 min until they reached
that point. All participants were encouraged to perform the
tasks to their own Tlim and not to a target time or number of
breaths. The duration from the onset of the task to the point
the participant removed the mouthpiece was termed Tlim,
and this is presented in seconds (s). We did not attempt
to control arterial PCO2 (PaCO2) during the loaded breath-
ing tasks because of the uncertainty relating to the relation-
ship between end-tidal PCO2 and PaCO2 during loaded
breathing. Our previous experience is that mild hypocapnia
(930 mm Hg) develops during the low loads, whereas
eucapnia prevails during the heavy loads. Previous research
has demonstrated that, in humans, mild hypocapnia does
not elicit any changes in either forearm vascular resistance
or blood pressure (10). These authors also demonstrated
that responses to lower body negative pressure were un-
affected by this mild hypocapnia, suggesting that mild
hypocapnia does not influence resting vessel tone or reflex
responses to baroreceptor stimulation. Furthermore, we have
TABLE 1. Descriptive characteristics of the participants (mean T SD).
Participants (n = 8)
Anthropometry
Age (yr) 22.0 T 2.1
Stature (m) 1.8 T 0.1
Body mass (kg) 86.0 T 11.9
Respiratory function
PImax (cm H2O) 193.4 T 26.7
FVC (L) 5.2 T 1.0
Resting VT (L) 1.3 T 0.3
ACUTE RESPONSES TO INSPIRATORY LOADING Medicine & Science in Sports & Exercised 1697
BASICSCIENCES
Copyright © 2010 by the American College of Sports Medicine. Unauthorized reproduction of this article is prohibited.
- 3. also demonstrated activation of the inspiratory muscle meta-
boreflex in the presence of mild hypocapnia (16).
Tidal volume (VT) was measured during each loading
task and was predicted to decline with increasing load and
with increasing repetitions (because of the effects of the
pressure–volume relationship and fatigue, respectively).
Because the time course of the within-test change in VT
was unknown, an objective VT threshold was determined
retrospectively to define the RM for each load. A VT
threshold of 10% of FVC was used to define the RM at
each load; breaths occurring after VT that had fallen below
10% FVC were excluded (for RM determination purposes).
Assessment of cardiovascular responses. Mea-
sures of fc and arterial blood pressure were made noninva-
sively during the loaded breathing tasks using an automated
combined continuous blood pressure monitor (Colin CBM-
7000; Scanmed, Moreton in Marsh, UK). Blood pressure
was measured using arterial tonometry; a solid-state blood
pressure transducer sensor was attached to the participant’s
left wrist over the radial artery. An oscillometric brachial cuff
provided calibration for the pressure transducer sensor.
Measures of MAP and systolic and diastolic blood pressures
(SBP and DBP, respectively) are presented in millimeters of
mercury (mm Hg). Continuous fc was recorded and presented
as beats per minute (bpm).
Data analysis. Temporal data were analyzed using two
methods. First, to account for differences in the number of
repetitions achieved and changes in VT, each breathing task
was divided into isotime quartiles. Second, pulmonary and
cardiovascular data were also analyzed every 30 s for the
first 3 min at loads of 50% and 60% and every 15 s for the
first minute at loads of 70%, 80%, and 90% to determine
the onset, if present, of the inspiratory muscle metaboreflex.
Mean values were calculated for each outcome variable
and were subjected to statistical analysis. Participants not
achieving four breaths for a given task were excluded from
the analysis at that particular load. In addition, an approx-
imation of inspiratory work was made to determine whether
the combination of load and volume resulted in more or less
external work at any given inspiratory load. The average
external work of breathing was calculated for each resistive
load using the following equation:
Work ¼ force ðpressureÞ Â distance ðvolumeÞ
External work of breathing ¼inspiratory threshold loadðcm H2 OÞÂVT ðLÞ
A repeated-measures ANOVA was used to determine
physiological changes over time. Violations of the assump-
tion of sphericity were measured using the Mauchly
sphericity test and corrected using the Greenhouse–Geisser
adjustment. Planned pairwise comparisons were made to
analyze significant interaction effects using the Bonferroni
adjustment. Pearson correlation coefficients were performed
to determine relationships between physiological and per-
formance variables. Probability values G0.05 were consid-
ered significant. Statistical and mean data were calculated
using the statistical software SPSS V16.0 for Windows
(SPSS, Inc., Chicago, IL). All results are expressed in
mean T SD unless stated otherwise.
RESULTS
Repetition maximum at each load. Data for average
total number of repetitions, the number of repetitions
performed at a VT 9 10% FVC threshold load, and average
Tlim at each load are presented in Table 2. There was a sta-
tistically significant within-participant effect for the total
number of breaths (P = 0.001, Greenhouse–Geisser), indi-
cating a difference in the number of repetitions performed
at differing loads. As shown in Table 2, there was a statisti-
cal difference between total repetitions performed at 50%
PImax compared with those performed at 70% (P = 0.011),
80% (P = 0.009), and 90% PImax (P = 0.010). Similarly,
when the objective VT criterion was applied to determine
RM, there was a statistical difference within participants
(P = 0.001, Greenhouse–Geisser) at 50% compared with
70% (P = 0.013), 80% (P = 0.010), and 90% (P = 0.011).
Participants completed the various breathing tasks at dif-
ferent time points. As shown in Table 2, there was an
abrupt drop in Tlim at loads 970% PImax. During the 50%
and 60% loads, there were a few participants (n = 3 and n = 2,
respectively) who maintained the task to the 15-min cutoff
TABLE 2. Average total repetitions, number of repetitions with VT 9 10% FVC (T), and
average time at each load (n = 8).
Mean
(Breaths)
Minimum
(Breaths)
Maximum
(Breaths) Tlim (s)
Total repetitions
50% 134.6 T 66.9 57 217 537 T 268
60% 84.6 T 85.4 14 217 339 T 342
70% 19.5 T 24.4* 6 76 78 T 96*
80% 8.9 T 6.0* 4 21 32 T 24*
90% 7.1 T 3.3* 2 12 28 T 13*
Repetitions 910% FVC
50% T 133.6 T 68.2 54 217 534 T 270
60% T 84.5 T 85.5 14 217 334 T 335
70% T 17.3 T 25.5** 0 76 72 T 95**
80% T 7.1 T 7.0** 2 21 28 T 28**
90% T 4.6 T 3.7** 2 11 18 T 15**
* Significantly different compared with 50% PImax load (P e 0.05).
** Significantly different compared with 50% T (P e 0.05).
TABLE 3. Mean VT and VT %FVC across isotime quartiles (Q) at each load.
50% PImax
(n = 8)
60% PImax
(n = 8)
70% PImax
(n = 6)
80% PImax
(n = 6)
VT (L)
Q1 2.4 T 1.0 2.3 T 0.8 1.6 T 1.1* 1.4 T 0.6*
Q2 2.3 T 0.8 2.2 T 0.8 1.4 T 1.2 1.1 T 0.5**
Q3 2.1 T 0.7 2.0 T 0.8*** 1.4 T 1.2 1.0 T 0.4**
Q4 2.0 T 0.9*** 1.9 T 0.8**,
*** 1.0 T 0.8** 0.8 T 0.4**
VT %FVC (%)
Q1 44.8 T 16.1 43.7 T 12.5 30.7 T 4.2*,
**** 29.6 T 8.1****
Q2 44.0 T 14.8 41.5 T 12.1 26.4 T 7.8 20.5 T 5.6
Q3 42.6 T 15.7 38.3 T 15.2 24.1 T 9.9 18.5 T 4.3**
Q4 41.7 T 18.9 36.2 T 14.7*** 21.6 T 8.3 14.4 T 4.9**
* Significantly different compared with 60% load (P e 0.05).
** Significantly different from Q1.
*** Significantly different from Q2.
**** Significantly different compared with 50% load (P e 0.05).
http://www.acsm-msse.org1698 Official Journal of the American College of Sports Medicine
BASICSCIENCES
Copyright © 2010 by the American College of Sports Medicine. Unauthorized reproduction of this article is prohibited.
- 4. point. On average, the 30RM corresponded to 62.5% T 4.6%
PImax (60% in six participants and 70% in two participants).
Significant correlations were found between FVC and the
number of repetitions completed at 70% PImax (r = 0.806,
P = 0.016) and 90% PImax (r = 0.841, P = 0.009). Although
these relationships were significant, this significance was
attributable primarily to one or two outliers. There were no
significant correlations between the number of repetitions
performed and stature, body mass, VT, or PImax at any load.
Within task changes in tidal volume and tidal
volume expressed as a percent of forced vital
capacity. Significant differences were detected in VT be-
tween participants at 60% (P = 0.039) and within participants
over time at 50% (P = 0.023), 60% (P = 0.006), 70%
(P = 0.041), and 80% (P = 0.000; Table 3). No analysis was
performed for the 90% load because the number of par-
ticipants (n = 2) who were able to sustain breathing above
the 10% FVC tidal volume threshold was insufficient.
When tidal volume was expressed as a percentage of FVC
(VT %FVC), there was also a significant within-participant
effect at 60%, 70%, and 80% (P G 0.05) but not at 50%.
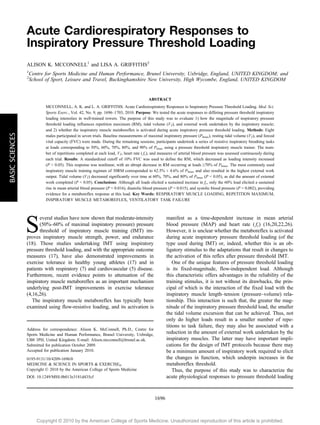
Estimation of average external work. There was a
significant within-participant effect over time (P = 0.006,
Greenhouse–Geisser) when comparing the estimated aver-
age work completed at each load (Fig. 1). Estimated aver-
age work was highest during the 60% load compared with
that during the 50% (13.6% difference, P = 0.012), 70%
(22.5% difference, P = 0.023), and 80% loads (40.6% dif-
ference, P = 0.043). Inspiratory work undertaken at all loads
was highest within the first quartile, decreasing progres-
sively over time at all loads (P G 0.05). Bivariate corre-
lations were performed to compare the relationship between
average work completed to average fc at each load and to
the number of repetitions at each load; no significant cor-
relations were found at any load.
Cardiovascular response. Because of the large re-
duction in the number of repetitions completed at loads
970% PImax (Table 2), differing temporal analyses were
undertaken for data G70% and 970% PImax. Analysis of
loads at 50% and 60% PImax was undertaken at 30-s bin
intervals for the first 3 min of loading. Loads 970% PImax
were analyzed at 15-s bin intervals for the first min be-
cause some participants were unable to maintain breathing
for 930 s.
Temporal analysis of the cardiovascular re-
sponse at 50% and 60% PImax. Repeated-measures
ANOVA did not reveal any significant differences between
loads for MAP (P = 0.343), SBP (P = 0.314), and DBP
(P = 0.313); however, there was a clear and sustained dif-
ference in blood pressure between the 60% and 50% loads
(Table 4 and Figs. 2A–C). Therefore, planned pairwise
comparisons were undertaken, with Bonferroni correction,
to determine whether there were any significant changes
within loads (P set at G0.016) and between loads (P set
at G0.025) at the 30-, 60-, and 90-s time intervals compared
with baseline. Comparisons were not made beyond 90 s
because of the decreasing number of participants able to
sustain the 60% load beyond this time point. Using the
critical P values above, there was a significant increase
from baseline to the 60-s time interval in MAP (P = 0.016)
and DBP (P = 0.015) at the 60% load. The 60% load also
FIGURE 1—Comparison of estimated average work completed for
each resistive load. *Significantly different over time (P G 0.05).
†Significantly different compared with other loads (P G 0.05).
TABLE 4. Comparison of physiological responses at 30-s intervals for the first 3 min at loads of 50% and 60%.
VT (L) MAP (mm Hg) SBP (mm Hg) DBP (mm Hg) fc (bpm) Work (cm H2OIL)
50% (n = 8)
Pretest 1.3 T 0.5 87.9 T 11.3 136.0 T 19.8 69.8 T 10.5 73.3 T 11.4
30 s 2.3 T 1.0 90.2 T 13.4 133.0 T 20.5 71.4 T 14.1 86.7 T 12.6* 225.6 T 107.6
60 s 2.4 T 1.1 87.1 T 13.9 132.9 T 21.8 67.6 T 14.4 88.6 T 17.7* 234.5 T 123.8
90 s 2.5 T 1.1 90.8 T 13.1 135.9 T 20.8 71.0 T 13.4 88.2 T 17.0* 241.2 T 119.8
120 s 2.3 T 1.0 90.0 T 13.2 135.0 T 20.1 70.2 T 13.6 89.4 T 18.8 226.5 T 113.8
150 s 2.4 T 1.0 87.5 T 12.2 131.9 T 18.8 68.0 T 12.9 87.4 T 15.0 228.2 T 116.6
180 s 2.2 T 0.9 87.3 T 12.8 131.8 T 20.7 67.9 T 12.5 88.9 T 16.0 214.3 T 103.7
60%
Pretest (n = 8) 1.3 T 0.5 92.3 T 7.9 139.0 T 16.8 70.6 T 7.4 70.1 T 13.2
30 s (n = 8) 2.3 T 0.8 94.6 T 9.7 142.8 T 15.2** 73.5 T 10.7 88.9 T 18.5 269.1 T 118.8
60 s (n = 8) 2.1 T 0.8 99.7 T 10.1* 145.3 T 20.0* 77.7 T 8.1* 92.0 T 20.8* 249.3 T 112.3
90 s (n = 7) 2.1 T 0.8 103.3 T 12.2 151.7 T 22.4* 80.4 T 11.1 98.0 T 22.8* 250.1 T 131.8
120 s (n = 6) 2.1 T 0.8 104.3 T 16.7 149.1 T 26.5 82.6 T 13.5 95.8 T 24.9 255.6 T 134.6
150 s (n = 4) 2.2 T 1.0 109.2 T 18.4 151.8 T 29.4 87.7 T 14.3 95.6 T 29.2 271.3 T 141.1
180 s (n = 4) 2.3 T 1.0 109.1 T 20.1 153.8 T 31.5 87.7 T 15.0 100.7 T 23.8 237.2 T 145.0
Pairwise comparisons were only made at 30, 60, and 90 s because there were insufficient participants at later times for the 60% load.
* Significantly different compared with baseline (P e 0.016).
** Significantly different compared with 50% load (P e 0.025).
ACUTE RESPONSES TO INSPIRATORY LOADING Medicine & Science in Sports & Exercised 1699
BASICSCIENCES
Copyright © 2010 by the American College of Sports Medicine. Unauthorized reproduction of this article is prohibited.
- 5. elicited a rise in SBP from baseline to the 60-s (P = 0.002)
and 90-s (P = 0.002) time interval; furthermore, there was a
significant difference in SBP at the 30-s time interval
compared with the 50% load (P = 0.020). Importantly,
changes in arterial blood pressure were consistent between
participants at the 60% load, i.e., all participants showed an
increase. No change in blood pressure was evident over
time during the 50% load.
Repeated-measures ANOVA revealed significant between-
participant (P = 0.002) and within-participant (P = 0.001)
effects over time for fc when comparing the 50% and 60%
loads. Heart rate ( fc) also exhibited a sustained increase
from baseline during the 60% load (P = 0.000). Pairwise
comparisons with Bonferroni correction (P set at G 0.016)
revealed significant differences at 30-s (P = 0.013), 60-s
(P = 0.015), and 90-s (P = 0.002) time intervals compared
with baseline during the 50% load (Fig. 2D).
There was a significant difference in average work com-
pleted at the 50% and 60% loads (13.6%, P = 0.012), such
that the average work completed during the first 2 min at
the 60% load was 10.7% higher (255.4 T 12.9 cm H2OIL)
compared with that at 50% (228.4 T 9.1 cm H2OIL). No
FIGURE 2—Comparison of percentage change from pretest values for MAP (A), SBP (B), DBP (C), and fc (D) at 50% and 60% loads. MAP, SBP,
and DBP were measured in millimeters of mercury (mm Hg). †Significantly different compared with 50% load (P G 0.025).
TABLE 5. Comparison of cardiovascular responses at 15-s intervals for the first 45 s at loads of 70%, 80%, and 90% PImax.
VT (L) MAP (mm Hg) SBP (mm Hg) DBP (mm Hg) fc (bpm)
70% PImax
15-s intervals
Pretest (n = 8) 1.3 T 0.5 91.0 T 14.3 131.4 T 20.9 74.2 T 13.0 76.2 T 10.3
15 s (n = 8) 1.0 T 0.6 94.8 T 25.5 133.7 T 33.5 75.8 T 19.7 89.3 T 14.9*
30 s (n = 8) 0.8 T 0.6 98.7 T 26.0 136.4 T 39.0 77.2 T 19.5 91.8 T 16.5*
45 s (n = 3) 1.0 T 0.8 95.2 T 16.0 122.7 T 15.9 75.0 T 10.8 98.7 T 17.5*
80% PImax
15-s intervals
Pretest (n = 8) 1.5 T 0.5 90.5 T 9.6 133.1 T 15.8 72.1 T 11.4 73.4 T 11.6
15 s (n = 8) 1.3 T 0.9 89.4 T 6.9 126.0 T 18.1 67.7 T 9.8 92.2 T 11.0*
30 s (n = 6) 0.9 T 0.8 97.3 T 15.2 140.5 T 24.8 78.3 T 13.8 87.9 T 11.7*
45 s (n = 2) 1.5 T 0.6 96.2 T 0.2 142.2 T 9.8 68.6 T 4.0 109.4 T 7.9
90% PImax
15-s intervals
Pretest (n = 8) 1.3 T 0.5 92.1 T 7.9 133.1 T 7.9 74.4 T 7.9 70.6 T 6.4
15 s (n = 8) 0.8 T 0.3 94.1 T 11.5 129.5 T 13.2 75.1 T 10.0 86.3 T 13.9*
30 s (n = 5) 0.5 T 0.3 101.0 T 15.9 139.8 T 19.6 82.3 T 13.9 96.0 T 19.2*
45 s (n = 1) 0.5 100.1 139.3 76.7 87.5
* Significantly different compared with baseline (P Q 0.05).
http://www.acsm-msse.org1700 Official Journal of the American College of Sports Medicine
BASICSCIENCES
Copyright © 2010 by the American College of Sports Medicine. Unauthorized reproduction of this article is prohibited.
- 6. statistical analysis was performed from 120 to 180 s be-
cause of the small number of participants (n = 4) able to
continue the task for 3 min at the 60% load.
Temporal analysis of the cardiovascular re-
sponse at loads 970%. Only those participants able to
complete at least 30 s of breathing were included in the
temporal analysis at loads 970%. Table 5 compares the
cardiovascular responses at 15-s intervals for loads of 70%,
80%, and 90%. Although there was a significant within-
participant effect for all variables (P G 0.05), there were no
significant differences between loads. All loads elicited a
significant increase in fc over time compared with baseline
(P G 0.05), but planned pairwise comparisons revealed no
significant changes in any other cardiovascular variable.
DISCUSSION
The main purpose of this study was to characterize the
acute cardiorespiratory responses to a range of pressure
threshold inspiratory loads (50%–90% PImax). Although
inspiratory pressure threshold loading is the most widely
used method for training the inspiratory muscles, the char-
acteristics of inspiratory pressure threshold loading remain
largely unstudied. This dearth of knowledge for inspira-
tory pressure threshold loading is in stark contrast to the
widely studied technique of inspiratory flow-resistive loading
(16,20–22,26). The most important findings of our study
were as follows: 1) during inspiratory pressure threshold
loading, external work is compromised at high loading in-
tensities because of the interaction of the load with the
pressure–volume relationship of the inspiratory muscles; 2)
external work was maximized at the 60% load; and 3)
although all loads elicited a sustained increase in fc, only
the 60% load elicited a sustained rise in SBP and MAP,
providing evidence for a metaboreflex response at this load.
These observations have important practical implications for
the successful implementation of pressure threshold IMT.
Load magnitude and RM. To our knowledge, this is
the first study to examine the training characteristics across
a range of loads using inspiratory pressure threshold load-
ing. There was little difference between the total number
of repetitions completed to task failure and the number of
repetitions defined objectively using the VT %FVC thresh-
old (Table 2). At 50% and 60% PImax, participants were
able to complete an average of 134 T 68 repetitions (537 T
268 s) and 85 T 85 repetitions (339 T 342 s), respectively.
Direct comparison with previous studies using flow-resistive
inspiratory loading is problematic because not only the
method of loading but also the breathing frequency, duty
cycle (15 breaths per minute and 0.5, respectively, in the
present study), and VT differed in the present study. For
example, Witt et al. (26) observed that Tlim during inspiratory
flow-resistive loading at 60% PImax occurred after 535 T
52 s, which corresponded to È133 repetitions at their
breathing frequency of 15 breaths per minute and duty cycle
of 0.7. On the face of it, the tolerance to moderate (60%
PImax) inspiratory flow-resistive loading seems much greater
than to pressure threshold loading. However, VT in the study
of Witt et al. (26) was less than half that in the present study
(È1.l vs È2.l, respectively), reducing the external work
associated with each breath. In addition, the inertial prop-
erties of a pressure threshold load tend to lead to higher
inspiratory flow rates and a reduction in inspiratory time (6),
despite the imposed duty cycle. In theory, the associated
reduction in duty cycle should reduce the likelihood of fa-
tigue of the inspiratory muscles, but in practice, the higher
inspiratory flow rate increases the relative load on the in-
spiratory muscles due to functional weakening at higher
velocities of shortening (14). These factors may collectively
hasten Tlim during pressure threshold loading, compared with
flow-resistive loading.
There was a nonlinear inverse relationship between the
number of repetitions completed and the magnitude of the
inspiratory load. The break point of this relationship oc-
curred at the 70% PImax load (Table 2). Our results showed
a broadly similar relationship between the relative inspira-
tory muscle load and the number of repetitions to that of
limb muscles, in that participants performed an average of
1–7 repetitions at training loads 980% PImax, 7–17 rep-
etitions between 70% and 80% PImax, and 918 repetitions
at loads G60% PImax. In traditional whole-body resistance
training, loads 980%–85% of the 1RM are typically asso-
ciated with regimens of 1–6 repetitions, loads of 70%–80%
1RM with È6–12 repetitions, and loads of G60% 1RM with
12–15 repetitions (13). Our data suggest that the relation-
ship between the relative load and the number of repeti-
tions to task failure is similar to that of limb muscles at
high loading, but that the ability to tolerate low to moderate
loads may be greater for the inspiratory muscles, e.g., 84
repetitions at 60% PImax, compared with 12–15 repetitions
for whole-body resistance training at a similar relative load.
This may be a reflection of the more aerobic phenotype
typical of inspiratory muscles (8) as well as the absence of
an eccentric phase to the inspiratory muscle loading.
Previous studies of pressure threshold IMT in healthy
young people have typically used loads equivalent to the
30RM (3,9,11,16,19,23,25). Our participants showed
marked differences in their individual tolerance to inspira-
tory loading (Table 2). For example, at the lowest load of
50% PImax, some participants (n = 3) were able to continue
to the maximum 15-min cutoff, whereas others reached task
failure in less than 4 min (n = 2). To explore the rela-
tionship of the 30RM to the relative PImax load, we iden-
tified the load that induced task failure as close as possible
to 30 breaths for each participant, which corresponded to
60% for six participants and 70% for the remaining two.
Thus, for our participants, the load most closely corre-
sponding to the 30RM was 62.5% PImax. Interestingly, a
recent study investigating pressure threshold IMT in elite
oarsmen (12) showed no IMT-induced change in PImax
using a load of 50% PImax, whereas they found a significant
21% increase in PImax after 6 wk of IMT using a load of
ACUTE RESPONSES TO INSPIRATORY LOADING Medicine & Science in Sports & Exercised 1701
BASICSCIENCES
Copyright © 2010 by the American College of Sports Medicine. Unauthorized reproduction of this article is prohibited.
- 7. È62% T 3% PImax. These data suggest that, in trained in-
dividuals at least, a pressure threshold load in excess of
60% PImax is required to elicit improvements in PImax, and
the present data indicate that this can be approximated by
using the 30RM.
Tidal volume and external work during pressure
threshold loading. Participants were instructed to maxi-
mize VT during inspiratory loading to explore how loading
influenced VT. It was assumed that the interaction of the
fixed pressure threshold load with the pressure–volume
relationship of the inspiratory muscles would influence the
starting VT and that progressive fatigue would lead to a
reduction in VT during loading. As seen in Table 3, these
assumptions were confirmed. However, it is notable that
VT during the 50% and 60% loads was disproportionately
larger than that seen at the 70% and 80% loads. We
speculate that this may be due to the nonlinearity of the
pressure–volume relationship, such that high loads are on
a steeper portion of this relationship than moderate loads
are. Hence, smaller changes in volume result in larger re-
ductions in force-generating capacity at higher loads. It
seems that the breakpoint for this relationship occurs be-
tween 60% and 70% of PImax. There was also a significant
effect of time on VT at loads 960% of PImax. This temporal
decline in VT during flow-resistive breathing has been
shown previously (20), and it is most likely a manifestation
of the onset of fatigue. The absence of this phenomenon at
the 50% load suggests that loads G50% of PImax fail to
provide adequate overload to the inspiratory muscles in
well-trained young men.
These observations have important implications for ex-
ternal inspiratory muscle work undertaken at a given load
(Fig. 1) because external work is the product of the pressure
load and the volume change achieved at that load. This was
found to decline significantly over time at all loads and to
be significantly greater during the 60% load than at any
other load. Counterintuitively, external work was lowest at
the 80% load, and this was a direct effect of the lower VT
at this load. During resistance training of limb muscles
using inertial loads, external work is a direct function of the
external load because the distance over which the load is
moved does not differ between loads or within a given set.
Our data indicate that this is not the case for inspiratory
pressure threshold loading. If one accepts the premise that it
is desirable to maximize the amount of external work com-
pleted while minimizing the time taken to achieve this during
a given training session, our data suggest that achieving
adequate training overload during pressure threshold loading
demands a careful balance of maximizing load and number
of repetitions while minimizing the influence of loading on
VT. These findings may also shed light on the cardiovascular
responses that were observed (see below).
Cardiovascular response to inspiratory resistive
loading. One of the purposes of this study was to evaluate
whether the inspiratory muscle metaboreflex was activated
during pressure threshold loading. At the 50% PImax load,
there was a significant increase in fc, but no change in any
index of blood pressure, compared with baseline (Table 4).
In contrast, at the 60% PImax load, there was not only an
increase in fc but also increases in MAP, SBP, and DBP,
compared with baseline, as well as to the responses at the
50% PImax load. This observation is consistent with those
of both Sheel et al. (20,21) and Witt et al. (26) during flow-
resistive inspiratory loading at 60% PImax. Both studies
observed a time-dependent increase in both fc and MAP
within 2–3 min of the start of loaded breathing. Our data
show an earlier onset of these changes (60 s), which have
been attributed to the activation of the inspiratory muscle
metaboreflex and were only present at the 60% PImax load.
The question then arises as to why metaboreflex activation
occurred at the 60% load but not at any other load. As
indicated above, the 60% load was also associated with the
greatest external work; thus, it is possible that there is a
threshold intensity of work that is required to activate the
inspiratory muscle metaboreflex. A threshold phenomenon
has been shown previously using inspiratory flow-resistive
loading, and at a similar loading intensity (21), but these
authors characterized the loading in its propensity to induce
diaphragm fatigue, rather than its mechanical properties.
They concluded that only flow-resistive loads that induced
diaphragm fatigue were associated with metaboreflex ac-
tivation. Our data are entirely consistent with this notion
because one would predict that the accumulation of metab-
olites within the inspiratory muscles would be associated
with a minimum threshold of inspiratory muscle work and
that this accumulation would also elicit contractile fatigue
of the inspiratory muscles.
Previous studies of the influence of pressure threshold
IMT on the inspiratory muscle metaboreflex threshold have
shown that training at loads equivalent to the 30RM (16)
and at 50% PImax for three sets of 75 breaths (26) elicit an
increase in the threshold for activation of this reflex. Data
from the present study suggest that 30RM protocol is
associated with the activation of the inspiratory muscle
metaboreflex during IMT. In the case of the protocol used
by Witt et al. (26), the present study suggests that a con-
tinuous set of 134 T 66.9 breaths at 50% PImax is insuf-
ficient to elicit the metaboreflex. However, it is possible
that accumulating a total of 225 breaths (3 Â 75 breaths)
may be sufficient for activation. Further studies are re-
quired to identify whether metaboreflex activation during
IMT is an obligatory feature of the IMT-induced increase in
metaboreflex threshold.
SUMMARY
As expected, there was a nonlinear inverse relationship
between load magnitude and Tlim when breathing against
inspiratory pressure threshold loads, and there was large
interindividual variation in tolerance to such loading. In our
participants, the 30RM load that has been used in pre-
vious studies of IMT corresponded to a load of 62.5%
http://www.acsm-msse.org1702 Official Journal of the American College of Sports Medicine
BASICSCIENCES
Copyright © 2010 by the American College of Sports Medicine. Unauthorized reproduction of this article is prohibited.
- 8. PImax. Most importantly, the pressure–volume relationship of
the inspiratory muscles exerted a potent influence on VT
during loading, which had a corresponding influence on the
amount of external work undertaken by the inspiratory mus-
cles during each load. Unexpected paradoxical reductions in
external work were present at loads above 60%, which may
have implications for the efficacy of high-intensity IMT
with respect to its influence on inspiratory muscle function.
Metaboreflex-induced increases in the indices of arterial
blood pressure were evident within 60 s during inspiratory
pressure threshold loading at 60% PImax (our participants’
30RM) but not at other loads. This may also have important
implications for the ergogenic efficacy of IMT, but further
research is needed to determine whether activation of the
metaboreflex during IMT is obligatory for increasing its
threshold for activation after IMT.
A.K.M. declares a beneficial interest in the POWERbreathe
inspiratory muscle trainer in the form of a share of license income
to the University of Birmingham, as well as acting as a consultant to
HaB International Ltd. L.A.G. has no potential conflicts of interest.
No funding was received for this research.
The results of the present study do not constitute endorsement
by the American College of Sports Medicine.
REFERENCES
1. American Thoracic Society. Standardization of spirometry. Am J
Respir Crit Care Med. 1995;152(3):1107–36.
2. Black LF, Hyatt RE. Maximal respiratory pressures: normal values
and relationship to age and sex. Am Rev Respir Dis. 1969;99(5):
696–702.
3. Brown PI, Sharpe GR, Johnson MA. Inspiratory muscle training
reduces blood lactate concentration during volitional hyperpnoea.
Eur J Appl Physiol. 2008;104(1):111–7.
4. Chiappa GR, Roseguini BT, Vieira PJ, et al. Inspiratory muscle
training improves blood flow to resting and exercising limbs in
patients with chronic heart failure. J Am Coll Cardiol. 2008;
51(17):1663–71.
5. Dall’Ago P, Chiappa GR, Guths H, Stein R, Ribeiro JP.
Inspiratory muscle training in patients with heart failure and in-
spiratory muscle weakness: a randomized trial. J Am Coll Cardiol.
2006;47(4):757–63.
6. Eastwood PR, Hillman DR, Finucane KE. Ventilatory responses
to inspiratory threshold loading and role of muscle fatigue in task
failure. J Appl Physiol. 1994;76(1):185–95.
7. Geddes EL, O’Brien K, Reid WD, Brooks D, Crowe J. Inspiratory
muscle training in adults with chronic obstructive pulmonary
disease: an update of a systematic review. Respir Med. 2008;102:
1715–29.
8. Gollnick PD, Armstrong RB, Saubert CW, Piehl K, Saltin B.
Enzyme activity and fiber composition in skeletal muscle of
untrained and trained men. J Appl Physiol. 1972;33(3):312–9.
9. Griffiths LA, McConnell AK. The influence of inspiratory and
expiratory muscle training upon rowing performance. Eur J Appl
Physiol. 2007;99(5):457–66.
10. Heistad DD, Wheeler RC. Effect of acute hypoxia on vascular
responsiveness in man. I. Responsiveness to lower body negative
pressure and ice on the forehead. II. Responses to norepinephrine
and angiotensin. III. Effect of hypoxia and hypocapnia. J Clin
Invest. 1970;49(6):1252–65.
11. Johnson MA, Sharpe GR, Brown PI. Inspiratory muscle training
improves cycling time-trial performance and anaerobic work
capacity but not critical power. Eur J Appl Physiol. 2007;101(6):
761–70.
12. Klusiewicz A, Borkowski L, Zdanowicz R, Boros P, Wesolowski
S. The inspiratory muscle training in elite rowers. J Sports Med
Phys Fitness. 2008;48(3):279–84.
13. Kraemer WJ, Ratamess NA. Fundamentals of resistance training:
progression and exercise prescription. Med Sci Sports Exerc.
2004;36(4):674–88.
14. Leblanc P, Summers E, Inman MD, Jones NL, Campbell EJ,
Killian KJ. Inspiratory muscles during exercise: a problem of sup-
ply and demand. J Appl Physiol. 1988;64(6):2482–9.
15. Lomax M, McConnell AK. Influence of prior activity (warm-up)
and inspiratory muscle training upon between- and within-day re-
liability of maximal inspiratory pressure measurement. Respiration.
2009;78(2):197–202.
16. McConnell AK, Lomax M. The influence of inspiratory muscle
work history and specific inspiratory muscle training upon human
limb muscle fatigue. J Physiol. 2006;577(1):445–57.
17. McConnell AK, Romer LM. Respiratory muscle training in healthy
humans: resolving the controversy. Int J Sports Med. 2004;25(4):
284–93.
18. Romer LM, McConnell AK. Specificity and reversibility of
inspiratory muscle training. Med Sci Sports Exerc. 2003;35(2):
237–44.
19. Romer LM, McConnell AK, Jones DA. Effects of inspiratory
muscle training on time-trial performance in trained cyclists.
J Sports Sci. 2002;20(7):547–62.
20. Sheel AW, Derchak PA, Morgan BJ, Pegelow DF, Jacques AJ,
Dempsey JA. Fatiguing inspiratory muscle work causes reflex
reduction in resting leg blood flow in humans. J Physiol. 2001;
537(1):277–89.
21. Sheel AW, Derchak PA, Pegelow DF, Dempsey JA. Threshold
effects of respiratory muscle work on limb vascular resistance.
Am J Physiol Heart Circ Physiol. 2002;282(5):H1732–8.
22. St Croix CM, Morgan BJ, Wetter TJ, Dempsey JA. Fatiguing
inspiratory muscle work causes reflex sympathetic activation in
humans. J Physiol. 2000;529(2):493–504.
23. Tong TK, Fu FH, Chung PK, et al. The effect of inspiratory
muscle training on high-intensity, intermittent running perfor-
mance to exhaustion. Appl Physiol Nutr Metab. 2008;33(4):
671–81.
24. Volianitis S, McConnell AK, Jones DA. Assessment of maximum
inspiratory pressure. Prior submaximal respiratory muscle activity
(Fwarm-up_) enhances maximum inspiratory activity and attenu-
ates the learning effect of repeated measurement. Respiration.
2001;68(1):22–7.
25. Volianitis S, McConnell AK, Koutedakis Y, McNaughton L,
Backx K, Jones DA. Inspiratory muscle training improves rowing
performance. Med Sci Sports Exerc. 2001;33(5):803–9.
26. Witt JD, Guenette JA, Rupert JL, McKenzie DC, Sheel AW.
Inspiratory muscle training attenuates the human respiratory
muscle metaboreflex. J Physiol. 2007;584(3):1019–28.
ACUTE RESPONSES TO INSPIRATORY LOADING Medicine & Science in Sports & Exercised 1703
BASICSCIENCES
Copyright © 2010 by the American College of Sports Medicine. Unauthorized reproduction of this article is prohibited.