SlideShare a Scribd company logo
1 of 50
1
CHAPTER-1
INTRODUCTION
1.1 MUTUAL FUND
A Mutual Fund is a trust that pools the savings of a number of investors who
share a common financial goal. The money thus collected is then invested in capital
market instruments such as shares, debentures and other securities. The income
earned through these investments and the capital appreciation realized is shared by its
unit holders in proportion to the number of units owned by them. Thus a Mutual Fund
is the most suitable investment for the common man as it offers an opportunity to
invest in a diversified, professionally managed basket of securities at a relatively low
cost. The flow chart below describes broadly the working of a mutual fund:
1.2 Meaning of Mutual fund
Hence a Mutual Fund is a form of collective investment. It is formed by
coming together a number of investors who transfer their surplus funds to a
professionally qualified organization to manage it. To get the surplus funds from the
investors, the fund adopts a simple technique. Each fund is divided into small fraction
called ‘units’ of equal value. Every investor whether big or small, will have a stake in
the fund and can enjoy wide portfolio of the investment held by the fund. Thus the
Mutual Fund is the most sustainable investment for the common man as it offers an
2
opportunity to invest in a diversified, professionally managed basket of securities at a
relatively low cost.
1.3 Overview of Mutual fund
The one investment vehicle that has truly come of age in India in the past
decade is mutual funds. Today, the mutual fund industry in the country manages
around Rs 100,000 crores of assets, a large part of which comes from retail investors.
And this amount is invested not just in equities, but also in the entire gamut of debt
instruments. Mutual funds have emerged as a proxy for investing in avenues that are
out of reach of most retail investors, particularly government securities and money
market instruments.
Specialization is the order of the day, be it with regard to a scheme’s
investment objective or its targeted investment universe. Given the plethora of options
on hand and the hard sell adopted by mutual funds vying for a piece of your savings,
finding the right scheme can sometimes seem a bit daunting. Mind you, it’s not just
about going with the fund that gives you the highest returns. It’s also about managing
risk–finding funds that suit your risk appetite and investment needs.
Simply, a mutual fund is an investment vehicle that pools in the monies of
several investors, and collectively invests this amount in either the equity market or
the debt market, or both, depending upon the fund’s objective. This means you can
access either the equity or the debt market, or both, without investing directly in
equity or debt.
1.4 Advantage of Mutual fund
Since the creation, mutual funds have been a popular investment vehicle for
investors. The simplicities along with other attributes provide great benefit to
investors with limited knowledge, time, or money. It helps to decide whether mutual
funds are best for an investor and for the given situation, some reasons why an
investor might want to consider investing in mutual funds.
 Affordability
An investor need not to be a millionaire to invest in Mutual Fund as the
minimum investment in Mutual Fund starts from Rs. 500/-. A Mutual Fund because
of its large corpus allows even a small investor to take the benefit of its investment
strategy.
3
 Portfolio diversification
Mutual Funds diversify your portfolio by investing in various securities and
minimize the risk. This kind of a diversification may add to the stability of returns
 Choice
Mutual Fund offers a tremendous variety of schemes. This variety is beneficial
in two ways; first it offers different types of schemes to investors with different needs
and risk appetites; secondly it offers an opportunity to an investor to invest sums
across a variety of schemes, both debt and equity. For example, an investor can invest
his money in a growth fund (equity scheme) and income fund (debt scheme)
depending on the risk appetite and thus create a balanced portfolio easily or simply
just buy a balanced scheme.
 Professional Management
The management of a portfolio involves continuous monitoring of various
securities and the innumerable economic and non-economic variables that may affect
portfolio’s performance. This requires a lot of time and effort on the part of the
investor, along with in-depth knowledge of the functioning of the financial markets.
Thus investment in mutual funds produces better results as knowledgeable and
experienced professionals, who are totally devoted to tracking and updating the
portfolio, manage it.
 Tax Benefits
 Income distributed by equity schemes will not be subject to dividend distribution
tax and will be tax-free in the hands of the investors.
 Units held will not be liable to wealth tax.
 Short-term capital gains from equity schemes will be taxed at 10% (plus
applicable surcharge), while long term capital gains will not be subject to ant tax.
 Regulations
All Mutual Funds in India are registered with the regulator of the Indian
securities industry – the Securities Exchange Board of India (SEBI). The funds
function within the framework of regulations designed by SEBI. Those regulations
relate to the formations, administration and management of Mutual Funds and also
prescribe disclosure and accounting requirements. Such a high level of regulation
seeks to protect the interest of investors.
 Liquidity
4
In open-ended Mutual Funds, investor can redeem all or part of his units any
time he wish. Some schemes do have a lock-in period where an investor cannot return
the units until the completion of such a lock-in period.
 It can be traded in the secondary market, if it is a listed security.
 It can be redeemed with the Asset Management Company (AMC) with the
applicable clauses.
 Off market transfers
 Flexibility
Mutual Funds offering multiple schemes allow investors to switch easily between
various schemes. This flexibility gives the investor a convenient way to change the
mix of his portfolio overtime
 Transparency
Mutual Funds regularly provide investors with information on the value of
their investments. Mutual Funds also provide complete portfolio disclosure of the
investments made by various schemes and also the proportion invested in each asset
type.
 Convenience
An investor can purchase or sell fund units directly from the fund, through a
broker or a financial planner. The investor may opt for a Systematic Investment Plan
(SIP) or a Systematic Withdrawal Advantage Plan (SWAP). In addition to this an
investor receives account statements and portfolios of the statements
 Low Transaction cost
Mutual Funds are a relatively less expensive way to invest compared to
directly investing in the capital markets because the benefits of scale in brokerage,
custodial and other fees translate into lower costs for investors.
1.4 Disadvantages of Mutual Funds
Like many investments, mutual funds offer advantages and disadvantages,
which are important for the investors to consider and understand before they decide to
buy. Here we explore some of the drawbacks of mutual funds.
 Fluctuating Returns
Mutual funds are like many other investments without a guaranteed return.
There is always the possibility that the value of the mutual fund will depreciate.
Unlike fixed-income products, such as bonds and Treasury bills, mutual funds
5
experience price fluctuations along with the stocks that make up the fund. When
deciding on a particular fund to buy, investor need to research the risks involved - just
because a professional manager is looking after the fund, that doesn't mean the
performance will be positive.
 Diversification
Although diversification is one of the keys to successful investing, many
mutual fund investors tend to over diversify. The idea of diversification is to reduce
the risks associated with holding a single security; over diversification (also known as
diversification) occurs when investors acquire many funds that are highly related and
so don't get the risk reducing benefits of diversification. At the other extreme, just
because an investor owns s mutual fund doesn't mean that he is automatically
diversified. For example, a fund that invests only in a particular industry or region is
still relatively risky.
 Cash, Cash and More Cash
As investor know already, mutual funds pool money from thousands of
investors, so everyday investors are putting money into the fund as well as
withdrawing investments. To maintain liquidity and the capacity to accommodate
withdrawals, funds typically have to keep a large portion of their portfolio as cash.
Having ample cash is great for liquidity, but money sitting around as cash is not
working for the investor and thus is not very advantageous.
 Costs
Mutual funds provide investors with professional management; however, it
comes at a cost. Funds will typically have a range of different fees that reduce the
overall payout. In mutual funds the fees are classified into two categories: shareholder
fees and annual fund-operating fees.
The shareholder fees, in the forms of loads and redemption fees, are paid
directly by shareholders purchasing or selling the funds. The annual fund operating
fees are charged as an annual percentage - usually ranging from 1-3%. These fees are
assessed to mutual fund investors regardless of the performance of the fund. As you
can imagine, in years when the fund doesn't make money these fees only magnify
losses.
 Misleading Advertisements
6
The misleading advertisements of different funds can guide investors down the
wrong path. Some funds may be incorrectly labeled as growth funds, while others are
classified as small-cap or income. The SEC requires funds to have at least 80% of
assets in the particular type of investment implied in their names. The remaining
assets are under the discretion solely of the fund manager. The different categories
that qualify for the required 80% of the assets, however, may be vague and wide-
ranging. A fund can therefore manipulate prospective investors by using names that
are attractive and misleading. Instead of labeling itself a small cap, a fund may be sold
under the heading growth fund.
 Costs Control Not in the Hands of an Investor
Investor has to pay investment management fees and fund distribution costs as
a percentage of the value of his investments (as long as he holds the units),
irrespective of the performance of the fund.
 No Customized Portfolios
The portfolio of securities in which a fund invests is a decision taken by the
fund manager. Investors have no right to interfere in the decision making process of a
fund manager, which some investors find as a constraint in achieving their financial
objectives.
 Difficulty in Selecting a Suitable Fund Scheme
Many investors find it difficult to select one option from the bunch of
funds/schemes/plans available. For this, they may have to take advice from financial
planners in order to invest in the right fund to achieve their objectives.
 Political risks
Successive governments brings with them fancy new economic ideologies and
policies. It is often said that many economic decisions are politically motivated.
Changes in the government bring in the risk of uncertainty, which every player in the
financial service industry has to face. So Mutual Funds are no exception to it.
7
1.5 Classification of Mutual Funds
 Equity Funds
Equity funds are considered to be the more risky funds as compared to other
fund types, but they also provide higher returns than other funds. It is advisable that
an investor looking to invest in an equity fund should invest for long term i.e. for 3
years or more. There are different types of equity funds each falling into different risk
bracket. In the order of decreasing risk level, there are following types of equity
funds:
8
1. Aggressive Growth Funds –
In Aggressive Growth Funds, fund managers aspire for maximum capital
appreciation and invest in less researched shares of speculative nature.
Because of these speculative investments Aggressive Growth Funds become
more volatile and thus they are riskier than other equity funds.
2. Growth Funds –
Growth Funds also invest for capital appreciation (with time horizon of 3 to 5
years) but they are different from Aggressive Growth Funds in the sense that
they invest in companies that are expected to outperform the market in the
future. Without entirely adopting speculative strategies, Growth Funds invest
in those companies that are expected to post above average earnings in the
future.
3. Specialty Funds –
Specialty Funds have stated criteria for investments and their portfolio
comprises of only those companies that meet their criteria. Criteria for some
Specialty funds could be to invest/not to invest in particular
regions/companies. Specialty funds are concentrated and thus, are
comparatively riskier than diversified funds. There are following types of
Specialty funds:
a. Sector Funds:
Equity funds that invest in a particular sector/industry of the market are known
as Sector Funds. The exposure of these funds is limited to a particular sector
(say Information Technology, Auto, Banking, Pharmaceuticals or Fast Moving
Consumer Goods) which is why they are more risky than equity funds that
invest in multiple sectors.
b. Foreign Securities Funds:
Foreign Securities Equity Funds have the option to invest in one or more
foreign companies. Foreign securities funds achieve international
diversification and hence they are less risky than sector funds. However,
foreign securities funds are exposed to foreign exchange rate risk and country
risk.
c. Mid-Cap or Small-Cap Funds:
9
Funds that invest in companies having lower market capitalization than large
capitalization companies are called Mid-Cap or Small-Cap Funds. Market
capitalization of Mid-Cap companies is less than that of big, blue chip
companies (less than Rs. 3500 crores but more than Rs. 600 crores) and Small-
Cap companies have market capitalization of less than Rs. 600 crores.
d. Option Income Funds:
While not yet available in India, Option Income Funds write options on a large
fraction of their portfolio. Proper use of options can help to reduce volatility,
which is otherwise considered as a risky instrument. These funds invest in big,
high dividend yielding companies, and then sell options against their stock
positions, which generate stable income for investors.
4. Diversified Equity Funds –
Except for a small portion of investment in liquid money market, diversified
equity funds invest mainly in equities without any concentration on a
particular sector(s). These funds are well diversified and reduce sector-specific
or company-specific risk. However, like all other funds diversified equity
funds too are exposed to equity market risk. One prominent type of diversified
equity fund in India is Equity Linked Savings Schemes (ELSS). As per the
mandate, a minimum of 90% of investments by ELSS should be in equities at
all times. ELSS investors are eligible to claim deduction from taxable income
(up to Rs 1 lakh) at the time of filing the income tax return. ELSS usually has
a lock-in period and in case of any redemption by the investor before the
expiry of the lock-in period makes him liable to pay income tax on such
income(s) for which he may have received any tax exemption(s) in the past.
5. Equity Index Funds –
Equity Index Funds have the objective to match the performance of a specific
stock market index. The portfolio of these funds comprises of the same
companies that form the index and is constituted in the same proportion as the
index. Equity index funds that follow broad indices (like S&P CNX Nifty,
Sensex) are less risky than equity index funds that follow narrow sectoral
indices (like BSEBANKEX or CNX Bank Index etc). Narrow indices are less
diversified and therefore, are more risky.
6. Value Funds –
10
Value Funds invest in those companies that have sound fundamentals and
whose share prices are currently under-valued. The portfolio of these funds
comprises of shares that are trading at a low Price to Earning Ratio (Market
Price per Share / Earning per Share). Value Funds may select companies from
diversified sectors and are exposed to lower risk level as compared to growth
funds or Specialty funds
7. Equity Income or Dividend Yield Funds -
The objective of Equity Income or Dividend Yield Equity Funds is to generate
high recurring income and steady capital appreciation for investors by
investing in those companies which issue high dividends (such as Power or
Utility companies whose share prices fluctuate comparatively lesser than other
companies' share prices). Equity Income or Dividend Yield Equity Funds are
generally exposed to the lowest risk level as compared to other equity funds.
 Debt / Income Funds
Funds that invest in medium to long-term debt instruments issued by
private companies, banks, financial institutions, governments and other entities
belonging to various sectors (like infrastructure companies etc.) are known as Debt /
Income Funds. Debt funds are low risk profile funds that seek to generate fixed
current income to investors. Although debt securities are generally less risky than
equities, they are subject to credit risk (risk of default) by the issuer at the time of
interest or principal payment Based on different investment objectives there can be
following types of debt funds:
1. Diversified Debt Funds –
Debt funds that invest in all securities issued by entities belonging to all
sectors of the market are known as diversified debt funds. The best feature of
diversified debt funds is that investments are properly diversified into all sectors
which results in risk reduction. Any loss incurred, on account of default by a debt
issuer, is shared by all investors which further reduces risk for an individual investor.
2. Focused Debt Funds -
Unlike diversified debt funds, focused debt funds are narrow focus funds that
are confined to investments in selective debt securities, issued by companies of a
specific sector or industry or origin. Some examples of focused debt funds are sector,
11
specialized and offshore debt funds, funds that invest only in Tax Free Infrastructure
or Municipal Bonds. Because of their narrow orientation, focused debt funds are more
risky as compared to diversified debt funds. Although not yet available in India, these
funds are conceivable and may be offered to investors very soon.
3. High Yield Debt funds –
The risk of default is present in all debt funds, and therefore, debt funds
generally try to minimize the risk of default by investing in securities issued by only
those borrowers who are considered to be of "investment grade". But, High Yield
Debt Funds adopt a different strategy and prefer securities issued by those issuers who
are considered to be of "below investment grade". The motive behind adopting this
sort of risky strategy is to earn higher interest returns from these issuers. These funds
are more volatile and bear higher default risk, although they may earn at times higher
returns for investors.
4. Assured Return Funds –
Although it is not necessary that a fund will meet its objectives or provide
assured returns to investors, but there can be funds that come with a lock-in period
and offer assurance of annual returns to investors during the lock-in period. Any
shortfall in returns is suffered by the sponsors or the Asset Management Companies
(AMCs). These funds are generally debt funds and provide investors with a low-risk
investment opportunity. Currently, no AMC in India offers assured return schemes to
investors, though possible.
5. Fixed Term Plan Series –
Fixed Term Plan Series usually are closed-end schemes having short term
maturity period (of less than one year) that offer a series of plans and issue units to
investors at regular intervals. Unlike closed-end funds, fixed term plans are not listed
on the exchanges. Fixed term plan series usually invest in debt / income schemes and
target short-term investors. The objective of fixed term plan schemes is to gratify
investors by generating some expected returns in a short period.
 Gilt Funds
Also known as Government Securities in India, Gilt Funds invest in
government papers having medium to long term maturity period. Issued by the
Government of India, these investments have little credit risk (risk of default) and
provide safety of principal to the investors. However, like all debt funds, gilt funds
12
too are exposed to interest rate risk. Interest rates and prices of debt securities are
inversely related and any change in the interest rates results in a change in the NAV of
debt/gilt funds in an opposite direction.
 Money Market / Liquid Funds
Money market / liquid funds invest in short-term (maturing within one year)
interest bearing debt instruments. These securities are highly liquid and provide safety
of investment, thus making money market / liquid funds the safest investment option
when compared with other mutual fund types. However, even money market / liquid
funds are exposed to the interest rate risk. The typical investment options for liquid
funds include Treasury Bills (issued by governments), Commercial papers (issued by
companies) and Certificates of Deposit (issued by banks).
 Hybrid Funds
As the name suggests, hybrid funds are those funds whose portfolio includes a
blend of equities, debts and money market securities. Hybrid funds have an equal
proportion of debt and equity in their portfolio. There are following types of hybrid
funds in India:
1. Balanced Funds -
The portfolio of balanced fund includes assets like debt securities, convertible
securities, and equity and preference shares held in a relatively equal
proportion. The objectives of balanced funds are to reward investors with a
regular income, moderate capital appreciation and at the same time
minimizing the risk of capital erosion. Balanced funds are appropriate for
conservative investors having a long term investment horizon.
2. Growth-and-Income Funds –
Funds that combine features of growth funds and income funds are known as
Growth-and-Income Funds. These funds invest in companies having potential
for capital appreciation and those known for issuing high dividends. The level
of risks involved in these funds is lower than growth funds and higher than
income funds.
3. Asset Allocation Funds –
13
Mutual funds may invest in financial assets like equity, debt, money market or
non-financial (physical) assets like real estate, commodities etc.. Asset
allocation funds adopt a variable asset allocation strategy that allows fund
managers to switch over from one asset class to another at any time depending
upon their outlook for specific markets. In other words, fund managers may
switch over to equity if they expect equity market to provide good returns and
switch over to debt if they expect debt market to provide better returns. It
should be noted that switching over from one asset class to another is a
decision taken by the fund manager on the basis of his own judgment and
understanding of specific markets, and therefore, the success of these funds
depends upon the skill of a fund manager in anticipating market trends.
 Others
1. Commodity Funds
Those funds that focus on investing in different commodities (like metals,
food grains, crude oil etc.) or commodity companies or commodity futures contracts
are termed as Commodity Funds. A commodity fund that invests in a single
commodity or a group of commodities is a specialized commodity fund and a
commodity fund that invests in all available commodities is a diversified commodity
fund and bears less risk than a specialized commodity fund.
2. Real Estate Funds
Funds that invest directly in real estate or lend to real estate developers or
invest in shares/securitized assets of housing finance companies, are known as
Specialized Real Estate Funds. The objective of these funds may be to generate
regular income for investors or capital appreciation.
14
3. Exchange Traded Funds (ETF)
Exchange Traded Funds provide investors with combined benefits of a closed-
end and an open-end mutual fund. Exchange Traded Funds follow stock market
indices and are traded on stock exchanges like a single stock at index linked prices.
The biggest advantage offered by these funds is that they offer diversification,
flexibility of holding a single share (tradable at index linked prices) at the same time.
Recently introduced in India, these funds are quite popular abroad.
4. Fund of Funds
Mutual funds that do not invest in financial or physical assets, but do invest in
other mutual fund schemes offered by different AMCs, are known as Fund of Funds.
Fund of Funds maintain a portfolio comprising of units of other mutual fund schemes,
just like conventional mutual funds maintain a portfolio comprising of
equity/debt/money market instruments or non financial assets. Fund of Funds provide
investors with an added advantage of diversifying into different mutual fund schemes
with even a small amount of investment, which further helps in diversification of risks
As shown in the above diagram higher the risk higher is the return. Money Market
Mutual Fund (MMMF) has lowest risk but at the same time the return is also low.
Aggressive growth funds are more risky and they invest in equities which yield high
returns.
15
1.6 The Structure of a Mutual Fund
Sponsor
Sponsor is the person who acting alone or in combination with another body
corporate establishes a mutual fund. Sponsor must contribute at least 40% of the net
worth of the Investment Managed and meet the eligibility criteria prescribed under the
Securities and Exchange Board of India (Mutual Funds) Regulations, 1996.The
Sponsor is not responsible or liable for any loss or shortfall resulting from the
operation of the Schemes beyond the initial contribution made by it towards setting up
of the Mutual Fund.
16
Trustee
Trustee is usually a company (corporate body) or a Board of Trustees (body of
individuals). The main responsibility of the Trustee is to safeguard the interest of the
unit holders and inter alias ensure that the AMC functions in the interest of investors
and in accordance with the Securities and Exchange Board of India (Mutual Funds)
Regulations, 1996, the provisions of the Trust Deed and the Offer Documents of the
respective Schemes.
Asset Management Company (AMC)
The Trustee as the Investment Manager of the Mutual Fund appoints the
AMC. The AMC is required to be approved by the Securities and Exchange Board of
India (SEBI) to act as an asset management company of the Mutual
Fund. At least 50% of the directors of the AMC are independent directors who
are not associated with the Sponsor in any manner. The AMC must have a net worth
of at least 10 crore at all times.
Registrar and Transfer Agent
The AMC if so authorized by the Trust Deed appoints the Registrar and
Transfer Agent to the Mutual Fund. The Registrar processes the application form;
redemption requests and dispatches account statements to the unit holders. The
Registrar and Transfer agent also handles communications with investors and updates
investor records.
17
1.7 Type of risk
Risk and Return Trade-Off
The most important relationship to understand is the risk – return trade off.
Higher the risk greater the return or loss lower the risk lower the return or loss. Hence
it is up to investor to decide how much risk he is willing to take.
 Market Risk
Sometimes prices and yields of all securities rise and fall. Broad outside
influences affecting the market in general lead to this. This is true, may it be big
corporations or smaller mid sized companies. This is known as market risk.
 Credit Risk
The debt servicing ability (it may be interest payments or the replacement of
principal) of a company through its cash flows determines the credit risk faced by
you. This credit risk is measured by independent rating agencies like CRISIL who rate
companies. A well-diversified portfolio may help to migrate this risk.
 Inflation Risk
By this we mean the money worth today is much more than its worth after a
certain period of time. A lot of times people make conservative investment decisions
18
to protect their capital but end up with the sum of money less than the principal at the
time of investment. This happens if the inflation grows faster than the returns on your
investment. A well diversified portfolio with investments in equities will help to
mitigate this risk.
 Interest Rate Risk
In a free market economy interest rates are difficult if not impossible to
predict. Changes in interest rates affect the price of bonds as well as equities. If
interest rate rises the prices of bonds fall and vice versa.
 Political / Government Policy Risk
Changes in government policy and political decision can change the
investment environment for investment or vice versa.
 Liquidity Risk
Liquidity risk arises when it becomes difficult to sell the securities that one
has purchased. Liquidity risk can be partly mitigated by diversification as well as
internal risk controls that lean towards purchase of liquid securities.
Banks V/S Mutual Funds
Mutual Funds are now also competing with commercial banks in the race of
retail investor’s savings and corporate float money. The power shift towards Mutual
Funds has become obvious. The traditional saving avenues are losing out in the
current scenario. The driving force of Mutual Funds is the advantage of capital
appreciation together with the income earned in the form of dividend has made
Mutual Funds a hot favorite among millions of people all over the world. People
prefer Mutual Funds to bank deposits because with a little money they can get into the
investment game.
19
Banks Mutual Funds
Returns Low High
Administrative exp. High Low
Risk Low Moderate
Investment Options Less More
Network High Penetration Low but improving
Liquidity At a cost Better
Quality of Assets Not transparent Transparent
Income calculation Minimum balance must be
maintained every month
Everyday
Guarantee Maximum Rs. 1lakh on deposits None
1.8 Net Asset Value (NAV) of a scheme
The performance of a particular scheme of a mutual fund is denoted by Net
Asset Value (NAV). Mutual funds invest the money collected from the investors in
securities markets. The NAV per unit is the market value of securities of a scheme
divided by the total number of units of the scheme on any particular date. For
example, if the market value of securities of a mutual fund scheme is Rs 200 Lakhs
and the mutual fund has issued 10 Lakhs units of Rs. 10 each to the investors, then the
NAV per unit of the fund is Rs.20. NAV is required to be disclosed by the mutual
funds on a regular basis - daily or weekly - depending on the type of scheme
 How to Use Net Asset Values
NAVs are helpful in keeping an eye on your mutual fund's price movement,
but NAVs are not the best way to keep track of performance. The reason for this is
mutual fund distributions. Mutual funds are forced by law to distribute at least 90% of
its' realized capital gains and dividend income each year. When a fund pays out this
distribution, the NAV drops by the amount paid. This is important because an investor
may become frightened when they see their fund's NAV drop by $3 even though they
haven't lost any money (the $3 was paid out to the shareholder).
20
 Calculation of NAV
The most important part of the calculation is the valuation of the assets owned
by the fund. Once it is calculated, the NAV is simply the net value of assets divided
by the number of units outstanding. The detailed methodology for the calculation of
the asset value is given below.
NAV PER UNIT IS CALCULATED AS:-
Market value of investments + Current asserts and other assets + Accrued
income – current liabilities and other liabilities – Accrued Expenses
Net Asset Value or NAV of a Mutual Fund is the value of one unit of investment in
the fund, in net asset terms. It is computed by dividing the net assets of the fund by
the number of units that are outstanding in the books of the fund.
Market Value of Assets - Liabilities
NAV = __________________________________________
Units Outstanding
1.9 Significant factors affecting NAV:
 Sale and purchase of securities
 Sale and repurchase of units
 Valuation of all investment securities held
 Accrued income and liabilities
 Portfolio turnover
 Benchmark Index
 Dividend
 Government Policies
1.10 TAX TREATMENT OF A MUTUAL FUND
 Tax Benefit to a fund:
The entire income of a fund is exempt from income tax in accordance with the
provision of Section 10 (23D) of the Income Tax Act, 1961.
A fund will receive all income without any deduction of tax at source under
the provision of Section 196 (IV), of the Act.
However, under the Finance (No. 2) Act, 2004, it is provided that on income
distribution, if any, made by a fund on or after 1 April, 2004 to Unit holders, being
Individuals and Hindu Undivided Family, income-tax will be payable under Section
21
115R of the Act, at 13.06875% (inclusive of surcharge and additional surcharge called
Education Cess on Income Tax), and to other Unit holders at 20.91% (inclusive of
surcharge and additional surcharge on Income Tax), except, inter alias, in the case of
open ended equity oriented funds, (i.e. where the investible funds are invested by way
of equity shares in domestic companies to the extent of more than 50% of the total
proceeds of the Fund), where no such tax is levied.
 Tax Benefit to the Unit holders:
Income Tax
Income received in respect of units of a mutual fund, in respect of income
distribution made on or after 1 April, 2003, would be exempt from income tax in the
hands of the Unit holders under Section 10 (35) of the Act.
Tax Deducted at Source
In view of the exemption of income tax in the hands of Unit holders, no
income tax is deductible at source, on income distribution by the Fund, under the
provisions of Section 194K and 196A of the Act.
Capital Gains Tax
Under Section 10 (38) of the Act, capital gain arising on transfer of a long-
term capital asset held for a period of more than twelve months, inter alias, being a
unit of an equity oriented fund would be exempt from income tax, if sale of such unit
is made on or after 1 October, 2004, and such transaction has been chargeable to
securities transaction tax under Chapter VII of the Finance Act. Currently securities
transaction tax is being levied at 0.15% on the sale of the mutual fund.
22
CHAPTER-2
REVIEW OF LITERATURE
There is conventional viewpoint that mutual funds investment performance is
consistent with the original version of the so called efficient market theory. The latter
simply means that securities prices already include all information, implying that
returns across active and passive portfolios are equal before subtracting trading and
investment expenses. Hence the expenditure on research and analysis is wasted. This
viewpoint is the outcome of early academic studies of Sharpe (1966), Jensen (1968),
and Treynor (1966), which found that mutual funds do not systematically outperform
benchmark portfolios. Taken as whole, the results of the studies are consistent with
the conventional viewpoint that funds fees and expenses are wasted.
Sharpe (1966) developed a simple theoretical meaningful performance
evaluation measure for mutual funds that considers both average return and risk. This
measure is called reward to variability ratio. The study used annual rates of return for
34 opened mutual funds and Standard deviation of annual return was used as
surrogate for risk during the period 1944-63 and evaluated their performance by this
newly coined reward to variability ratio. Only 11 funds out of 34 funds performed
superior to Dow Jones portfolio. The reward to variability ratio computed for each
fund was significantly less than the same measure applied to Dow Jones portfolio
over the period 1954-63. The average reward to variability ratio of 34 funds was
considerably smaller than Dow Jones portfolio, and considered enough to conclude
that average mutual funds performance was distinctly inferior to an investment in
Dow Jones portfolio. It further concluded that good performance was associated with
law expense ratio.
Sarkar (1991) critically examined mutual fund performance evaluation methodology
and pointed out that Sharpe (1996) and Treynor (1968) performance measures rank
mutual funds similarly on performance in spite of their differences in methodology.
Obaidullah & Sridhar (1991) 31 evaluated the performance of two major growth
oriented mutual funds-Mastershare and Can share from India and concluded that these
23
funds provided abnormal returns. Mastershare did it on a total-risk adjusted basis and
Can share on a market risk-adjusted basis. The study provided contradictory evidence
to the near-strong efficient market hypothesis for these funds.
Singh & Shukla (1994) empirically examined the performance of 12 growth oriented
mutual funds over the period, 1992-1996. Using risk adjusted performance measures
of Sharpe, Treynor and Jensen, the study demonstrated that mutual funds have not
performed better than their benchmark. Only (4 out of 12) 33 percent mutual funds
had positive Sharpe index and average share index was -0.142, which was lower than
market index. In relation to another measure; Treynor index, only 2 out of 12 fund
have positive value and average index was -0.0327 also was lower than market index.
The average Jensen alpha was 0.002 which indicated that funds earned about 0.2
percent less per month than they might had earned given their level of systematic risk.
In the sample under study UGS 500 and Master plus 91 funds were found to highly
diversified and performed better than benchmark index.
Kale & Uma (1995) examined risk return relationship for 77 mutual fund schemes
managed by eight mutual funds and found that schemes proved worth their objectives
Yadav & Mishra (1996) empirically evaluated performance of 14 mutual funds over
the period 1992-1995. The study indicated that the funds as a whole performed well in
terms of non-risk adjusted measure of average return and in terms of risk adjusted
performance. Mutual funds in aggregate had a higher Sharpe index, but a lower
Treynor index and negative average alpha. The study reported that mutual funds had
done well in terms of diversification and total variability of returns, and indicated that
the funds managers of growth schemes adopted a conservative investment policy and
maintained a low portfolio beta and therefore were successful in limiting losses in a
rapidly falling stock market.
Gupta & Sehgal (1998) studied investment performance of 80 mutual fund schemes
from the Indian market over a four year period 1992-96. It tested propositions relating
to fund diversification, consistency of performance, parameter of performance and
objective stationary in additions to examining risk-return relationship in general. The
study reported that mutual fund industry has performed reasonably well for the Indian
market. It found lack of adequate portfolio diversification. The study produced
24
evidence to support consistency of performance and its not-stationary overtime was
noted in relation to risk-return parameters. Finally, a significant and positive risk-
return relationship was documented by the study when standard deviation was used as
a risk measure.
Chander (2002) empirically examined the performance of 34 mutual funds in terms
of performance evaluation models developed by Sharpe. Treynor and Jensen. The
study made a comprehensive decomposition of portfolio performance to attitude it to
various activities of fund managers such as stock selectivity, market timing, risk
bearing and diversification. The study reported that a majority (64.71 percent) of
sample fund schemes had outperformed the benchmark in terms of Sharpe measure,
while remaining 35.29 percent had experienced performance below market portfolio.
In contrast a significant majority (76.47 percent) of sample fund schemes had
demonstrated inferior performance in terms of Treynor’ measure.
Gupta (2002) conducted a comprehensive study of 73 mutual funds evaluate
investment performance and timing abilities of fund managers in India. The study
reported 54.8 percent of sample outperformed the benchmark in terms of Sharpe’s
measure and 37 percent of sample schemes outperformed the benchmark portfolio in
terms of Treynor’ measure.
Ajay Khorana (2004) found that mutual fund investors generally desire high risk-
adjusted performance at low cost, which is not necessarily the objective of fund
families. Fund families generally want to maximize assets under management (i.e.,
their market share) and the resulting management fees. This paper examines how
these conflicting objectives affect competition and investor behavior in the mutual
fund industry for the universe of U.S. mutual fund families over the period 1979-
1998. Over this period, industry assets increased by a factor of twenty, the number of
active fund families tripled, and the average market share of a family declined by two
thirds. We find that price competition is important in the industry. Families that
charge lower fees than the competition gain market share, but only if these fees are
above average to begin with. Low-cost families do not lose market share by charging
higher fees. In addition, fees charged explicitly for marketing and distribution (12b-1
fees) have a positive impact on market share. We find no evidence that investors
25
derive any benefit from 12b-1 fees. Product differentiation strategies are also effective
in obtaining market share. Families that perform better, and start more funds relative
to the competition (a measure of innovation) have a higher market share. Innovation is
rewarded more if the new fund is more differentiated from existing offerings and is in
a less crowded objective. Finally, market share within an investment objective is
driven primarily by a family's policies within that objective, but there are important
performance spillover effects from other funds in the family. Our findings are robust
to various tests for endogenously of the explanatory variables. Overall, this paper
highlights a number of conflicts between fund families and investors.
Julien Hugonnier (2006) analyzed the implications of dynamic flows on a mutual
fund's portfolio decisions. In our model, myopic investors dynamically allocate capital
between a riskless asset and an actively managed fund which charges fraction-of-fund
fees. The presence of dynamic flows induces "flow hedging" portfolio distortions on
the part of the fund, even though investors are myopic. Our model predicts a positive
relationship between a fund's proportional fee rate and its volatility. This is a
consequence of higher-fee funds holding more extreme equity positions. Although
both the fund portfolio and investors' trading strategies depend on the proportional fee
rate, the equilibrium value functions do not. Finally, we show that our results hold
even if investors are allowed to directly trade some of the risky securities
S.M.Z. Khurshid (2009) examined the structure of the mutual fund industry in India
and to analyze the state of competition among all the mutual funds along with
between sector competition and within sector competition. The mutual fund industry
in India is relatively adolescent compared to that of developed countries. Initially the
industry was a state monopoly of Unit Trust of India. Later on, a few public sector
institutions were allowed to operate. After 1993, when the industry was opened for
the private sector, only then a real environment was created for the competition in the
industry. In this study, the Normalized Herfindal-Hirshman Index of concentration
was used to estimate the levels of competition among the mutual funds. The levels of
competition and their trends have been obtained for the period March, 2003 to March,
2009. This study found overall mutual fund industry, different sectors of the mutual
funds and funds within Private Joint Venture Indian Dominated highly competitive;
26
funds within Private Joint Venture Foreign Dominated were found most of the times
moderately competitive and funds within Bank-Institution, Private Sector Indian and
Private Sector Foreign were found concentrated. A lack of trend of competition was
observed in the overall industry and within Private Joint Venture Foreign Dominated
in India. A decreasing trend of competition was observed among different sectors and
within Private Sector Indian; and an increasing trend was found within Bank-
Institution, Private Sector Foreign and Private Joint Venture Indian Dominated during
the period.
Nicolas P. B. Bollen (2005) estimated parameters of standard stock selection and
market timing models using daily mutual fund returns and quarterly measurement
periods. We then rank funds quarterly by abnormal return and measure the
performance of each decile the following quarter. The average abnormal return of the
top decile in the post-ranking quarter is 39 basis points. The post-ranking abnormal
return disappears when funds are evaluated over longer periods. These results suggest
that superior performance is a short-lived phenomenon that is observable only when
funds are evaluated several times a year.
27
References
1. Bauman Mark P (1996), “ A Review of Fundamental analysis research in
accounting”, Journal of accounting literature, (www.findarticles.com).
2. Berg Jim (1999), “ Fundamental Analysis using internet”, Past edition of ASX
investor update e-mail newsletter,(www.asx.com.au)
3. Whisenant Scott ,Fairfield Patricia M. (2001), “Using Fundamental Analysis
to Assess Earnings Quality: Evidence from the Center for Financial Research
and Analysis”, Journal of Accounting Auditing & Finance, Vol. 16, No. 4, pp.
273-295, Fall 2001
4. Vanston B. Finnie G and Tan C. (2004), “Enhancing security selection in the
Australian stock market using fundamental analysis and neutral networks”
5. Ramudu P Janaki, Rao S Durga (November 2006), “ A Fundamental
Analysis of Indian Banking Industry” The Icfai Journal of Bank Management,
Vol. 5, No. 4, pp. 68-79, November 2006
6. Harris Trevor S.(2006), “From Stock Selection to Portfolio Alpha Generation:
The Role of Fundamental Analysis”, Journal of Applied Corporate Finance,
Vol. 18, No. 1, pp. 54-81, Winter 2006
7. Ramudu P Janaki and Rao S Durga (November 2006), “A Fundamental
Analysis of Indian Banking Industry ”, The Icfai Journal of Bank
Management, Vol. 5, No. 4, pp. 68-79, November 2006
28
8. Pal Ved, Malik N.S. (August 2007), “A Multivariate Analysis of the Financial
Characteristics of Commercial Banks in India”, Icfai Journal of Bank
Management, Vol. 6, No. 3, pp. 29-42 (August 2007)
9. Toby Adolphus J. (August 2007), “Camel Analysis, Prudential Regulation
and Banking System Soundness in Nigeria ”, The Icfai Journal of Bank
Management, Vol. 6, No. 3, pp. 43-60, August 2007
10. Gourav Vallabh , Anoop Bhatia and Saurabh Mishra (August 2007), “Non-
Performing Assets of Indian Public, Private and Foreign Sector Banks: An
Empirical Assessment ”, Icfai Journal of Bank Management, Vol. 6, No. 3, pp.
7-28, August 2007
11. Dzeawuni Sr. Wirnkar Alphonsius , Dr. Muhammad Tanko (June 2008),
“CAMELs and Banks Performance Evaluation: The Way Forward ”(June
2008).
12. Maureen G. Butler , Carolyn M. Callahan and Rod Smith (September 2008),
“Fundamental Analysis of Firm Performance Following Strategic Alliance
Announcements ” (September 2008)
13. Bettman Jenni L., Sault Stephen and Welch Emma (March 2009),
“Fundamental and Technical Analysis: Substitutes or Compliments?”,
Accounting & Finance, Vol. 49, No. 1, pp. 21-36, March 2009.
14. Lynch John, “Share Market Analysis-Fundamental Analysis vs. Technical
Analysis”, SHAW Stock broking Ltd.”, by ASX investor update e-mail
newsletter, (www.eninarticle.com).
29
CHAPTER-3
RESEARCH METHODOLOGY
This chapter highlights the why, when, where, how and on whom the study has been
conducted as well as the limitations of the study. In this chapter, the methodology
followed in conducting the research has been described. Details regarding objectives
of the study, the research design, data collection, limitations of the study, area of the
study and statistical tools used have also been discussed.
3.1 Company Profile
SBI Mutual Fund is India's largest bank sponsored mutual fund with an
investor base of over 3 million. SBI Mutual Fund is a joint venture between the State
Bank of India, India's largest banking enterprise and Society General Asset
Management of France, one of the world's leading fund management companies.
Since its inception SBI Mutual Fund has launched thirty-two schemes and
successfully redeemed fifteen of them. SBI Mutual Fund schemes have consistently
outperformed benchmark indices. SBI Mutual is the first bank-sponsored fund to
launch an offshore fund - Resurgent India Opportunities Fund.
Presently, SBI Mutual Fund manages over Rs. 17000 crores of assets. The
fund has a network of 100 collection branches, 26 investor service centres, 28 investor
service desks and 40 district organizers.
3.2 Objectives:
 To Study the performance of selected MF of SBI.
 To find out the Top 10 holdings, Market value, Net asset value of selected
schemes of SBI mutual fund.
 To make the Ratio Analysis of SBI mutual fund.
 To suggest the means through which SBI Funds can increase its competitive
strength.
30
3.3 Scope of the study
The study attempts to provide an insight into the performance of various
activities by SBI Mutual Fund. This helps to analyze whether the firm is able to meet
its current obligation, factors that affect the distributors and investors in deciding
about the investment. It also encompasses the financial analysis of SBI mutual fund
with regarding some of its schemes .
3.3(i) Selected schemes
The schemes which we have selected for doing the analysis are following:-
 SBI Magnum Balanced Fund (MBF)
 SBI Magnum Equity Fund(MEF)
 SBI Magnum Global Fund (MGF)
 SBI Magnum Children Benefit Plan(MCBP)
 SBI Magnum Taxgain Schemes(MTS)
3.3 (ii) Time Period
The time period for which the data have been collected is from 2005 to 2009.
3.3(iii) Selected Parameters
The data collected for this time period of all the schemes is about its:-
 NAV
 Portfolio Turnover Ratio
 Market Value
 Launch date, entry &exit load, initial investment
 Top 10 holdings in various industries
 Performance returns
 Current Ratio, Quick Ratio and Propriety Ratio.
3.4 Sources of data collection
According to the needed research of the project; the researcher pursued
secondary data collection method .The extensive literature used in the project has
been collected from various sources. The main information is from internet, Some
31
journals, newspapers are also used. Researcher has used Web sites related to SBI
mutual fund& information broacher for secondary data collection .
3.5 Technique of Analysis
Various statistical tool have been applied to analysis the collected data.Viz..,
graphs and charts.
3.6 Limitations of the Study
 The ratios calculated at a period are likely to vary from time to time and hence
they are liable to temporary changes.
 There can be many interpretations and explanation to the data collected. This is
empirical study and the research provides the explanation as understood by the
researcher only.
3.7 Organization of the study
CHAPTER 1 deals with the introduction of Mutual Fund ,meaning, overview,
advantage & disadvantage, risk, NAV, Factor affecting NAV, Tax Benefits,
Classification of Mutual Fund, Banks & Mutual fund ,Structure of Mutual Fund.
CHAPTER 2 highlights the review of literature.
CHAPTER 3 covers Company profile, Objective of the Study, Scope of the Study,
Sources of data collection, and Limitation of the study.
CHAPTER4 deals with the analysis and interpretation of the study.
CHAPTER 5 explains and conclusion of the study.
32
CHAPTER-4
ANALYSIS AND INTERPRETATION OF DATA
The chapter contains the analysis & interpretation of the data taken from different
schemes of SBI mutual fund. These schemes are SBI Magnum Balanced Fund, SBI
Magnum Equity Fund, SBI Magnum Global Fund, SBI Magnum Children Benefit
Plan, SBI Magnum Tax gain Schemes. The Researcher Have Taken Various data of
these schemes for analysis their financial performance.
Table 4.1 SBI Magnum Balanced Fund
Performance (%) Returns Above 1 year are Annualized
1w 1m 3m 6m 1y 3y 5y
Scheme Returns 1.3 3.2 1.6 7.9 59 13.5 21.3
Category Average 1 2.8 2 8.9 55.7 12 17.2
Category Best 3.3 5.4 9.3 24.1 106 19.4 25.3
Category Worst [0.1] [0.1] [3.0] 1.4 3.5 0.5 9.1
Sources: SBI mutual fund annual report (2006-2010)
The figures in parenthesis shows the negative value
Fig 4.1
33
Interpretation
Table 4.1 depicts the performance return of the SBI Magnum Balanced fund. It has
given significant return in past years. The fund has given above average return in last
one week, one month and three month. In last six month it has given below average
return as compared to other mutual funds of same category. However, it has given
above average return in last one year, three year and five year. This figures shows that
investor has been benefited with above average return.
Table 4.2 SBI Magnum Equity Fund
Performance(%) * returns above 1 yr. are annualized
1w 1m 3m 6m 1y 3y 5y
Scheme Returns 1.6 4.4 2.9 9.8 82.9 15.6 26.9
Category Avg 0.5 2.6 0.8 10 82.2 13.2 21.5
Category Best 4.1 6.6 9.1 57.2 148 29.6 29.6
Category Worst [68.0] [64.8] [66.0] [61.6] [26.8] [6.8] 8
Sources: SBI mutual fund annual report (2006-2010)
The figures in parenthesis shows the negative value
Fig 4.2
34
Interpretation
SBI Magnum Equity Fund has also given significant return to its investor over the
period. It has given above average return during the last one week, one month, three
month. However, it has given slightly below average return in last six month and
slightly above average return in last one year. It has given above average return in last
3 years and last 5 years.
Table 4.3 SBI Magnum Taxgain Fund
Performance(%) * returns above 1 yr. are annualized
1w 1m 3m 6m 1y 3y 5y
Scheme Returns 1.2 2.1 [0.7] 8.6 74.3 NA NA
Category Avg 1 3.5 2 10.7 80.9 12.2 18.9
Category Best 2.3 6 10.1 21.5 112 27.2 25.6
Category Worst 0.2 1.1 [4.4] 1.8 53.2 2.7 11.2
Sources: SBI mutual fund annual report (2006-2010)
The figures in parenthesis shows the negative value
Fig 4.3
35
Interpretation
SBI Magnum Taxgain fund , the fund in which investor invest to save tax and earn .
The fund has given slightly above average return in last one week and has given
below average . return in last one month, three month, six month and one year.
Table 4.4 SBI Magnum Global Fund
Performance(%) * returns above 1 yr. are annualized
1w 1m 3m 6m 1y 3y 5y
Scheme Returns 2.2 4.3 2.3 19 123 8.4 23.9
Category Avg 0.5 2.6 0.8 10 82.2 13.2 21.5
Category Best 4.1 6.6 9.1 57.2 148 29.6 29.6
Category Worst [68.0] [64.8] [66.0] [61.6] [26.8] [6.8] 8
Sources: SBI mutual fund annual report (2006-2010)
The figures in parenthesis shows the negative value
Fig 4.4
36
Interpretation
SBI Magnum global fund has given significant return over the period. It has given
above average return in last one week, one month, three month, six month, one year
and five year. However, it has given below average return in last three year and five
years.
Table 4.5 SBI Magnum Children Benefit Plan
Performance (%) * returns above 1 yr. are annualized
1w 1m 3m 6m 1y 3y 5y
Scheme Returns 0.8 1.5 1.1 5.2 15.8 7.6 8.6
Category Avg 15.3 10.9 [2.3] [4.6] [6.1] 1 7
Category Best 71.6 37.4 14.4 23.4 17.2 9.3 14.5
Category Worst [45.3] [18.8] [36.3] [70.3] [53.1] [22.3] [12.0]
Sources: SBI mutual fund annual report (2006-2010)
The figures in parenthesis shows the negative value
Fig 4.5
37
Interpretation
SBI Magnum Children benefit plan is unique plan for benefit of children. It has given
below average return in last one week, one month. However, it has given above
average return in last three month, six month, one year, three year and five year.
Table 4.6 Top 10 Holdings of SBI Magnum Balanced Fund
Company Percentage
Bharat Electronic 1.86
Cipla 1.92
ITC Ltd. 2.39
SBI 2.6
Bharti Airtel 2.81
Infosys Techno. 2.9
Bharat Heavy Electronics 3.37
ICICI Bank 3.62
Rural Electronic 4
Reliance Inds. 4.06
Sources: SBI mutual fund annual report (2006-2010)
Fig 4.6
38
Interpretation
Table 4.6 shows the top 10 holdings of SBI Magnum Balanced Fund . It has invested
in diversify sectors, mainly in blue chip companies. It has invested 4.06% in Reliance
Industries , 4% in Rural Electrification , 3.62% in ICICI bank, 3.37% in BHEL, 2.9%
Infosys Technologies, 2.81 % in Bharti Airtel, 2.6% in SBI, 2.39% in ITC, 1.92% in
Cipla, 1.86% in Bharat Electronics.
Table 4.7 Top 10 Holdings of SBI Magnum Equity Fund
Companies Percentage
ICICI Bank 5.11
Reliance Inds. 4.74
Infosys Techno. 4.64
Hero Honda Motor 4.47
Bharat Heavy Electronics 4.2
Asian Paints Ltd. 4.15
ITC Ltd. 4.14
L & T 3.59
SBI 3.27
Bajaj Holdings & Inv 3.17
Sources: SBI mutual fund annual report (2006-2010)
Fig 4.7
39
Interpretation
Table 4.7 shows the top 10 holdings of SBI Magnum equity Fund. It has invested in
diversify sectors, mainly in blue chip companies. It has invested 4.74% in Reliance
Industries , 4.74% in Hero Honda motor, 5.11% in ICICI bank, 4.15% in Asian paints
ltd., 4.64% Infosys Technologies, 4.14 % in ITC ltd., 3.27% in SBI, 3.59% in L&T,
3.17% in Bajaj holdings, 4.2% in Bharat Heavy Electronics.
Table 4.8 Top 10 Holdings of SBI Magnum Taxgain Fund
Companies Percentage
Reliance Inds. 4.06
Rural Electronic 4
ICICI Bank 3.62
Bharat Heavy Electronics 3.37
Infosys Techno. 2.9
Bharti Airtel 2.81
SBI 2.6
ITC Ltd. 2.39
Cipla 1.92
Bharat Electronic 1.86
Sources: SBI mutual fund annual report (2006-2010)
.
Fig4.8
40
Interpretation
Table 4.8 shows the top 10 holdings of SBI magnum Taxgain schemes. It has invested
4.06% in Reliance industries ,4% in Rural Electrific,3.62% in ICICI Bank,3.37% in
Bharat Heavy Ele,2.9% in Infosys Techno,2.81% in Bharti Airtel,2.6% in SBI,2.39 %
in ITC Ltd.,1.92% in Cipla,1.86% in Bharat Electronic
Table 4.9 Top 10 Holdings of SBI Magnum Global Fund
Companies Percentage
Remington (India) Lt 5.18
Bosch Ltd. 4.5
Asian Paints Ltd. 4.3
Bajaj Holdings & Inv 4.18
Texmaco 4.13
Glaxo Smith Kline Consu 3.95
BEML Ltd. 3.66
Divi & apos. Lab 3.58
UTV Software Common. 3.29
Oracle Financial Ser 3.19
Sources: SBI mutual fund annual report (2006-2010)
41
Fig
4.9
Interpretation
Table 4.9 depicts the top 10 holdings of SBI magnum global fund. It has invested
5.18% in Remington Ltd., 4.5% in Bosch Ltd., 4.3% in Asian paints Ltd., 4.18% in
Bajaj holdings ,4.13% in Texmacco, 3.95% in GlaxoSmithKline co.,3.66% in BEML
Ltd.,3.58 % in Divi & aposis lab, 3.29 % in UTV software & 3.19% in Oracle
financial ser.
42
Table 4.10Top 10 Holdings of SBI Magnum Children Benefit Plan
companies Percentage
Canara Bank 13.85
IDBI Bank Ltd. 13.84
Rural Electronic 9.74
Tata Sons 4.86
Network 18 Media & I 2.35
Bharti Airtel 1.88
Royal Orchid Hotels 1.81
ITC Ltd. 1.62
Tata Chemicals 1.34
Page Industries Ltd. 1.32
Sources: SBI mutual fund annual report (2006-2010)
Fig4.10
Interpretation
Table 4.10 depicts the top 10 holdings of SBI magnum children benefit plan. It has
invested in 13.85% in Canara bank,13.84 % in IDBI bank ,9.74 % in Rural
electric,4.86 %in Tata sons,2.35 % in Network 18 media,1.88% in Bharti airtel,1.81
% in Royal orchid hotels,1.62 % in ITC ltd,1.34% in Tata chemical,1.32 % I Page
industries ltd.
43
Table 4.11 Current Ratio, Liquidity Ratio and Prosperity Ratio
Year/ratios Current Liquidity prosperity
2005-06 3.07 1.13 0.8
2006-07 2.32 1.04 0.74
2007-08 2.02 0.79 0.74
2008-09 2.38 1.9 0.73
2009-10 3.38 3.2 0.8
Sources: SBI mutual fund annual report (2005-2010)
Fig4.11
Interpretation
Table 4.11 depicts the current ratio, liquidity ratio& prosperity ratio of the year 2006-
2010.In the segment of the current ratio it shows 3.07 in 2005-06 .After that it has
decreasing trend till 2007-08 i.e. 2.02. But after that it starts increasing and in 2009-10
it was 3.38 which were very good sign of the SBIMF. And in liquidity ratio it was1.13
in 2005-06 .After that it has decreasing trend till 2007-08 i.e. 0.79. But after that it
starts increasing and in 2009-10 it was 3.2.In the segment of prosperity ratio it was 0.8
in 2005-06 & in2009-10. In the interval of that period it decreased till 2008-09 but
after that it increased.
44
Table 4.12 Market Value
Years/schemes
M. balanced
fund
M. children
plan
M. equity
fund
M. global
fund
M. taxgain
scheme
2005-06 9529.41 1245.94 14374.19 13344.78 8034.43
2006-07 26750.52 1580.10 25862.10 66876.97 89327.68
2007-08 27114.93 1893.79 28276.74 136168.89 166391.47
2008-09 37105.59 2018.44 32746.70 143389.80 315481.63
2009-10 47870.74 2128.69 39422.99 123774.64 494927.94
Sources: SBI mutual fund annual report (2005-2010)
Fig4.12
Interpretation
Table 4.12 shows the market value of these schemes. In the case of M. balanced fund
in 2005-06 it was 9529.41 cr. After that it has increasing trend till 2009-10 i.e.
47870.74 cr. in the case of M. children plan it was 1245.94 cr. In 2005-06 & then its
market value goes on increase till 2009-10 . In 2009-10 it was 2128.69 cr. In 2005 -06
the market value of M. equity fund was14374.19 cr. &M. taxgain schemes 8034.43cr.
After that it has increasing trend till 2009-10 i.e. 39422.94 cr. M. equity fund &
494927.94 cr. of M. taxgain schemes. The market value of M. global fund 13344.78
cr. in 2005-06 .after that it was increased till 2008-09 i.e. 143389.80.but still after it
decreased to 123774.64 cr.
45
Table 4.13 NAV
Years/schemes
M. balanced
fund
M. children
plan M. equity fund
M. global
fund
M. taxgain
scheme
2005-06 18.66 13.9 14.91 17.35 38.57
2006-07 31.44 15.97 27.84 35.26 46.07
2007-08 33.84 16.82 26.61 41.21 42.42
2008-09 40.67 18.18 33.05 45.25 51.07
2009-10 28.73 17.83 20.49 21.06 30.91
Sources: SBI mutual fund annual report (2005-2010)
Fig 4.13
Interpretation
Table 4.13 shows the NAV of these schemes. In 2005-06 it was 18.66 of M. balanced
fund,13.90 of M. children benefit plan &17.35of M. global fund. After that all the
three schemes adopted the increasing trend till 2003-09 i.e. 40.67,18.18, 45.25 of the
1st ,2nd & 4th schemes. And in 2009-10 it decreased upto 28.73,17.83 & 21.06 of the
respected schemes. And in the case of M. equity fund & M. taxgain schemes it was
14.91& 38.57.After that it increased in the next year and it was 27.84 &46.07.And in
2009-10 it was 20.49 of M. equity fund & 30.91 of M. taxgain schemes.
46
Table 4.14 Portfolio Turnover Ratio
Sources: SBI mutual fund annual report (2005-2010)
Fig 4.14
Interpretation
table 4.14 shows the portfolio turnover ratio. of these schemes. The ratio of M.
children benefit plan is not available. M. balanced fund gives tremendous
performance in 2005-06 i.e. 0.53 % & 1.29 % in 2009-10.In the mid part it first
decrease till 2007-08 &in 2008-09 it start increased .The ratio of the m. equity fund
0.44 in 2005-06 and after that it decreased till 2007-08 i.e. 0.11.from that time it
increased upto 2009-10 and reaches to 1.12%.the ratio of M. global fund is 0.18 % in
2005-06 and 0.23 of M. taxgain schemes. It increased in 2009-10 of global fund i.e.
1.21 and decreased of taxgain schemes i.e. 0.3.
Years/schemes
M. balanced
fund
M. children
plan
M. equity
fund
M. global
fund
M. taxgain
scheme
2005-06 0.53 n.a 0.44 0.18 0.23
2006-07 0.24 n.a 0.12 0.13 0.06
2007-08 0.2 n.a 0.11 0.05 0.13
2008-09 0.42 n.a 0.35 0.3 0.26
2009-10 1.29 n.a 1.12 1.21 0.3
47
CHAPTER-5
FINDINGS & RECOMMENDATIONS
Findings:-
 Performance return of the SBI Magnum has given significant return in past years.
The fund has given above average return in last one week, one month and three
month. In last six month it has given below average return as compared to other
mutual funds of same category.
 Significant return has been observed its investor over the period. It has given
above average return during the last one week, one month, three month.
 SBI to save tax and earn. The Magnum Taxgain fund, the fund in which investor
invest have given slightly above average return in last one week and has given
below average return in last one month, three month, six month and one year.
 The performance return of the SBI Magnum global fund has given significant
return over the period. It has given above average return in last one week, one
month, three month, six month, one year and five year.
 It has given significant return in past years. The fund has given above average
return in last one week, one month and three month SBI Magnum Equity Fund has
also given significant return to its investor over the period. It has given above
average return during the last one week, one month, three month SBI Magnum
Taxgain fund , the fund in which investor invest to save tax and earn .
 SBI Magnum global fund has given significant return over the period. It has given
above average return in last one week, one month, three month, six month, one
year and five year SBI Magnum Children benefit plan is unique plan for benefit of
children. It has given below average return in last one week, one month. SBI
Magnum Balanced Fund.
 SBI Magnum Balanced Fund has invested in diversify sectors, mainly in blue chip
companies. It has invested 4.06% in Reliance Industries , 4% in Rural
Electrification , 3.62% in ICICI bank, 3.37% in BHEL, 2.9% Infosys
Technologies, 2.81 % in Bharti Airtel, 2.6% in SBI, 2.39% in ITC, 1.92% in
Cipla, 1.86% in Bharat Electronics.
48
 The current ratio, liquidity ratio& prosperity ratio of the year 2006-2010 the
current ratio it shows 3.07 in 2005-06 .After that it has decreasing trend till 2007-
08 i.e. 2.02.
 The market value of these schemes in 2005-06 was 9529.41 cr. After that it has
increasing trend till 2009-10 i.e. 47870.74 cr. in the case of M. children plan it
was 1245.94 cr. In 2005-06 & then its market value goes on increase till 2009-10 .
it was 2128.69 cr.
 The NAV of these schemes in 2005-06 was 18.66 of M. balanced fund, 13.90 of
M. children benefit plan &17.35of M. global fund. After that all the three schemes
adopted the increasing trend till 2005-08 i.e. 40.67, 18.18, 45.25 of the 1st, 2nd &
4th schemes. And in 2009-10 it decreased upto 28.73, 17.83 & 21.06 of the
respected schemes.
 The net assets of balanced fund is 493.99,children plan’s 21.53,equity fund’s
392.46,global fund’s 1219.26 & the taxgain schemes’s 5297.38.Dividend is the 50
% of the balanced, equity, global fund.40% of the taxgain schemes % children
benefit plan’s not available.
5.2 Recommendations:-
 Keep up the brand image in the minds of the people through better performance
both in the case of return as well as after sale service.
 Steps should be taken to encourage the weaken areas of the SBI.
 Special programs should be initiated to impart the awareness among the public.
 Give more financial information to the investors so that they can take decision of
their investment.
 Improve the quality of agents in their job through training and give them better
incentive.
 Make service available at every branch of SBI for better and easy accessibility.
 Increase the speed of grievance redressed facilities make it accessible to the
investors.
 Improve the performance of various schemes by employing better technique of
investment analysis so as to generate attractive return, irrespective of the state of
the market condition whether it is raising ,falling or static.
 Investors Ask one’s agent to give details of different schemes and match the
appropriate ones.
49
 Investors should always keep an eye on the performance of the scheme and other
good schemes as well which are available in the market for the closed comparison.
 Investors should not invest blindly in the investments before going through the
fact sheets, annual reports etc. of the company since ,according to the guidelines
of the SEBI, the AMCs are bound to disclose all the relevant data that is necessary
for the investment purpose by the investor.
 Companies should Set up separate customer care divisions where the customers
can any time pose their query, regarding the scheme or the current NAV etc.
These customer care units can work out in accordance with the requirements of
the customer and facilitate him to choose the scheme that suits his financial
requirements.
 Companies should Conduct seminars or programs on about mutual funds where
each and every minute information about the product is outlined including the risk
factor associated with the different classes of assets.
 Companies should Choose appropriate media ,newspaper/magazines, T.V.
commercials, etc. for marketing the product and educate the masses.
50
BIBLIOGRAPHY
BOOKS:
 Kothari C.R., Research Methodology, Vishwas Parkashan, New Delhi, 1990.
 Tripathy, Nalini Prava, “Mutual fund in India:
Emerging issues,” Excel books, New Delhi, 2007.
ARTICLES
1. Morey, M. (2005), “ Morningstar Mutual Fund Star Rating”, A survey available
at SSRN: http :/ssrn.com/ abstract, accessed on April 8, 2010.
2. Mamaysky, Harry, Mathew Spiegel, and Hong Zhang (2006), “improved
forecasting of Mutual Fund Alphas and Betas”, A survey available at SSRN:
http :/ssrn.com/abstract, accessed on April 10, 2010.
3. Narayanan, M.P., Nanda, Vikram K. and Warther, Vincent A. (1997),
“Liquidity, Investment Ability, and Mutual Fund Structure”, A survey available
at SSRN :http :/ssrn.com/abstract, accessed on April 13, 2010.
4. Verma, Meenu (2004), “Investing in Mutual Funds when Returns are
Predictable”, A survey available at SSRN : http :/ssrn.com/abstract, accessed on
April on 15, 2010.
5. Ding, B and R. Wermers (2005), “The investment value of Mutual Fund
Portfolio Disclosure”, A Survey available at SSRN :http :/ssrn.com/abstract,
accessed on April on 18,2010.
JOURNALS
 Capital Market
 Finance India
 Business Today
WEBSITES
 www.moneycontrol.com
 www.sbimf.com
 http://www.wellsfargoadvantagefunds.com/wfweb/wf/splash/ittr.jsp
 http://www.mfea.com/NewsCommentary/Commentary/Fidelity10.25.07.asp
 www.moneycontrol.com
 www.investments.com.ph

More Related Content

Similar to abi mutul fundcprint.doc

Mutual funds types-presentation-hareesh
Mutual funds types-presentation-hareeshMutual funds types-presentation-hareesh
Mutual funds types-presentation-hareeshHareesh M
 
Mutual Funds Overview
Mutual Funds OverviewMutual Funds Overview
Mutual Funds OverviewKushagr Jain
 
Mutual funds & micro finance
Mutual funds & micro financeMutual funds & micro finance
Mutual funds & micro financeDr. Rajkumar
 
Mutual funds & ULIP - Sarthak Dhingra
Mutual funds & ULIP - Sarthak DhingraMutual funds & ULIP - Sarthak Dhingra
Mutual funds & ULIP - Sarthak DhingraSarthak Dhingra
 
comparative study on mutual fund
comparative study on mutual fundcomparative study on mutual fund
comparative study on mutual fundnitesh tandon
 
Mutual funds report
Mutual funds reportMutual funds report
Mutual funds reportAqsa Awan
 
Internship project
Internship project  Internship project
Internship project SUHEL SHEIKH
 
Fmrs mutual fund market in south africa
Fmrs   mutual fund market in south africaFmrs   mutual fund market in south africa
Fmrs mutual fund market in south africaSupragya02
 
Mutual fund. doc
Mutual fund. docMutual fund. doc
Mutual fund. docRaj Gupta
 
Mutual Funds, Mutual Fund Basics, Types of Mutual Funds, Mutual Fund Investm...
Mutual Funds, Mutual Fund Basics, Types of Mutual Funds,  Mutual Fund Investm...Mutual Funds, Mutual Fund Basics, Types of Mutual Funds,  Mutual Fund Investm...
Mutual Funds, Mutual Fund Basics, Types of Mutual Funds, Mutual Fund Investm...SaraCooper161
 

Similar to abi mutul fundcprint.doc (20)

Mutual funds
Mutual fundsMutual funds
Mutual funds
 
Mutual funds types-presentation-hareesh
Mutual funds types-presentation-hareeshMutual funds types-presentation-hareesh
Mutual funds types-presentation-hareesh
 
Mutual Funds Overview
Mutual Funds OverviewMutual Funds Overview
Mutual Funds Overview
 
Pranav kapse sip
Pranav kapse sipPranav kapse sip
Pranav kapse sip
 
Pranav kapse sip
Pranav kapse sipPranav kapse sip
Pranav kapse sip
 
Report
ReportReport
Report
 
Mutual funds & micro finance
Mutual funds & micro financeMutual funds & micro finance
Mutual funds & micro finance
 
Mutual funds & ULIP - Sarthak Dhingra
Mutual funds & ULIP - Sarthak DhingraMutual funds & ULIP - Sarthak Dhingra
Mutual funds & ULIP - Sarthak Dhingra
 
Mutual fund
Mutual fundMutual fund
Mutual fund
 
comparative study on mutual fund
comparative study on mutual fundcomparative study on mutual fund
comparative study on mutual fund
 
Concept of mutual fund
Concept of mutual fundConcept of mutual fund
Concept of mutual fund
 
Mutual funds report
Mutual funds reportMutual funds report
Mutual funds report
 
MUTUAL FUND
MUTUAL FUNDMUTUAL FUND
MUTUAL FUND
 
Internship project
Internship project  Internship project
Internship project
 
Mutual Funds
Mutual FundsMutual Funds
Mutual Funds
 
Fmrs mutual fund market in south africa
Fmrs   mutual fund market in south africaFmrs   mutual fund market in south africa
Fmrs mutual fund market in south africa
 
Mutual funds
Mutual fundsMutual funds
Mutual funds
 
Mutual fund. doc
Mutual fund. docMutual fund. doc
Mutual fund. doc
 
Mutual Funds, Mutual Fund Basics, Types of Mutual Funds, Mutual Fund Investm...
Mutual Funds, Mutual Fund Basics, Types of Mutual Funds,  Mutual Fund Investm...Mutual Funds, Mutual Fund Basics, Types of Mutual Funds,  Mutual Fund Investm...
Mutual Funds, Mutual Fund Basics, Types of Mutual Funds, Mutual Fund Investm...
 
Investment scheme
Investment schemeInvestment scheme
Investment scheme
 

Recently uploaded

/:Call Girls In Jaypee Siddharth - 5 Star Hotel New Delhi ➥9990211544 Top Esc...
/:Call Girls In Jaypee Siddharth - 5 Star Hotel New Delhi ➥9990211544 Top Esc.../:Call Girls In Jaypee Siddharth - 5 Star Hotel New Delhi ➥9990211544 Top Esc...
/:Call Girls In Jaypee Siddharth - 5 Star Hotel New Delhi ➥9990211544 Top Esc...lizamodels9
 
Sales & Marketing Alignment: How to Synergize for Success
Sales & Marketing Alignment: How to Synergize for SuccessSales & Marketing Alignment: How to Synergize for Success
Sales & Marketing Alignment: How to Synergize for SuccessAggregage
 
Call Girls Navi Mumbai Just Call 9907093804 Top Class Call Girl Service Avail...
Call Girls Navi Mumbai Just Call 9907093804 Top Class Call Girl Service Avail...Call Girls Navi Mumbai Just Call 9907093804 Top Class Call Girl Service Avail...
Call Girls Navi Mumbai Just Call 9907093804 Top Class Call Girl Service Avail...Dipal Arora
 
BEST Call Girls In Greater Noida ✨ 9773824855 ✨ Escorts Service In Delhi Ncr,
BEST Call Girls In Greater Noida ✨ 9773824855 ✨ Escorts Service In Delhi Ncr,BEST Call Girls In Greater Noida ✨ 9773824855 ✨ Escorts Service In Delhi Ncr,
BEST Call Girls In Greater Noida ✨ 9773824855 ✨ Escorts Service In Delhi Ncr,noida100girls
 
VIP Call Girl Jamshedpur Aashi 8250192130 Independent Escort Service Jamshedpur
VIP Call Girl Jamshedpur Aashi 8250192130 Independent Escort Service JamshedpurVIP Call Girl Jamshedpur Aashi 8250192130 Independent Escort Service Jamshedpur
VIP Call Girl Jamshedpur Aashi 8250192130 Independent Escort Service JamshedpurSuhani Kapoor
 
Call Girls in Mehrauli Delhi 💯Call Us 🔝8264348440🔝
Call Girls in Mehrauli Delhi 💯Call Us 🔝8264348440🔝Call Girls in Mehrauli Delhi 💯Call Us 🔝8264348440🔝
Call Girls in Mehrauli Delhi 💯Call Us 🔝8264348440🔝soniya singh
 
0183760ssssssssssssssssssssssssssss00101011 (27).pdf
0183760ssssssssssssssssssssssssssss00101011 (27).pdf0183760ssssssssssssssssssssssssssss00101011 (27).pdf
0183760ssssssssssssssssssssssssssss00101011 (27).pdfRenandantas16
 
2024 Numerator Consumer Study of Cannabis Usage
2024 Numerator Consumer Study of Cannabis Usage2024 Numerator Consumer Study of Cannabis Usage
2024 Numerator Consumer Study of Cannabis UsageNeil Kimberley
 
The CMO Survey - Highlights and Insights Report - Spring 2024
The CMO Survey - Highlights and Insights Report - Spring 2024The CMO Survey - Highlights and Insights Report - Spring 2024
The CMO Survey - Highlights and Insights Report - Spring 2024christinemoorman
 
Pharma Works Profile of Karan Communications
Pharma Works Profile of Karan CommunicationsPharma Works Profile of Karan Communications
Pharma Works Profile of Karan Communicationskarancommunications
 
Insurers' journeys to build a mastery in the IoT usage
Insurers' journeys to build a mastery in the IoT usageInsurers' journeys to build a mastery in the IoT usage
Insurers' journeys to build a mastery in the IoT usageMatteo Carbone
 
Cash Payment 9602870969 Escort Service in Udaipur Call Girls
Cash Payment 9602870969 Escort Service in Udaipur Call GirlsCash Payment 9602870969 Escort Service in Udaipur Call Girls
Cash Payment 9602870969 Escort Service in Udaipur Call GirlsApsara Of India
 
Progress Report - Oracle Database Analyst Summit
Progress  Report - Oracle Database Analyst SummitProgress  Report - Oracle Database Analyst Summit
Progress Report - Oracle Database Analyst SummitHolger Mueller
 
M.C Lodges -- Guest House in Jhang.
M.C Lodges --  Guest House in Jhang.M.C Lodges --  Guest House in Jhang.
M.C Lodges -- Guest House in Jhang.Aaiza Hassan
 
GD Birla and his contribution in management
GD Birla and his contribution in managementGD Birla and his contribution in management
GD Birla and his contribution in managementchhavia330
 
Call Girls In Sikandarpur Gurgaon ❤️8860477959_Russian 100% Genuine Escorts I...
Call Girls In Sikandarpur Gurgaon ❤️8860477959_Russian 100% Genuine Escorts I...Call Girls In Sikandarpur Gurgaon ❤️8860477959_Russian 100% Genuine Escorts I...
Call Girls In Sikandarpur Gurgaon ❤️8860477959_Russian 100% Genuine Escorts I...lizamodels9
 
rishikeshgirls.in- Rishikesh call girl.pdf
rishikeshgirls.in- Rishikesh call girl.pdfrishikeshgirls.in- Rishikesh call girl.pdf
rishikeshgirls.in- Rishikesh call girl.pdfmuskan1121w
 
Mondelez State of Snacking and Future Trends 2023
Mondelez State of Snacking and Future Trends 2023Mondelez State of Snacking and Future Trends 2023
Mondelez State of Snacking and Future Trends 2023Neil Kimberley
 

Recently uploaded (20)

/:Call Girls In Jaypee Siddharth - 5 Star Hotel New Delhi ➥9990211544 Top Esc...
/:Call Girls In Jaypee Siddharth - 5 Star Hotel New Delhi ➥9990211544 Top Esc.../:Call Girls In Jaypee Siddharth - 5 Star Hotel New Delhi ➥9990211544 Top Esc...
/:Call Girls In Jaypee Siddharth - 5 Star Hotel New Delhi ➥9990211544 Top Esc...
 
Sales & Marketing Alignment: How to Synergize for Success
Sales & Marketing Alignment: How to Synergize for SuccessSales & Marketing Alignment: How to Synergize for Success
Sales & Marketing Alignment: How to Synergize for Success
 
Call Girls Navi Mumbai Just Call 9907093804 Top Class Call Girl Service Avail...
Call Girls Navi Mumbai Just Call 9907093804 Top Class Call Girl Service Avail...Call Girls Navi Mumbai Just Call 9907093804 Top Class Call Girl Service Avail...
Call Girls Navi Mumbai Just Call 9907093804 Top Class Call Girl Service Avail...
 
BEST Call Girls In Greater Noida ✨ 9773824855 ✨ Escorts Service In Delhi Ncr,
BEST Call Girls In Greater Noida ✨ 9773824855 ✨ Escorts Service In Delhi Ncr,BEST Call Girls In Greater Noida ✨ 9773824855 ✨ Escorts Service In Delhi Ncr,
BEST Call Girls In Greater Noida ✨ 9773824855 ✨ Escorts Service In Delhi Ncr,
 
Best Practices for Implementing an External Recruiting Partnership
Best Practices for Implementing an External Recruiting PartnershipBest Practices for Implementing an External Recruiting Partnership
Best Practices for Implementing an External Recruiting Partnership
 
KestrelPro Flyer Japan IT Week 2024 (English)
KestrelPro Flyer Japan IT Week 2024 (English)KestrelPro Flyer Japan IT Week 2024 (English)
KestrelPro Flyer Japan IT Week 2024 (English)
 
VIP Call Girl Jamshedpur Aashi 8250192130 Independent Escort Service Jamshedpur
VIP Call Girl Jamshedpur Aashi 8250192130 Independent Escort Service JamshedpurVIP Call Girl Jamshedpur Aashi 8250192130 Independent Escort Service Jamshedpur
VIP Call Girl Jamshedpur Aashi 8250192130 Independent Escort Service Jamshedpur
 
Call Girls in Mehrauli Delhi 💯Call Us 🔝8264348440🔝
Call Girls in Mehrauli Delhi 💯Call Us 🔝8264348440🔝Call Girls in Mehrauli Delhi 💯Call Us 🔝8264348440🔝
Call Girls in Mehrauli Delhi 💯Call Us 🔝8264348440🔝
 
0183760ssssssssssssssssssssssssssss00101011 (27).pdf
0183760ssssssssssssssssssssssssssss00101011 (27).pdf0183760ssssssssssssssssssssssssssss00101011 (27).pdf
0183760ssssssssssssssssssssssssssss00101011 (27).pdf
 
2024 Numerator Consumer Study of Cannabis Usage
2024 Numerator Consumer Study of Cannabis Usage2024 Numerator Consumer Study of Cannabis Usage
2024 Numerator Consumer Study of Cannabis Usage
 
The CMO Survey - Highlights and Insights Report - Spring 2024
The CMO Survey - Highlights and Insights Report - Spring 2024The CMO Survey - Highlights and Insights Report - Spring 2024
The CMO Survey - Highlights and Insights Report - Spring 2024
 
Pharma Works Profile of Karan Communications
Pharma Works Profile of Karan CommunicationsPharma Works Profile of Karan Communications
Pharma Works Profile of Karan Communications
 
Insurers' journeys to build a mastery in the IoT usage
Insurers' journeys to build a mastery in the IoT usageInsurers' journeys to build a mastery in the IoT usage
Insurers' journeys to build a mastery in the IoT usage
 
Cash Payment 9602870969 Escort Service in Udaipur Call Girls
Cash Payment 9602870969 Escort Service in Udaipur Call GirlsCash Payment 9602870969 Escort Service in Udaipur Call Girls
Cash Payment 9602870969 Escort Service in Udaipur Call Girls
 
Progress Report - Oracle Database Analyst Summit
Progress  Report - Oracle Database Analyst SummitProgress  Report - Oracle Database Analyst Summit
Progress Report - Oracle Database Analyst Summit
 
M.C Lodges -- Guest House in Jhang.
M.C Lodges --  Guest House in Jhang.M.C Lodges --  Guest House in Jhang.
M.C Lodges -- Guest House in Jhang.
 
GD Birla and his contribution in management
GD Birla and his contribution in managementGD Birla and his contribution in management
GD Birla and his contribution in management
 
Call Girls In Sikandarpur Gurgaon ❤️8860477959_Russian 100% Genuine Escorts I...
Call Girls In Sikandarpur Gurgaon ❤️8860477959_Russian 100% Genuine Escorts I...Call Girls In Sikandarpur Gurgaon ❤️8860477959_Russian 100% Genuine Escorts I...
Call Girls In Sikandarpur Gurgaon ❤️8860477959_Russian 100% Genuine Escorts I...
 
rishikeshgirls.in- Rishikesh call girl.pdf
rishikeshgirls.in- Rishikesh call girl.pdfrishikeshgirls.in- Rishikesh call girl.pdf
rishikeshgirls.in- Rishikesh call girl.pdf
 
Mondelez State of Snacking and Future Trends 2023
Mondelez State of Snacking and Future Trends 2023Mondelez State of Snacking and Future Trends 2023
Mondelez State of Snacking and Future Trends 2023
 

abi mutul fundcprint.doc

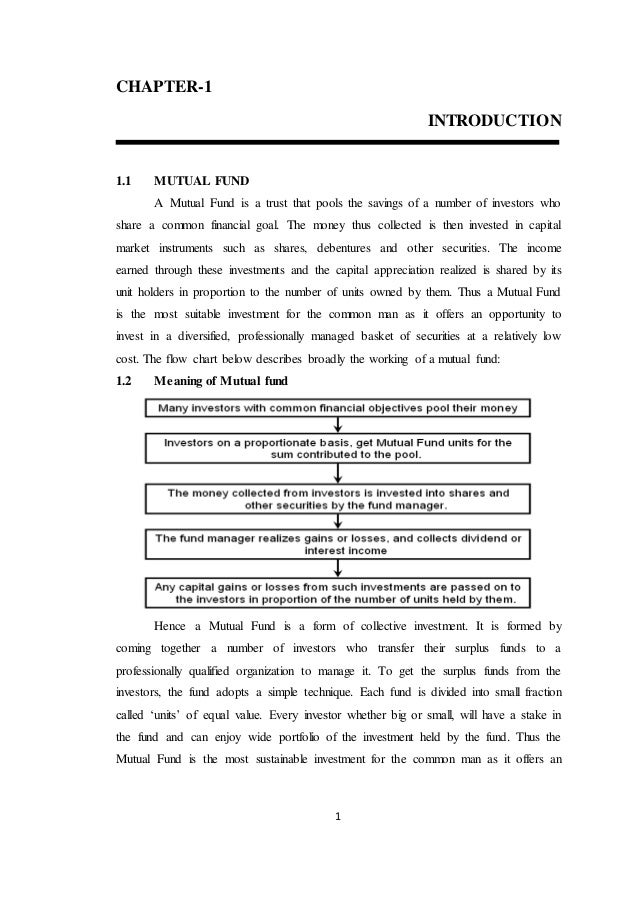
  • 1. 1 CHAPTER-1 INTRODUCTION 1.1 MUTUAL FUND A Mutual Fund is a trust that pools the savings of a number of investors who share a common financial goal. The money thus collected is then invested in capital market instruments such as shares, debentures and other securities. The income earned through these investments and the capital appreciation realized is shared by its unit holders in proportion to the number of units owned by them. Thus a Mutual Fund is the most suitable investment for the common man as it offers an opportunity to invest in a diversified, professionally managed basket of securities at a relatively low cost. The flow chart below describes broadly the working of a mutual fund: 1.2 Meaning of Mutual fund Hence a Mutual Fund is a form of collective investment. It is formed by coming together a number of investors who transfer their surplus funds to a professionally qualified organization to manage it. To get the surplus funds from the investors, the fund adopts a simple technique. Each fund is divided into small fraction called ‘units’ of equal value. Every investor whether big or small, will have a stake in the fund and can enjoy wide portfolio of the investment held by the fund. Thus the Mutual Fund is the most sustainable investment for the common man as it offers an
  • 2. 2 opportunity to invest in a diversified, professionally managed basket of securities at a relatively low cost. 1.3 Overview of Mutual fund The one investment vehicle that has truly come of age in India in the past decade is mutual funds. Today, the mutual fund industry in the country manages around Rs 100,000 crores of assets, a large part of which comes from retail investors. And this amount is invested not just in equities, but also in the entire gamut of debt instruments. Mutual funds have emerged as a proxy for investing in avenues that are out of reach of most retail investors, particularly government securities and money market instruments. Specialization is the order of the day, be it with regard to a scheme’s investment objective or its targeted investment universe. Given the plethora of options on hand and the hard sell adopted by mutual funds vying for a piece of your savings, finding the right scheme can sometimes seem a bit daunting. Mind you, it’s not just about going with the fund that gives you the highest returns. It’s also about managing risk–finding funds that suit your risk appetite and investment needs. Simply, a mutual fund is an investment vehicle that pools in the monies of several investors, and collectively invests this amount in either the equity market or the debt market, or both, depending upon the fund’s objective. This means you can access either the equity or the debt market, or both, without investing directly in equity or debt. 1.4 Advantage of Mutual fund Since the creation, mutual funds have been a popular investment vehicle for investors. The simplicities along with other attributes provide great benefit to investors with limited knowledge, time, or money. It helps to decide whether mutual funds are best for an investor and for the given situation, some reasons why an investor might want to consider investing in mutual funds.  Affordability An investor need not to be a millionaire to invest in Mutual Fund as the minimum investment in Mutual Fund starts from Rs. 500/-. A Mutual Fund because of its large corpus allows even a small investor to take the benefit of its investment strategy.
  • 3. 3  Portfolio diversification Mutual Funds diversify your portfolio by investing in various securities and minimize the risk. This kind of a diversification may add to the stability of returns  Choice Mutual Fund offers a tremendous variety of schemes. This variety is beneficial in two ways; first it offers different types of schemes to investors with different needs and risk appetites; secondly it offers an opportunity to an investor to invest sums across a variety of schemes, both debt and equity. For example, an investor can invest his money in a growth fund (equity scheme) and income fund (debt scheme) depending on the risk appetite and thus create a balanced portfolio easily or simply just buy a balanced scheme.  Professional Management The management of a portfolio involves continuous monitoring of various securities and the innumerable economic and non-economic variables that may affect portfolio’s performance. This requires a lot of time and effort on the part of the investor, along with in-depth knowledge of the functioning of the financial markets. Thus investment in mutual funds produces better results as knowledgeable and experienced professionals, who are totally devoted to tracking and updating the portfolio, manage it.  Tax Benefits  Income distributed by equity schemes will not be subject to dividend distribution tax and will be tax-free in the hands of the investors.  Units held will not be liable to wealth tax.  Short-term capital gains from equity schemes will be taxed at 10% (plus applicable surcharge), while long term capital gains will not be subject to ant tax.  Regulations All Mutual Funds in India are registered with the regulator of the Indian securities industry – the Securities Exchange Board of India (SEBI). The funds function within the framework of regulations designed by SEBI. Those regulations relate to the formations, administration and management of Mutual Funds and also prescribe disclosure and accounting requirements. Such a high level of regulation seeks to protect the interest of investors.  Liquidity
  • 4. 4 In open-ended Mutual Funds, investor can redeem all or part of his units any time he wish. Some schemes do have a lock-in period where an investor cannot return the units until the completion of such a lock-in period.  It can be traded in the secondary market, if it is a listed security.  It can be redeemed with the Asset Management Company (AMC) with the applicable clauses.  Off market transfers  Flexibility Mutual Funds offering multiple schemes allow investors to switch easily between various schemes. This flexibility gives the investor a convenient way to change the mix of his portfolio overtime  Transparency Mutual Funds regularly provide investors with information on the value of their investments. Mutual Funds also provide complete portfolio disclosure of the investments made by various schemes and also the proportion invested in each asset type.  Convenience An investor can purchase or sell fund units directly from the fund, through a broker or a financial planner. The investor may opt for a Systematic Investment Plan (SIP) or a Systematic Withdrawal Advantage Plan (SWAP). In addition to this an investor receives account statements and portfolios of the statements  Low Transaction cost Mutual Funds are a relatively less expensive way to invest compared to directly investing in the capital markets because the benefits of scale in brokerage, custodial and other fees translate into lower costs for investors. 1.4 Disadvantages of Mutual Funds Like many investments, mutual funds offer advantages and disadvantages, which are important for the investors to consider and understand before they decide to buy. Here we explore some of the drawbacks of mutual funds.  Fluctuating Returns Mutual funds are like many other investments without a guaranteed return. There is always the possibility that the value of the mutual fund will depreciate. Unlike fixed-income products, such as bonds and Treasury bills, mutual funds
  • 5. 5 experience price fluctuations along with the stocks that make up the fund. When deciding on a particular fund to buy, investor need to research the risks involved - just because a professional manager is looking after the fund, that doesn't mean the performance will be positive.  Diversification Although diversification is one of the keys to successful investing, many mutual fund investors tend to over diversify. The idea of diversification is to reduce the risks associated with holding a single security; over diversification (also known as diversification) occurs when investors acquire many funds that are highly related and so don't get the risk reducing benefits of diversification. At the other extreme, just because an investor owns s mutual fund doesn't mean that he is automatically diversified. For example, a fund that invests only in a particular industry or region is still relatively risky.  Cash, Cash and More Cash As investor know already, mutual funds pool money from thousands of investors, so everyday investors are putting money into the fund as well as withdrawing investments. To maintain liquidity and the capacity to accommodate withdrawals, funds typically have to keep a large portion of their portfolio as cash. Having ample cash is great for liquidity, but money sitting around as cash is not working for the investor and thus is not very advantageous.  Costs Mutual funds provide investors with professional management; however, it comes at a cost. Funds will typically have a range of different fees that reduce the overall payout. In mutual funds the fees are classified into two categories: shareholder fees and annual fund-operating fees. The shareholder fees, in the forms of loads and redemption fees, are paid directly by shareholders purchasing or selling the funds. The annual fund operating fees are charged as an annual percentage - usually ranging from 1-3%. These fees are assessed to mutual fund investors regardless of the performance of the fund. As you can imagine, in years when the fund doesn't make money these fees only magnify losses.  Misleading Advertisements
  • 6. 6 The misleading advertisements of different funds can guide investors down the wrong path. Some funds may be incorrectly labeled as growth funds, while others are classified as small-cap or income. The SEC requires funds to have at least 80% of assets in the particular type of investment implied in their names. The remaining assets are under the discretion solely of the fund manager. The different categories that qualify for the required 80% of the assets, however, may be vague and wide- ranging. A fund can therefore manipulate prospective investors by using names that are attractive and misleading. Instead of labeling itself a small cap, a fund may be sold under the heading growth fund.  Costs Control Not in the Hands of an Investor Investor has to pay investment management fees and fund distribution costs as a percentage of the value of his investments (as long as he holds the units), irrespective of the performance of the fund.  No Customized Portfolios The portfolio of securities in which a fund invests is a decision taken by the fund manager. Investors have no right to interfere in the decision making process of a fund manager, which some investors find as a constraint in achieving their financial objectives.  Difficulty in Selecting a Suitable Fund Scheme Many investors find it difficult to select one option from the bunch of funds/schemes/plans available. For this, they may have to take advice from financial planners in order to invest in the right fund to achieve their objectives.  Political risks Successive governments brings with them fancy new economic ideologies and policies. It is often said that many economic decisions are politically motivated. Changes in the government bring in the risk of uncertainty, which every player in the financial service industry has to face. So Mutual Funds are no exception to it.
  • 7. 7 1.5 Classification of Mutual Funds  Equity Funds Equity funds are considered to be the more risky funds as compared to other fund types, but they also provide higher returns than other funds. It is advisable that an investor looking to invest in an equity fund should invest for long term i.e. for 3 years or more. There are different types of equity funds each falling into different risk bracket. In the order of decreasing risk level, there are following types of equity funds:
  • 8. 8 1. Aggressive Growth Funds – In Aggressive Growth Funds, fund managers aspire for maximum capital appreciation and invest in less researched shares of speculative nature. Because of these speculative investments Aggressive Growth Funds become more volatile and thus they are riskier than other equity funds. 2. Growth Funds – Growth Funds also invest for capital appreciation (with time horizon of 3 to 5 years) but they are different from Aggressive Growth Funds in the sense that they invest in companies that are expected to outperform the market in the future. Without entirely adopting speculative strategies, Growth Funds invest in those companies that are expected to post above average earnings in the future. 3. Specialty Funds – Specialty Funds have stated criteria for investments and their portfolio comprises of only those companies that meet their criteria. Criteria for some Specialty funds could be to invest/not to invest in particular regions/companies. Specialty funds are concentrated and thus, are comparatively riskier than diversified funds. There are following types of Specialty funds: a. Sector Funds: Equity funds that invest in a particular sector/industry of the market are known as Sector Funds. The exposure of these funds is limited to a particular sector (say Information Technology, Auto, Banking, Pharmaceuticals or Fast Moving Consumer Goods) which is why they are more risky than equity funds that invest in multiple sectors. b. Foreign Securities Funds: Foreign Securities Equity Funds have the option to invest in one or more foreign companies. Foreign securities funds achieve international diversification and hence they are less risky than sector funds. However, foreign securities funds are exposed to foreign exchange rate risk and country risk. c. Mid-Cap or Small-Cap Funds:
  • 9. 9 Funds that invest in companies having lower market capitalization than large capitalization companies are called Mid-Cap or Small-Cap Funds. Market capitalization of Mid-Cap companies is less than that of big, blue chip companies (less than Rs. 3500 crores but more than Rs. 600 crores) and Small- Cap companies have market capitalization of less than Rs. 600 crores. d. Option Income Funds: While not yet available in India, Option Income Funds write options on a large fraction of their portfolio. Proper use of options can help to reduce volatility, which is otherwise considered as a risky instrument. These funds invest in big, high dividend yielding companies, and then sell options against their stock positions, which generate stable income for investors. 4. Diversified Equity Funds – Except for a small portion of investment in liquid money market, diversified equity funds invest mainly in equities without any concentration on a particular sector(s). These funds are well diversified and reduce sector-specific or company-specific risk. However, like all other funds diversified equity funds too are exposed to equity market risk. One prominent type of diversified equity fund in India is Equity Linked Savings Schemes (ELSS). As per the mandate, a minimum of 90% of investments by ELSS should be in equities at all times. ELSS investors are eligible to claim deduction from taxable income (up to Rs 1 lakh) at the time of filing the income tax return. ELSS usually has a lock-in period and in case of any redemption by the investor before the expiry of the lock-in period makes him liable to pay income tax on such income(s) for which he may have received any tax exemption(s) in the past. 5. Equity Index Funds – Equity Index Funds have the objective to match the performance of a specific stock market index. The portfolio of these funds comprises of the same companies that form the index and is constituted in the same proportion as the index. Equity index funds that follow broad indices (like S&P CNX Nifty, Sensex) are less risky than equity index funds that follow narrow sectoral indices (like BSEBANKEX or CNX Bank Index etc). Narrow indices are less diversified and therefore, are more risky. 6. Value Funds –
  • 10. 10 Value Funds invest in those companies that have sound fundamentals and whose share prices are currently under-valued. The portfolio of these funds comprises of shares that are trading at a low Price to Earning Ratio (Market Price per Share / Earning per Share). Value Funds may select companies from diversified sectors and are exposed to lower risk level as compared to growth funds or Specialty funds 7. Equity Income or Dividend Yield Funds - The objective of Equity Income or Dividend Yield Equity Funds is to generate high recurring income and steady capital appreciation for investors by investing in those companies which issue high dividends (such as Power or Utility companies whose share prices fluctuate comparatively lesser than other companies' share prices). Equity Income or Dividend Yield Equity Funds are generally exposed to the lowest risk level as compared to other equity funds.  Debt / Income Funds Funds that invest in medium to long-term debt instruments issued by private companies, banks, financial institutions, governments and other entities belonging to various sectors (like infrastructure companies etc.) are known as Debt / Income Funds. Debt funds are low risk profile funds that seek to generate fixed current income to investors. Although debt securities are generally less risky than equities, they are subject to credit risk (risk of default) by the issuer at the time of interest or principal payment Based on different investment objectives there can be following types of debt funds: 1. Diversified Debt Funds – Debt funds that invest in all securities issued by entities belonging to all sectors of the market are known as diversified debt funds. The best feature of diversified debt funds is that investments are properly diversified into all sectors which results in risk reduction. Any loss incurred, on account of default by a debt issuer, is shared by all investors which further reduces risk for an individual investor. 2. Focused Debt Funds - Unlike diversified debt funds, focused debt funds are narrow focus funds that are confined to investments in selective debt securities, issued by companies of a specific sector or industry or origin. Some examples of focused debt funds are sector,
  • 11. 11 specialized and offshore debt funds, funds that invest only in Tax Free Infrastructure or Municipal Bonds. Because of their narrow orientation, focused debt funds are more risky as compared to diversified debt funds. Although not yet available in India, these funds are conceivable and may be offered to investors very soon. 3. High Yield Debt funds – The risk of default is present in all debt funds, and therefore, debt funds generally try to minimize the risk of default by investing in securities issued by only those borrowers who are considered to be of "investment grade". But, High Yield Debt Funds adopt a different strategy and prefer securities issued by those issuers who are considered to be of "below investment grade". The motive behind adopting this sort of risky strategy is to earn higher interest returns from these issuers. These funds are more volatile and bear higher default risk, although they may earn at times higher returns for investors. 4. Assured Return Funds – Although it is not necessary that a fund will meet its objectives or provide assured returns to investors, but there can be funds that come with a lock-in period and offer assurance of annual returns to investors during the lock-in period. Any shortfall in returns is suffered by the sponsors or the Asset Management Companies (AMCs). These funds are generally debt funds and provide investors with a low-risk investment opportunity. Currently, no AMC in India offers assured return schemes to investors, though possible. 5. Fixed Term Plan Series – Fixed Term Plan Series usually are closed-end schemes having short term maturity period (of less than one year) that offer a series of plans and issue units to investors at regular intervals. Unlike closed-end funds, fixed term plans are not listed on the exchanges. Fixed term plan series usually invest in debt / income schemes and target short-term investors. The objective of fixed term plan schemes is to gratify investors by generating some expected returns in a short period.  Gilt Funds Also known as Government Securities in India, Gilt Funds invest in government papers having medium to long term maturity period. Issued by the Government of India, these investments have little credit risk (risk of default) and provide safety of principal to the investors. However, like all debt funds, gilt funds
  • 12. 12 too are exposed to interest rate risk. Interest rates and prices of debt securities are inversely related and any change in the interest rates results in a change in the NAV of debt/gilt funds in an opposite direction.  Money Market / Liquid Funds Money market / liquid funds invest in short-term (maturing within one year) interest bearing debt instruments. These securities are highly liquid and provide safety of investment, thus making money market / liquid funds the safest investment option when compared with other mutual fund types. However, even money market / liquid funds are exposed to the interest rate risk. The typical investment options for liquid funds include Treasury Bills (issued by governments), Commercial papers (issued by companies) and Certificates of Deposit (issued by banks).  Hybrid Funds As the name suggests, hybrid funds are those funds whose portfolio includes a blend of equities, debts and money market securities. Hybrid funds have an equal proportion of debt and equity in their portfolio. There are following types of hybrid funds in India: 1. Balanced Funds - The portfolio of balanced fund includes assets like debt securities, convertible securities, and equity and preference shares held in a relatively equal proportion. The objectives of balanced funds are to reward investors with a regular income, moderate capital appreciation and at the same time minimizing the risk of capital erosion. Balanced funds are appropriate for conservative investors having a long term investment horizon. 2. Growth-and-Income Funds – Funds that combine features of growth funds and income funds are known as Growth-and-Income Funds. These funds invest in companies having potential for capital appreciation and those known for issuing high dividends. The level of risks involved in these funds is lower than growth funds and higher than income funds. 3. Asset Allocation Funds –
  • 13. 13 Mutual funds may invest in financial assets like equity, debt, money market or non-financial (physical) assets like real estate, commodities etc.. Asset allocation funds adopt a variable asset allocation strategy that allows fund managers to switch over from one asset class to another at any time depending upon their outlook for specific markets. In other words, fund managers may switch over to equity if they expect equity market to provide good returns and switch over to debt if they expect debt market to provide better returns. It should be noted that switching over from one asset class to another is a decision taken by the fund manager on the basis of his own judgment and understanding of specific markets, and therefore, the success of these funds depends upon the skill of a fund manager in anticipating market trends.  Others 1. Commodity Funds Those funds that focus on investing in different commodities (like metals, food grains, crude oil etc.) or commodity companies or commodity futures contracts are termed as Commodity Funds. A commodity fund that invests in a single commodity or a group of commodities is a specialized commodity fund and a commodity fund that invests in all available commodities is a diversified commodity fund and bears less risk than a specialized commodity fund. 2. Real Estate Funds Funds that invest directly in real estate or lend to real estate developers or invest in shares/securitized assets of housing finance companies, are known as Specialized Real Estate Funds. The objective of these funds may be to generate regular income for investors or capital appreciation.
  • 14. 14 3. Exchange Traded Funds (ETF) Exchange Traded Funds provide investors with combined benefits of a closed- end and an open-end mutual fund. Exchange Traded Funds follow stock market indices and are traded on stock exchanges like a single stock at index linked prices. The biggest advantage offered by these funds is that they offer diversification, flexibility of holding a single share (tradable at index linked prices) at the same time. Recently introduced in India, these funds are quite popular abroad. 4. Fund of Funds Mutual funds that do not invest in financial or physical assets, but do invest in other mutual fund schemes offered by different AMCs, are known as Fund of Funds. Fund of Funds maintain a portfolio comprising of units of other mutual fund schemes, just like conventional mutual funds maintain a portfolio comprising of equity/debt/money market instruments or non financial assets. Fund of Funds provide investors with an added advantage of diversifying into different mutual fund schemes with even a small amount of investment, which further helps in diversification of risks As shown in the above diagram higher the risk higher is the return. Money Market Mutual Fund (MMMF) has lowest risk but at the same time the return is also low. Aggressive growth funds are more risky and they invest in equities which yield high returns.
  • 15. 15 1.6 The Structure of a Mutual Fund Sponsor Sponsor is the person who acting alone or in combination with another body corporate establishes a mutual fund. Sponsor must contribute at least 40% of the net worth of the Investment Managed and meet the eligibility criteria prescribed under the Securities and Exchange Board of India (Mutual Funds) Regulations, 1996.The Sponsor is not responsible or liable for any loss or shortfall resulting from the operation of the Schemes beyond the initial contribution made by it towards setting up of the Mutual Fund.
  • 16. 16 Trustee Trustee is usually a company (corporate body) or a Board of Trustees (body of individuals). The main responsibility of the Trustee is to safeguard the interest of the unit holders and inter alias ensure that the AMC functions in the interest of investors and in accordance with the Securities and Exchange Board of India (Mutual Funds) Regulations, 1996, the provisions of the Trust Deed and the Offer Documents of the respective Schemes. Asset Management Company (AMC) The Trustee as the Investment Manager of the Mutual Fund appoints the AMC. The AMC is required to be approved by the Securities and Exchange Board of India (SEBI) to act as an asset management company of the Mutual Fund. At least 50% of the directors of the AMC are independent directors who are not associated with the Sponsor in any manner. The AMC must have a net worth of at least 10 crore at all times. Registrar and Transfer Agent The AMC if so authorized by the Trust Deed appoints the Registrar and Transfer Agent to the Mutual Fund. The Registrar processes the application form; redemption requests and dispatches account statements to the unit holders. The Registrar and Transfer agent also handles communications with investors and updates investor records.
  • 17. 17 1.7 Type of risk Risk and Return Trade-Off The most important relationship to understand is the risk – return trade off. Higher the risk greater the return or loss lower the risk lower the return or loss. Hence it is up to investor to decide how much risk he is willing to take.  Market Risk Sometimes prices and yields of all securities rise and fall. Broad outside influences affecting the market in general lead to this. This is true, may it be big corporations or smaller mid sized companies. This is known as market risk.  Credit Risk The debt servicing ability (it may be interest payments or the replacement of principal) of a company through its cash flows determines the credit risk faced by you. This credit risk is measured by independent rating agencies like CRISIL who rate companies. A well-diversified portfolio may help to migrate this risk.  Inflation Risk By this we mean the money worth today is much more than its worth after a certain period of time. A lot of times people make conservative investment decisions
  • 18. 18 to protect their capital but end up with the sum of money less than the principal at the time of investment. This happens if the inflation grows faster than the returns on your investment. A well diversified portfolio with investments in equities will help to mitigate this risk.  Interest Rate Risk In a free market economy interest rates are difficult if not impossible to predict. Changes in interest rates affect the price of bonds as well as equities. If interest rate rises the prices of bonds fall and vice versa.  Political / Government Policy Risk Changes in government policy and political decision can change the investment environment for investment or vice versa.  Liquidity Risk Liquidity risk arises when it becomes difficult to sell the securities that one has purchased. Liquidity risk can be partly mitigated by diversification as well as internal risk controls that lean towards purchase of liquid securities. Banks V/S Mutual Funds Mutual Funds are now also competing with commercial banks in the race of retail investor’s savings and corporate float money. The power shift towards Mutual Funds has become obvious. The traditional saving avenues are losing out in the current scenario. The driving force of Mutual Funds is the advantage of capital appreciation together with the income earned in the form of dividend has made Mutual Funds a hot favorite among millions of people all over the world. People prefer Mutual Funds to bank deposits because with a little money they can get into the investment game.
  • 19. 19 Banks Mutual Funds Returns Low High Administrative exp. High Low Risk Low Moderate Investment Options Less More Network High Penetration Low but improving Liquidity At a cost Better Quality of Assets Not transparent Transparent Income calculation Minimum balance must be maintained every month Everyday Guarantee Maximum Rs. 1lakh on deposits None 1.8 Net Asset Value (NAV) of a scheme The performance of a particular scheme of a mutual fund is denoted by Net Asset Value (NAV). Mutual funds invest the money collected from the investors in securities markets. The NAV per unit is the market value of securities of a scheme divided by the total number of units of the scheme on any particular date. For example, if the market value of securities of a mutual fund scheme is Rs 200 Lakhs and the mutual fund has issued 10 Lakhs units of Rs. 10 each to the investors, then the NAV per unit of the fund is Rs.20. NAV is required to be disclosed by the mutual funds on a regular basis - daily or weekly - depending on the type of scheme  How to Use Net Asset Values NAVs are helpful in keeping an eye on your mutual fund's price movement, but NAVs are not the best way to keep track of performance. The reason for this is mutual fund distributions. Mutual funds are forced by law to distribute at least 90% of its' realized capital gains and dividend income each year. When a fund pays out this distribution, the NAV drops by the amount paid. This is important because an investor may become frightened when they see their fund's NAV drop by $3 even though they haven't lost any money (the $3 was paid out to the shareholder).
  • 20. 20  Calculation of NAV The most important part of the calculation is the valuation of the assets owned by the fund. Once it is calculated, the NAV is simply the net value of assets divided by the number of units outstanding. The detailed methodology for the calculation of the asset value is given below. NAV PER UNIT IS CALCULATED AS:- Market value of investments + Current asserts and other assets + Accrued income – current liabilities and other liabilities – Accrued Expenses Net Asset Value or NAV of a Mutual Fund is the value of one unit of investment in the fund, in net asset terms. It is computed by dividing the net assets of the fund by the number of units that are outstanding in the books of the fund. Market Value of Assets - Liabilities NAV = __________________________________________ Units Outstanding 1.9 Significant factors affecting NAV:  Sale and purchase of securities  Sale and repurchase of units  Valuation of all investment securities held  Accrued income and liabilities  Portfolio turnover  Benchmark Index  Dividend  Government Policies 1.10 TAX TREATMENT OF A MUTUAL FUND  Tax Benefit to a fund: The entire income of a fund is exempt from income tax in accordance with the provision of Section 10 (23D) of the Income Tax Act, 1961. A fund will receive all income without any deduction of tax at source under the provision of Section 196 (IV), of the Act. However, under the Finance (No. 2) Act, 2004, it is provided that on income distribution, if any, made by a fund on or after 1 April, 2004 to Unit holders, being Individuals and Hindu Undivided Family, income-tax will be payable under Section
  • 21. 21 115R of the Act, at 13.06875% (inclusive of surcharge and additional surcharge called Education Cess on Income Tax), and to other Unit holders at 20.91% (inclusive of surcharge and additional surcharge on Income Tax), except, inter alias, in the case of open ended equity oriented funds, (i.e. where the investible funds are invested by way of equity shares in domestic companies to the extent of more than 50% of the total proceeds of the Fund), where no such tax is levied.  Tax Benefit to the Unit holders: Income Tax Income received in respect of units of a mutual fund, in respect of income distribution made on or after 1 April, 2003, would be exempt from income tax in the hands of the Unit holders under Section 10 (35) of the Act. Tax Deducted at Source In view of the exemption of income tax in the hands of Unit holders, no income tax is deductible at source, on income distribution by the Fund, under the provisions of Section 194K and 196A of the Act. Capital Gains Tax Under Section 10 (38) of the Act, capital gain arising on transfer of a long- term capital asset held for a period of more than twelve months, inter alias, being a unit of an equity oriented fund would be exempt from income tax, if sale of such unit is made on or after 1 October, 2004, and such transaction has been chargeable to securities transaction tax under Chapter VII of the Finance Act. Currently securities transaction tax is being levied at 0.15% on the sale of the mutual fund.
  • 22. 22 CHAPTER-2 REVIEW OF LITERATURE There is conventional viewpoint that mutual funds investment performance is consistent with the original version of the so called efficient market theory. The latter simply means that securities prices already include all information, implying that returns across active and passive portfolios are equal before subtracting trading and investment expenses. Hence the expenditure on research and analysis is wasted. This viewpoint is the outcome of early academic studies of Sharpe (1966), Jensen (1968), and Treynor (1966), which found that mutual funds do not systematically outperform benchmark portfolios. Taken as whole, the results of the studies are consistent with the conventional viewpoint that funds fees and expenses are wasted. Sharpe (1966) developed a simple theoretical meaningful performance evaluation measure for mutual funds that considers both average return and risk. This measure is called reward to variability ratio. The study used annual rates of return for 34 opened mutual funds and Standard deviation of annual return was used as surrogate for risk during the period 1944-63 and evaluated their performance by this newly coined reward to variability ratio. Only 11 funds out of 34 funds performed superior to Dow Jones portfolio. The reward to variability ratio computed for each fund was significantly less than the same measure applied to Dow Jones portfolio over the period 1954-63. The average reward to variability ratio of 34 funds was considerably smaller than Dow Jones portfolio, and considered enough to conclude that average mutual funds performance was distinctly inferior to an investment in Dow Jones portfolio. It further concluded that good performance was associated with law expense ratio. Sarkar (1991) critically examined mutual fund performance evaluation methodology and pointed out that Sharpe (1996) and Treynor (1968) performance measures rank mutual funds similarly on performance in spite of their differences in methodology. Obaidullah & Sridhar (1991) 31 evaluated the performance of two major growth oriented mutual funds-Mastershare and Can share from India and concluded that these
  • 23. 23 funds provided abnormal returns. Mastershare did it on a total-risk adjusted basis and Can share on a market risk-adjusted basis. The study provided contradictory evidence to the near-strong efficient market hypothesis for these funds. Singh & Shukla (1994) empirically examined the performance of 12 growth oriented mutual funds over the period, 1992-1996. Using risk adjusted performance measures of Sharpe, Treynor and Jensen, the study demonstrated that mutual funds have not performed better than their benchmark. Only (4 out of 12) 33 percent mutual funds had positive Sharpe index and average share index was -0.142, which was lower than market index. In relation to another measure; Treynor index, only 2 out of 12 fund have positive value and average index was -0.0327 also was lower than market index. The average Jensen alpha was 0.002 which indicated that funds earned about 0.2 percent less per month than they might had earned given their level of systematic risk. In the sample under study UGS 500 and Master plus 91 funds were found to highly diversified and performed better than benchmark index. Kale & Uma (1995) examined risk return relationship for 77 mutual fund schemes managed by eight mutual funds and found that schemes proved worth their objectives Yadav & Mishra (1996) empirically evaluated performance of 14 mutual funds over the period 1992-1995. The study indicated that the funds as a whole performed well in terms of non-risk adjusted measure of average return and in terms of risk adjusted performance. Mutual funds in aggregate had a higher Sharpe index, but a lower Treynor index and negative average alpha. The study reported that mutual funds had done well in terms of diversification and total variability of returns, and indicated that the funds managers of growth schemes adopted a conservative investment policy and maintained a low portfolio beta and therefore were successful in limiting losses in a rapidly falling stock market. Gupta & Sehgal (1998) studied investment performance of 80 mutual fund schemes from the Indian market over a four year period 1992-96. It tested propositions relating to fund diversification, consistency of performance, parameter of performance and objective stationary in additions to examining risk-return relationship in general. The study reported that mutual fund industry has performed reasonably well for the Indian market. It found lack of adequate portfolio diversification. The study produced
  • 24. 24 evidence to support consistency of performance and its not-stationary overtime was noted in relation to risk-return parameters. Finally, a significant and positive risk- return relationship was documented by the study when standard deviation was used as a risk measure. Chander (2002) empirically examined the performance of 34 mutual funds in terms of performance evaluation models developed by Sharpe. Treynor and Jensen. The study made a comprehensive decomposition of portfolio performance to attitude it to various activities of fund managers such as stock selectivity, market timing, risk bearing and diversification. The study reported that a majority (64.71 percent) of sample fund schemes had outperformed the benchmark in terms of Sharpe measure, while remaining 35.29 percent had experienced performance below market portfolio. In contrast a significant majority (76.47 percent) of sample fund schemes had demonstrated inferior performance in terms of Treynor’ measure. Gupta (2002) conducted a comprehensive study of 73 mutual funds evaluate investment performance and timing abilities of fund managers in India. The study reported 54.8 percent of sample outperformed the benchmark in terms of Sharpe’s measure and 37 percent of sample schemes outperformed the benchmark portfolio in terms of Treynor’ measure. Ajay Khorana (2004) found that mutual fund investors generally desire high risk- adjusted performance at low cost, which is not necessarily the objective of fund families. Fund families generally want to maximize assets under management (i.e., their market share) and the resulting management fees. This paper examines how these conflicting objectives affect competition and investor behavior in the mutual fund industry for the universe of U.S. mutual fund families over the period 1979- 1998. Over this period, industry assets increased by a factor of twenty, the number of active fund families tripled, and the average market share of a family declined by two thirds. We find that price competition is important in the industry. Families that charge lower fees than the competition gain market share, but only if these fees are above average to begin with. Low-cost families do not lose market share by charging higher fees. In addition, fees charged explicitly for marketing and distribution (12b-1 fees) have a positive impact on market share. We find no evidence that investors
  • 25. 25 derive any benefit from 12b-1 fees. Product differentiation strategies are also effective in obtaining market share. Families that perform better, and start more funds relative to the competition (a measure of innovation) have a higher market share. Innovation is rewarded more if the new fund is more differentiated from existing offerings and is in a less crowded objective. Finally, market share within an investment objective is driven primarily by a family's policies within that objective, but there are important performance spillover effects from other funds in the family. Our findings are robust to various tests for endogenously of the explanatory variables. Overall, this paper highlights a number of conflicts between fund families and investors. Julien Hugonnier (2006) analyzed the implications of dynamic flows on a mutual fund's portfolio decisions. In our model, myopic investors dynamically allocate capital between a riskless asset and an actively managed fund which charges fraction-of-fund fees. The presence of dynamic flows induces "flow hedging" portfolio distortions on the part of the fund, even though investors are myopic. Our model predicts a positive relationship between a fund's proportional fee rate and its volatility. This is a consequence of higher-fee funds holding more extreme equity positions. Although both the fund portfolio and investors' trading strategies depend on the proportional fee rate, the equilibrium value functions do not. Finally, we show that our results hold even if investors are allowed to directly trade some of the risky securities S.M.Z. Khurshid (2009) examined the structure of the mutual fund industry in India and to analyze the state of competition among all the mutual funds along with between sector competition and within sector competition. The mutual fund industry in India is relatively adolescent compared to that of developed countries. Initially the industry was a state monopoly of Unit Trust of India. Later on, a few public sector institutions were allowed to operate. After 1993, when the industry was opened for the private sector, only then a real environment was created for the competition in the industry. In this study, the Normalized Herfindal-Hirshman Index of concentration was used to estimate the levels of competition among the mutual funds. The levels of competition and their trends have been obtained for the period March, 2003 to March, 2009. This study found overall mutual fund industry, different sectors of the mutual funds and funds within Private Joint Venture Indian Dominated highly competitive;
  • 26. 26 funds within Private Joint Venture Foreign Dominated were found most of the times moderately competitive and funds within Bank-Institution, Private Sector Indian and Private Sector Foreign were found concentrated. A lack of trend of competition was observed in the overall industry and within Private Joint Venture Foreign Dominated in India. A decreasing trend of competition was observed among different sectors and within Private Sector Indian; and an increasing trend was found within Bank- Institution, Private Sector Foreign and Private Joint Venture Indian Dominated during the period. Nicolas P. B. Bollen (2005) estimated parameters of standard stock selection and market timing models using daily mutual fund returns and quarterly measurement periods. We then rank funds quarterly by abnormal return and measure the performance of each decile the following quarter. The average abnormal return of the top decile in the post-ranking quarter is 39 basis points. The post-ranking abnormal return disappears when funds are evaluated over longer periods. These results suggest that superior performance is a short-lived phenomenon that is observable only when funds are evaluated several times a year.
  • 27. 27 References 1. Bauman Mark P (1996), “ A Review of Fundamental analysis research in accounting”, Journal of accounting literature, (www.findarticles.com). 2. Berg Jim (1999), “ Fundamental Analysis using internet”, Past edition of ASX investor update e-mail newsletter,(www.asx.com.au) 3. Whisenant Scott ,Fairfield Patricia M. (2001), “Using Fundamental Analysis to Assess Earnings Quality: Evidence from the Center for Financial Research and Analysis”, Journal of Accounting Auditing & Finance, Vol. 16, No. 4, pp. 273-295, Fall 2001 4. Vanston B. Finnie G and Tan C. (2004), “Enhancing security selection in the Australian stock market using fundamental analysis and neutral networks” 5. Ramudu P Janaki, Rao S Durga (November 2006), “ A Fundamental Analysis of Indian Banking Industry” The Icfai Journal of Bank Management, Vol. 5, No. 4, pp. 68-79, November 2006 6. Harris Trevor S.(2006), “From Stock Selection to Portfolio Alpha Generation: The Role of Fundamental Analysis”, Journal of Applied Corporate Finance, Vol. 18, No. 1, pp. 54-81, Winter 2006 7. Ramudu P Janaki and Rao S Durga (November 2006), “A Fundamental Analysis of Indian Banking Industry ”, The Icfai Journal of Bank Management, Vol. 5, No. 4, pp. 68-79, November 2006
  • 28. 28 8. Pal Ved, Malik N.S. (August 2007), “A Multivariate Analysis of the Financial Characteristics of Commercial Banks in India”, Icfai Journal of Bank Management, Vol. 6, No. 3, pp. 29-42 (August 2007) 9. Toby Adolphus J. (August 2007), “Camel Analysis, Prudential Regulation and Banking System Soundness in Nigeria ”, The Icfai Journal of Bank Management, Vol. 6, No. 3, pp. 43-60, August 2007 10. Gourav Vallabh , Anoop Bhatia and Saurabh Mishra (August 2007), “Non- Performing Assets of Indian Public, Private and Foreign Sector Banks: An Empirical Assessment ”, Icfai Journal of Bank Management, Vol. 6, No. 3, pp. 7-28, August 2007 11. Dzeawuni Sr. Wirnkar Alphonsius , Dr. Muhammad Tanko (June 2008), “CAMELs and Banks Performance Evaluation: The Way Forward ”(June 2008). 12. Maureen G. Butler , Carolyn M. Callahan and Rod Smith (September 2008), “Fundamental Analysis of Firm Performance Following Strategic Alliance Announcements ” (September 2008) 13. Bettman Jenni L., Sault Stephen and Welch Emma (March 2009), “Fundamental and Technical Analysis: Substitutes or Compliments?”, Accounting & Finance, Vol. 49, No. 1, pp. 21-36, March 2009. 14. Lynch John, “Share Market Analysis-Fundamental Analysis vs. Technical Analysis”, SHAW Stock broking Ltd.”, by ASX investor update e-mail newsletter, (www.eninarticle.com).
  • 29. 29 CHAPTER-3 RESEARCH METHODOLOGY This chapter highlights the why, when, where, how and on whom the study has been conducted as well as the limitations of the study. In this chapter, the methodology followed in conducting the research has been described. Details regarding objectives of the study, the research design, data collection, limitations of the study, area of the study and statistical tools used have also been discussed. 3.1 Company Profile SBI Mutual Fund is India's largest bank sponsored mutual fund with an investor base of over 3 million. SBI Mutual Fund is a joint venture between the State Bank of India, India's largest banking enterprise and Society General Asset Management of France, one of the world's leading fund management companies. Since its inception SBI Mutual Fund has launched thirty-two schemes and successfully redeemed fifteen of them. SBI Mutual Fund schemes have consistently outperformed benchmark indices. SBI Mutual is the first bank-sponsored fund to launch an offshore fund - Resurgent India Opportunities Fund. Presently, SBI Mutual Fund manages over Rs. 17000 crores of assets. The fund has a network of 100 collection branches, 26 investor service centres, 28 investor service desks and 40 district organizers. 3.2 Objectives:  To Study the performance of selected MF of SBI.  To find out the Top 10 holdings, Market value, Net asset value of selected schemes of SBI mutual fund.  To make the Ratio Analysis of SBI mutual fund.  To suggest the means through which SBI Funds can increase its competitive strength.
  • 30. 30 3.3 Scope of the study The study attempts to provide an insight into the performance of various activities by SBI Mutual Fund. This helps to analyze whether the firm is able to meet its current obligation, factors that affect the distributors and investors in deciding about the investment. It also encompasses the financial analysis of SBI mutual fund with regarding some of its schemes . 3.3(i) Selected schemes The schemes which we have selected for doing the analysis are following:-  SBI Magnum Balanced Fund (MBF)  SBI Magnum Equity Fund(MEF)  SBI Magnum Global Fund (MGF)  SBI Magnum Children Benefit Plan(MCBP)  SBI Magnum Taxgain Schemes(MTS) 3.3 (ii) Time Period The time period for which the data have been collected is from 2005 to 2009. 3.3(iii) Selected Parameters The data collected for this time period of all the schemes is about its:-  NAV  Portfolio Turnover Ratio  Market Value  Launch date, entry &exit load, initial investment  Top 10 holdings in various industries  Performance returns  Current Ratio, Quick Ratio and Propriety Ratio. 3.4 Sources of data collection According to the needed research of the project; the researcher pursued secondary data collection method .The extensive literature used in the project has been collected from various sources. The main information is from internet, Some
  • 31. 31 journals, newspapers are also used. Researcher has used Web sites related to SBI mutual fund& information broacher for secondary data collection . 3.5 Technique of Analysis Various statistical tool have been applied to analysis the collected data.Viz.., graphs and charts. 3.6 Limitations of the Study  The ratios calculated at a period are likely to vary from time to time and hence they are liable to temporary changes.  There can be many interpretations and explanation to the data collected. This is empirical study and the research provides the explanation as understood by the researcher only. 3.7 Organization of the study CHAPTER 1 deals with the introduction of Mutual Fund ,meaning, overview, advantage & disadvantage, risk, NAV, Factor affecting NAV, Tax Benefits, Classification of Mutual Fund, Banks & Mutual fund ,Structure of Mutual Fund. CHAPTER 2 highlights the review of literature. CHAPTER 3 covers Company profile, Objective of the Study, Scope of the Study, Sources of data collection, and Limitation of the study. CHAPTER4 deals with the analysis and interpretation of the study. CHAPTER 5 explains and conclusion of the study.
  • 32. 32 CHAPTER-4 ANALYSIS AND INTERPRETATION OF DATA The chapter contains the analysis & interpretation of the data taken from different schemes of SBI mutual fund. These schemes are SBI Magnum Balanced Fund, SBI Magnum Equity Fund, SBI Magnum Global Fund, SBI Magnum Children Benefit Plan, SBI Magnum Tax gain Schemes. The Researcher Have Taken Various data of these schemes for analysis their financial performance. Table 4.1 SBI Magnum Balanced Fund Performance (%) Returns Above 1 year are Annualized 1w 1m 3m 6m 1y 3y 5y Scheme Returns 1.3 3.2 1.6 7.9 59 13.5 21.3 Category Average 1 2.8 2 8.9 55.7 12 17.2 Category Best 3.3 5.4 9.3 24.1 106 19.4 25.3 Category Worst [0.1] [0.1] [3.0] 1.4 3.5 0.5 9.1 Sources: SBI mutual fund annual report (2006-2010) The figures in parenthesis shows the negative value Fig 4.1
  • 33. 33 Interpretation Table 4.1 depicts the performance return of the SBI Magnum Balanced fund. It has given significant return in past years. The fund has given above average return in last one week, one month and three month. In last six month it has given below average return as compared to other mutual funds of same category. However, it has given above average return in last one year, three year and five year. This figures shows that investor has been benefited with above average return. Table 4.2 SBI Magnum Equity Fund Performance(%) * returns above 1 yr. are annualized 1w 1m 3m 6m 1y 3y 5y Scheme Returns 1.6 4.4 2.9 9.8 82.9 15.6 26.9 Category Avg 0.5 2.6 0.8 10 82.2 13.2 21.5 Category Best 4.1 6.6 9.1 57.2 148 29.6 29.6 Category Worst [68.0] [64.8] [66.0] [61.6] [26.8] [6.8] 8 Sources: SBI mutual fund annual report (2006-2010) The figures in parenthesis shows the negative value Fig 4.2
  • 34. 34 Interpretation SBI Magnum Equity Fund has also given significant return to its investor over the period. It has given above average return during the last one week, one month, three month. However, it has given slightly below average return in last six month and slightly above average return in last one year. It has given above average return in last 3 years and last 5 years. Table 4.3 SBI Magnum Taxgain Fund Performance(%) * returns above 1 yr. are annualized 1w 1m 3m 6m 1y 3y 5y Scheme Returns 1.2 2.1 [0.7] 8.6 74.3 NA NA Category Avg 1 3.5 2 10.7 80.9 12.2 18.9 Category Best 2.3 6 10.1 21.5 112 27.2 25.6 Category Worst 0.2 1.1 [4.4] 1.8 53.2 2.7 11.2 Sources: SBI mutual fund annual report (2006-2010) The figures in parenthesis shows the negative value Fig 4.3
  • 35. 35 Interpretation SBI Magnum Taxgain fund , the fund in which investor invest to save tax and earn . The fund has given slightly above average return in last one week and has given below average . return in last one month, three month, six month and one year. Table 4.4 SBI Magnum Global Fund Performance(%) * returns above 1 yr. are annualized 1w 1m 3m 6m 1y 3y 5y Scheme Returns 2.2 4.3 2.3 19 123 8.4 23.9 Category Avg 0.5 2.6 0.8 10 82.2 13.2 21.5 Category Best 4.1 6.6 9.1 57.2 148 29.6 29.6 Category Worst [68.0] [64.8] [66.0] [61.6] [26.8] [6.8] 8 Sources: SBI mutual fund annual report (2006-2010) The figures in parenthesis shows the negative value Fig 4.4
  • 36. 36 Interpretation SBI Magnum global fund has given significant return over the period. It has given above average return in last one week, one month, three month, six month, one year and five year. However, it has given below average return in last three year and five years. Table 4.5 SBI Magnum Children Benefit Plan Performance (%) * returns above 1 yr. are annualized 1w 1m 3m 6m 1y 3y 5y Scheme Returns 0.8 1.5 1.1 5.2 15.8 7.6 8.6 Category Avg 15.3 10.9 [2.3] [4.6] [6.1] 1 7 Category Best 71.6 37.4 14.4 23.4 17.2 9.3 14.5 Category Worst [45.3] [18.8] [36.3] [70.3] [53.1] [22.3] [12.0] Sources: SBI mutual fund annual report (2006-2010) The figures in parenthesis shows the negative value Fig 4.5
  • 37. 37 Interpretation SBI Magnum Children benefit plan is unique plan for benefit of children. It has given below average return in last one week, one month. However, it has given above average return in last three month, six month, one year, three year and five year. Table 4.6 Top 10 Holdings of SBI Magnum Balanced Fund Company Percentage Bharat Electronic 1.86 Cipla 1.92 ITC Ltd. 2.39 SBI 2.6 Bharti Airtel 2.81 Infosys Techno. 2.9 Bharat Heavy Electronics 3.37 ICICI Bank 3.62 Rural Electronic 4 Reliance Inds. 4.06 Sources: SBI mutual fund annual report (2006-2010) Fig 4.6
  • 38. 38 Interpretation Table 4.6 shows the top 10 holdings of SBI Magnum Balanced Fund . It has invested in diversify sectors, mainly in blue chip companies. It has invested 4.06% in Reliance Industries , 4% in Rural Electrification , 3.62% in ICICI bank, 3.37% in BHEL, 2.9% Infosys Technologies, 2.81 % in Bharti Airtel, 2.6% in SBI, 2.39% in ITC, 1.92% in Cipla, 1.86% in Bharat Electronics. Table 4.7 Top 10 Holdings of SBI Magnum Equity Fund Companies Percentage ICICI Bank 5.11 Reliance Inds. 4.74 Infosys Techno. 4.64 Hero Honda Motor 4.47 Bharat Heavy Electronics 4.2 Asian Paints Ltd. 4.15 ITC Ltd. 4.14 L & T 3.59 SBI 3.27 Bajaj Holdings & Inv 3.17 Sources: SBI mutual fund annual report (2006-2010) Fig 4.7
  • 39. 39 Interpretation Table 4.7 shows the top 10 holdings of SBI Magnum equity Fund. It has invested in diversify sectors, mainly in blue chip companies. It has invested 4.74% in Reliance Industries , 4.74% in Hero Honda motor, 5.11% in ICICI bank, 4.15% in Asian paints ltd., 4.64% Infosys Technologies, 4.14 % in ITC ltd., 3.27% in SBI, 3.59% in L&T, 3.17% in Bajaj holdings, 4.2% in Bharat Heavy Electronics. Table 4.8 Top 10 Holdings of SBI Magnum Taxgain Fund Companies Percentage Reliance Inds. 4.06 Rural Electronic 4 ICICI Bank 3.62 Bharat Heavy Electronics 3.37 Infosys Techno. 2.9 Bharti Airtel 2.81 SBI 2.6 ITC Ltd. 2.39 Cipla 1.92 Bharat Electronic 1.86 Sources: SBI mutual fund annual report (2006-2010) . Fig4.8
  • 40. 40 Interpretation Table 4.8 shows the top 10 holdings of SBI magnum Taxgain schemes. It has invested 4.06% in Reliance industries ,4% in Rural Electrific,3.62% in ICICI Bank,3.37% in Bharat Heavy Ele,2.9% in Infosys Techno,2.81% in Bharti Airtel,2.6% in SBI,2.39 % in ITC Ltd.,1.92% in Cipla,1.86% in Bharat Electronic Table 4.9 Top 10 Holdings of SBI Magnum Global Fund Companies Percentage Remington (India) Lt 5.18 Bosch Ltd. 4.5 Asian Paints Ltd. 4.3 Bajaj Holdings & Inv 4.18 Texmaco 4.13 Glaxo Smith Kline Consu 3.95 BEML Ltd. 3.66 Divi & apos. Lab 3.58 UTV Software Common. 3.29 Oracle Financial Ser 3.19 Sources: SBI mutual fund annual report (2006-2010)
  • 41. 41 Fig 4.9 Interpretation Table 4.9 depicts the top 10 holdings of SBI magnum global fund. It has invested 5.18% in Remington Ltd., 4.5% in Bosch Ltd., 4.3% in Asian paints Ltd., 4.18% in Bajaj holdings ,4.13% in Texmacco, 3.95% in GlaxoSmithKline co.,3.66% in BEML Ltd.,3.58 % in Divi & aposis lab, 3.29 % in UTV software & 3.19% in Oracle financial ser.
  • 42. 42 Table 4.10Top 10 Holdings of SBI Magnum Children Benefit Plan companies Percentage Canara Bank 13.85 IDBI Bank Ltd. 13.84 Rural Electronic 9.74 Tata Sons 4.86 Network 18 Media & I 2.35 Bharti Airtel 1.88 Royal Orchid Hotels 1.81 ITC Ltd. 1.62 Tata Chemicals 1.34 Page Industries Ltd. 1.32 Sources: SBI mutual fund annual report (2006-2010) Fig4.10 Interpretation Table 4.10 depicts the top 10 holdings of SBI magnum children benefit plan. It has invested in 13.85% in Canara bank,13.84 % in IDBI bank ,9.74 % in Rural electric,4.86 %in Tata sons,2.35 % in Network 18 media,1.88% in Bharti airtel,1.81 % in Royal orchid hotels,1.62 % in ITC ltd,1.34% in Tata chemical,1.32 % I Page industries ltd.
  • 43. 43 Table 4.11 Current Ratio, Liquidity Ratio and Prosperity Ratio Year/ratios Current Liquidity prosperity 2005-06 3.07 1.13 0.8 2006-07 2.32 1.04 0.74 2007-08 2.02 0.79 0.74 2008-09 2.38 1.9 0.73 2009-10 3.38 3.2 0.8 Sources: SBI mutual fund annual report (2005-2010) Fig4.11 Interpretation Table 4.11 depicts the current ratio, liquidity ratio& prosperity ratio of the year 2006- 2010.In the segment of the current ratio it shows 3.07 in 2005-06 .After that it has decreasing trend till 2007-08 i.e. 2.02. But after that it starts increasing and in 2009-10 it was 3.38 which were very good sign of the SBIMF. And in liquidity ratio it was1.13 in 2005-06 .After that it has decreasing trend till 2007-08 i.e. 0.79. But after that it starts increasing and in 2009-10 it was 3.2.In the segment of prosperity ratio it was 0.8 in 2005-06 & in2009-10. In the interval of that period it decreased till 2008-09 but after that it increased.
  • 44. 44 Table 4.12 Market Value Years/schemes M. balanced fund M. children plan M. equity fund M. global fund M. taxgain scheme 2005-06 9529.41 1245.94 14374.19 13344.78 8034.43 2006-07 26750.52 1580.10 25862.10 66876.97 89327.68 2007-08 27114.93 1893.79 28276.74 136168.89 166391.47 2008-09 37105.59 2018.44 32746.70 143389.80 315481.63 2009-10 47870.74 2128.69 39422.99 123774.64 494927.94 Sources: SBI mutual fund annual report (2005-2010) Fig4.12 Interpretation Table 4.12 shows the market value of these schemes. In the case of M. balanced fund in 2005-06 it was 9529.41 cr. After that it has increasing trend till 2009-10 i.e. 47870.74 cr. in the case of M. children plan it was 1245.94 cr. In 2005-06 & then its market value goes on increase till 2009-10 . In 2009-10 it was 2128.69 cr. In 2005 -06 the market value of M. equity fund was14374.19 cr. &M. taxgain schemes 8034.43cr. After that it has increasing trend till 2009-10 i.e. 39422.94 cr. M. equity fund & 494927.94 cr. of M. taxgain schemes. The market value of M. global fund 13344.78 cr. in 2005-06 .after that it was increased till 2008-09 i.e. 143389.80.but still after it decreased to 123774.64 cr.
  • 45. 45 Table 4.13 NAV Years/schemes M. balanced fund M. children plan M. equity fund M. global fund M. taxgain scheme 2005-06 18.66 13.9 14.91 17.35 38.57 2006-07 31.44 15.97 27.84 35.26 46.07 2007-08 33.84 16.82 26.61 41.21 42.42 2008-09 40.67 18.18 33.05 45.25 51.07 2009-10 28.73 17.83 20.49 21.06 30.91 Sources: SBI mutual fund annual report (2005-2010) Fig 4.13 Interpretation Table 4.13 shows the NAV of these schemes. In 2005-06 it was 18.66 of M. balanced fund,13.90 of M. children benefit plan &17.35of M. global fund. After that all the three schemes adopted the increasing trend till 2003-09 i.e. 40.67,18.18, 45.25 of the 1st ,2nd & 4th schemes. And in 2009-10 it decreased upto 28.73,17.83 & 21.06 of the respected schemes. And in the case of M. equity fund & M. taxgain schemes it was 14.91& 38.57.After that it increased in the next year and it was 27.84 &46.07.And in 2009-10 it was 20.49 of M. equity fund & 30.91 of M. taxgain schemes.
  • 46. 46 Table 4.14 Portfolio Turnover Ratio Sources: SBI mutual fund annual report (2005-2010) Fig 4.14 Interpretation table 4.14 shows the portfolio turnover ratio. of these schemes. The ratio of M. children benefit plan is not available. M. balanced fund gives tremendous performance in 2005-06 i.e. 0.53 % & 1.29 % in 2009-10.In the mid part it first decrease till 2007-08 &in 2008-09 it start increased .The ratio of the m. equity fund 0.44 in 2005-06 and after that it decreased till 2007-08 i.e. 0.11.from that time it increased upto 2009-10 and reaches to 1.12%.the ratio of M. global fund is 0.18 % in 2005-06 and 0.23 of M. taxgain schemes. It increased in 2009-10 of global fund i.e. 1.21 and decreased of taxgain schemes i.e. 0.3. Years/schemes M. balanced fund M. children plan M. equity fund M. global fund M. taxgain scheme 2005-06 0.53 n.a 0.44 0.18 0.23 2006-07 0.24 n.a 0.12 0.13 0.06 2007-08 0.2 n.a 0.11 0.05 0.13 2008-09 0.42 n.a 0.35 0.3 0.26 2009-10 1.29 n.a 1.12 1.21 0.3
  • 47. 47 CHAPTER-5 FINDINGS & RECOMMENDATIONS Findings:-  Performance return of the SBI Magnum has given significant return in past years. The fund has given above average return in last one week, one month and three month. In last six month it has given below average return as compared to other mutual funds of same category.  Significant return has been observed its investor over the period. It has given above average return during the last one week, one month, three month.  SBI to save tax and earn. The Magnum Taxgain fund, the fund in which investor invest have given slightly above average return in last one week and has given below average return in last one month, three month, six month and one year.  The performance return of the SBI Magnum global fund has given significant return over the period. It has given above average return in last one week, one month, three month, six month, one year and five year.  It has given significant return in past years. The fund has given above average return in last one week, one month and three month SBI Magnum Equity Fund has also given significant return to its investor over the period. It has given above average return during the last one week, one month, three month SBI Magnum Taxgain fund , the fund in which investor invest to save tax and earn .  SBI Magnum global fund has given significant return over the period. It has given above average return in last one week, one month, three month, six month, one year and five year SBI Magnum Children benefit plan is unique plan for benefit of children. It has given below average return in last one week, one month. SBI Magnum Balanced Fund.  SBI Magnum Balanced Fund has invested in diversify sectors, mainly in blue chip companies. It has invested 4.06% in Reliance Industries , 4% in Rural Electrification , 3.62% in ICICI bank, 3.37% in BHEL, 2.9% Infosys Technologies, 2.81 % in Bharti Airtel, 2.6% in SBI, 2.39% in ITC, 1.92% in Cipla, 1.86% in Bharat Electronics.
  • 48. 48  The current ratio, liquidity ratio& prosperity ratio of the year 2006-2010 the current ratio it shows 3.07 in 2005-06 .After that it has decreasing trend till 2007- 08 i.e. 2.02.  The market value of these schemes in 2005-06 was 9529.41 cr. After that it has increasing trend till 2009-10 i.e. 47870.74 cr. in the case of M. children plan it was 1245.94 cr. In 2005-06 & then its market value goes on increase till 2009-10 . it was 2128.69 cr.  The NAV of these schemes in 2005-06 was 18.66 of M. balanced fund, 13.90 of M. children benefit plan &17.35of M. global fund. After that all the three schemes adopted the increasing trend till 2005-08 i.e. 40.67, 18.18, 45.25 of the 1st, 2nd & 4th schemes. And in 2009-10 it decreased upto 28.73, 17.83 & 21.06 of the respected schemes.  The net assets of balanced fund is 493.99,children plan’s 21.53,equity fund’s 392.46,global fund’s 1219.26 & the taxgain schemes’s 5297.38.Dividend is the 50 % of the balanced, equity, global fund.40% of the taxgain schemes % children benefit plan’s not available. 5.2 Recommendations:-  Keep up the brand image in the minds of the people through better performance both in the case of return as well as after sale service.  Steps should be taken to encourage the weaken areas of the SBI.  Special programs should be initiated to impart the awareness among the public.  Give more financial information to the investors so that they can take decision of their investment.  Improve the quality of agents in their job through training and give them better incentive.  Make service available at every branch of SBI for better and easy accessibility.  Increase the speed of grievance redressed facilities make it accessible to the investors.  Improve the performance of various schemes by employing better technique of investment analysis so as to generate attractive return, irrespective of the state of the market condition whether it is raising ,falling or static.  Investors Ask one’s agent to give details of different schemes and match the appropriate ones.
  • 49. 49  Investors should always keep an eye on the performance of the scheme and other good schemes as well which are available in the market for the closed comparison.  Investors should not invest blindly in the investments before going through the fact sheets, annual reports etc. of the company since ,according to the guidelines of the SEBI, the AMCs are bound to disclose all the relevant data that is necessary for the investment purpose by the investor.  Companies should Set up separate customer care divisions where the customers can any time pose their query, regarding the scheme or the current NAV etc. These customer care units can work out in accordance with the requirements of the customer and facilitate him to choose the scheme that suits his financial requirements.  Companies should Conduct seminars or programs on about mutual funds where each and every minute information about the product is outlined including the risk factor associated with the different classes of assets.  Companies should Choose appropriate media ,newspaper/magazines, T.V. commercials, etc. for marketing the product and educate the masses.
  • 50. 50 BIBLIOGRAPHY BOOKS:  Kothari C.R., Research Methodology, Vishwas Parkashan, New Delhi, 1990.  Tripathy, Nalini Prava, “Mutual fund in India: Emerging issues,” Excel books, New Delhi, 2007. ARTICLES 1. Morey, M. (2005), “ Morningstar Mutual Fund Star Rating”, A survey available at SSRN: http :/ssrn.com/ abstract, accessed on April 8, 2010. 2. Mamaysky, Harry, Mathew Spiegel, and Hong Zhang (2006), “improved forecasting of Mutual Fund Alphas and Betas”, A survey available at SSRN: http :/ssrn.com/abstract, accessed on April 10, 2010. 3. Narayanan, M.P., Nanda, Vikram K. and Warther, Vincent A. (1997), “Liquidity, Investment Ability, and Mutual Fund Structure”, A survey available at SSRN :http :/ssrn.com/abstract, accessed on April 13, 2010. 4. Verma, Meenu (2004), “Investing in Mutual Funds when Returns are Predictable”, A survey available at SSRN : http :/ssrn.com/abstract, accessed on April on 15, 2010. 5. Ding, B and R. Wermers (2005), “The investment value of Mutual Fund Portfolio Disclosure”, A Survey available at SSRN :http :/ssrn.com/abstract, accessed on April on 18,2010. JOURNALS  Capital Market  Finance India  Business Today WEBSITES  www.moneycontrol.com  www.sbimf.com  http://www.wellsfargoadvantagefunds.com/wfweb/wf/splash/ittr.jsp  http://www.mfea.com/NewsCommentary/Commentary/Fidelity10.25.07.asp  www.moneycontrol.com  www.investments.com.ph