Download to read offline
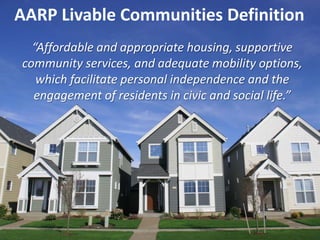
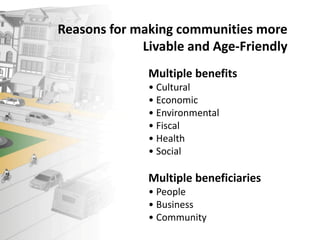
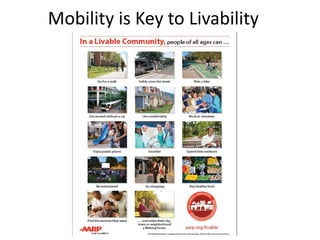
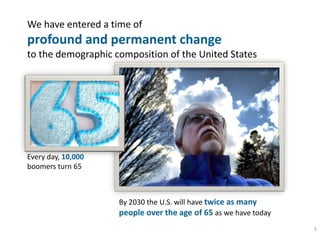
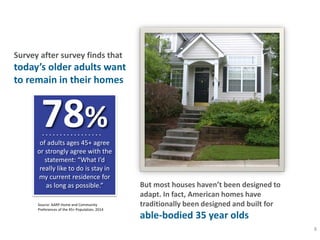
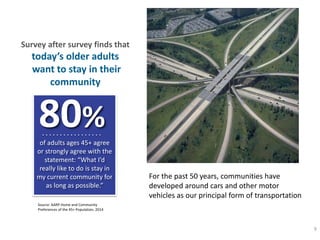
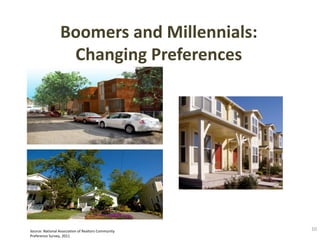
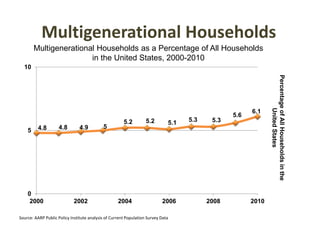
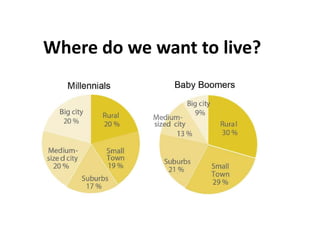
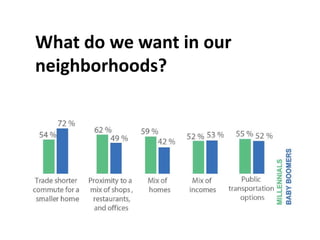
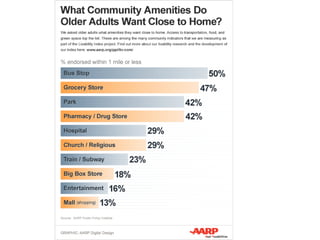
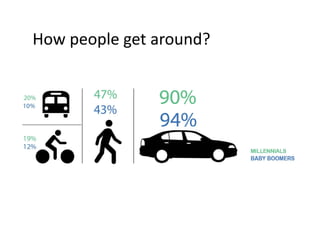
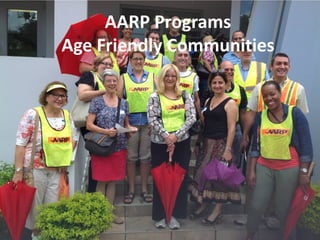
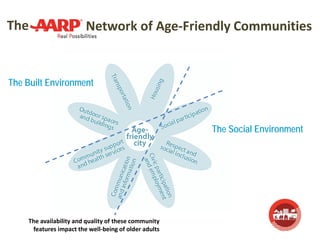
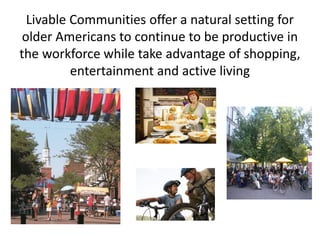


The document discusses making communities more livable and age-friendly. It notes that by 2030, the U.S. will have twice as many people over 65 as today. Surveys find that older adults want to remain in their homes and communities as long as possible. The document promotes age-friendly community programs and policies that support mobility, housing, community engagement and other features to improve quality of life for people of all ages. AARP works with communities through its Network of Age-Friendly Communities initiative to encourage walkable neighborhoods, transportation options and other livability factors.


