A Tale of Two Cows
•
0 likes•893 views

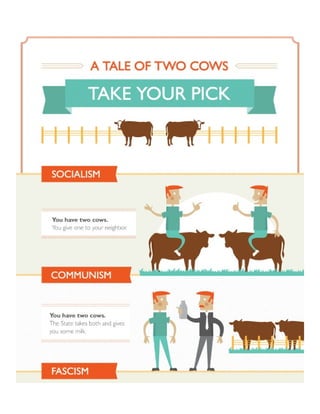
This infographic uses two cows as a medium for explaining the various types of socio-economic systems.
Report
Share
Report
Share
Download to read offline
Recommended
B2B Marketers: How to Solve Your Top 4 Content Hurdles
[Webinar Slides] Today’s buyers have a strong appetite for useful and relevant information, but at the same time, resistance to being 'sold to'. The buyer's journey is up to 70% complete by the time they're ready to speak to Sales. So what's happening within that 70% of the journey? The answer is content consumption.
Forrester's Ryan Skinner on How to Optimize the Two Types of Content Marketing
ScribbleLive and Forrester Research Senior Analyst Ryan Skinner discuss how to optimize for the two types of content marketing.
6 Steps to Create a Robust Calendar
93% of organizations use social media to boost their content marketing efforts, but only 66% say it's effective. Creating and sourcing content that connects with your audiences for your social media calendar can be challenging, but paving a clear roadmap can ensure your content is accountable.
Join ScribbleLive and Sprout Social as we take a closer look at:
- How to manage content together with a social media and editorial calendar
- Scalable ways of content creation
- What KPIs you should really be tracking
What Content Do Consumers Really Want?
Less than 40% of marketers describe their content marketing programs as effective. To help understand what consumers want from their content, we conducted an in-depth consumer survey and used ScribbleLive Insights to analyze the effectiveness of a number of top brands.
In this presentation, Ural Cebeci and Larry Levy walk you through everything from consumers’ favorite content type (social media), to how much they trust branded content (44% don’t) and which brands are getting it right.
How Email and Great Content Can Fuel Your Buyer's Journey
Inboxes are being flooded by a constant stream of information - some useful, others less so. Your email list is a built in audience, but how do you get their attention?
Join us and Jamie Bradley of Emma, as we break down the customer lifecycle to show you how to optimize your content creation in order to engage and drive action from your audience.
This webinar covers:
The customer lifecycle and how you can and should segment your messaging
Best practices for crafting your editorial calendar
What type of content your emails should include and how to scale production
And more!
How to Become a Stronger Storyteller
Visually partnered with Tint to bring you this webinar on the power of storytelling and how you can use storytelling to take your marketing to the next level.
How We Create High-Impact Content at Visually
Join Bradley Joe and David Wyant to see how Visually makes engaging, beautiful visual content fast and affordable. We'll cover:
- Our talented freelancer network
- Our streamlined process
- Advanced collaboration tools
- Best practices for running successful projects
- A sneak peak into upcoming features
Using Every Part of the Buffalo Webinar: How to Get More Mileage Out of Your ...
Webinars, reports, and videos can take weeks or months to create. So how do you make sure you get the most out of effort and resources you put into your big bets?
Led by Visually’s CEO, Matt Cooper, this webinar will walk you through his approach to “using every part of the buffalo" when you create visual content, including:
- Best practices and examples on how to turn tent-pole content into derivative content
- How to employ visual content across your buyer’s journey
- How to effectively scale visual content production
Marketers vs Creatives: Communication Breakdown
This presentation takes a deep dive into our original research into how marketers and creatives come up short when it comes to working together.
In this webinar you'll learn:
- How content marketers use content
- Detailed stats on the creative-marketer relationship
- How to execute effective creative briefs and kick-offs
Creating Charts for Presentations
Charts are one of the best ways to get your point across.. They are a great form of visual communication because they show the trend or pattern in data, along with the data itself. Because the data that leads to a conclusion is shown alongside that conclusion, they are highly convincing if done right.
Isn't It Time to Put Your Ad Agency Out To Pasture?
Traditional, dyed-in-the-wool advertising agencies are all but pushing up the daises. They have had their heyday, been a little mad and bullish, but now technology and new skills are causing agencies to topple from their high-ground. More often than not, companies will bypass ad agencies and directly and digitally recruit the skilled teams they need. How are you telling your brand's story?
Creating Great Infographics & Visual Content
Despite the glut of infographics for content marketing, a great piece of visual content still inspires and engages audiences. The problem is not so much that visuals don't work (they do!) but that poorly constructed content ends up being less effective for marketing, lead generation, brand awareness, and brand journalism.
This presentation is a look at what makes great infographics / visual content, including examples, use cases, inspiration for what you can create, and starting points for storytelling and content strategy.
*** Available as a downloadable .PDF by clicking "Save" at the top. Examples are hyperlinked in the document.
Why Startups Fail
Building a successful business is every entrepreneur's goal - but only 1 in 12 succeed. Why do startups fail? The Startup Genome project analyzed data from 3,200 companies and came up with some answers. At the core of any successful business are two things: a good product and a large market for that product. In other words, a startup should be able to scale. And to scale properly, it must balance the growth of five core dimensions: customers, product, team, business model, and funding. The dominant reason for failure: premature scaling of one or more of those dimensions. View the infographic for more!
Patent Wars
The patent wars in the US Tech Industry are rampant. It's difficult to keep track of so many lawsuits and patent sales, but this infographic can clear things up.
How Long Does it Take to Build an App?
“How long does it take to build a mobile app?” While the question isn’t as timeless as “How many licks does it take to get to the center of a Tootsie Pop?” (spoiler alert: 3481), it is one that’s very dear to our community of mobile app developers. And now we’ve got an answer ... check out the infographic to find out what it is.
Cuts of Beef
An easy-to-use guide to cuts of beef. The chart shows where each cut of meat comes from on the cow, how much it costs and how to best cook it.
What's Smaller Than Apple?
This Apple infographic examines the comparison of Apple's impressive $370 billion market cap to other industries and valuations.
The Impact of Zell
The Zell Entrepreneurship Program is a venture creation program for outstanding undergraduate students at the Interdisciplinary Center of Herzliya. The impact on the start-up world that the program has had is one to reckon with. Zell has produced 63 founders of startup companies and 24 CEOs whom have dreamed up 64 ventures that've lead to 28 registered companies, including Wibiya, Walyou and Picapp, to name a few. These ventures have reached many users in various ways, including 100 million photographs protected by PicScout, 200 apps created by Ono Apps, 1 million registered travelers on Gogobot and over 4 million gift recipients through the gift project.
The Speed of Language
Ever wondered why some languages sound like they're spoken much faster than others? Yet, in dubbed movies the words seemingly fit the actors' mouth movement. That's what researchers at Universite de Lyon wanted to explain when they set out to research one phenomenon: the speed of language. This infographics shows how they did it, and what they found.
What Are The Odds?
What are the odds that you exist, as you, today? Author Ali Binazir attempts to quantify the probability that you came about and exist as you today and reveals that the odds of you existing are almost zero.
Responsive Information Design
A primer on responsive information design.
More here: http://blog.visual.ly/responsive-information-design
Infographics and Virality
Visual.ly Creative Director Jess Bachman dissects what makes an infographic become viral. Video: http://www.youtube.com/watch?v=0gbuCMr4iEs
Introduction to D3
Presentation by Joe Golike, designer at Trulia, for Visual.ly's meetup, The Introductory D3 Workshop for Beginners.
Making Meaning Through Infographic Design
Sofya Yampolsky's presentation for Visual.ly's Designer Meetup: The skills needed to design great data visualizations.
Resolutions-Key-Interventions-28-May-2024.pdf
‘वोटर्स विल मस्ट प्रीवेल’ (मतदाताओं को जीतना होगा) अभियान द्वारा जारी हेल्पलाइन नंबर, 4 जून को सुबह 7 बजे से दोपहर 12 बजे तक मतगणना प्रक्रिया में कहीं भी किसी भी तरह के उल्लंघन की रिपोर्ट करने के लिए खुला रहेगा।
Letter-from-ECI-to-MeiTY-21st-march-2024.pdf
भारत सरकार द्वारा बड़े पैमाने पर व्हाट्सएप अभियान चलाए जाने से डेटा गोपनीयता, नैतिकता और चुनावों की निष्पक्षता पर सवाल उठते हैं।
EED - The Container Port PERFORMANCE INDEX 2023
El Puerto de Algeciras continúa un año más como el más eficiente del continente europeo y vuelve a situarse en el “top ten” mundial, según el informe The Container Port Performance Index 2023 (CPPI), elaborado por el Banco Mundial y la consultora S&P Global.
El informe CPPI utiliza dos enfoques metodológicos diferentes para calcular la clasificación del índice: uno administrativo o técnico y otro estadístico, basado en análisis factorial (FA). Según los autores, esta dualidad pretende asegurar una clasificación que refleje con precisión el rendimiento real del puerto, a la vez que sea estadísticamente sólida. En esta edición del informe CPPI 2023, se han empleado los mismos enfoques metodológicos y se ha aplicado un método de agregación de clasificaciones para combinar los resultados de ambos enfoques y obtener una clasificación agregada.
Sharjeel-Imam-Judgement-CRLA-215-2024_29-05-2024.pdf
पीठ ने ट्रायल कोर्ट के आचरण की भी आलोचना की और कहा कि कोई भी चीज आरोपी को सीआरपीसी की धारा 436-ए के तहत राहत मांगने से वंचित नहीं कर सकती
More Related Content
More from Visually
Using Every Part of the Buffalo Webinar: How to Get More Mileage Out of Your ...
Webinars, reports, and videos can take weeks or months to create. So how do you make sure you get the most out of effort and resources you put into your big bets?
Led by Visually’s CEO, Matt Cooper, this webinar will walk you through his approach to “using every part of the buffalo" when you create visual content, including:
- Best practices and examples on how to turn tent-pole content into derivative content
- How to employ visual content across your buyer’s journey
- How to effectively scale visual content production
Marketers vs Creatives: Communication Breakdown
This presentation takes a deep dive into our original research into how marketers and creatives come up short when it comes to working together.
In this webinar you'll learn:
- How content marketers use content
- Detailed stats on the creative-marketer relationship
- How to execute effective creative briefs and kick-offs
Creating Charts for Presentations
Charts are one of the best ways to get your point across.. They are a great form of visual communication because they show the trend or pattern in data, along with the data itself. Because the data that leads to a conclusion is shown alongside that conclusion, they are highly convincing if done right.
Isn't It Time to Put Your Ad Agency Out To Pasture?
Traditional, dyed-in-the-wool advertising agencies are all but pushing up the daises. They have had their heyday, been a little mad and bullish, but now technology and new skills are causing agencies to topple from their high-ground. More often than not, companies will bypass ad agencies and directly and digitally recruit the skilled teams they need. How are you telling your brand's story?
Creating Great Infographics & Visual Content
Despite the glut of infographics for content marketing, a great piece of visual content still inspires and engages audiences. The problem is not so much that visuals don't work (they do!) but that poorly constructed content ends up being less effective for marketing, lead generation, brand awareness, and brand journalism.
This presentation is a look at what makes great infographics / visual content, including examples, use cases, inspiration for what you can create, and starting points for storytelling and content strategy.
*** Available as a downloadable .PDF by clicking "Save" at the top. Examples are hyperlinked in the document.
Why Startups Fail
Building a successful business is every entrepreneur's goal - but only 1 in 12 succeed. Why do startups fail? The Startup Genome project analyzed data from 3,200 companies and came up with some answers. At the core of any successful business are two things: a good product and a large market for that product. In other words, a startup should be able to scale. And to scale properly, it must balance the growth of five core dimensions: customers, product, team, business model, and funding. The dominant reason for failure: premature scaling of one or more of those dimensions. View the infographic for more!
Patent Wars
The patent wars in the US Tech Industry are rampant. It's difficult to keep track of so many lawsuits and patent sales, but this infographic can clear things up.
How Long Does it Take to Build an App?
“How long does it take to build a mobile app?” While the question isn’t as timeless as “How many licks does it take to get to the center of a Tootsie Pop?” (spoiler alert: 3481), it is one that’s very dear to our community of mobile app developers. And now we’ve got an answer ... check out the infographic to find out what it is.
Cuts of Beef
An easy-to-use guide to cuts of beef. The chart shows where each cut of meat comes from on the cow, how much it costs and how to best cook it.
What's Smaller Than Apple?
This Apple infographic examines the comparison of Apple's impressive $370 billion market cap to other industries and valuations.
The Impact of Zell
The Zell Entrepreneurship Program is a venture creation program for outstanding undergraduate students at the Interdisciplinary Center of Herzliya. The impact on the start-up world that the program has had is one to reckon with. Zell has produced 63 founders of startup companies and 24 CEOs whom have dreamed up 64 ventures that've lead to 28 registered companies, including Wibiya, Walyou and Picapp, to name a few. These ventures have reached many users in various ways, including 100 million photographs protected by PicScout, 200 apps created by Ono Apps, 1 million registered travelers on Gogobot and over 4 million gift recipients through the gift project.
The Speed of Language
Ever wondered why some languages sound like they're spoken much faster than others? Yet, in dubbed movies the words seemingly fit the actors' mouth movement. That's what researchers at Universite de Lyon wanted to explain when they set out to research one phenomenon: the speed of language. This infographics shows how they did it, and what they found.
What Are The Odds?
What are the odds that you exist, as you, today? Author Ali Binazir attempts to quantify the probability that you came about and exist as you today and reveals that the odds of you existing are almost zero.
Responsive Information Design
A primer on responsive information design.
More here: http://blog.visual.ly/responsive-information-design
Infographics and Virality
Visual.ly Creative Director Jess Bachman dissects what makes an infographic become viral. Video: http://www.youtube.com/watch?v=0gbuCMr4iEs
Introduction to D3
Presentation by Joe Golike, designer at Trulia, for Visual.ly's meetup, The Introductory D3 Workshop for Beginners.
Making Meaning Through Infographic Design
Sofya Yampolsky's presentation for Visual.ly's Designer Meetup: The skills needed to design great data visualizations.
More from Visually (18)
Using Every Part of the Buffalo Webinar: How to Get More Mileage Out of Your ...
Using Every Part of the Buffalo Webinar: How to Get More Mileage Out of Your ...
The Art of Visual Content and the Science that Makes It Convert
The Art of Visual Content and the Science that Makes It Convert
Isn't It Time to Put Your Ad Agency Out To Pasture?
Isn't It Time to Put Your Ad Agency Out To Pasture?
Recently uploaded
Resolutions-Key-Interventions-28-May-2024.pdf
‘वोटर्स विल मस्ट प्रीवेल’ (मतदाताओं को जीतना होगा) अभियान द्वारा जारी हेल्पलाइन नंबर, 4 जून को सुबह 7 बजे से दोपहर 12 बजे तक मतगणना प्रक्रिया में कहीं भी किसी भी तरह के उल्लंघन की रिपोर्ट करने के लिए खुला रहेगा।
Letter-from-ECI-to-MeiTY-21st-march-2024.pdf
भारत सरकार द्वारा बड़े पैमाने पर व्हाट्सएप अभियान चलाए जाने से डेटा गोपनीयता, नैतिकता और चुनावों की निष्पक्षता पर सवाल उठते हैं।
EED - The Container Port PERFORMANCE INDEX 2023
El Puerto de Algeciras continúa un año más como el más eficiente del continente europeo y vuelve a situarse en el “top ten” mundial, según el informe The Container Port Performance Index 2023 (CPPI), elaborado por el Banco Mundial y la consultora S&P Global.
El informe CPPI utiliza dos enfoques metodológicos diferentes para calcular la clasificación del índice: uno administrativo o técnico y otro estadístico, basado en análisis factorial (FA). Según los autores, esta dualidad pretende asegurar una clasificación que refleje con precisión el rendimiento real del puerto, a la vez que sea estadísticamente sólida. En esta edición del informe CPPI 2023, se han empleado los mismos enfoques metodológicos y se ha aplicado un método de agregación de clasificaciones para combinar los resultados de ambos enfoques y obtener una clasificación agregada.
Sharjeel-Imam-Judgement-CRLA-215-2024_29-05-2024.pdf
पीठ ने ट्रायल कोर्ट के आचरण की भी आलोचना की और कहा कि कोई भी चीज आरोपी को सीआरपीसी की धारा 436-ए के तहत राहत मांगने से वंचित नहीं कर सकती
31052024_First India Newspaper Jaipur.pdf
Find Latest India News and Breaking News these days from India on Politics, Business, Entertainment, Technology, Sports, Lifestyle and Coronavirus News in India and the world over that you can't miss. For real time update Visit our social media handle. Read First India NewsPaper in your morning replace. Visit First India.
CLICK:- https://firstindia.co.in/
#First_India_NewsPaper
01062024_First India Newspaper Jaipur.pdf
Find Latest India News and Breaking News these days from India on Politics, Business, Entertainment, Technology, Sports, Lifestyle and Coronavirus News in India and the world over that you can't miss. For real time update Visit our social media handle. Read First India NewsPaper in your morning replace. Visit First India.
CLICK:- https://firstindia.co.in/
#First_India_NewsPaper
03062024_First India Newspaper Jaipur.pdf
Find Latest India News and Breaking News these days from India on Politics, Business, Entertainment, Technology, Sports, Lifestyle and Coronavirus News in India and the world over that you can't miss. For real time update Visit our social media handle. Read First India NewsPaper in your morning replace. Visit First India.
CLICK:- https://firstindia.co.in/
#First_India_NewsPaper
2024 is the point of certainty. Forecast of UIF experts
2024 is the point of certainty. Forecast of UIF experts
What Ukraine Has Lost During Russia’s Invasion
An astonishing, first-of-its-kind, report by the NYT assessing damage in Ukraine. Even if the war ends tomorrow, in many places there will be nothing to go back to.
Recently uploaded (14)
Sharjeel-Imam-Judgement-CRLA-215-2024_29-05-2024.pdf
Sharjeel-Imam-Judgement-CRLA-215-2024_29-05-2024.pdf
2024 is the point of certainty. Forecast of UIF experts
2024 is the point of certainty. Forecast of UIF experts