This document discusses how to tie a micro inventory forecast to a macro sales forecast. It explains that applying a business trend factor (BTF) ratio calculated from the two forecasts can align the forecasts. The BTF ratio is applied to adjust reorder points and economic order quantities for individual parts forecasts. This ensures inventory generation matches the overall sales forecast. The author provides an example of how to calculate and apply the BTF ratio to reconcile differences between a sample micro inventory forecast of $2,033.93 and a macro sales forecast of $3,000.
Advanced Management Accounting Paper for IPCCseomiamia
Mia Mia is one of the best listing website for IPCC Classes in Mumbai. We are also known for our systematic listing of various IPCC, CA Final and CPT CLasses in Mumbai. QLI is a class where each student is our priority. We are one of the best listing website for CA Classes in Mumbai.
Comparing Major Party PlatformsUsing the party platforms provide.docxdonnajames55
Comparing Major Party Platforms
Using the party platforms provided in the “Session 11: Assignments and Assessments” folder, compare and contrast the Democratic Party, Republican Party and a chosen third party on major issues. In order to receive full credit you should be able to fill out 80% of the boxes (31/39). If one of the platforms does not include any information on a particular subject you may type N/A into the box. Save the completed chart and submit it.
Democratic Platform
Republican Platform
Third Party
____________________
Abortion
Education
Energy
Environment
Government
Gun Control
Health Care
Immigration
National Security
Retirement Security
Science and Technology
Taxes
Values
1 Sales Forecast
As shown in the Products sales for 2012, the monthly average units sold and selling price for screwdriver are 60,000 and $100, for saws are 40,000 and $125.
Although Lipscomb suggested that use the numbers in some bestselling month, these numbers are not proper to forecast the whole year sales. Sold units in summer months are much higher than in other months, so we need to consider how to balance the best season and the worst season.
In 2013, Harvey’s sales forecast should be based on the average number rather than the best numbers as Lipscomb recommended.
Sales Forecast for 2013
Screwdrivers
Saws
Units
720,000
480,000
Price
$100
$125
Total
72,000,000
60,000,000
2 Purchases budget (raw materials, labor, all resources)
To meet the units supposed to be sold in 2013, Harvey’s will need:
Metal: 5* 720,000+ 4* 480,000= 5,520,000 lb
Plastic: 3* 72,000+ 3* 480,000= 3,600,000 lb
Handles: 1* 720,000= 720,000 units
Labor cost: 2* 720,000* 12+ 3* 480,000* 16= $40,320 000
Variable OH= 2* 720,000* 1.5+ 3* 480,000* 1.5= $4,320,000
To meet the inventory requirement for 2013, Harvey’s need to:
Make Screwdrivers for: 25,000- 20,000+ 720,000= 725,000 units
Make Saws for: 10,000- 8,000+ 480,000= 482,000 units
And need to purchase:
36,000- 320,000+ 5,520,000= 5,236,000 lbs of metal
32,000- 29,000+ 3,600,000= 3,603,000 lbs of plastic
7,000- 6,000+ 720,000= 721,000 units of handle
Raw Material Purchase Budget
DM
Units
Unit cost
Cost
Metal
5,260,000
Lbs
$8
$42,080,000
Plastic
3,603,000
Lbs
$5
$18,015,000
Handles
721,000
Unit
$3
$2,163,000
Total DM
$62,258,000
Direct Labor Cost
Units (hrs)
Unit Cost
Cost
Screwdriver
1,450,000
12
17,400,000
Saws
1,446,000
16
23,136,000
Total
40,536,000
Variable Manufacturing OH Cost
Units (hrs)
Unit Cost
Cost
Screwdriver
1,450,000
1.5
2,175,000
Saws
1,446,000
1.5
2,169,000
Total
2,896,000
4,344,000
Total Budgeted Variable Manufacturing Cost= 4,344,000+ 40,536,000+ 62,258,000= 107,138,000
Operating Expenses
All other Expenses:
Fixed Manufacturing OH+ Non-cash Expenditures= 214,000- 156,000= 58,000
Annually Selling and administrative expenses= 340,000* 4= 1,360,000 (including 90,000* 4= 360,000 of depreciation)
Harvey’s Budgeted Income Statement
Sales
132,000,00.
Investment on Fixed Assets PowerPoint Presentation SlidesSlideTeam
This complete deck can be used to present to your team. It has PPT slides on various topics highlighting all the core areas of your business needs. This complete deck focuses on Investment On Fixed Assets PowerPoint Presentation Slides and has professionally designed templates with suitable visuals and appropriate content. This deck consists of total of twenty four slides. All the slides are completely customizable for your convenience. You can change the colour, text and font size of these templates. You can add or delete the content if needed. Get access to this professionally designed complete presentation by clicking the download button below. http://bit.ly/381e18A
EGT267 Programming for Engineering Applications Spring 2020 .docxgidmanmary
EGT267 Programming for Engineering Applications Spring 2020
1
EGT 267 HW-1 (Due on February 20 in the class)
PROGRAMMIING ENGINEERING PROBLEMS
Problem 1: (Conversions) This problem involves converting a value in one unit to a value in
another unit. The program should prompt the user for a value in the specified units and then print
the converted value, along with the new units.
(1) Write a program to convert pounds to kilograms. (Recall that 1 kg = 2.205 lb). The pound
value you input/test is 159 lb.
Problem 2: (Areas and Volumes) This problem involves computing an area or a volume using
input from the user. The program should include a prompt to the user to enter the variables needed.
(1) Write a program to compute the area of a triangle with base b and height h. (Recall that
Aerea = ½* (b * h). ) The b and h values are 1.8 and 6.7 meters, respectively.
Problem 3: (Wind Tunnels) A wind tunnel is a test chamber built to generate different wind
speeds, or Mach numbers (which is the wind speed divided by the speed of sound). Accurate scale
models of aircraft can be mounted on force-measuring supports in the test chamber, and then
measurements of the forces on the model can be made at many different wind speeds and angles.
At the end of an extended wind tunnel test, many sets of data have been collected and can be used
to determine the coefficient of lift, drag, and other aerodynamic performance characteristics of the
new aircraft at its various operational speeds and positions. Data collected from a wind tunnel test
are listed in the following table:
EGT267 Programming for Engineering Applications Spring 2020
2
Assume that we would like to use linear interpolation to determine the coefficient of lift for
additional flight-path angles that are between -4 degrees and 21 degrees (Let’s estimate the
coefficient of lift @ 9 flight-path angle degrees). Write a program that allows the user to enter the
data for two points and a flight-path angle between those points. The program should then compute
the corresponding coefficient of lift.
Homework requirements:
please take two screenshots (one screen shot is for your code; the other is for the results), copy &
past them into your homework, and then submit a hard copy.
Sheet1MAC 7200, CASE STUDY WEEK 61) BREAK EVEN POINTA) IN UNITSSales Revenue16.00 Variable Materials3.00 Variable Labor1.00 Variable Overhead3.50 Variable Marketing Costs1.50Total Variable Costs:9.00CONTRIBUTION MARGIN PER UNIT7.0044%Fixed overhead4.00Fixed Marketing costs2.00Total Fixed Costs6.00BREAK EVEN POINT IN UNITS = FIXED COSTS / CONTRIBUTION MARGIN PER UNITEQUATION16N - 9N - 90,000 = 0Fixed Costs:90,000.007N = 90000CONTRIBUTION MARGIN PER UNIT7.00BREAK EVEN POINT IN UNITS12,857N=B) BREAK EVEN IN DOLLARSUNITS BREAKEVEN12,857SALES PRICES$ 16.00BREAK EVEN IN DOLLARS$ 205,712.00Combined2. SPECIAL ORDER ANALYSISremainder of ca ...
Week 1 AssignmentCIS290v61University of Phoenix Materia.docxcelenarouzie
Week 1 Assignment
CIS/290v6
1
University of Phoenix MaterialPart 1: Computer Research
Moore’s Law states that the number of transistors on a computer chip doubles every two years. This means that the power, speed, and application of computers are ever increasing. Along with these changes in performance, software is also improving and constantly pushing a computer’s capabilities to the edge.
As a computer technician, you must constantly stay up-to-date with these changes in technology. This includes understanding the dynamics of hardware and software and how they interact with each other. To stay current, you must include research as a necessary part of your job. With rapid changes going on in the computer industry, a technician needs to build a trusted network of information resources that includes websites, periodicals, and industry professionals.
Computer benchmark tests and tools are other resources you can turn to for computer information. In a benchmark test, the performance of a software application is measured when one brand of a hardware component is placed inside a computer. By using the same application and computer for each test, different brands of a component can then be compared with one another, allowing you to choose the best brand for the job at the price you want to pay. Benchmarks are a good way to get you started with your research. You will be using them throughout this course.
To help you get started, here are some helpful websites:
· www.pricewatch.com: This is a helpful site to check pricing; however, be sure to look at the condition of the product. It can be listed as new or refurbished.
· www.tomshardware.com and www.kingston.com: These are benchmark sites to check out product performance.
· www.pcworld.com: This is a popular site for information and product reviews.
· www.ifixit.com and www.macfixit.com: These are helpful sites for troubleshooting.
Keep in mind that these are just a few of the many sites available for computer technicians. As you continue gaining experience, you develop your own network of trusted information resources.
Activity: Information Research
Begin your research by searching the Internet for additional websites, not mentioned previously, which offer pricing, technical reviews, and troubleshooting for computers and computer components. Enter these websites into the charts below and provide a succinct description of the website.
Price Check Sites
Identify three price check sites and provide a description summary of what the site provides.
Website URL
Summary Description
Product Review Sites
Identify three product review sites and provide a description summary of what the site provides.
Website URL
Summary Description
Troubleshooting Sites
Identify three troubleshooting sites and provide a description summary of what the site provides.
Website URL
Summary Description
Part 2: Comparing Computers Worksheet
Computers range in price and options the same way as many ot.
Complete the following questions on cost function 1.Write the.docxladonnacamplin
Complete the following questions on cost function:
1.
Write the cost function resulting from your regression results. Include specific coefficients.
2.
Estimate the total, average, and marginal costs for a firm with a quantity sold of 60,000 units.
3.
Is a firm operating at the point identified in question 2 operating at a profit-maximizing level of output? How do you know? If they are not, should they expand or reduce quantity sold to move closer to the profit maximization level? Explain your reasoning.
4.
Estimate the average cost for a firm with a quantity sold of 70,000 units. Compare your answer with the answer to question #2 above. Does the manufacturer appear to have economies of scale? How do you know?
Please let me know if you can help, and make sure the calculations show on the spreadsheet.
The spreadsheet must be organized as follows:
·
Tab 2: Original data
·
Tab 5: Output and answers to questions for cost function (Copy the data necessary to the top of this spreadsheet before running the regression.)
Data
Total cost = sum of all costs of doing business
Q sold = the quantity sold (in units) that quarter
Q prod = the quantity produced (in units) that quarter
Q dem = the quantity demanded (in units) that quarter
Price = price per unit charged by the firm
Labor = # labor hours used in production in that quarter. For purposes of this assignment, assume that all labor hours are identical.
Capital Investment = the number of plants in operation that quarter. Assume for the sake of this project, that all plants are approximately equal in size and use of technology.
Advertising Expenses = dollars spent on advertising that quarter
Capital
Consumer
Advertising
TC
Qsold
Qprod
Qdem
Price
Labor
Invest
Income
Expenses
Qtr 1
$4,415,000
499,999
499,999
549,425
$9.25
50,000
5
$20,000
$150,000
Qtr 2
$5,186,644
587,236
587,236
714,993
$9.25
60,000
5
$20,600
$150,000
Qtr 3
$5,174,189
548,667
647,480
548,667
$9.75
70,000
5
$21,000
$125,000
Qtr 4
$7,282,201
766,297
667,484
833,521
$9.65
75,000
5
$21,200
$200,000
Qtr 5
$7,630,401
811,784
811,764
860,747
$9.90
85,000
6
$21,400
$200,000
Qtr 6
$6,971,144
697,396
828,822
697,396
$10.25
95,000
6
$22,000
$150,000
Qtr 7
$7,915,228
715,182
829,046
829,046
$11.50
100,000
6
$21,600
$325,000
Qtr 8
$6,901,834
764,199
769,903
769,903
$10.00
75,000
6
$21,600
$150,000
Qtr 9
$7,719,569
811,784
811,784
811,784
$10.05
85,000
6
$21,600
$225,000
Qtr 10
$4,011,162
425,280
656,281
656,281
$10.75
60,000
6
$21,200
$125,000
Qtr 11
$8,688,700
744,619
829,046
829,046
$11.76
100,000
6
$22,000
$400,000
Qtr 12
$8,780,822
673,009
1,106,471
1,103,171
$12.35
140,000
8
$22,000
$400,000
.
My name is Dainty J. I am associated with economicsexamhelp.com for the past 11 years and have been helping the economics students with their Business decision Making Exam. I have a Masters in Economics from University of Illinois, USA
06-04-2024 - NYC Tech Week - Discussion on Vector Databases, Unstructured Data and AI
Discussion on Vector Databases, Unstructured Data and AI
https://www.meetup.com/unstructured-data-meetup-new-york/
This meetup is for people working in unstructured data. Speakers will come present about related topics such as vector databases, LLMs, and managing data at scale. The intended audience of this group includes roles like machine learning engineers, data scientists, data engineers, software engineers, and PMs.This meetup was formerly Milvus Meetup, and is sponsored by Zilliz maintainers of Milvus.
Show drafts
volume_up
Empowering the Data Analytics Ecosystem: A Laser Focus on Value
The data analytics ecosystem thrives when every component functions at its peak, unlocking the true potential of data. Here's a laser focus on key areas for an empowered ecosystem:
1. Democratize Access, Not Data:
Granular Access Controls: Provide users with self-service tools tailored to their specific needs, preventing data overload and misuse.
Data Catalogs: Implement robust data catalogs for easy discovery and understanding of available data sources.
2. Foster Collaboration with Clear Roles:
Data Mesh Architecture: Break down data silos by creating a distributed data ownership model with clear ownership and responsibilities.
Collaborative Workspaces: Utilize interactive platforms where data scientists, analysts, and domain experts can work seamlessly together.
3. Leverage Advanced Analytics Strategically:
AI-powered Automation: Automate repetitive tasks like data cleaning and feature engineering, freeing up data talent for higher-level analysis.
Right-Tool Selection: Strategically choose the most effective advanced analytics techniques (e.g., AI, ML) based on specific business problems.
4. Prioritize Data Quality with Automation:
Automated Data Validation: Implement automated data quality checks to identify and rectify errors at the source, minimizing downstream issues.
Data Lineage Tracking: Track the flow of data throughout the ecosystem, ensuring transparency and facilitating root cause analysis for errors.
5. Cultivate a Data-Driven Mindset:
Metrics-Driven Performance Management: Align KPIs and performance metrics with data-driven insights to ensure actionable decision making.
Data Storytelling Workshops: Equip stakeholders with the skills to translate complex data findings into compelling narratives that drive action.
Benefits of a Precise Ecosystem:
Sharpened Focus: Precise access and clear roles ensure everyone works with the most relevant data, maximizing efficiency.
Actionable Insights: Strategic analytics and automated quality checks lead to more reliable and actionable data insights.
Continuous Improvement: Data-driven performance management fosters a culture of learning and continuous improvement.
Sustainable Growth: Empowered by data, organizations can make informed decisions to drive sustainable growth and innovation.
By focusing on these precise actions, organizations can create an empowered data analytics ecosystem that delivers real value by driving data-driven decisions and maximizing the return on their data investment.
Explore our comprehensive data analysis project presentation on predicting product ad campaign performance. Learn how data-driven insights can optimize your marketing strategies and enhance campaign effectiveness. Perfect for professionals and students looking to understand the power of data analysis in advertising. for more details visit: https://bostoninstituteofanalytics.org/data-science-and-artificial-intelligence/
【社内勉強会資料_Octo: An Open-Source Generalist Robot Policy】
7 the business trend factor
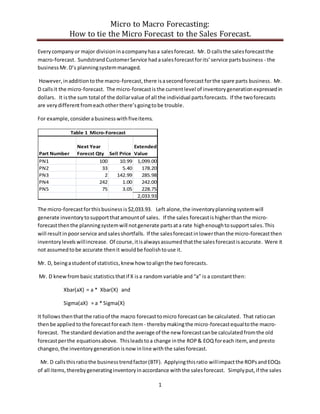
1. Micro to Macro Forecasting:
How to tie the Micro Forecast to the Sales Forecast.
1
Everycompany or major divisioninacompanyhasa salesforecast. Mr. D callsthe salesforecastthe
macro-forecast. SundstrandCustomerService hadasalesforecastforits’service partsbusiness - the
business Mr.D’s planningsystemmanaged.
However,inadditiontothe macro-forecast,there isasecondforecast forthe spare parts business. Mr.
D callsit the micro-forecast. The micro-forecastis the currentlevel of inventorygenerationexpressedin
dollars. It isthe sum total of the dollarvalue of all the individual partsforecasts. If the twoforecasts
are verydifferent fromeachotherthere’sgoingtobe trouble.
For example, considerabusiness withfiveitems.
Part Number
Next Year
Forecst Qty Sell Price
Extended
Value
PN1 100 10.99 1,099.00
PN2 33 5.40 178.20
PN3 2 142.99 285.98
PN4 242 1.00 242.00
PN5 75 3.05 228.75
2,033.93
Table 1 Micro-Forecast
The micro-forecastforthis business is$2,033.93. Left alone,the inventoryplanningsystemwill
generate inventorytosupportthatamountof sales. If the sales forecastis higherthanthe micro-
forecastthenthe planningsystemwill notgenerate partsata rate highenoughtosupportsales.This
will resultin poorservice andsalesshortfalls. If the salesforecastinlowerthanthe micro-forecastthen
inventorylevels willincrease. Of course,itisalwaysassumedthatthe salesforecastisaccurate. Were it
not assumedtobe accurate thenit wouldbe foolishtouse it.
Mr. D, beingastudentof statistics,knew how toalignthe two forecasts.
Mr. D knew frombasic statisticsthatif X isa random variable and “a” is a constantthen:
Xbar(aX) = a * Xbar(X) and
Sigma(aX) = a * Sigma(X)
It follows thenthatthe ratioof the macro forecasttomicro forecastcan be calculated. That ratiocan
thenbe applied tothe forecastforeach item - therebymakingthe micro-forecastequaltothe macro-
forecast. The standard deviationandthe average of the new forecastcanbe calculatedfromthe old
forecastperthe equationsabove. Thisleadstoa change inthe ROP& EOQ foreach item, and presto
changeo,the inventorygenerationisnow inline withthe salesforecast.
Mr. D callsthisratiothe businesstrendfactor(BTF). Applyingthisratio willimpactthe ROPsandEOQs
of all items,therebygeneratinginventoryinaccordance withthe salesforecast. Simplyput,if the sales
2. Micro to Macro Forecasting:
How to tie the Micro Forecast to the Sales Forecast.
2
dollarsare forecastto double nextyearthenthe simple assumptionis thateverypartwill sell double
lastyear’ssalesquantity.
To work through an example of howtoapplythe BTF,assume a businesswith the five itemsas was
showninTable 1. If the salesforecastforthe nextyearis$3000 and the micro-forecastis$2034 then
the BTF is calculatedas3000/2034 which is1.47. To getthe level of inventorygeneration uptothe
level neededtosupporta$3000 saleslevel we multiplythe forecastforeachitemby1.47. Table 2
showsthe detailsforthe five items.
The micro-forecastisusually recalculatedeachmonth. Inaddition,the macro-forecastmaybe
recalculatedeachmonth,sothe BTFs couldchange monthly.
Part Number
Next Year
Forecst Qty Sell Price
Extended
Value
Lead
time
(months)
Monthly
Forecast
(xbar) Sigma
Service
Level
Basic
ROP
BTF Adj.
ROP
PN1 100 10.99 1,099.00 3 8.3 6.4 95.00% 44 64
PN2 33 5.40 178.20 2 2.8 2.1 90.00% 10 14
PN3 2 142.99 285.98 5 0.2 0.1 70.00% 1 2
PN4 242 1.00 242.00 1 20.2 15.5 93.00% 44 64
PN5 75 3.05 228.75 1 6.3 4.8 92.00% 14 20
2,033.93
Sales
Forecast 3,000.00
BTF 1.47
Table 2 Applying the BTF
Mr. D feltvery comfortable usingthismethod. The nature of hisbusiness lentitself tothisprocess.
Sundstrand’sproductswere notconsumergoodsandtheywere notsubjecttomarketingwhims.
Sundstrandrarelydidanysalespromotionsordiscounting. Consumptionof spare partswasa function
of unitreliabilityandfleetflyinghours,those twofactorschangedveryslowly,usually.
In the early1980s the CustomerService organizationcreatedagroupwhose jobwasto forecastsales
for commercial spares parts. Mostly,theywere master’slevel economicsandstatisticsguys andladies.
Theyproduceda five yearforecast. Itproved to be veryaccurate inthe firstandsecondyears. This
salesforecastwasvery granular,inthat it wasoftendownto the specificendproductlevel–
“applications”astheywere know atSundstrand. For example,the ramair turbine use onthe Boeing
767 airplane wasapplication“767RAT”.
Sometimes,the granularitywaslimited. Anexampleof this limitedgranularity wasamacro-forecastline
called“OldPumps”.Thisforecastline includedabouttwentydifferentapplications,whichwerepumps
usedon several typesof engines. These pumpswere designedand soldpriortothe moderndayera of
3. Micro to Macro Forecasting:
How to tie the Micro Forecast to the Sales Forecast.
3
computersand therefore lackedgooddataoninstallations. The lack of goodinstallation datalimited
thisgranularityto that aggregatedlevel called “OldPumps”ratherthanthe twenty individual
applications.
SometimesMr.D had to undosome of the granularity. For example,there were fourlinesof sales
forecastforthe four different ConstantSpeedDrives thatwere used onthe 707, 727, DC8, andDC9
aircraft. Mr. D knewthatthese units,exceptfortheirhousings andinputshafts,usedthe same internal
parts. The salesforecastwasgranular at the applicationlevel,butbecause of thisdesigncommonality
Mr. D reducedthatgranularityby combiningthe fourlinesof salesforecastintoaforecast family he
called“Bo60”.
Let’sget to the rat killing,andtalksome detail onhow Mr.D appliedBTF at Sundstrand.
First,everyspare itemsoldbySundstrandhadup to 30 applicationcodesassociatedwithit. These
applicationcodes indicatedthe endproduct(s)onwhichanitemwasused. For example, foranitem
usedina 707 constantspeeddrive, there couldbe fourcodes:707CSD, 727CSD, DC9CSD, DC8CSD – due
to the commonalityof design. Second,foreachcustomerthere wasa listof aircraftthey operated:707,
727, 737, etc. Whena customerorderedan item,the computersystemcomparedthesetwolistsand
foundthe firstmatch. For example,if acustomeronlyflew the DC9,thenthe applicationcode would
match and getassignedas“DC9CSD”. That applicationcode wasthenassignedtothe sales order,andit
was thatapplicationcode thatwas usedbythe salesforecastinggroup asthe basisof determining
granularity.
At the micro-forecastlevel,Mr.D usedthe firstapplicationcode foran itemas the start of his
granularity. (Justasa note,there wasa side process thatanalyzedsales dataandre-arrangedthe
item’sapplicationcodesin orderfromhighesttolowestsales.) There wasa cross reference table
createdand usedbyMr. D that definedthe relationshipof applicationcodestoforecastfamily(e.g.
727CSD Bo60).
Here’sthe processusedbyMr. D.
1. Forecastdemandbyitem- the monthlypartsforecastingprocess.
2. Match eachitemto itsfirstapplication,extend$,andsum thismicro-forecastby
application.
3. Match application toforecastfamily,summicro-forecastby forecastfamily.
4. Match salesforecast,byapplication,toforecastfamily,sumsalesforecastbyfamily.
5. Match salesforecast andmicro-forecastbyfamily,calculate BTF foreachforecastfamily.
6. Reviewand approve forecastfamily BTFs, adjustwhere necessary.
7. Match BTF by forecastfamilytoapplicationcodes –reverse of step3.
8. Match BTF by applicationtoitem –reverse of step2.
9. ApplyBTFat itemlevel toadjustROP &EOQ.
10. QED
4. Micro to Macro Forecasting:
How to tie the Micro Forecast to the Sales Forecast.
4
There were three scenariosthatmade the BTF a valuable process toMr. D.
1. A significantchange inbusinessyearoveryear. The penultimate example of this is9/11 when
the businessdropped 40% inone day. In fact, on 9/12 the entire worldwide727 aircraft fleet
was groundedandneverflew again. (Inthatcase, Mr. D manuallysetthe BTFto zeroon the
unique parts usedonthe 727, so thatall inventorygenerationwouldstop.) Inhissix lustrums
withSundstrand,Mr. D sawat leastthree majorrecessions. The BTFprocesshelpedkeep
inventoryinline goingintothose recessions,andalsocomingoutof them.
2. Whena product experiencesanabruptpopulationshift. I.e. whenthe fleetsize of the 767
doubledyearoveryearforthe firstfive years,due tonew aircraft deliveries.
3. Specificbusinessdecisionsonproduct support. AswhenSundstrandabandoned its’ catalog
supportof some veryoldproducts,or soldoff some of itsproducts. In these situationsthe BTF
was setto zero;so the ROPswentto zero, therefore nomore inventorywasstockedtosupport
those products.
Unfortunately,the CustomerService salesforecastinggroupwas ultimately dissolved.The salesforecast
drove budgets,manpower,andthe like. Backthen,the CustomerService organizationwasnotatrue
P&L center,sothe accountingof salesof spare parts flowedbackintoothergroups. Thisimpactedthe
othergroups operations,andtheirVice presidents’ bonus,sothe situationwasalwayshighlypolitically
charged. Ultimately,the Presidentof the company became tiredof the infightingbetween the
CustomerService forecastinggroupandthese otherorganizations,andhe orderedthatthe forecasting
groupbe dissolved. Soadios tothe people whoactuallymade anaccurate forecast.
The forecastingresponsibilitywas thenassigned tosome otherpoorschmuck. He had no trainingor
skillsinforecasting. Hisforecasthadonlyone line - forthe sumof all spare parts sales. The lack of
granularitywasa bigproblem.
Afterthe salesforecastinggroupwasdissolvedMr.D continuedwiththe BTFprocess. As a
replacementforthe “late”forecastgroup Mr. D convenedagroup of customerservice persons. They
metquarterly toreviewthe “sales”situation. The groupwouldthencome toa consensuson whatthe
BTFs shouldbe foreach forecastfamily. ThisrequiredMr.D toanalyze a lotmore data andto produce a
numberof charts that were to be usedinthat groupprocess. Essentially,Mr.D was the shadow
forecastinggroup.
It isunfortunate that if no salesforecastisavailable itthenbecomesthe problemof the inventory
managerto estimate the BTFs. It’sa matterof self preservation. Goodly estimatedBTFswill help
generate the correctlevel of inventory. Sales goalswill be met,inventorywillbe low,andeveryonewill
be happy.
Inventorymanagersshouldnotexpectanypraise orotherconsiderationforthis.
Well there itis:one more tasty entrée inMr. D’s smorgasbordof ideas. Take whatyou want,andleave
the rest.
5. Micro to Macro Forecasting:
How to tie the Micro Forecast to the Sales Forecast.
5
Contact Mr. D at MisterD@windstream.net