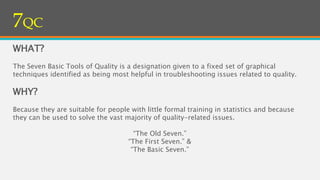
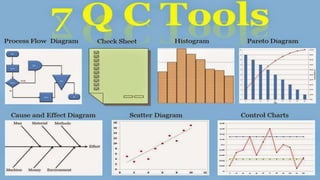
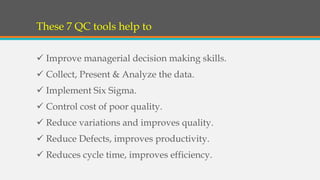
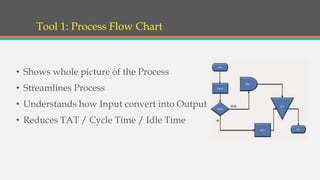
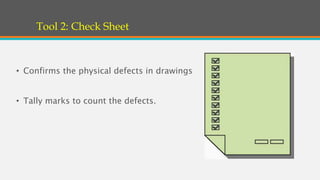
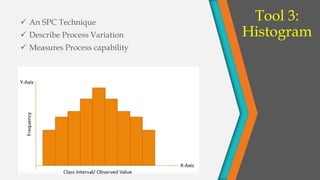
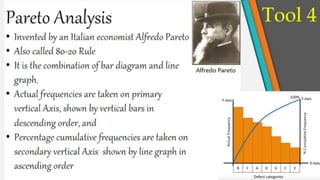
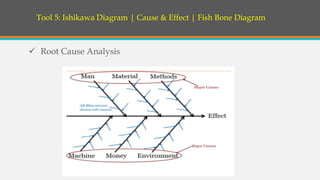
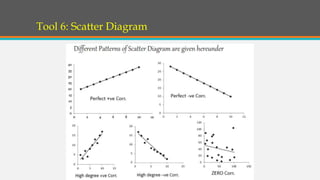
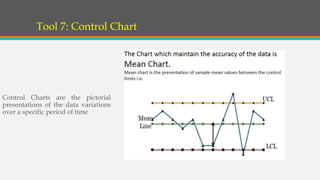
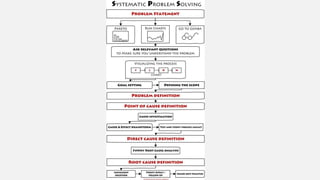
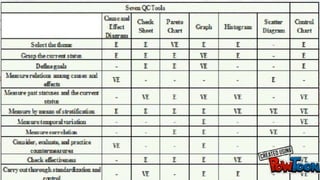
7QC
Tools
Presented By: Shashank Varun
PDCA
7QC Framework
WHAT?
The Seven Basic Tools of Quality is a designation given to a fixed set of graphical
techniques identified as being most helpful in troubleshooting issues related to quality.
WHY?
Because they are suitable for people with little formal training in statistics and because
they can be used to solve the vast majority of quality-related issues.
“The Old Seven.”
“The First Seven.” &
“The Basic Seven.”
7QC
These 7 QC tools help to
 Improve managerial decision making skills.
 Collect, Present & Analyze the data.
 Implement Six Sigma.
 Control cost of poor quality.
 Reduce variations and improves quality.
 Reduce Defects, improves productivity.
 Reduces cycle time, improves efficiency.
Tool 1: Process Flow Chart
• Shows whole picture of the Process
• Streamlines Process
• Understands how Input convert into Output
• Reduces TAT / Cycle Time / Idle Time
Tool 2: Check Sheet
• Confirms the physical defects in drawings
• Tally marks to count the defects.
Tool 3:
Histogram
 An SPC Technique
 Describe Process Variation
 Measures Process capability
Tool 4
Tool 5: Ishikawa Diagram | Cause & Effect | Fish Bone Diagram
 Root Cause Analysis
Tool 6: Scatter Diagram
Tool 7: Control Chart
Control Charts are the pictorial
presentations of the data variations
over a specific period of time
New 7QC Tools
7 QC Tools
7 QC Tools

7 QC Tools

  • 1.
  • 2.
  • 3.
  • 4.
    WHAT? The Seven BasicTools of Quality is a designation given to a fixed set of graphical techniques identified as being most helpful in troubleshooting issues related to quality. WHY? Because they are suitable for people with little formal training in statistics and because they can be used to solve the vast majority of quality-related issues. “The Old Seven.” “The First Seven.” & “The Basic Seven.” 7QC
  • 6.
    These 7 QCtools help to  Improve managerial decision making skills.  Collect, Present & Analyze the data.  Implement Six Sigma.  Control cost of poor quality.  Reduce variations and improves quality.  Reduce Defects, improves productivity.  Reduces cycle time, improves efficiency.
  • 7.
    Tool 1: ProcessFlow Chart • Shows whole picture of the Process • Streamlines Process • Understands how Input convert into Output • Reduces TAT / Cycle Time / Idle Time
  • 8.
    Tool 2: CheckSheet • Confirms the physical defects in drawings • Tally marks to count the defects.
  • 9.
    Tool 3: Histogram  AnSPC Technique  Describe Process Variation  Measures Process capability
  • 10.
  • 11.
    Tool 5: IshikawaDiagram | Cause & Effect | Fish Bone Diagram  Root Cause Analysis
  • 12.
  • 13.
    Tool 7: ControlChart Control Charts are the pictorial presentations of the data variations over a specific period of time
  • 16.