This document provides an executive summary of a report on engaging youth service providers in Illinois in developing outcomes for youth development programs. The report conducted a literature review on positive youth development models, interviewed Illinois Department of Human Services staff, and held focus groups with youth providers. Key findings include: 1) The literature identifies 5 common outcome models that could be used as a starting point, 2) Providers are familiar with outcomes but lack clarity on what the state wants to measure, 3) Both providers and the state need capacity building to successfully implement performance-based budgeting. The report makes recommendations for the government, philanthropy sector, and providers to strengthen youth programs and services in Illinois.

![19
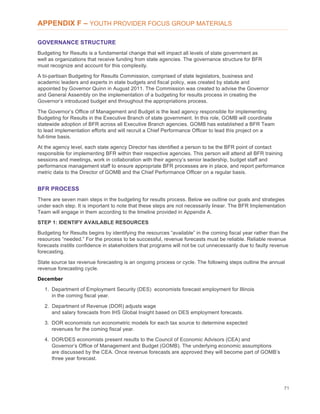
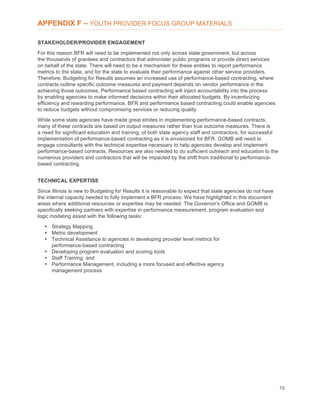
PROVIDERS ON PYD MODELS, OUTCOMES & CAPACITY BUILDING
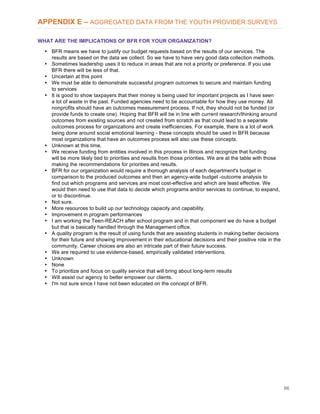
REACHING CONSENSUS ON PYD OUTCOMES
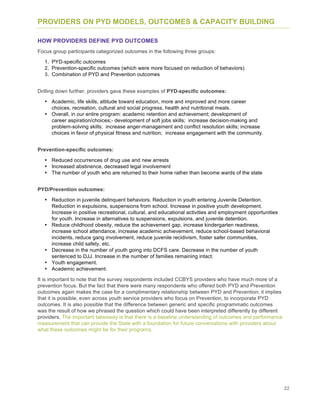
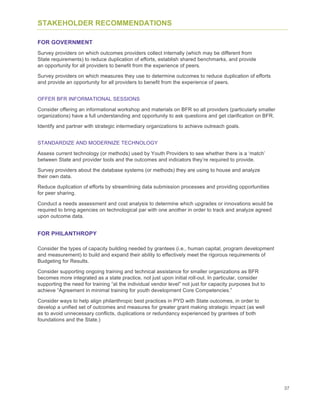
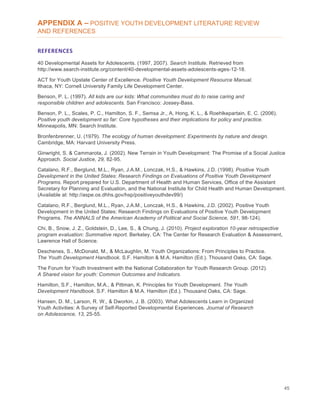
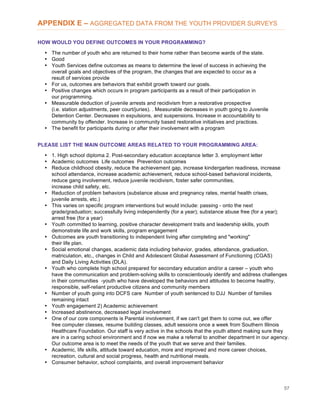
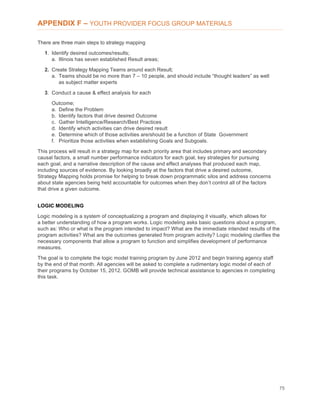
However, providers also pointed out that, in order to measure those things accurately, they (and the
State) needed to engage in Longitudinal Research; they (and the State) needed to define the kind of
academic engagement that would be appropriate for their particular programs to measure and collect
data for. For instance, providers questioned whether it was fair to be held to a standard for youth
achieving academic success when they saw that role being played firmly by schools and teachers.
Rather, they offered program outcomes that measure ‘engagement’ in learning and educational
achievement. One provider who said they have a very strong connection still finds it difficult get
academic achievement data from the schools and trying to obtain such data from parents is
still difficult.
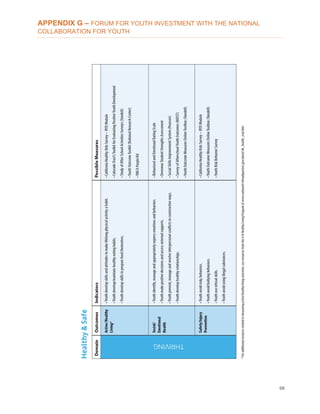
Providers defined program outcomes for LEADING AS:
• Demonstration of civic mindedness, engagement, responsibilities, empowerment, or altruism
• Participation in a service learning project
• Involvement of youth in program planning and implementation
• Involvement of youth in their community
• Developing critical thinking skills
• Demonstrating self-control & respecting others opinion
• Building critical soft skills
• Building character
• You have students dong well academically-but they are still jerks- [they need] character building
Building a sense of empowerment and developing values were also potential program outcomes that
measured LEADING, but it also lacked sufficient data to support it as a worthwhile measure for the
providers. In one participant’s words “Developing a sense of values [important]... [but] this leads to
trouble...Research says about 1/3 of youth not responding.” Another said, “A lot of [our] work is
empowerment and not as much the language related to the materials or survey. [It’s] about having youth
involved in the planning of the programs.” But despite the difficulty in measurement, providers still think
outcomes on developing leadership and character skills is valuable, citing instances of students with
academic or hard skills achievement but lacking appropriate socialization or the requisite soft skills a
prospective employer would need.
When asked if WORKING was a relevant domain providers were less sure of how to measure this
kind of success, citing potential barriers such as how their organizations often achieves stabilizing
one family in the community but the family moves up and out, only to be replaced by less stable families –
and the process begins again. Another participant described financial literacy as a part of the equation and
lamented the dissolution of home economics in the schools and wondered how youth were learning about
money management. Another provider drew a strong link between education and economics/economic
development and felt that these both had real implications for the lives of the youth and families in their
programs. These barriers, created by structural inequity and policymaking outside these organizations’
spheres of influence, would presumably require long term solutions and measurement.](https://image.slidesharecdn.com/c47f48e4-26d4-4fd6-b3a0-ffb4cef63722-150319133814-conversion-gate01/85/64968-PDF-19-320.jpg)
![28
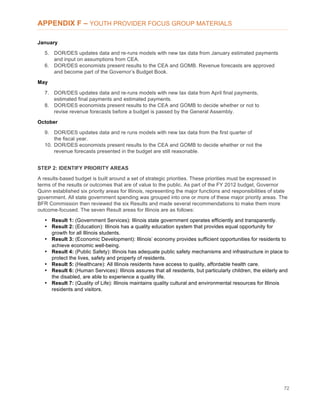
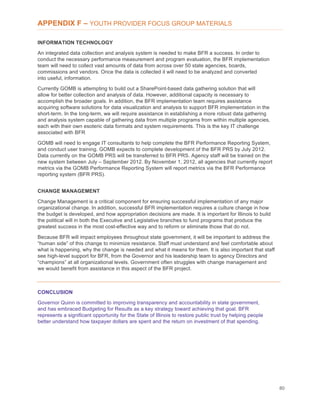
PROVIDERS ON PYD MODELS, OUTCOMES & CAPACITY BUILDING
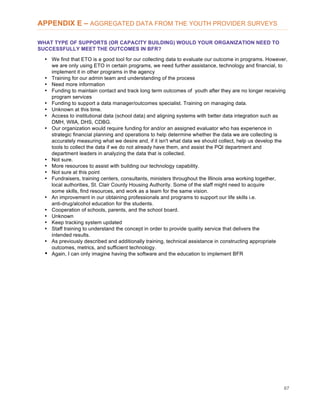
DEVELOPING OUTCOMES: PROVIDER CONCERNS
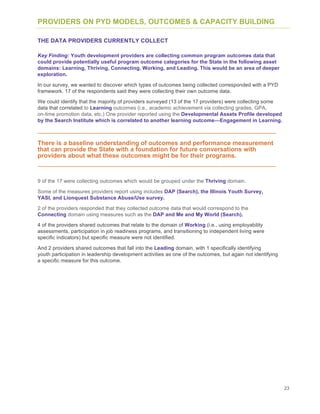
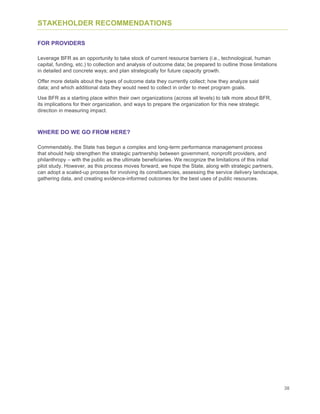
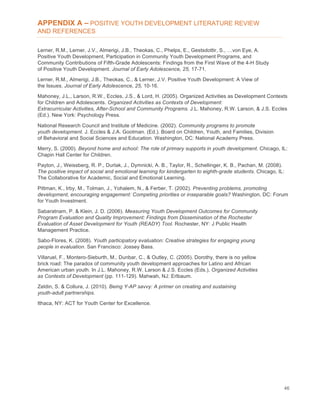
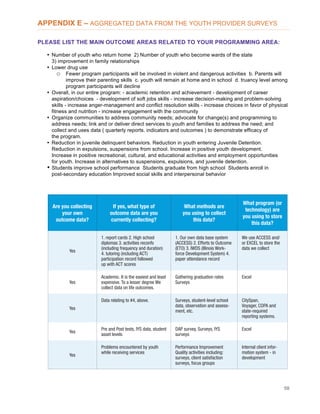
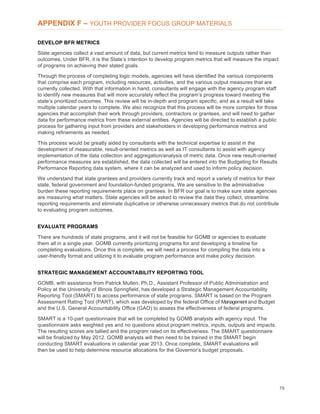
Both groups reiterated that there were enough models out there (i.e., Search Institute, etc) that they
did not need to start from scratch and they would be happy for the State to pick one model and then
they could work it through. The other important thing shared by the providers which seems important
to emphasize is that whatever model is selected must be developmental in nature and, as explained
by one provider, “The tool must be sensitive to the intersection of all of these assets/domains.”
Providers further emphasized the importance of working as a group to determine which outcomes were
directly correlated to, or aligned with, their specific programming because there were programmatic
differences (in terms of audiences, goals, etc.) They felt that this conversation about the desired
outcomes for youth needed to include a wide range of voices – in particular, youth, line staff, and other
PYD stakeholders. The focus group participants spoke of the fact that many stakeholders support
outcomes and outcomes development should not be the sole burden of the youth provider. They spoke
specifically of the youth themselves being a major stakeholder and there being a need to incorporate their
voices into these discussions, possibly through the TeenREACH State Youth Advisory Council. Youth
workers were another voice that needed to be added to the discussion so that the full continuum of the
youth provision sector was included, not just those in the administrative roles.
But while these responses are thoughtful and act as a testament to the dedication of these providers,
it is hard to imagine the state having the current capacity or time (given the BFR implementation
schedule) for such a bottom-up process for the creation and implementation of program outcomes
across hundreds of programs and with thousands of communities.
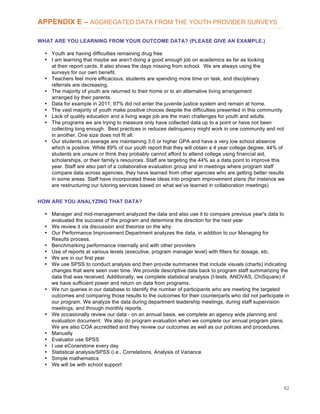
Focus group participants also thought it was important to think about outcomes from a longer view
and that some outcomes would be more longitudinal, requiring tracking beyond the time youth spend
in programs. One provider noted that “Change of behavior can occur but what about sustainability of
change over time, beyond the life of our program?” Another agreed and said it would be helpful to
“connect early childhood to college.” Similar concerns were raised by survey respondents.
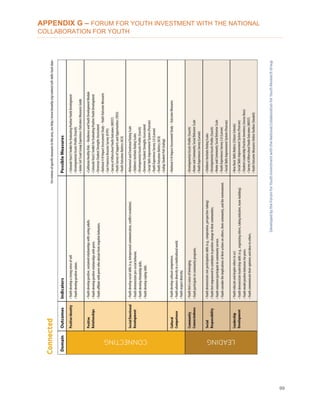
Providers were equally concerned about efficiency and streamlining, wanting programs
to be seen, managed, and operated without silos:
• CYS and TeenREACH are silo[ed] from each other. [There’s a] huge disconnect.
• Two different state departments [are] working on youth outcomes--but extremely different.
• IL DHS’ [and] DCFS’ youth programs - these entities should come together and see where
here is duplication. We have been trying to do this on our own when there should be one unified
youth grant.
• Silo issue is huge--but [there] aren’t enough resources to deal with housing [or] placement.
Provider participants identified a number of ways thinking about different programs in relationship to
one another, as well as how their joint impact and role in outcomes could be helpful. For instance, in
the words of one provider:
“In certain IL DHS divisions’ [prevention models]
that are good, [the] State should take a look at what
worked internally and learn and use that.”](https://image.slidesharecdn.com/c47f48e4-26d4-4fd6-b3a0-ffb4cef63722-150319133814-conversion-gate01/85/64968-PDF-28-320.jpg)
![29
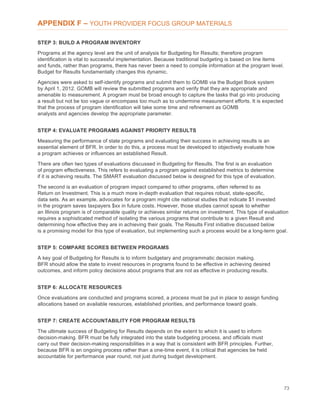
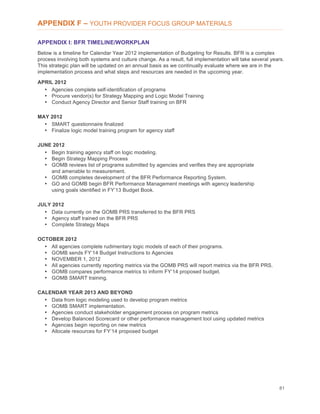
PROVIDERS ON PYD MODELS, OUTCOMES & CAPACITY BUILDING
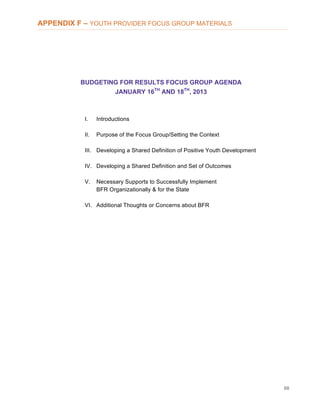
DEVELOPING OUTCOMES: PROVIDER CONCERNS
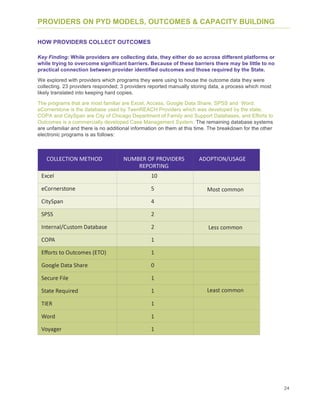
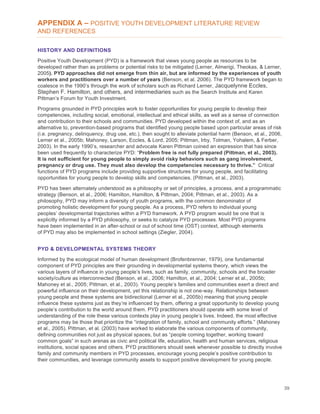
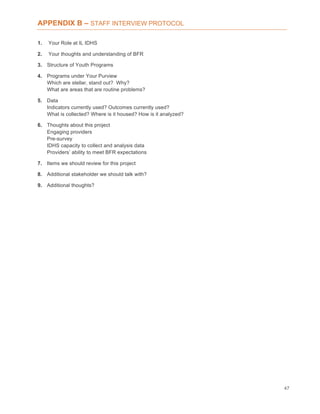
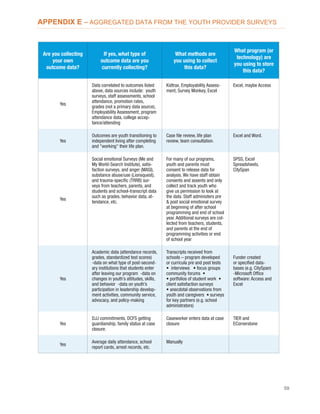
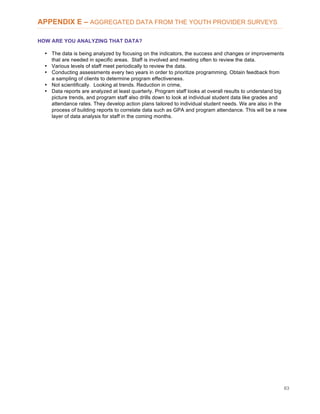
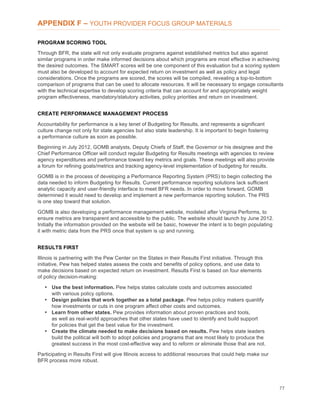
Other recommendations to explore what is happening with shared outcomes in other program
areas included:
• Looking at “Early childhood programs could be helpful in tracking [outcomes] over time.
• Designing support groups with smaller organizations in different areas and supporting
collaboration.
• [The State] should look at NWEA-MAP (long ranging-elementary to high school
educational tool) [that] has benchmarks, [measures] growth over time, [and] breaks each
domain down.
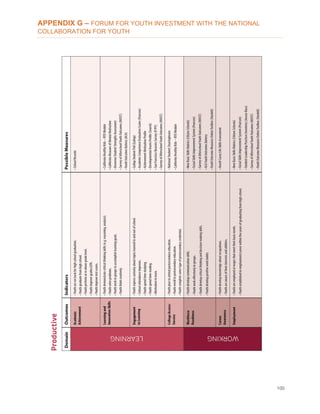
Providers are adamant that training has to be a key component for success. They also think there has
to be ongoing sustained training as BFR becomes more integrated as a state practice, not just upon
initial roll-out. Particularly, they supported the need for outcomes training “at the individual vendor
level” not just for capacity purposes, but to achieve “Agreement in minimal training for youth
development Core Competencies.” Ongoing support for BFR means joining policy and practice in
order to create sustained buy in among practitioners and prevent the all-too familiar practice of merely
adding to a nonprofit provider’s already strained capacity. Participants believe that in order for this to
work there will have to be buy-in at all levels within the provider agency (including youth, parents, line
staff, administrative staff, and board,) that training and on-going support would have to exist, and that
tasks associated with outcomes measurement could not be added randomly to someone’s current job.
For providers, there would need to be internal commitment at the provider agency, aligned with external
support from the state, other funders and even the business sector.
Ongoing support for BFR means joining policy and practice in order to create
sustained buy in among practitioners and prevent the all-too familiar practice
of merely adding to a nonprofit provider’s already strained capacity.
Quality control and assurance were also important components to the discussion of outcomes data.
Providers felt that it was not enough that the data was being entered, but that systems would be in
place to assure quality in data entry and analysis. They particularly focused on using a model of peer
to peer sharing and review in order to assure not just the quality of data but the accountability of it – pointing
to a sense of their own strength as a field and, perhaps more cynically, of their distrust of the State’s capacity
to collect (and leverage) ‘clean’ data. They raised such questions as “What about quality control? Who is
checking data quality, perhaps establishing a peer review process?” Providers also suggested that
establishing a normal quality control/ compliance process which reflects accountability would be the first
step; the next step would be quality assurance which would shape program quality and implementation.
Again, one participant suggested that incorporating peer to peer site visits might be a way to develop quality
assurance across programs. There was also the mention of cohort-based support as providers attempted
to tackle program evaluation. They outlined that having an hour-long site visit to review data did not go deep
enough. For instance, if one site was ranking low on a specific metric perhaps that site could be paired with
another provider agency that was doing well on that specific metric in order to create an additional level of
peer, or cohort, support. This was felt to be an innovative way to get a bigger ‘bang for the buck’ (or, return
on investment) for the youth. Providers held up the Maternal Infant Early Childhood Home Visiting
Program as an example of a cohort-based support model the State might explore.](https://image.slidesharecdn.com/c47f48e4-26d4-4fd6-b3a0-ffb4cef63722-150319133814-conversion-gate01/85/64968-PDF-29-320.jpg)
![30
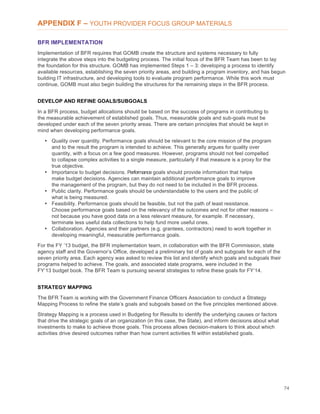
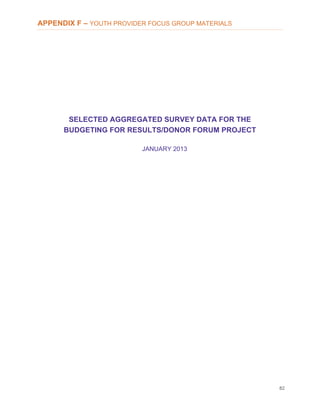
PROVIDERS ON PYD MODELS, OUTCOMES & CAPACITY BUILDING
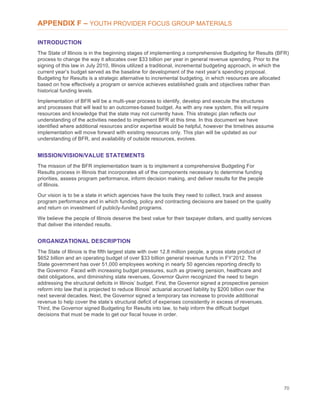
DEVELOPING OUTCOMES: PROVIDER CONCERNS
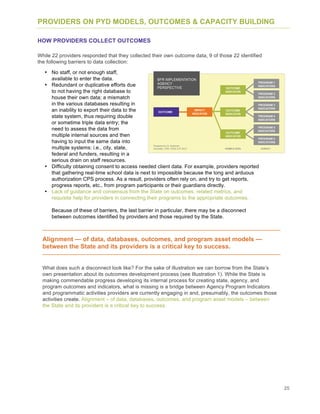
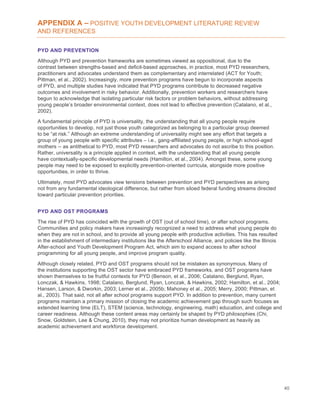
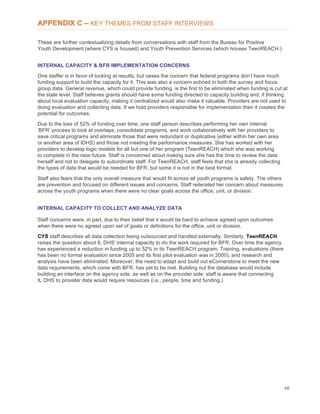
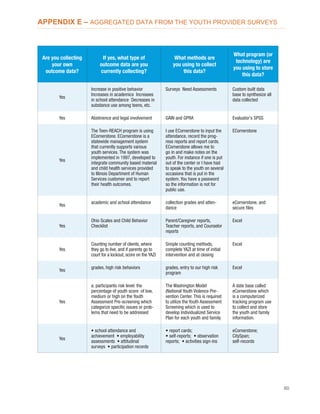
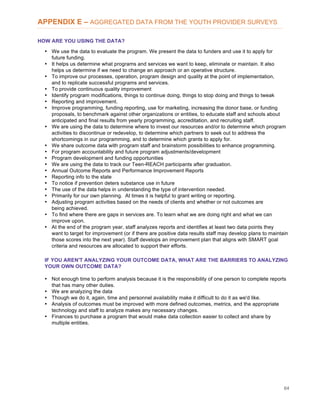
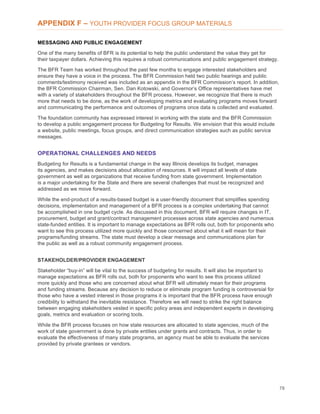
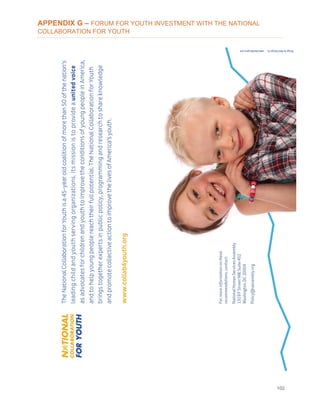
For focus group participants a system for data collection would share the
following characteristics: streamlined; single depository; and come with a
‘friendly’ tracking system.
Perceived lack of cohesion or alignment in technology is another area of concern for survey and
focus group participants (see How Providers Collect Data). For focus group participants a system for
data collection would share the following characteristics: streamlined; single depository; and come with
a ‘friendly’ tracking system. In some instances providers and the State have partnered by using common
data platforms but the results have been mixed. “The ETO Database; there was intentionality but it still
does not work that way,” said one provider. Another added, “ECornerstone was introduced 8 years ago;
the glitches took 2-3 years to iron out. [We’ve] only been using it for about 5 years.” Another strong
recommendation from providers was for the state to “Match technology to outcomes to make sure we get
useful reports,” indicating a perceived deficiency and pointing to a need for outcomes to feed a loop of
constant program improvement, thus improving baseline results for the state. In other words, outcomes
shouldn’t just be for the state alone (in an upward direction) but should also have an impact ‘on the ground.’](https://image.slidesharecdn.com/c47f48e4-26d4-4fd6-b3a0-ffb4cef63722-150319133814-conversion-gate01/85/64968-PDF-30-320.jpg)
![31
PROVIDERS ON BUDGETING FOR RESULTS & CAPACITY BULDING
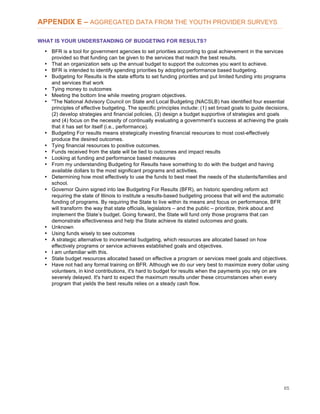
AWARENESS
Key Finding: While descriptions varied, providers were generally aware of BFR as a
state-sponsored strategy. These responses suggest that while there is a continued
need to make sure all providers understand BFR and how it works, there is enough of
a basic understanding of BFR to build upon. These responses further suggest that
providers support increased accountability and want to use outcomes strategically in
their programming, but all will need assistance in doing so. This might be a crucial role
for a partnership between the state and the philanthropic community.
In the survey, 18 providers expressed a baseline understanding of BFR as a method to tie
resource allocations to measureable outcomes:
• [BFR is] tying money to outcomes.
• Governor Quinn signed into law Budgeting For Results (BFR), an historic spending reform
act requiring the state of Illinois to institute a results-based budgeting process that will nd the
automatic funding of programs. By requiring the State to live within its means and focus on
performance, BFR will transform the way that state officials, legislators – and the public –
prioritize, think about and implement the State’s budget. Going forward, the State will fund
only those programs that can demonstrate effectiveness and help the State achieve its
stated outcomes and goals.
• A strategic alternative to incremental budgeting, which resources are allocated based
on how effectively programs or service achieves established goals and objectives.
• From my understanding Budgeting for Results have something to do with the budget
and having available dollars to the most significant programs and activities.
One provider effectively connected the dots between funding and meeting program goals,
objectives, and outcomes:
“Have not had any formal training on BFR. Although we do our
very best to maximize every dollar using volunteers, in kind
contributions, it's hard to budget for results when the payments
you rely on are severely delayed. It's hard to expect the maximum
results under these circumstances when every program that
yields the best results relies on a steady cash flow.”
Few providers (2) had no knowledge of BFR.
During the focus groups, when we prompted providers to think about Budgeting for Results (BFR)
in a big picture, not only were most providers aware of BFR, their awareness emerged in two different
(yet related) themes: Efficiency vs. Collaboration. Springfield providers concentrated on outcomes
development in order to prevent duplicating services or processes that were already in place; they
really wanted to try and streamline the processes related to outcomes and service provision, as well
as incorporate economic development and connecting youth with employment in the discussion of
outcomes. The Chicago-based group was much more focused on collaborating with each other to
improve their practice related to outcomes; they were also concerned that smaller groups had not been
included in the focus groups because they felt true innovation comes from smaller organizations; they were
also advocates for long-terms capacity supports be put in place, and extremely concerned that they would
be held accountable for academic outcomes that even school systems are unable to meet.](https://image.slidesharecdn.com/c47f48e4-26d4-4fd6-b3a0-ffb4cef63722-150319133814-conversion-gate01/85/64968-PDF-31-320.jpg)
![32
PROVIDERS ON BUDGETING FOR RESULTS & CAPACITY BUILDING
PROGRAM IMPLICATIONS OF BFR
Key Finding: Providers and the State share similar expectations of BFR to be
meaningful to their programs, indicating the possibility of shared vision and
goal-setting as implementation continues.
When asked, provider responses (20 in total) about the program implications of BFR for their
organizations can be categorized in one of four ways:
• Demonstrating Effectiveness/Accountability
• Strategic Prioritization
• Technology Improvement
• Uncertain or None
Most providers (10) said BFR would require them to Demonstrate Effectiveness/Accountability
(emphasis added to show shared values between the State and providers):
• We must be able to demonstrate successful program outcomes to secure and maintain
funding to services.
• It is good to show taxpayers that their money is being used for important projects
as I have seen a lot of waste in the past. Funded agencies need to be accountable for
how they use money. All non profits should have an outcomes measurement process. If not,
they should not be funded (or provide[d] funds to create one).
Four providers described implications that related to Strategic Prioritization:
• Sometimes leadership uses it to reduce in areas that are not a priority or preference. If you use
BFR there will be less of that.
• BFR for our organization would require a thorough analysis of each department's budget in
comparison to the produced outcomes and then an agency-wide budget -outcome analysis
to find out which programs and services are most cost-effective and which are least effective.
We would then need to use that data to decide which programs and/or services to
continue, to expand, or to discontinue.
• To prioritize and focus on quality service that will bring about long-term results.
Three providers shared that the implications for their organization were related to Technology
Improvements.
• More resources to build up our technology capacity and capability.
• The results are based on the data we collect. So we have to have very good data
collection methods.
• All non profits should have an outcomes measurement process. If not, they should
not be funded (or provide[d] funds to create one).
For six providers the implications were uncertain or unknown and only 2 of those said they were
unfamiliar with BFR or had not been educated about BFR. One provider curiously responded that
BFR had no implications for their organization.](https://image.slidesharecdn.com/c47f48e4-26d4-4fd6-b3a0-ffb4cef63722-150319133814-conversion-gate01/85/64968-PDF-32-320.jpg)
![34
PROVIDERS ON BUDGETING FOR RESULTS & CAPACITY BUILDING
ILLINOIS IMPLEMENTATION CAPACITY AND PROVIDER CONCERNS
Key Finding: Though the focus group size was small, providers were positively engaged
around the topic of outcomes. However, they were extremely vocal in their concerns about
BFR and the state’s capacity to implement such a complex process. The providers remain
concerned that BFR will be another “flavor of the month” that will fade with time and be used
as mechanism to deplete already lean resources to support successful development of youth.
While sharing that they were grateful for this pilot, and to hear the State’s admission they do not
have the expertise in this area and are willing to partner with them, providers are still concerned
about the State’s limitations in understanding outcomes. (See also IL DHS Staff Discussion)
• You find only one person at the state level to work with who you talk with about outcomes, etc.
• Everybody at the state level needs to know more than we do, more than the agencies.
• Appreciate [the] state admitting it does not have expertise and will partner with the providers
and others on this.
From the providers’ perspective (a point of view that would likely differ from the State’s in rather
significant ways) BFR would require an increase in funding to their programs to be successful in
response to BR. They have serious concerns and distrust about the State’s commitment to such
funding, given that Illinois has already demonstrated an inability to meet its financial obligations.
• Especially given that the base amount to us is $75 thousand versus federal programs which
get $250 thousand.
• [We are] expected to input data and [it’s] not reflected in budget. Connect tasks to funding.
• State must make in-roads to punctuate federal dollars. In early childhood, federal dollars are
creating hubs regionally and nationally. Nothing like this [is] happening in PYD at the national
level. This ices out some of the smaller orgs who can be very innovative. [It] must intentionally
include smaller and larger organizations.
• For profit businesses need to be brought to the table, they have a stake in this too.
• We must monitor pennies. State [funding] is not worth the paper it is written on. My board is
weary, our partners are weary. [The] State can change its mind. Grants do not cover interest
when we've had to take out loans to keep things going in between when monies come.
• The state cancelled some of our [funding and] rolled our program into another area and then
came back and asked us for a report when the program was no longer in our hands.
Repeating a refrain heard often, providers voiced concern that BFR was the “new flavor of the
month” and that the State changes ideas, concepts, and plans quickly (perhaps too quickly). They
were skeptical to the idea that BFR would be handled differently. One provider asked, “How much
of this is short-term as the State shifts to the health consortium as its model?” Another observed,
“TeenREACH was zeroed out, [then] brought back. Things change too much.”](https://image.slidesharecdn.com/c47f48e4-26d4-4fd6-b3a0-ffb4cef63722-150319133814-conversion-gate01/85/64968-PDF-34-320.jpg)
![35
PROVIDERS ON BUDGETING FOR RESULTS & CAPACITY BUILDING
ILLINOIS IMPLEMENTATION CAPACITY AND PROVIDER CONCERNS
Of more concern is the distrust some providers have of the State’s motivations surrounding
BFR. Some feel that BFR is a Trojan horse to further hollow out an already lean service delivery
system. A provider said, “Theoretically [I have] no problem, but [I’m] concerned that it will be used as
a way to hire the lowest quality, that it’s not being tied to quality or ongoing improvement.” Another
added, “Money must come along with this or we are disinvesting in youth.” Another preferred to think
about BFR’s potential to prompt cooperation and collaboration, rather than competition:
“BFR would be great if not connected to the budget.
We are all on the same team; let's elevate the reflection,
talk with one another, and innovate when tied to money.
Money creates competition.”
Acknowledging the small size of both the survey and focus group samples, we want to encourage
the State not to ignore these concerns about gaps in capacity. The State’s lack of staffing, planning
and resource capacity, as well as its uneven practices and processes, is well documented in annual
Inspector General audit reports, public testimony at legislative hearings and committees, as well as
external evaluations (such as the 2010 Pew Center on the States’ Grading the States report on Illinois
government performance.) Facing, and overcoming, distrust between strategic partners will not be
easy, and would probably require some additional change management and internal culture work
on the part of IL DHS (as well as some rather significant changes to the State’s financial processes.)
However, greater intentional and more transparent communication about the State’s
commitment to BFR, as well as to a consistent evidence-informed methodology for
implementation, could balance this skepticism.](https://image.slidesharecdn.com/c47f48e4-26d4-4fd6-b3a0-ffb4cef63722-150319133814-conversion-gate01/85/64968-PDF-35-320.jpg)


![103
APPENDIX H – YOUTH PROVIDER FOCUS GROUP DATA
Focus Group Data
Springfield Group 1/16/2013
DEVELOPING A SHARED DEFINITION OF POSITIVE YOUTH DEVELOPMENT
Reactions to the Definitions Shared/Reactions to the survey data/Additions you would add/
Concerns/Cautions
• Lot of [our] work is empowerment and not as much the language related to the materials or
survey...about having youth involved in the planning of the programs
• "Empowerment" loosely stated--what is empowerment really? Living wage job, going to college.
Youth are saying help me navigate through my goals
• Protective factors having an impact on positive. Outcomes...where do they come in at? Issue of
strides--time span of change
• Positive outcomes--economic/quality of life (more + with school)...economic is education and
economic development
DEVELOPING A SHARED DEFINITION AND SET OF OUTCOMES
Reactions to the definitions of developmental domain, outcomes, indicator, measure/Reactions to the
survey data in comparison to the definitions/What is missing? Developmental domains, Outcomes,
indicators, measures/What guidance would you offer to the state around outcomes?/ Concerns/Cautions
• We are more interested in school success/absence of delinquency (resiliency)--being more
important to connect outcomes/vague stuff...Materials were mostly was about resiliency
stuff...volunteering/community service measures
• Too often we deal with outputs/#s--as opposed to critical areas--that is what we ought to be doing
• Programs are unique across--same tool (across all sites)--reduction of arrest/# of days and
involvement/grades/more they attend
• Shift from subjective measures to real hard data
• Change of behavior can occur-but what about sustainability of change over time--beyond the
life of our program--long terms effects of programs
• Band-Aid effect/hot new term impact--but what about the family context--are giving enough
to get long term effects?
• What about family resiliency?
• What about community? What about environmental consequences?
• Question of resources--to do enough at Human Services--must be realistic about expectations
• CYS--goals is to impact community/youth/family/
• BFR--what should programs be doing or not doing?
• Influence behavior change that is documented
• TeenREACH--parent/community/youth component--not sure if that happens across all programs
• Record # of youth showing up--staff having to up their professional development to measure
outcomes...CYS-TeenREACH silo(ed) from each other--Huge disconnect
Guided portion of the discussion to reach consensus on the developmental domains for the
outcomes:
Academic/Educational Success/Learning
School success
Graduate middle schools
Longitudinal Research](https://image.slidesharecdn.com/c47f48e4-26d4-4fd6-b3a0-ffb4cef63722-150319133814-conversion-gate01/85/64968-PDF-103-320.jpg)