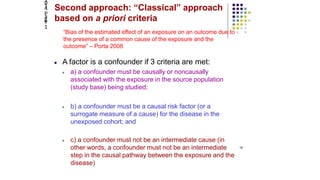
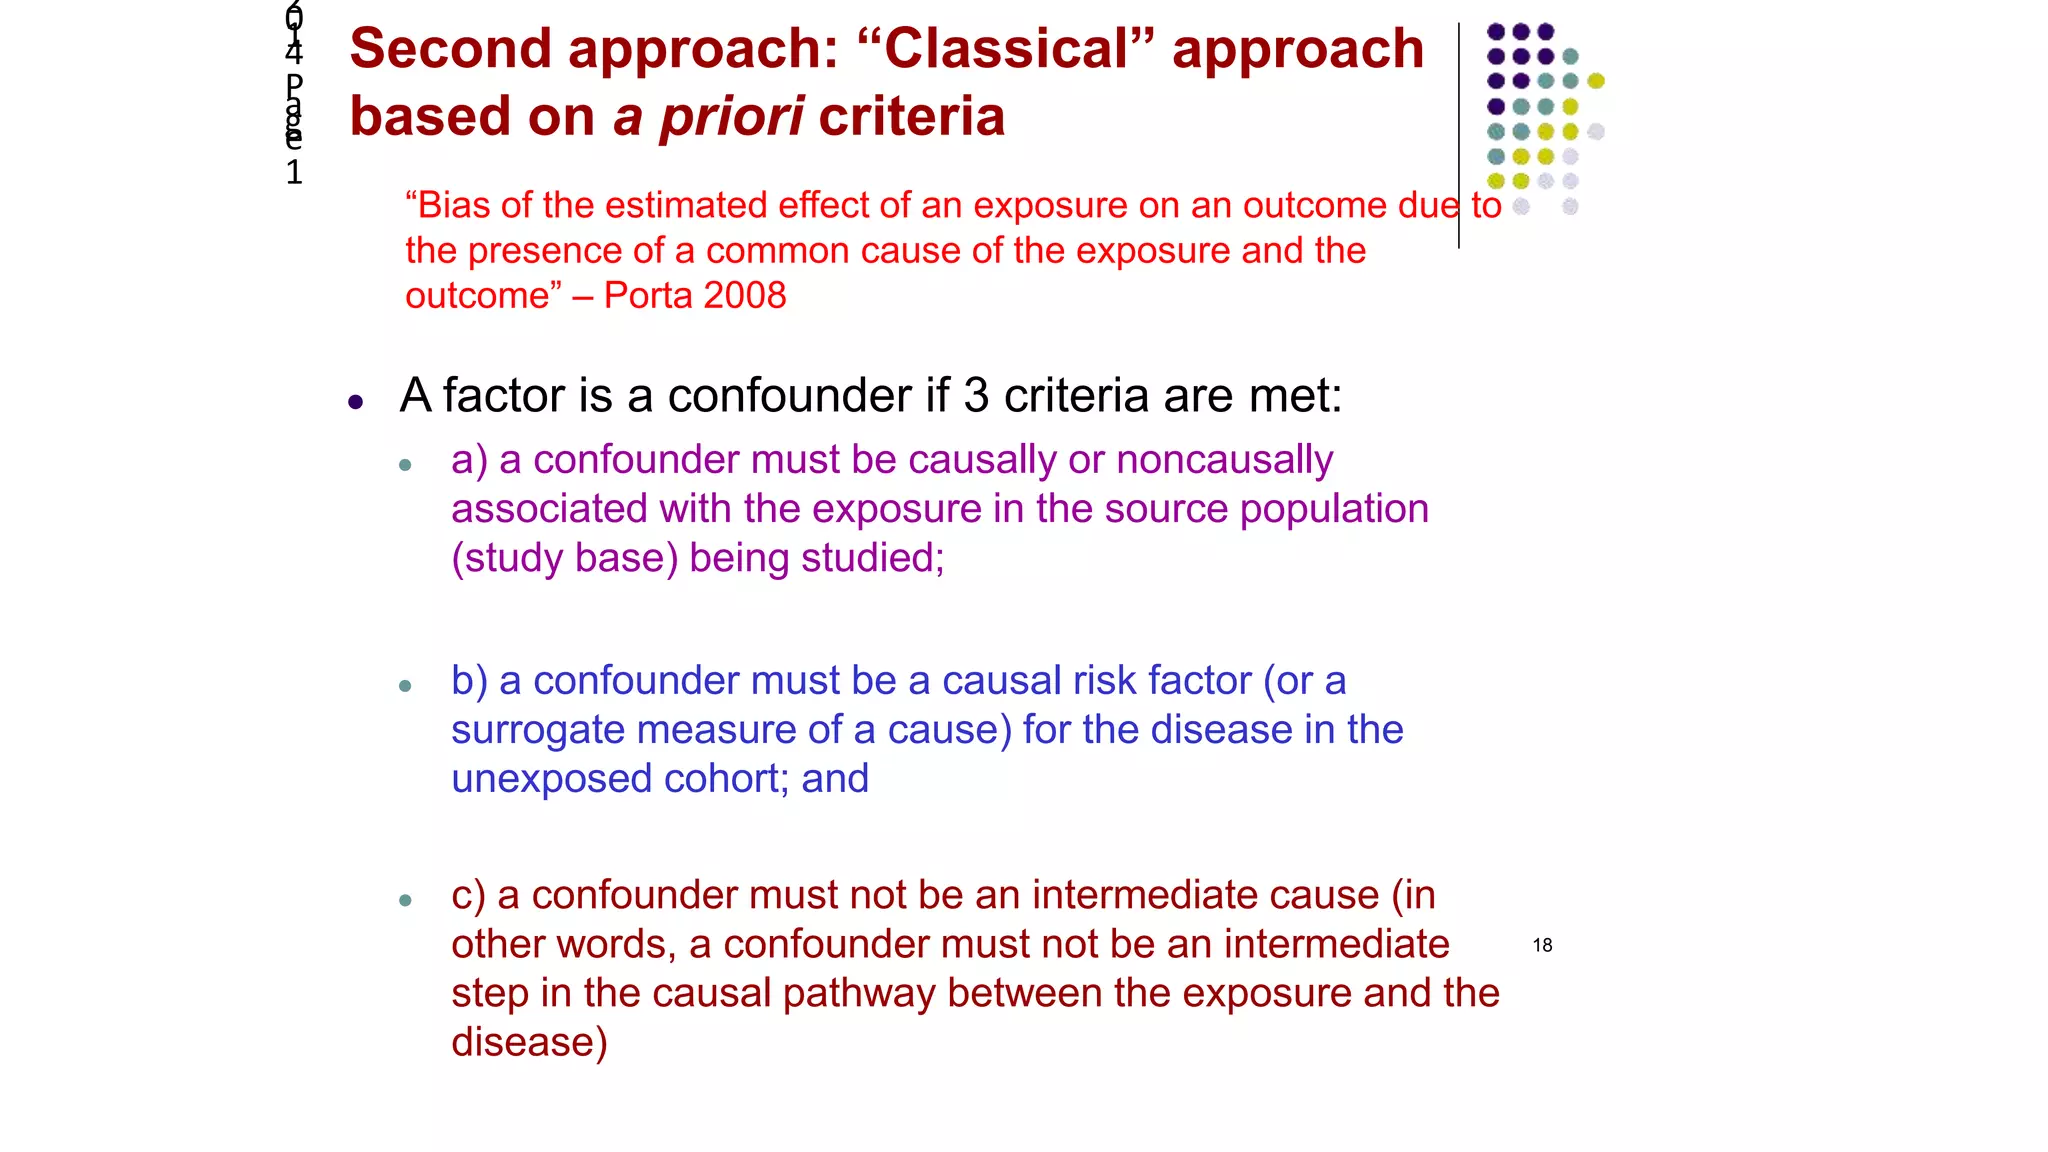
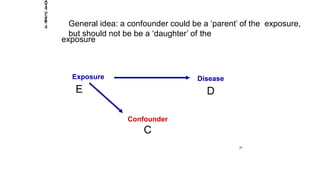
This document discusses confounding and the criteria for determining a confounding factor:
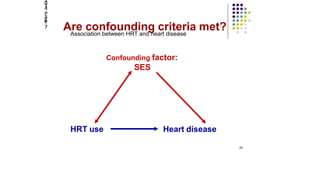
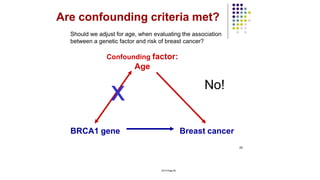
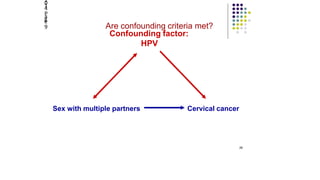
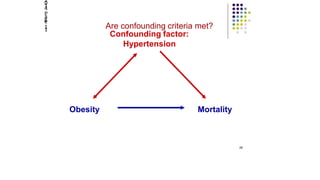
1) A confounder must be associated with the exposure in the study population.
2) A confounder must be a risk factor for the disease.
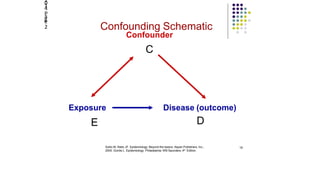
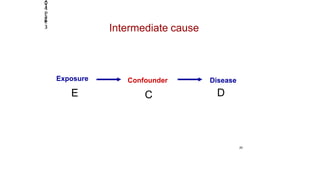
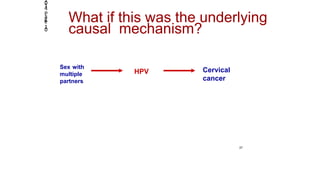
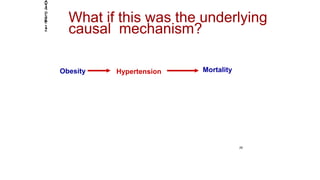
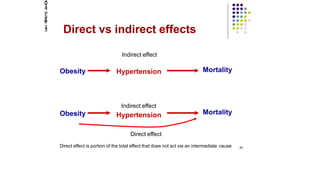
3) A confounder must not be an intermediate step between the exposure and disease.
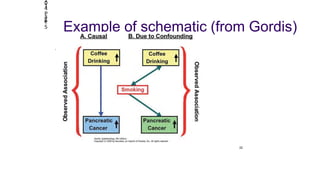
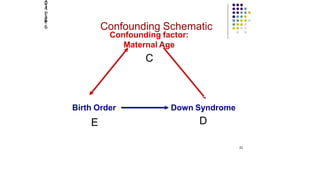
The document provides examples of applying these criteria to determine if a factor is a confounder in various exposure-disease relationships.