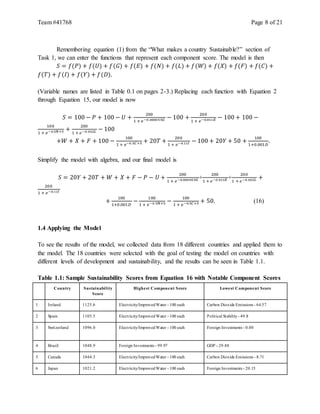
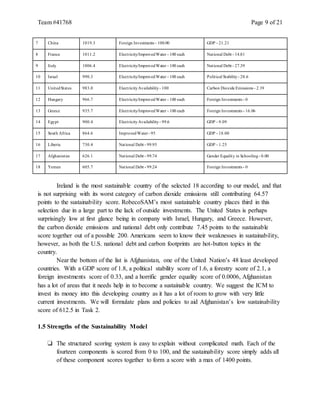
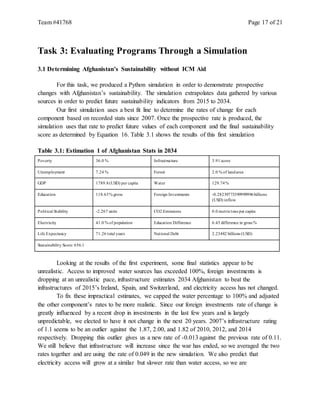
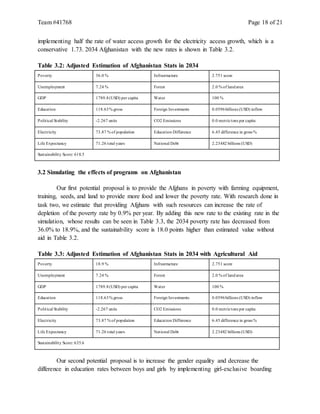
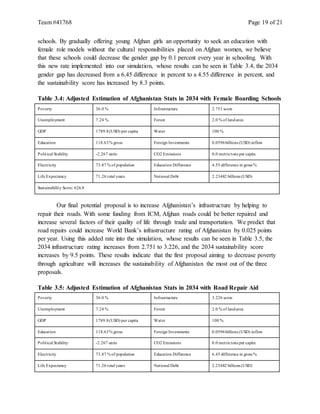
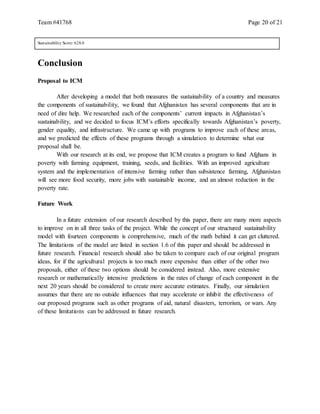
Team #41768 Page 1 of 21
For office use only
T1 ________________
T2 ________________
T3 ________________
T4 ________________
Team Control Number
41768
Problem Chosen
D
For office use only
F1 ________________
F2 ________________
F3 ________________
F4 ________________
2015 Interdisciplinary Contest in Modeling (ICM) Summary Sheet
Cultivating Afghanistan’s Sustainability Through Agriculture
The ICM has asked us to do three specific tasks in an attempt to make the world a more
sustainable place, and our first task was to make a model to measure the sustainability of a
country. While trying to balance the environmental, social, political, and business/financial
aspects of sustainability, we decided on fourteen factors to include to determine sustainability.
The factors are as follows: poverty (P), unemployment (U), GDP (G), education (E), gender
equality (N), life expectancy (L), improved water sources (W), access to electricity (X), forest
land (F), carbon dioxide emissions (C), infrastructure (T), foreign investments (I), political
stability (Y), and external debt (D). For the model, we decided to evaluate each independent
factor on a scale from 0 to 100. The total sustainability score (S) is simply the sum of all of the
factors’ evaluations, creating a sustainability score from 0 to 1400. Our beginning model is
𝑆 = 𝑓(𝑃) + 𝑓(𝑈) + 𝑓(𝐺) + 𝑓(𝐸) + 𝑓(𝑁) + 𝑓(𝐿) + 𝑓(𝑊) + 𝑓(𝑋) + 𝑓(𝐹)
+𝑓(𝐶) + 𝑓(𝑇) + 𝑓(𝐼) + 𝑓(𝑌) + 𝑓(𝐷).
After creating individual models for each component using linear, logistical, and inverse
equations, we substituted each model in to our sustainability model and reduced it to
𝑆 = 20𝑌 + 20𝑇 + 𝑊 + 𝑋 + 𝐹 − 𝑃 − 𝑈 +
200
1 + 𝑒−0.000055𝐺 +
200
1 + 𝑒−0.011𝐸
+
200
1 + 𝑒−0.022𝐿 +
200
1 + 𝑒−0.11𝐼 +
100
1+0.001𝐷
−
100
1 + 𝑒−0.5𝑁+5 −
100
1 + 𝑒−0.5𝐶+5 + 50.
After testing, we found the model rates well-developed and environmentally alert
countries such as Ireland highly, developed but environmentally reckless countries such as the
United States modestly, and underdeveloped countries such as Afghanistan poorly. Seeing that
Afghanistan had many components that score very low in our model, we feel that the country
would benefit greatly from programs, policies, and aid from the ICM. We addressed each
troubled component independently, and decided the ICM has the most potential to help
Afghanistan in either its poverty through investments in agriculture, gender equality through
boarding schools, or infrastructure through road repairs.
To see the effects of each program, we created a Python simulation to predict each of
Afghanistan’s sustainability components through the next 20 years at various rates of change.
After testing each of our three proposed programs, the program with the most impact on the
modelled sustainability score is the program towards agriculture with an increased sustainability
score of 18 points over the predicted sustainability score without ICM help. Through our model,
research, and simulation, we propose that ICM provides farming equipment, training, seeds, and
facilities to the Afghans in poverty to make Afghanistan a more sustainable place.
Team #41768 Page 2 of 21
Restatement of the Problem
We have been hired by the International Conglomerate of Money (ICM) to assist the
organization in making the world a more sustainable place. Our first task is to develop a model to
determine the sustainability of individual countries and see what countries are in dire need of
help from ICM. Our second task is to choose a developing country, identify its areas of need, and
develop programs and policies to make it a more sustainable country. Our third task is to
evaluate the effects of our proposed programs and policies over the next 20 years using our new
sustainability model. Ultimately, we hope to aid ICM in the sustainable development in an
underdeveloped country.
Introduction
In today’s world, many countries face the trouble of balancing development, equity,
poverty eradication, and quality of life with climate change prevention, preservation of natural
resources, and quality of the environment. If society does not progress, quality of life never
becomes better. Yet, wasting natural resources and the environment also creates hardships on the
future quality of life. Balancing these two seemingly opposing forces has recently been given the
name “sustainable development,” and the goal of sustainable development is to improve
conditions now while preserving resources for the future. Each country has done its own part in
sustainable development, although not always in a successful way. Some countries have forged
forward in progress, but have forgotten to preserve the environment to sustain. Other countries
have stagnated in growth and thus lack the technology to preserve their environments. In Task 1,
we shall determine what makes a country sustainable, and we will create a model to measure the
sustainability of a country.
Table 0.1: Explanation of Variables
e Euler’s Number; Approximately 2.71828
S Sustainability Score; Measuredin Equation 1 andEquation 16
x An undefinedcomponent in determiningsustainability(S)
P PovertyRate(percent); PovertyScore (𝑓(𝑃)) is measuredin Equation 2
U Unemployment Rate (percent); Unemployment Score (𝑓(𝑈)) is measuredin Equation3
G GDP per capita (current USdollars); GDP Score (𝑓(𝐺)) is measuredin Equation4
E Gross Primary EducationRate (gross percent);Education Score (𝑓(𝐸))is measuredin Equation5
N Gender Equality in PrimarySchooling(difference ofgross percentages); Gender EqualityScore (𝑓(𝑁)) is measuredin
Equation 6
Team #41768 Page 3 of 21
L Life Expectancy(years);Life ExpectancyScore (𝑓(𝑃)) is measuredin Equation 7
W Access to Improvedwater (percent of population); WaterScore (𝑓(𝑊)) is measuredin Equation 8
X Access to Electricity(percent ofpopulation); ElectricityScore (𝑓(𝑋)) is measuredin Equation 9
F ForestedArea (percent ofsurface area); Forest Score (𝑓(𝐹)) is measuredin Equation10
T Infrastructure Ratingby WorldBank.org(0to5 scale); Infrastructure Score (𝑓(𝑇))is measuredin Equation11
C Carbon Dioxide Emissions (metrictons percapita); CarbonDioxide Emissions Score (𝑓(𝐶)) is measuredin Equation
12
I Foreign Investments (billions ofU.S. dollars); Foreign Investments Score (𝑓(𝐼)) is measuredin Equation13
Y Political StabilityRatingby Quandl.com(-2.5to+2.5scale); Political Stability Score (𝑓(𝑃)) is measuredin Equation
14
D National Debt (billions of U.S. dollars); National Debt Score (𝑓(𝐷))is measuredin Equation15
Task 1: Modelling the Sustainability of a Country
1.1 What makes a country Sustainable?
Sustainability can be measured in many different variables based on the intent of a
perceiver. For example, the sustainability investment organization RobecoSAM recently released
a similar model to the one we have been asked to create by ICM. In RobecoSAM’s model,
however, governance accounts for a large 60% of their sustainability score while environment
and social indicators only make up 15% and 25% of the score respectively.
Our group enjoyed the structured system that RobecoSAM used for their model, but we
wanted to focus less on the governance side and more on the environmental side. We also
wanted to reduce the number of variables so that it is easier to explain what specifically makes a
country sustainable.
With these goals in mind, we decided to formulate fourteen components of sustainability
and use a model that weights each of these components equally. Each component can receive a 0
to 100 score (100 being the best influence towards sustainability and 0 being the worst), and this
system makes the total sustainability score (S) range from 0 to 1400. Ultimately, this model starts
in the form of
𝑆 = 𝑓(𝑥1)+ 𝑓(𝑥2)+.. . +𝑓(𝑥14), (1)
where 𝑥 𝑛 is the nth component being considered and 𝑓(𝑥 𝑛)is a function that returns a score
between 0 and 100 base off of the component 𝑥 𝑛.
For the components, we decided on the environmental components of carbon dioxide
emissions, access to electricity, access to improved water, and forestry; the social components of
Team #41768 Page 4 of 21
poverty, life expectancy, education, and gender equality in schooling; the business/financial
components of unemployment, GDP, infrastructure, and foreign investment; and the governance
components of political stability and national debt. This selection creates a division of the
sustainability score such that environmental components represent 29%, social components
represent 29%, business/financial components represent 29%, and governance represents 14%.
This selection focuses more on the quality of life and resources of a country rather than focusing
on governmental attempts to improve sustainability as RobecoSAM did in their model. To
advance the model, however, we must determine the equations for each of the fourteen
component functions.
1.2 Determining the Component Functions
Poverty (P) is one of the largest indicators of the quality of living in a country, and so a
low rate of poverty means more sustainability. With this in mind, our goal is to create a function
where a 0% poverty rate earns a full 100 points while 100% poverty earns 0 points. The linear
function
𝑓(𝑃) = 100 − 𝑃 (2)
fulfills this objective, allowing a country to get a point for each percent of the population that is
not in poverty. (Keep in mind that each rate in this model is measured in percents so that P = 1.0
is 1%, not 100%.)
Unemployment (U) is a measure of the quality life where a higher rate is less
sustainable, much like poverty. As such, the unemployment model is similar to the model we
used for poverty, and is
𝑓(𝑈) = 100 − 𝑈 (3)
Gross domestic product per capita (G) is another measure of the quality of life, for
GDP measures the amount of final goods and services produced in that country that year. For
this model, we will use GDP per capita, which is a fair measure of the value of goods and
services consumed by each individual in that year. Unfortunately, it is not a rate like poverty and
unemployment where the values are already restricted to be between 0 and 100. The GDP has no
cap, so we use a logistical function with an upper limit of 100 to make the rating fall between 0
and 100. The function
𝑓(𝐺) =
200
1 + 𝑒−0.000055𝐺 − 100 (4)
allows us to give 0 points when there is no GDP, 50 points when GDP is at a reachable 20,000
GDP per capita, and higher values will keep increasing towards 100. While no country can ever
Team #41768 Page 5 of 21
get a complete 10 points without rounding, this function allows the GDP per capita score of this
model to stay in our desired range of 0 to 100.
Gross primary education rate (E) is an important part to sustainability, for an educated
society can learn how to sustain themselves and their environment more effectively. However,
this gross rate is different than rates we have used previously in the model. The gross primary
education rate takes the total number of people enrolled in primary education divided by the
number of eligible children in the primary schooling’s expected age range. Thus, students of
primary education that are older than younger than the typical primary school student are
counted towards the numerator and not the denominator. This calculation allows the education
rate to be above 100% in several cases. With this in mind, a similar logistical function to the
GDP function was used for the gross primary education rate function, and that function is
𝑓(𝐸) =
200
1 + 𝑒−0.011𝐸 − 100. (5)
This function gives no points for a rate of 0%, about 50 points for 75%, and upwards towards
100 points for anything above 75%.
Gender Equality in Schools (N) is one means of easily evaluating a country's gender
rights and equality. Such equality in a country directly affects women’s quality of life while also
affecting the country as a whole by allowing women work in the workplaces that they are the
most efficient. While some models such as RobecoSAM’s model look at government policies to
evaluate gender equality, we felt that looking at the difference between primary school
attendance rates in boys and girls gives us a simpler and less subjective evaluation on the gender
equality of a country. Since the gross primary education rates for each gender are used in this
function as well, a logistical function is used to cap the gender equality score at 100 and floor the
score at 0 with limits. The function
. 𝑓(𝑁) = 100 −
100
1 + 𝑒−0.5𝑁 +5 (6)
is used so that 50 points is given if there is a 10% difference in rates, a lower or negative
difference would approach the upper limit of a score of 100, and a higher difference will
approach the lower limit of a score of 0.
Life Expectancy (L) says many things about the quality of life of a country. It implies
the health of the society, necessary resources of the society, and society’s basic ability to live.
Since life expectancy can theoretically have no cap, we must place a cap on the life expectancy
function with another logistical function. The function
𝑓(𝐿) =
200
1 + 𝑒−0.022𝐿 − 100 (7)
Team #41768 Page 6 of 21
gives no points if there is a dreadful 0 years of life expectancy, 50 points for an acceptable 50
years of life expectancy, and the limit approaches 100 as life expectancy reaches immortality.
Availability of improved water sources (W) is a great component of sustainability as
improved water improves the quality of life now as well as the health and sustainability of a
society in the future. Since the percent of the population with access to improved water sources
is used for this set of data, and a higher the rate of access means a higher sustainability, the
function is the simple linear equation of
𝑓(𝑊) = 𝑊 (8)
where 1 percent more of access results in a 1 point increase in the availability of improved water
sources score.
Availability to electricity (X) indicates a country’s quality of life and resource to further
their own development in the future. The percent of population with access to electricity is used
for this calculation, and as a simple rate it can be scored as
𝑓(𝑋) = 𝑋 (9)
where a 1 percent increase in availability results in a 1 point increase in the availability of
electricity score.
Forests (F) provide much sustainability for a country for they clean the air as well as
provide lumber and paper to a society. The percent of land that is forested is used in this
function, which allows the simple linear function of
𝑓(𝐹) = 𝐹 (10)
to be used where a 1 percent increase in forested land increases the forest score by 1.
Infrastructure (T) is an indicator to sustainability in that infrastructure suggests a
developed society now and potential to advance in the future. The World Bank has created an
index rating for each country’s infrastructure based on a 5-point scale. For our model, we trust
the World Bank’s assessment procedure of countries’ infrastructures, and so we can turn the 5-
point scale into a 100-point scale by using the linear function
𝑓(𝑇) = 20𝑇. (11)
Carbon dioxide emissions (metric tons per capita) (C) not only pollute the air and
make a society an unhealthy place to live, but they also increase the rate of climate change which
endangers much of the world. Since there is no cap to such emissions, the logistical function
. 𝑓(𝐶) = 100 −
100
1 + 𝑒−0.5𝐶+5 (12)
Team #41768 Page 7 of 21
can be used to give 50 points to the sustainability score if 10 metric tons of carbon dioxide is
being produced per capita, lower rates of emission approach the upper limit of 100, and higher
rates approach the lower limit of 0. The upper limit of 100 was set even though emissions can
not be less than 0 so that increasing emissions up towards 10 metric tons per capita lose
increasingly more points from their carbon dioxide emissions score.
Foreign Investments (I) is also an indicator of sustainability of a country, for
investments increase to total amount of money in a country and give a country more potential to
grow. The measurement by World Bank measures the net inflows of foreign investments to
domestic companies, increasing the production of these companies, the number of workers able
to be hired, and the wages that the company can pay. Having no cap on the amount for foreign
investments, a logistical equation is used here so that large amounts of investments approach a
foreign investment score of 100. The function
. 𝑓(𝐼) =
200
1 + 𝑒−0.11𝐼 − 100 (13)
in billions of US dollars gives 50 points if there is 50 billion US dollars in foreign investments,
approaches 100 points as the investments increase, and 0 points with no investments. In addition,
all countries with negative dollars in foreign investment should use a 0 instead of their negative
value (see assumptions).
Political stability (Y) is very important in a sustainable country for political tension can
cause a slow or stop in the production of a country, or they may even lead to civil wars that can
hurt a country’s well-being deeply. Quandl.com has estimated several countries’ political
staability on a scale of -2.5 to +2.5 using many indicators. Trusting their ranking, we can adjust
their scale of -2.5 to +2.5 to our desired scale of 0 to 100 with the linear equation
𝑓(𝑌) = 20𝑌 + 50. (14)
National Debt (D) is our last component, and a large national debt suggests a roadblock
to future development of the quality of life. Since a large debt is detrimental to the sustainability
of a country, and there is no cap on debt, the debt function must have a lower limit of 0 as debt
reaches infinity. This task is accomplished in the equation
𝑓(𝐷) =
100
1+0.001𝐷
(15)
in billions of US dollars. In this equation, 0 US dollars in national debt results in 100 points, 1.5
trillion US dollars in national debt results in 50 points, and higher national debts begin to
approach the lower limit of 0 points towards the sustainability score.
1.3 Completing the Sustainability Model
Team #41768 Page 8 of 21
Remembering equation (1) from the “What makes a country Sustainable?” section of
Task 1, we can enter the functions that represent each component score. The model is then
𝑆 = 𝑓(𝑃) + 𝑓(𝑈) + 𝑓(𝐺) + 𝑓(𝐸) + 𝑓(𝑁) + 𝑓(𝐿) + 𝑓(𝑊) + 𝑓(𝑋) + 𝑓(𝐹) + 𝑓(𝐶) +
𝑓(𝑇) + 𝑓(𝐼) + 𝑓(𝑌) + 𝑓(𝐷).
(Variable names are listed in Table 0.1 on pages 2-3.) Replacing each function with Equation 2
through Equation 15, our model is now
𝑆 = 100 − 𝑃 + 100 − 𝑈 +
200
1 + 𝑒−0.000055𝐺 − 100 +
200
1 + 𝑒−0.011𝐸 − 100 + 100 −
100
1 + 𝑒−0.5𝑁+5 +
200
1 + 𝑒−0.022𝐿 − 100
+𝑊 + 𝑋 + 𝐹 + 100 −
100
1 + 𝑒−0.5𝐶+5 + 20𝑇 +
200
1 + 𝑒−0.11𝐼 − 100 + 20𝑌 + 50 +
100
1+0.001𝐷
.
Simplify the model with algebra, and our final model is
𝑆 = 20𝑌 + 20𝑇 + 𝑊 + 𝑋 + 𝐹 − 𝑃 − 𝑈 +
200
1 + 𝑒−0.000055𝐺 +
200
1 + 𝑒−0.011𝐸 +
200
1 + 𝑒−0.022𝐿 +
200
1 + 𝑒−0.11𝐼
+
100
1+0.001𝐷
−
100
1 + 𝑒−0.5𝑁+5 −
100
1 + 𝑒−0.5𝐶+5 + 50. (16)
1.4 Applying the Model
To see the results of the model, we collected data from 18 different countries and applied them to
the model. The 18 countries were selected with the goal of testing the model on countries with
different levels of development and sustainability, and the results can be seen in Table 1.1.
Table 1.1: Sample Sustainability Scores from Equation 16 with Notable Component Scores
Country Sustainability
Score
Highest Component Score Lowest Component Score
1 Ireland 1125.6 Electricity/ImprovedWater - 100 each Carbon Dioxide Emissions - 64.57
2 Spain 1105.5 Electricity/Improved Water - 100 each Political Stability- 49.8
3 Switzerland 1096.0 Electricity/ImprovedWater - 100 each Foreign Investments - 0.00
4 Brazil 1048.9 Foreign Investments - 99.97 GDP - 29.88
5 Canada 1044.3 Electricity/ImprovedWater - 100 each Carbon Dioxide Emissions - 8.71
6 Japan 1021.2 Electricity/ImprovedWater - 100 each Foreign Investments - 20.15
Team #41768 Page 9 of 21
7 China 1019.3 Foreign Investments - 100.00 GDP - 21.21
8 France 1011.2 Electricity/ImprovedWater - 100 each National Debt - 14.81
9 Italy 1006.4 Electricity/ImprovedWater - 100 each National Debt - 27.39
10 Israel 990.3 Electricity/ImprovedWater - 100 each Political Stability- 28.6
11 UnitedStates 983.0 ElectricityAvailability - 100 Carbon Dioxide Emissions - 2.19
12 Hungary 966.7 Electricity/ImprovedWater - 100 each Foreign Investments - 0
13 Greece 935.7 Electricity/ImprovedWater - 100 each Foreign Investments - 16.06
14 Egypt 900.4 ElectricityAvailability - 99.6 GDP - 9.09
15 South Africa 864.6 ImprovedWater- 95 GDP - 18.00
16 Liberia 730.4 National Debt - 99.95 GDP - 1.25
17 Afghanistan 626.1 National Debt - 99.74 Gender Equality in Schooling - 0.00
18 Yemen 605.7 National Debt - 99.24 Foreign Investments - 0
Ireland is the most sustainable country of the selected 18 according to our model, and that
is not surprising with its worst category of carbon dioxide emissions still contributing 64.57
points to the sustainability score. RobecoSAM’s most sustainable country places third in this
selection due in a large part to the lack of outside investments. The United States is perhaps
surprisingly low at first glance being in company with Israel, Hungary, and Greece. However,
the carbon dioxide emissions and national debt only contribute 7.45 points to the sustainable
score together out of a possible 200. Americans seem to know their weaknesses in sustainability,
however, as both the U.S. national debt and carbon footprints are hot-button topics in the
country.
Near the bottom of the list is Afghanistan, one of the United Nation’s 48 least developed
countries. With a GDP score of 1.8, a political stability score of 1.6, a forestry score of 2.1, a
foreign investments score of 0.33, and a horrific gender equality score of 0.0006, Afghanistan
has a lot of areas that it needs help in to become a sustainable country. We suggest the ICM to
invest its money into this developing country as it has a lot of room to grow with very little
current investments. We will formulate plans and policies to aid Afghanistan’s low sustainability
score of 612.5 in Task 2.
1.5 Strengths of the Sustainability Model
❏ The structured scoring system is easy to explain without complicated math. Each of the
fourteen components is scored from 0 to 100, and the sustainability score simply adds all
of these component scores together to form a score with a max of 1400 points.
Team #41768 Page 10 of 21
❏ The sustainability score is not arbitrary. The closer a score is to 1400, the more
sustainable a country is.
❏ The components measured in rates are easy to understand. Each percentage point those
components have increases or decreases the sustainability score by one point depending
on the relation.
❏ The components used are applicable to even under-developed countries. These
components attempt to gauge the basic necessities of sustainability in quality of life,
equity, political/financial stability, and environmental health. Ultimately, this model can
be applicable to all countries with the access to the appropriate data.
1.6 Weaknesses of the Sustainability Model
❏ The components that have to be capped through limits are harder to explain to non-
mathematical audiences. In a future version of the model, another approach such as
piece-wise functions could be used instead to model the component scores in an easier
way to explain.
❏ The political stability and infrastructure scores are based off of outside ratings. If these
ratings become skewed, change in form, or stop altogether, this model can not be used
until a new means of scoring these two components is found.
❏ Some component functions make it hard to score a full 100 points or hard to score no
points. E.g. The 55 point improved water score obtained by Yemen suggests an average
quality of water access when it actually the lowest score among the 18 countries. In a
future version of the model, non-linear models could be used in these cases to widen the
range of points given to these components at the cost of some simplicity.
❏ The final, algebraically reduced form of the model is cluttered and complicated without
explanation.
Team #41768 Page 11 of 21
Task 2: Formulating Viable Programs to Aid Afghanistan
2.1 Summary of Task 2
Using the model results on the most important issues required to improve Afghanistan’s
sustainability, statistics from various sources, and the Afghanistan National Development
Strategy (ANDS) recommendations to the International Monetary Fund, we came up with viable
solutions that can be implemented to increase sustainability. For each of the determinant factors
of sustainability, we came up with solutions that are possible through government policies,
creation of new programs, and aid from the ICM.
2.2 Poverty Reduction
Agriculture is the main industry in Afghanistan producing approximately 24% of the
country’s gross domestic product. The main crops produced are almonds, pomegranates,
pistachios, raisins, and apricots as reported by United States Agency for International
Development (USAID). Subsistence farming is mainly used especially by farmers living below
the poverty line, and 36% of the Afghanistan population currently lives under the poverty line
(10.998 million people). Due to a lack of proper farming equipment, ease of credit accessibility,
and weather conditions there is a high rate of food insecurity.
Introduction of intensive farming as opposed to subsistence farming will be a great way
to reduce poverty through creation of jobs, new income sources and food security. This can be
done by having a community of 100 subsistence farmers coming together and joining their
resources to begin intensive farming. Before beginning the intensive farming, the community
will require training on the improved farming equipment that will be used as well as financial
training to create more profitable intensive farming units. There should be a criteria for selection
of the participants for the intensive farming units, and the first condition should be people living
under the poverty line. The ICM can provide money or credit to educate the selected community
members, buy equipment, seeds and fertilizers. Beginning 50,000 community intensive farming
units of 100 people per unit will reduce the poverty rate by about 50%, reducing the current
poverty rate to 18%.
2.3 Unemployment
The current rate of unemployment is 8% in Afghanistan, which results to labor migration
and increased crime rates from the unemployed youth. A less extensive credit allocation criteria
would result to an increase in the rate of self-employment due to the availability of starting
capital. Providing training to the unemployed on how to begin business ventures and how to
effectively use their skills, will help decrease the unemployment rates. A creation of 5,000
Team #41768 Page 12 of 21
successful business ventures with each venture employing two people will reduce the
unemployment rate to 6.8%. Increasing the ease in which unemployed people find out about
employment opportunities would also help reduce unemployment. This can be done by creating a
free online site or a free newspaper publication for the non-internet using population that posts
the available employment opportunities from employers. If the site helps 10,000 people get jobs
in a year the unemployment rate will further decrease to 5.6%. Therefore, the ICM should
consider investing in business start-up training and creation of a free online site or newspaper to
ease the of information transfer from employers to job seekers.
2.4 Education
The World Bank reported a 104% enrollment rate to primary schools in Afghanistan as of
2012. The secondary net attendance percentage for both male and female students in 2012 was
63.9% based on the United Nations International Emergency Children Funds (UNCIEF)
statistics. Providing incentives for further education after primary education in the country will
increase the country’s skilled future labor force and further improve the literacy levels. Countries
with high literacy levels have higher Gross Domestic Products (GDP). Provision of scholarships
to intelligent primary educated students who lack financial resources to join secondary schools
would be an incentive that the ICM should consider. The ICM should improve the quality of
existing schools by asking each school management for the most important issues that need
reform and build more schools to decongest current schools.This will provide a better learning
atmosphere that will improve the attendance rates and encourage further advancement in
education. Also improving the quality of education through the presence of better trained
teachers and having a policy that ensures that newly employed teachers meet the required
credentials needed. This will improve the quality of educated Afghans thus raising the country’s
future GDP.
2.5 Education Difference
The gender difference in school attendance is big in Afghanistan with the male primary
school attendance rate being 34 percent higher than the female primary school attendance.
According to the 2005 UNICEF report, studies show that educating girls is the single most
effective policy to raise overall economic productivity. Women education lowers the infant and
maternal mortality rate, educates the next generation, improves nutrition and promotes health.
Educated girls with at least 6 years of schooling are more able to protect themselves from
HIV/AIDS as well as other diseases. In addition, educated mothers immunize their children 50%
more than uneducated ones and are twice as likely to send their children to school than the
uneducated ones. Single-parent units run by educated mothers are also less likely to be poor.
The government of Afghanistan should enforce the rule requires all people aged 7-15 to
attend school. Since the first years of education are the most important schools should provide
better systems that cater for the girls to ensure that they have a good foundation in education.
Team #41768 Page 13 of 21
Creation of girls’ boarding schools that provide food and good sanitary conditions, could be a
start since they will provide a secure place for the girl child against the existing bias in the
community around them. Due to the cultural norms that require girls to be taught by females in
some conservative communities in Afghanistan each school should have 1:3 ratio of female to
male teachers. The ICM should consider building 20 female boarding schools where 12 are
primary schools and 8 secondary schools with an intake of 300 each to help bridge the gender
gap. This will also increase the female literacy levels of females above 15 years by 0.03% per
year to 12.63% on the first year each secondary school enrolls students.
2.6 Political Stability
Increased democratic practices by the Afghanistan government such as conducting
peaceful democratic elections will help increase its political stability. Also, creation of a stronger
judicial system that enables the rule of law and respect for human rights will improve the
political stability. Military and the police force training will also ensure that there is political
stability as the government can protect its citizens against terrorist threats and enforce the law.
The government should fight the illegal narcotic industry that supplies funds to terrorist activity
as reported by the ANDS, thereby improving security. Ensuring good relations with other nations
in the world and hence reducing enemy nations will improve the political stability too. These
relations can be enhanced by encouraging trading with other nations, participating in world
activities such as the World Cup, Olympics or even the United Nations activities.
2.7 Electricity
World bank reports that only 41% of the Afghans have access to electricity and the
ANDS reports that Afghanistan imports electricity. Most rural areas have no access to electricity,
so the use of other forms of energy would help improve the productivity of such areas. For
example, using more machinery will improve the quality of goods and reduce the amount of time
spent in the creation of goods. Alternative forms of energy that may be used are solar panels,
small diesel generating power sources, biogas and windmills. The farmers can be trained on the
production of biogas and as a result have a new form of energy. Also the ICM can provide solar
panels in the hot areas and the energy created from the panels can be used to create new
employment opportunities for businesses that require few watts of energy such as a barber shop.
Provision of increased training in the fields of energy creation will also help. The ICM can
provide scholarships in the tertiary level in energy related fields and require that those trained to
work in Afghanistan for a period of time after their graduation. The government can also require
that energy companies train a percentage of their employees on new ways for producing energy
cheaply and effectively.
2.8 Life Expectancy
Team #41768 Page 14 of 21
At present the World Health Organization ranks Afghanistan’s healthcare system as one
of the worst in the world. It has a high maternal mortality rate, communicable diseases such as
malaria, TB and HIV/AIDS, and epidemics such as cholera, acute and chronic malnutrition. The
health care system has few doctors and nurses with one doctor for 6000 patients and one nurse
for 2,500 patients. Afghans currently live to age 63 and a better health care system can help raise
their life expectancy age. To improve the health care system, the government should provide
midwife training and family planning education to the people to reduce the maternal mortality
rate. Also the ICM can create free maternal hospitals in areas with high maternal mortality rates.
The government should require that all newly born children receive all the required vaccination.
Also during epidemics the government should provide free vaccinations to people if they are
available by sending nurses to schools and homes. Training nurses and doctors should be
increased and the government should subsidize the required fees. Adding 24 nurses and 29
doctors to each present doctor and nurse will result to a ratio of 1:100 nurses to patients and
1:200 doctors to patients.
TB vaccines should be provided in prone areas, to reduce the spread of TB and those
suffering from it should be secluded from the society to reduce its spread. The ICM should
provide mosquito nets to the most prone malaria regions of the country and teach the
communities how to use them. To reduce epidemics proper sanitary conditions should be
provided by the government. A committee should be formed to make sure that hotels, and
schools provide safe food and water to people and that there is a restroom in each facility. The
ICM should start mobile clinics which will be very helpful in rural communities with poor
infrastructure and have hospitals far from them.
2.9 Infrastructure
On a scale of 1 to 5, World Bank ranks Afghanistan’s infrastructure as a 1.87. The
government should fund projects that improve the country’s infrastructure if they wish to
improve this score. Such expenditures should enlist the services of other countries which are
efficient in the needed specific fields as it will save money, time and enable the use of the best
possible technology available. Creation of infrastructure will also help reduce the poverty rate
through creation of jobs and increased investments raising the gross domestic product. The
government is highly encouraged to improve the road network as this will help improved trade
with other countries and within the country. While the U.S. has been building roads in
Afghanistan with such goals in mind, the Afghan government can not keep up with the
maintenance of the roads and are requesting financial help according to the recent article “After
of Billions in U.S. investment, Afghan roads are falling apart” by the Washington Post. A better
road system will also lead to improved health care and improve school attendance as hospitals
and schools will be more accessible. The ICM could help Afghanistan reach these goals by
investing in the repair of the roads.
2.10 Water
Team #41768 Page 15 of 21
The Afghanistan National Development Strategy committee (ANDS) reports that 95% of
water consumption goes to agriculture in Afghanistan. Irrigated farms produce five times more
food than non-irrigated farms. Therefore, coming up with improved irrigation methods that help
conserve water either by recycling the water or using less of it are necessary. This can begin with
ICM teaching farmers and the government providing them incentives to use water conserving
irrigation methods. According to the World Bank 2012 statistics, only 64% of Afghans have
access to improved water sources. Creation of wells, boreholes and dams by government and
ICM aid in areas with no water access will help increase the access of water. ICM can also help
teach the rural communities on cheap water purification methods that can be used on their
already existing water before better water sources are created.
2.11 Investments
New government policies that make foreign investments easier and privatization easy for
example by providing tax cuts or government subsidies are ways to increase investments. A
political stable Afghanistan attract foreign investment and presence of available labor in the
country is a good attraction. Increased foreign investments will lead to an increase in the job
creation while privatization of businesses will lead to more efficient business structures that are
profitable. The combination will result to an increase in the country’s gross domestic product.
Therefore, the government should ensure peace in the country and have better policies that
attract investments.
2.12 Forests
Deforestation is a huge issue facing Afghanistan which is caused by the use of wood as a
source of fuel and the presence of a timber mafia as reported by the Wikipedia. The timber mafia
is present due to the high profits received from selling timber to the neighboring country
Pakistan which has strict forest conservation policies. Deforestation results to soil erosion which
increases the risk of flooding and reduces the productivity of the land. This results to
endangerment of the agricultural sector which is a huge contributor to the economy. The
government can create strict policies that help deal with the timber mafia and also require
everyone to plant two trees for every tree they cut. ICM can start campaigns to plant trees and
increase recycling through seminars and the media. Tree planting can be used as a symbol for
something that is important and will be widely accepted by the Afghans. For example, women
can be encouraged to plant a tree to symbolize the respect of their basic human rights.
2.13 Gross Domestic Product (GDP)
Implementation of the suggested solutions to the existing problems, will increase the
current GDP. Enrollment of more students to school will increase the literacy levels of Afghans
Team #41768 Page 16 of 21
thus increasing the GDP in the long run. Improving infrastructure, poverty reduction, improved
health care, increased investments, reduced unemployment rates, and increased forest
conservation will result to a higher GDP in the long run.
2.14 Debt and CO2 Emissions
Based on our model Afghanistan is currently doing fine on its debt and CO2 emissions
with scores of 99.7 and 99.2 respectively on a scale of 100. With the current trend there are no
solutions just a recommendation that they should continue using their current policies as they are
proving to be sustainable so far.
2.15 Proposals to Test
After discussion, our group has decided to narrow ICM’s potential investments to three
proposals. Firstly, we want to look into providing Afghans in poverty with farming equipment,
training, and facilities and to implement intensive farming to improve the poverty rate. Secondly,
we would like to see the effects all-girl boarding schools would have on the gender inequality of
Afghanistan. Finally, we would like to know more about the effects repairing the roads would
have on Afghanistan’s infrastructure. We explore the possible effects of these proposals in Task
3.
Team #41768 Page 17 of 21
Task 3: Evaluating Programs Through a Simulation
3.1 Determining Afghanistan’s Sustainability without ICM Aid
For this task, we produced a Python simulation in order to demonstrate prospective
changes with Afghanistan’s sustainability. The simulation extrapolates data gathered by various
sources in order to predict future sustainability indicators from 2015 to 2034.
Our first simulation uses a best fit line to determine the rates of change for each
component based on recorded stats since 2007. Once the prospective rate is produced, the
simulation uses that rate to predict future values of each component and the final sustainability
score as determined by Equation 16. Table 3.1 shows the results of this first simulation
Table 3.1: Estimation 1 of Afghanistan Stats in 2034
Poverty 36.0 % Infrastructure 3.91 score
Unemployment 7.24 % Forest 2.0 % of landarea
GDP 1789.8(USD) per capita Water 129.74%
Education 118.63% gross Foreign Investments -0.28239773399999996billions
(USD) inflow
Political Stability -2.267 units CO2 Emissions 0.0 metrictons per capita
Electricity 41.0 % of population Education Difference 6.45 difference in gross %
Life Expectancy 71.26 total years National Debt 2.23482 billions (USD)
Sustainability Score: 656.1
Looking at the results of the first experiment, some final statistics appear to be
unrealistic. Access to improved water sources has exceeded 100%, foreign investments is
dropping at an unrealistic pace, infrastructure estimates 2034 Afghanistan to beat the
infrastructures of 2015’s Ireland, Spain, and Switzerland, and electricity access has not changed.
To fix these impractical estimates, we capped the water percentage to 100% and adjusted
the other component’s rates to be more realistic. Since our foreign investments rate of change is
greatly influenced by a recent drop in investments in the last few years and is largely
unpredictable, we elected to have it not change in the next 20 years. 2007’s infrastructure rating
of 1.1 seems to be an outlier against the 1.87, 2.00, and 1.82 of 2010, 2012, and 2014
respectively. Dropping this outlier gives us a new rate of -0.013 against the previous rate of 0.11.
We still believe that infrastructure will increase since the war has ended, so we averaged the two
rates together and are using the rate of 0.049 in the new simulation. We also predict that
electricity access will grow at a similar but slower rate than water access, so we are
Team #41768 Page 18 of 21
implementing half the rate of water access growth for the electricity access growth, which is a
conservative 1.73. 2034 Afghanistan with the new rates is shown in Table 3.2.
Table 3.2: Adjusted Estimation of Afghanistan Stats in 2034
Poverty 36.0 % Infrastructure 2.751 score
Unemployment 7.24 % Forest 2.0 % of landarea
GDP 1789.8(USD) per capita Water 100 %
Education 118.63% gross Foreign Investments 0.0596billions (USD) inflow
Political Stability -2.267 units CO2 Emissions 0.0 metrictons per capita
Electricity 73.87 % of population Education Difference 6.45 difference in gross %
Life Expectancy 71.26 total years National Debt 2.23482 billions (USD)
Sustainability Score: 618.5
3.2 Simulating the effects of programs on Afghanistan
Our first potential proposal is to provide the Afghans in poverty with farming equipment,
training, seeds, and land to provide more food and lower the poverty rate. With research done in
task two, we estimate that providing Afghans with such resources can increase the rate of
depletion of the poverty rate by 0.9% per year. By adding this new rate to the existing rate in the
simulation, whose results can be seen in Table 3.3, the 2034 poverty rate has decreased from
36.0% to 18.9%, and the sustainability score is 18.0 points higher than estimated value without
aid in Table 3.2.
Table 3.3: Adjusted Estimation of Afghanistan Stats in 2034 with Agricultural Aid
Poverty 18.9 % Infrastructure 2.751 score
Unemployment 7.24 % Forest 2.0 % of landarea
GDP 1789.8(USD) per capita Water 100 %
Education 118.63% gross Foreign Investments 0.0596billions (USD) inflow
Political Stability -2.267 units CO2 Emissions 0.0 metrictons per capita
Electricity 73.87 % of population Education Difference 6.45 difference in gross %
Life Expectancy 71.26 total years National Debt 2.23482 billions (USD)
Sustainability Score: 635.6
Our second potential proposal is to increase the gender equality and decrease the
difference in education rates between boys and girls by implementing girl-exclusive boarding
Team #41768 Page 19 of 21
schools. By gradually offering young Afghan girls an opportunity to seek an education with
female role models without the cultural responsibilities placed on Afghan women, we believe
that these schools could decrease the gender gap by 0.1 percent every year in schooling. With
this new rate implemented into our simulation, whose results can be seen in Table 3.4, the 2034
gender gap has decreased from a 6.45 difference in percent to a 4.55 difference in percent, and
the sustainability score has increased by 8.3 points.
Table 3.4: Adjusted Estimation of Afghanistan Stats in 2034 with Female Boarding Schools
Poverty 36.0 % Infrastructure 2.751 score
Unemployment 7.24 % Forest 2.0 % of landarea
GDP 1789.8(USD) per capita Water 100 %
Education 118.63% gross Foreign Investments 0.0596billions (USD) inflow
Political Stability -2.267 units CO2 Emissions 0.0 metrictons per capita
Electricity 73.87 % of population Education Difference 4.55 difference in gross %
Life Expectancy 71.26 total years National Debt 2.23482 billions (USD)
Sustainability Score: 626.8
Our final potential proposal is to increase Afghanistan’s infrastructure by helping to
repair their roads. With some funding from ICM, Afghan roads could be better repaired and
increase several factors of their quality of life through trade and transportation. We predict that
road repairs could increase World Bank’s infrastructure rating of Afghanistan by 0.025 points
per year. Using this added rate into the simulation, whose results can be seen in Table 3.5, the
2034 infrastructure rating increases from 2.751 to 3.226, and the 2034 sustainability score
increases by 9.5 points. These results indicate that the first proposal aiming to decrease poverty
through agriculture will increases the sustainability of Afghanistan the most out of the three
proposals.
Table 3.5: Adjusted Estimation of Afghanistan Stats in 2034 with Road Repair Aid
Poverty 36.0 % Infrastructure 3.226 score
Unemployment 7.24 % Forest 2.0 % of landarea
GDP 1789.8(USD) per capita Water 100 %
Education 118.63% gross Foreign Investments 0.0596billions (USD) inflow
Political Stability -2.267 units CO2 Emissions 0.0 metrictons per capita
Electricity 73.87 % of population Education Difference 6.45 difference in gross %
Life Expectancy 71.26 total years National Debt 2.23482 billions (USD)
Team #41768 Page 20 of 21
Sustainability Score: 628.0
Conclusion
Proposal to ICM
After developing a model that both measures the sustainability of a country and measures
the components of sustainability, we found that Afghanistan has several components that are in
need of dire help. We researched each of the components’ current impacts in Afghanistan’s
sustainability, and we decided to focus ICM’s efforts specifically towards Afghanistan’s poverty,
gender equality, and infrastructure. We came up with programs to improve each of these areas,
and we predicted the effects of these programs through a simulation to determine what our
proposal shall be.
With our research at its end, we propose that ICM creates a program to fund Afghans in
poverty with farming equipment, training, seeds, and facilities. With an improved agriculture
system and the implementation of intensive farming rather than subsistence farming, Afghanistan
will see more food security, more jobs with sustainable income, and an almost reduction in the
poverty rate.
Future Work
In a future extension of our research described by this paper, there are many more aspects
to improve on in all three tasks of the project. While the concept of our structured sustainability
model with fourteen components is comprehensive, much of the math behind it can get cluttered.
The limitations of the model are listed in section 1.6 of this paper and should be addressed in
future research. Financial research should also be taken to compare each of our original program
ideas, for if the agricultural projects is too much more expensive than either of the other two
proposals, either of these two options should be considered instead. Also, more extensive
research or mathematically intensive predictions in the rates of change of each component in the
next 20 years should be considered to create more accurate estimates. Finally, our simulation
assumes that there are no outside influences that may accelerate or inhibit the effectiveness of
our proposed programs such as other programs of aid, natural disasters, terrorism, or wars. Any
of these limitations can be addressed in future research.
Team #41768 Page 21 of 21
References
http://www.robecosam.com/images/CS_Ranking_E_Rel.FINAL.pdf
https://www.cia.gov/library/publications/the-world-factbook/fields/2046.html
http://data.worldbank.org/indicator/SL.UEM.TOTL.ZS
http://data.worldbank.org/indicator/NY.GDP.PCAP.CD
http://data.worldbank.org/indicator/SE.PRM.ENRR/countries
http://data.worldbank.org/indicator/SE.PRM.ENRR.MA
http://data.worldbank.org/indicator/SE.PRM.ENRR.FE
http://data.worldbank.org/indicator/SP.DYN.LE00.IN
http://data.worldbank.org/indicator/SH.H2O.SAFE.ZS
http://data.worldbank.org/indicator/EG.ELC.ACCS.ZS
http://data.worldbank.org/indicator/AG.LND.FRST.ZS
http://data.worldbank.org/indicator/EN.ATM.CO2E.PC
http://lpi.worldbank.org/international/global?sort=asc&order=Country#datatable
http://data.worldbank.org/indicator/BX.KLT.DINV.CD.WD
https://www.quandl.com/c/society/estimated-political-stability-by-country
http://data.worldbank.org/indicator/DT.DOD.DECT.CD/countries?display=default
http://www.washingtonpost.com/world/asia_pacific/after-billions-in-us-investment-afghan-
roads-are-falling-apart/2014/01/30/9bd07764-7986-11e3-b1c5-739e63e9c9a7_story.html
http://www.unicef.org/infobycountry/afghanistan_statistics.html
http://www.unicef.org/mdg/gender.html
http://www.imf.org/external/pubs/ft/scr/2008/cr08153.pdf
http://en.wikipedia.org/wiki/Environmental_issues_in_Afghanistan
http://www.defense.gov/news/1230_Report_final.pdf
http://www.who.int/hac/donorinfo/afg/en/index1.html

41768

  • 1.
    Team #41768 Page1 of 21 For office use only T1 ________________ T2 ________________ T3 ________________ T4 ________________ Team Control Number 41768 Problem Chosen D For office use only F1 ________________ F2 ________________ F3 ________________ F4 ________________ 2015 Interdisciplinary Contest in Modeling (ICM) Summary Sheet Cultivating Afghanistan’s Sustainability Through Agriculture The ICM has asked us to do three specific tasks in an attempt to make the world a more sustainable place, and our first task was to make a model to measure the sustainability of a country. While trying to balance the environmental, social, political, and business/financial aspects of sustainability, we decided on fourteen factors to include to determine sustainability. The factors are as follows: poverty (P), unemployment (U), GDP (G), education (E), gender equality (N), life expectancy (L), improved water sources (W), access to electricity (X), forest land (F), carbon dioxide emissions (C), infrastructure (T), foreign investments (I), political stability (Y), and external debt (D). For the model, we decided to evaluate each independent factor on a scale from 0 to 100. The total sustainability score (S) is simply the sum of all of the factors’ evaluations, creating a sustainability score from 0 to 1400. Our beginning model is 𝑆 = 𝑓(𝑃) + 𝑓(𝑈) + 𝑓(𝐺) + 𝑓(𝐸) + 𝑓(𝑁) + 𝑓(𝐿) + 𝑓(𝑊) + 𝑓(𝑋) + 𝑓(𝐹) +𝑓(𝐶) + 𝑓(𝑇) + 𝑓(𝐼) + 𝑓(𝑌) + 𝑓(𝐷). After creating individual models for each component using linear, logistical, and inverse equations, we substituted each model in to our sustainability model and reduced it to 𝑆 = 20𝑌 + 20𝑇 + 𝑊 + 𝑋 + 𝐹 − 𝑃 − 𝑈 + 200 1 + 𝑒−0.000055𝐺 + 200 1 + 𝑒−0.011𝐸 + 200 1 + 𝑒−0.022𝐿 + 200 1 + 𝑒−0.11𝐼 + 100 1+0.001𝐷 − 100 1 + 𝑒−0.5𝑁+5 − 100 1 + 𝑒−0.5𝐶+5 + 50. After testing, we found the model rates well-developed and environmentally alert countries such as Ireland highly, developed but environmentally reckless countries such as the United States modestly, and underdeveloped countries such as Afghanistan poorly. Seeing that Afghanistan had many components that score very low in our model, we feel that the country would benefit greatly from programs, policies, and aid from the ICM. We addressed each troubled component independently, and decided the ICM has the most potential to help Afghanistan in either its poverty through investments in agriculture, gender equality through boarding schools, or infrastructure through road repairs. To see the effects of each program, we created a Python simulation to predict each of Afghanistan’s sustainability components through the next 20 years at various rates of change. After testing each of our three proposed programs, the program with the most impact on the modelled sustainability score is the program towards agriculture with an increased sustainability score of 18 points over the predicted sustainability score without ICM help. Through our model, research, and simulation, we propose that ICM provides farming equipment, training, seeds, and facilities to the Afghans in poverty to make Afghanistan a more sustainable place.
  • 2.
    Team #41768 Page2 of 21 Restatement of the Problem We have been hired by the International Conglomerate of Money (ICM) to assist the organization in making the world a more sustainable place. Our first task is to develop a model to determine the sustainability of individual countries and see what countries are in dire need of help from ICM. Our second task is to choose a developing country, identify its areas of need, and develop programs and policies to make it a more sustainable country. Our third task is to evaluate the effects of our proposed programs and policies over the next 20 years using our new sustainability model. Ultimately, we hope to aid ICM in the sustainable development in an underdeveloped country. Introduction In today’s world, many countries face the trouble of balancing development, equity, poverty eradication, and quality of life with climate change prevention, preservation of natural resources, and quality of the environment. If society does not progress, quality of life never becomes better. Yet, wasting natural resources and the environment also creates hardships on the future quality of life. Balancing these two seemingly opposing forces has recently been given the name “sustainable development,” and the goal of sustainable development is to improve conditions now while preserving resources for the future. Each country has done its own part in sustainable development, although not always in a successful way. Some countries have forged forward in progress, but have forgotten to preserve the environment to sustain. Other countries have stagnated in growth and thus lack the technology to preserve their environments. In Task 1, we shall determine what makes a country sustainable, and we will create a model to measure the sustainability of a country. Table 0.1: Explanation of Variables e Euler’s Number; Approximately 2.71828 S Sustainability Score; Measuredin Equation 1 andEquation 16 x An undefinedcomponent in determiningsustainability(S) P PovertyRate(percent); PovertyScore (𝑓(𝑃)) is measuredin Equation 2 U Unemployment Rate (percent); Unemployment Score (𝑓(𝑈)) is measuredin Equation3 G GDP per capita (current USdollars); GDP Score (𝑓(𝐺)) is measuredin Equation4 E Gross Primary EducationRate (gross percent);Education Score (𝑓(𝐸))is measuredin Equation5 N Gender Equality in PrimarySchooling(difference ofgross percentages); Gender EqualityScore (𝑓(𝑁)) is measuredin Equation 6
  • 3.
    Team #41768 Page3 of 21 L Life Expectancy(years);Life ExpectancyScore (𝑓(𝑃)) is measuredin Equation 7 W Access to Improvedwater (percent of population); WaterScore (𝑓(𝑊)) is measuredin Equation 8 X Access to Electricity(percent ofpopulation); ElectricityScore (𝑓(𝑋)) is measuredin Equation 9 F ForestedArea (percent ofsurface area); Forest Score (𝑓(𝐹)) is measuredin Equation10 T Infrastructure Ratingby WorldBank.org(0to5 scale); Infrastructure Score (𝑓(𝑇))is measuredin Equation11 C Carbon Dioxide Emissions (metrictons percapita); CarbonDioxide Emissions Score (𝑓(𝐶)) is measuredin Equation 12 I Foreign Investments (billions ofU.S. dollars); Foreign Investments Score (𝑓(𝐼)) is measuredin Equation13 Y Political StabilityRatingby Quandl.com(-2.5to+2.5scale); Political Stability Score (𝑓(𝑃)) is measuredin Equation 14 D National Debt (billions of U.S. dollars); National Debt Score (𝑓(𝐷))is measuredin Equation15 Task 1: Modelling the Sustainability of a Country 1.1 What makes a country Sustainable? Sustainability can be measured in many different variables based on the intent of a perceiver. For example, the sustainability investment organization RobecoSAM recently released a similar model to the one we have been asked to create by ICM. In RobecoSAM’s model, however, governance accounts for a large 60% of their sustainability score while environment and social indicators only make up 15% and 25% of the score respectively. Our group enjoyed the structured system that RobecoSAM used for their model, but we wanted to focus less on the governance side and more on the environmental side. We also wanted to reduce the number of variables so that it is easier to explain what specifically makes a country sustainable. With these goals in mind, we decided to formulate fourteen components of sustainability and use a model that weights each of these components equally. Each component can receive a 0 to 100 score (100 being the best influence towards sustainability and 0 being the worst), and this system makes the total sustainability score (S) range from 0 to 1400. Ultimately, this model starts in the form of 𝑆 = 𝑓(𝑥1)+ 𝑓(𝑥2)+.. . +𝑓(𝑥14), (1) where 𝑥 𝑛 is the nth component being considered and 𝑓(𝑥 𝑛)is a function that returns a score between 0 and 100 base off of the component 𝑥 𝑛. For the components, we decided on the environmental components of carbon dioxide emissions, access to electricity, access to improved water, and forestry; the social components of
  • 4.
    Team #41768 Page4 of 21 poverty, life expectancy, education, and gender equality in schooling; the business/financial components of unemployment, GDP, infrastructure, and foreign investment; and the governance components of political stability and national debt. This selection creates a division of the sustainability score such that environmental components represent 29%, social components represent 29%, business/financial components represent 29%, and governance represents 14%. This selection focuses more on the quality of life and resources of a country rather than focusing on governmental attempts to improve sustainability as RobecoSAM did in their model. To advance the model, however, we must determine the equations for each of the fourteen component functions. 1.2 Determining the Component Functions Poverty (P) is one of the largest indicators of the quality of living in a country, and so a low rate of poverty means more sustainability. With this in mind, our goal is to create a function where a 0% poverty rate earns a full 100 points while 100% poverty earns 0 points. The linear function 𝑓(𝑃) = 100 − 𝑃 (2) fulfills this objective, allowing a country to get a point for each percent of the population that is not in poverty. (Keep in mind that each rate in this model is measured in percents so that P = 1.0 is 1%, not 100%.) Unemployment (U) is a measure of the quality life where a higher rate is less sustainable, much like poverty. As such, the unemployment model is similar to the model we used for poverty, and is 𝑓(𝑈) = 100 − 𝑈 (3) Gross domestic product per capita (G) is another measure of the quality of life, for GDP measures the amount of final goods and services produced in that country that year. For this model, we will use GDP per capita, which is a fair measure of the value of goods and services consumed by each individual in that year. Unfortunately, it is not a rate like poverty and unemployment where the values are already restricted to be between 0 and 100. The GDP has no cap, so we use a logistical function with an upper limit of 100 to make the rating fall between 0 and 100. The function 𝑓(𝐺) = 200 1 + 𝑒−0.000055𝐺 − 100 (4) allows us to give 0 points when there is no GDP, 50 points when GDP is at a reachable 20,000 GDP per capita, and higher values will keep increasing towards 100. While no country can ever
  • 5.
    Team #41768 Page5 of 21 get a complete 10 points without rounding, this function allows the GDP per capita score of this model to stay in our desired range of 0 to 100. Gross primary education rate (E) is an important part to sustainability, for an educated society can learn how to sustain themselves and their environment more effectively. However, this gross rate is different than rates we have used previously in the model. The gross primary education rate takes the total number of people enrolled in primary education divided by the number of eligible children in the primary schooling’s expected age range. Thus, students of primary education that are older than younger than the typical primary school student are counted towards the numerator and not the denominator. This calculation allows the education rate to be above 100% in several cases. With this in mind, a similar logistical function to the GDP function was used for the gross primary education rate function, and that function is 𝑓(𝐸) = 200 1 + 𝑒−0.011𝐸 − 100. (5) This function gives no points for a rate of 0%, about 50 points for 75%, and upwards towards 100 points for anything above 75%. Gender Equality in Schools (N) is one means of easily evaluating a country's gender rights and equality. Such equality in a country directly affects women’s quality of life while also affecting the country as a whole by allowing women work in the workplaces that they are the most efficient. While some models such as RobecoSAM’s model look at government policies to evaluate gender equality, we felt that looking at the difference between primary school attendance rates in boys and girls gives us a simpler and less subjective evaluation on the gender equality of a country. Since the gross primary education rates for each gender are used in this function as well, a logistical function is used to cap the gender equality score at 100 and floor the score at 0 with limits. The function . 𝑓(𝑁) = 100 − 100 1 + 𝑒−0.5𝑁 +5 (6) is used so that 50 points is given if there is a 10% difference in rates, a lower or negative difference would approach the upper limit of a score of 100, and a higher difference will approach the lower limit of a score of 0. Life Expectancy (L) says many things about the quality of life of a country. It implies the health of the society, necessary resources of the society, and society’s basic ability to live. Since life expectancy can theoretically have no cap, we must place a cap on the life expectancy function with another logistical function. The function 𝑓(𝐿) = 200 1 + 𝑒−0.022𝐿 − 100 (7)
  • 6.
    Team #41768 Page6 of 21 gives no points if there is a dreadful 0 years of life expectancy, 50 points for an acceptable 50 years of life expectancy, and the limit approaches 100 as life expectancy reaches immortality. Availability of improved water sources (W) is a great component of sustainability as improved water improves the quality of life now as well as the health and sustainability of a society in the future. Since the percent of the population with access to improved water sources is used for this set of data, and a higher the rate of access means a higher sustainability, the function is the simple linear equation of 𝑓(𝑊) = 𝑊 (8) where 1 percent more of access results in a 1 point increase in the availability of improved water sources score. Availability to electricity (X) indicates a country’s quality of life and resource to further their own development in the future. The percent of population with access to electricity is used for this calculation, and as a simple rate it can be scored as 𝑓(𝑋) = 𝑋 (9) where a 1 percent increase in availability results in a 1 point increase in the availability of electricity score. Forests (F) provide much sustainability for a country for they clean the air as well as provide lumber and paper to a society. The percent of land that is forested is used in this function, which allows the simple linear function of 𝑓(𝐹) = 𝐹 (10) to be used where a 1 percent increase in forested land increases the forest score by 1. Infrastructure (T) is an indicator to sustainability in that infrastructure suggests a developed society now and potential to advance in the future. The World Bank has created an index rating for each country’s infrastructure based on a 5-point scale. For our model, we trust the World Bank’s assessment procedure of countries’ infrastructures, and so we can turn the 5- point scale into a 100-point scale by using the linear function 𝑓(𝑇) = 20𝑇. (11) Carbon dioxide emissions (metric tons per capita) (C) not only pollute the air and make a society an unhealthy place to live, but they also increase the rate of climate change which endangers much of the world. Since there is no cap to such emissions, the logistical function . 𝑓(𝐶) = 100 − 100 1 + 𝑒−0.5𝐶+5 (12)
  • 7.
    Team #41768 Page7 of 21 can be used to give 50 points to the sustainability score if 10 metric tons of carbon dioxide is being produced per capita, lower rates of emission approach the upper limit of 100, and higher rates approach the lower limit of 0. The upper limit of 100 was set even though emissions can not be less than 0 so that increasing emissions up towards 10 metric tons per capita lose increasingly more points from their carbon dioxide emissions score. Foreign Investments (I) is also an indicator of sustainability of a country, for investments increase to total amount of money in a country and give a country more potential to grow. The measurement by World Bank measures the net inflows of foreign investments to domestic companies, increasing the production of these companies, the number of workers able to be hired, and the wages that the company can pay. Having no cap on the amount for foreign investments, a logistical equation is used here so that large amounts of investments approach a foreign investment score of 100. The function . 𝑓(𝐼) = 200 1 + 𝑒−0.11𝐼 − 100 (13) in billions of US dollars gives 50 points if there is 50 billion US dollars in foreign investments, approaches 100 points as the investments increase, and 0 points with no investments. In addition, all countries with negative dollars in foreign investment should use a 0 instead of their negative value (see assumptions). Political stability (Y) is very important in a sustainable country for political tension can cause a slow or stop in the production of a country, or they may even lead to civil wars that can hurt a country’s well-being deeply. Quandl.com has estimated several countries’ political staability on a scale of -2.5 to +2.5 using many indicators. Trusting their ranking, we can adjust their scale of -2.5 to +2.5 to our desired scale of 0 to 100 with the linear equation 𝑓(𝑌) = 20𝑌 + 50. (14) National Debt (D) is our last component, and a large national debt suggests a roadblock to future development of the quality of life. Since a large debt is detrimental to the sustainability of a country, and there is no cap on debt, the debt function must have a lower limit of 0 as debt reaches infinity. This task is accomplished in the equation 𝑓(𝐷) = 100 1+0.001𝐷 (15) in billions of US dollars. In this equation, 0 US dollars in national debt results in 100 points, 1.5 trillion US dollars in national debt results in 50 points, and higher national debts begin to approach the lower limit of 0 points towards the sustainability score. 1.3 Completing the Sustainability Model
  • 8.
    Team #41768 Page8 of 21 Remembering equation (1) from the “What makes a country Sustainable?” section of Task 1, we can enter the functions that represent each component score. The model is then 𝑆 = 𝑓(𝑃) + 𝑓(𝑈) + 𝑓(𝐺) + 𝑓(𝐸) + 𝑓(𝑁) + 𝑓(𝐿) + 𝑓(𝑊) + 𝑓(𝑋) + 𝑓(𝐹) + 𝑓(𝐶) + 𝑓(𝑇) + 𝑓(𝐼) + 𝑓(𝑌) + 𝑓(𝐷). (Variable names are listed in Table 0.1 on pages 2-3.) Replacing each function with Equation 2 through Equation 15, our model is now 𝑆 = 100 − 𝑃 + 100 − 𝑈 + 200 1 + 𝑒−0.000055𝐺 − 100 + 200 1 + 𝑒−0.011𝐸 − 100 + 100 − 100 1 + 𝑒−0.5𝑁+5 + 200 1 + 𝑒−0.022𝐿 − 100 +𝑊 + 𝑋 + 𝐹 + 100 − 100 1 + 𝑒−0.5𝐶+5 + 20𝑇 + 200 1 + 𝑒−0.11𝐼 − 100 + 20𝑌 + 50 + 100 1+0.001𝐷 . Simplify the model with algebra, and our final model is 𝑆 = 20𝑌 + 20𝑇 + 𝑊 + 𝑋 + 𝐹 − 𝑃 − 𝑈 + 200 1 + 𝑒−0.000055𝐺 + 200 1 + 𝑒−0.011𝐸 + 200 1 + 𝑒−0.022𝐿 + 200 1 + 𝑒−0.11𝐼 + 100 1+0.001𝐷 − 100 1 + 𝑒−0.5𝑁+5 − 100 1 + 𝑒−0.5𝐶+5 + 50. (16) 1.4 Applying the Model To see the results of the model, we collected data from 18 different countries and applied them to the model. The 18 countries were selected with the goal of testing the model on countries with different levels of development and sustainability, and the results can be seen in Table 1.1. Table 1.1: Sample Sustainability Scores from Equation 16 with Notable Component Scores Country Sustainability Score Highest Component Score Lowest Component Score 1 Ireland 1125.6 Electricity/ImprovedWater - 100 each Carbon Dioxide Emissions - 64.57 2 Spain 1105.5 Electricity/Improved Water - 100 each Political Stability- 49.8 3 Switzerland 1096.0 Electricity/ImprovedWater - 100 each Foreign Investments - 0.00 4 Brazil 1048.9 Foreign Investments - 99.97 GDP - 29.88 5 Canada 1044.3 Electricity/ImprovedWater - 100 each Carbon Dioxide Emissions - 8.71 6 Japan 1021.2 Electricity/ImprovedWater - 100 each Foreign Investments - 20.15
  • 9.
    Team #41768 Page9 of 21 7 China 1019.3 Foreign Investments - 100.00 GDP - 21.21 8 France 1011.2 Electricity/ImprovedWater - 100 each National Debt - 14.81 9 Italy 1006.4 Electricity/ImprovedWater - 100 each National Debt - 27.39 10 Israel 990.3 Electricity/ImprovedWater - 100 each Political Stability- 28.6 11 UnitedStates 983.0 ElectricityAvailability - 100 Carbon Dioxide Emissions - 2.19 12 Hungary 966.7 Electricity/ImprovedWater - 100 each Foreign Investments - 0 13 Greece 935.7 Electricity/ImprovedWater - 100 each Foreign Investments - 16.06 14 Egypt 900.4 ElectricityAvailability - 99.6 GDP - 9.09 15 South Africa 864.6 ImprovedWater- 95 GDP - 18.00 16 Liberia 730.4 National Debt - 99.95 GDP - 1.25 17 Afghanistan 626.1 National Debt - 99.74 Gender Equality in Schooling - 0.00 18 Yemen 605.7 National Debt - 99.24 Foreign Investments - 0 Ireland is the most sustainable country of the selected 18 according to our model, and that is not surprising with its worst category of carbon dioxide emissions still contributing 64.57 points to the sustainability score. RobecoSAM’s most sustainable country places third in this selection due in a large part to the lack of outside investments. The United States is perhaps surprisingly low at first glance being in company with Israel, Hungary, and Greece. However, the carbon dioxide emissions and national debt only contribute 7.45 points to the sustainable score together out of a possible 200. Americans seem to know their weaknesses in sustainability, however, as both the U.S. national debt and carbon footprints are hot-button topics in the country. Near the bottom of the list is Afghanistan, one of the United Nation’s 48 least developed countries. With a GDP score of 1.8, a political stability score of 1.6, a forestry score of 2.1, a foreign investments score of 0.33, and a horrific gender equality score of 0.0006, Afghanistan has a lot of areas that it needs help in to become a sustainable country. We suggest the ICM to invest its money into this developing country as it has a lot of room to grow with very little current investments. We will formulate plans and policies to aid Afghanistan’s low sustainability score of 612.5 in Task 2. 1.5 Strengths of the Sustainability Model ❏ The structured scoring system is easy to explain without complicated math. Each of the fourteen components is scored from 0 to 100, and the sustainability score simply adds all of these component scores together to form a score with a max of 1400 points.
  • 10.
    Team #41768 Page10 of 21 ❏ The sustainability score is not arbitrary. The closer a score is to 1400, the more sustainable a country is. ❏ The components measured in rates are easy to understand. Each percentage point those components have increases or decreases the sustainability score by one point depending on the relation. ❏ The components used are applicable to even under-developed countries. These components attempt to gauge the basic necessities of sustainability in quality of life, equity, political/financial stability, and environmental health. Ultimately, this model can be applicable to all countries with the access to the appropriate data. 1.6 Weaknesses of the Sustainability Model ❏ The components that have to be capped through limits are harder to explain to non- mathematical audiences. In a future version of the model, another approach such as piece-wise functions could be used instead to model the component scores in an easier way to explain. ❏ The political stability and infrastructure scores are based off of outside ratings. If these ratings become skewed, change in form, or stop altogether, this model can not be used until a new means of scoring these two components is found. ❏ Some component functions make it hard to score a full 100 points or hard to score no points. E.g. The 55 point improved water score obtained by Yemen suggests an average quality of water access when it actually the lowest score among the 18 countries. In a future version of the model, non-linear models could be used in these cases to widen the range of points given to these components at the cost of some simplicity. ❏ The final, algebraically reduced form of the model is cluttered and complicated without explanation.
  • 11.
    Team #41768 Page11 of 21 Task 2: Formulating Viable Programs to Aid Afghanistan 2.1 Summary of Task 2 Using the model results on the most important issues required to improve Afghanistan’s sustainability, statistics from various sources, and the Afghanistan National Development Strategy (ANDS) recommendations to the International Monetary Fund, we came up with viable solutions that can be implemented to increase sustainability. For each of the determinant factors of sustainability, we came up with solutions that are possible through government policies, creation of new programs, and aid from the ICM. 2.2 Poverty Reduction Agriculture is the main industry in Afghanistan producing approximately 24% of the country’s gross domestic product. The main crops produced are almonds, pomegranates, pistachios, raisins, and apricots as reported by United States Agency for International Development (USAID). Subsistence farming is mainly used especially by farmers living below the poverty line, and 36% of the Afghanistan population currently lives under the poverty line (10.998 million people). Due to a lack of proper farming equipment, ease of credit accessibility, and weather conditions there is a high rate of food insecurity. Introduction of intensive farming as opposed to subsistence farming will be a great way to reduce poverty through creation of jobs, new income sources and food security. This can be done by having a community of 100 subsistence farmers coming together and joining their resources to begin intensive farming. Before beginning the intensive farming, the community will require training on the improved farming equipment that will be used as well as financial training to create more profitable intensive farming units. There should be a criteria for selection of the participants for the intensive farming units, and the first condition should be people living under the poverty line. The ICM can provide money or credit to educate the selected community members, buy equipment, seeds and fertilizers. Beginning 50,000 community intensive farming units of 100 people per unit will reduce the poverty rate by about 50%, reducing the current poverty rate to 18%. 2.3 Unemployment The current rate of unemployment is 8% in Afghanistan, which results to labor migration and increased crime rates from the unemployed youth. A less extensive credit allocation criteria would result to an increase in the rate of self-employment due to the availability of starting capital. Providing training to the unemployed on how to begin business ventures and how to effectively use their skills, will help decrease the unemployment rates. A creation of 5,000
  • 12.
    Team #41768 Page12 of 21 successful business ventures with each venture employing two people will reduce the unemployment rate to 6.8%. Increasing the ease in which unemployed people find out about employment opportunities would also help reduce unemployment. This can be done by creating a free online site or a free newspaper publication for the non-internet using population that posts the available employment opportunities from employers. If the site helps 10,000 people get jobs in a year the unemployment rate will further decrease to 5.6%. Therefore, the ICM should consider investing in business start-up training and creation of a free online site or newspaper to ease the of information transfer from employers to job seekers. 2.4 Education The World Bank reported a 104% enrollment rate to primary schools in Afghanistan as of 2012. The secondary net attendance percentage for both male and female students in 2012 was 63.9% based on the United Nations International Emergency Children Funds (UNCIEF) statistics. Providing incentives for further education after primary education in the country will increase the country’s skilled future labor force and further improve the literacy levels. Countries with high literacy levels have higher Gross Domestic Products (GDP). Provision of scholarships to intelligent primary educated students who lack financial resources to join secondary schools would be an incentive that the ICM should consider. The ICM should improve the quality of existing schools by asking each school management for the most important issues that need reform and build more schools to decongest current schools.This will provide a better learning atmosphere that will improve the attendance rates and encourage further advancement in education. Also improving the quality of education through the presence of better trained teachers and having a policy that ensures that newly employed teachers meet the required credentials needed. This will improve the quality of educated Afghans thus raising the country’s future GDP. 2.5 Education Difference The gender difference in school attendance is big in Afghanistan with the male primary school attendance rate being 34 percent higher than the female primary school attendance. According to the 2005 UNICEF report, studies show that educating girls is the single most effective policy to raise overall economic productivity. Women education lowers the infant and maternal mortality rate, educates the next generation, improves nutrition and promotes health. Educated girls with at least 6 years of schooling are more able to protect themselves from HIV/AIDS as well as other diseases. In addition, educated mothers immunize their children 50% more than uneducated ones and are twice as likely to send their children to school than the uneducated ones. Single-parent units run by educated mothers are also less likely to be poor. The government of Afghanistan should enforce the rule requires all people aged 7-15 to attend school. Since the first years of education are the most important schools should provide better systems that cater for the girls to ensure that they have a good foundation in education.
  • 13.
    Team #41768 Page13 of 21 Creation of girls’ boarding schools that provide food and good sanitary conditions, could be a start since they will provide a secure place for the girl child against the existing bias in the community around them. Due to the cultural norms that require girls to be taught by females in some conservative communities in Afghanistan each school should have 1:3 ratio of female to male teachers. The ICM should consider building 20 female boarding schools where 12 are primary schools and 8 secondary schools with an intake of 300 each to help bridge the gender gap. This will also increase the female literacy levels of females above 15 years by 0.03% per year to 12.63% on the first year each secondary school enrolls students. 2.6 Political Stability Increased democratic practices by the Afghanistan government such as conducting peaceful democratic elections will help increase its political stability. Also, creation of a stronger judicial system that enables the rule of law and respect for human rights will improve the political stability. Military and the police force training will also ensure that there is political stability as the government can protect its citizens against terrorist threats and enforce the law. The government should fight the illegal narcotic industry that supplies funds to terrorist activity as reported by the ANDS, thereby improving security. Ensuring good relations with other nations in the world and hence reducing enemy nations will improve the political stability too. These relations can be enhanced by encouraging trading with other nations, participating in world activities such as the World Cup, Olympics or even the United Nations activities. 2.7 Electricity World bank reports that only 41% of the Afghans have access to electricity and the ANDS reports that Afghanistan imports electricity. Most rural areas have no access to electricity, so the use of other forms of energy would help improve the productivity of such areas. For example, using more machinery will improve the quality of goods and reduce the amount of time spent in the creation of goods. Alternative forms of energy that may be used are solar panels, small diesel generating power sources, biogas and windmills. The farmers can be trained on the production of biogas and as a result have a new form of energy. Also the ICM can provide solar panels in the hot areas and the energy created from the panels can be used to create new employment opportunities for businesses that require few watts of energy such as a barber shop. Provision of increased training in the fields of energy creation will also help. The ICM can provide scholarships in the tertiary level in energy related fields and require that those trained to work in Afghanistan for a period of time after their graduation. The government can also require that energy companies train a percentage of their employees on new ways for producing energy cheaply and effectively. 2.8 Life Expectancy
  • 14.
    Team #41768 Page14 of 21 At present the World Health Organization ranks Afghanistan’s healthcare system as one of the worst in the world. It has a high maternal mortality rate, communicable diseases such as malaria, TB and HIV/AIDS, and epidemics such as cholera, acute and chronic malnutrition. The health care system has few doctors and nurses with one doctor for 6000 patients and one nurse for 2,500 patients. Afghans currently live to age 63 and a better health care system can help raise their life expectancy age. To improve the health care system, the government should provide midwife training and family planning education to the people to reduce the maternal mortality rate. Also the ICM can create free maternal hospitals in areas with high maternal mortality rates. The government should require that all newly born children receive all the required vaccination. Also during epidemics the government should provide free vaccinations to people if they are available by sending nurses to schools and homes. Training nurses and doctors should be increased and the government should subsidize the required fees. Adding 24 nurses and 29 doctors to each present doctor and nurse will result to a ratio of 1:100 nurses to patients and 1:200 doctors to patients. TB vaccines should be provided in prone areas, to reduce the spread of TB and those suffering from it should be secluded from the society to reduce its spread. The ICM should provide mosquito nets to the most prone malaria regions of the country and teach the communities how to use them. To reduce epidemics proper sanitary conditions should be provided by the government. A committee should be formed to make sure that hotels, and schools provide safe food and water to people and that there is a restroom in each facility. The ICM should start mobile clinics which will be very helpful in rural communities with poor infrastructure and have hospitals far from them. 2.9 Infrastructure On a scale of 1 to 5, World Bank ranks Afghanistan’s infrastructure as a 1.87. The government should fund projects that improve the country’s infrastructure if they wish to improve this score. Such expenditures should enlist the services of other countries which are efficient in the needed specific fields as it will save money, time and enable the use of the best possible technology available. Creation of infrastructure will also help reduce the poverty rate through creation of jobs and increased investments raising the gross domestic product. The government is highly encouraged to improve the road network as this will help improved trade with other countries and within the country. While the U.S. has been building roads in Afghanistan with such goals in mind, the Afghan government can not keep up with the maintenance of the roads and are requesting financial help according to the recent article “After of Billions in U.S. investment, Afghan roads are falling apart” by the Washington Post. A better road system will also lead to improved health care and improve school attendance as hospitals and schools will be more accessible. The ICM could help Afghanistan reach these goals by investing in the repair of the roads. 2.10 Water
  • 15.
    Team #41768 Page15 of 21 The Afghanistan National Development Strategy committee (ANDS) reports that 95% of water consumption goes to agriculture in Afghanistan. Irrigated farms produce five times more food than non-irrigated farms. Therefore, coming up with improved irrigation methods that help conserve water either by recycling the water or using less of it are necessary. This can begin with ICM teaching farmers and the government providing them incentives to use water conserving irrigation methods. According to the World Bank 2012 statistics, only 64% of Afghans have access to improved water sources. Creation of wells, boreholes and dams by government and ICM aid in areas with no water access will help increase the access of water. ICM can also help teach the rural communities on cheap water purification methods that can be used on their already existing water before better water sources are created. 2.11 Investments New government policies that make foreign investments easier and privatization easy for example by providing tax cuts or government subsidies are ways to increase investments. A political stable Afghanistan attract foreign investment and presence of available labor in the country is a good attraction. Increased foreign investments will lead to an increase in the job creation while privatization of businesses will lead to more efficient business structures that are profitable. The combination will result to an increase in the country’s gross domestic product. Therefore, the government should ensure peace in the country and have better policies that attract investments. 2.12 Forests Deforestation is a huge issue facing Afghanistan which is caused by the use of wood as a source of fuel and the presence of a timber mafia as reported by the Wikipedia. The timber mafia is present due to the high profits received from selling timber to the neighboring country Pakistan which has strict forest conservation policies. Deforestation results to soil erosion which increases the risk of flooding and reduces the productivity of the land. This results to endangerment of the agricultural sector which is a huge contributor to the economy. The government can create strict policies that help deal with the timber mafia and also require everyone to plant two trees for every tree they cut. ICM can start campaigns to plant trees and increase recycling through seminars and the media. Tree planting can be used as a symbol for something that is important and will be widely accepted by the Afghans. For example, women can be encouraged to plant a tree to symbolize the respect of their basic human rights. 2.13 Gross Domestic Product (GDP) Implementation of the suggested solutions to the existing problems, will increase the current GDP. Enrollment of more students to school will increase the literacy levels of Afghans
  • 16.
    Team #41768 Page16 of 21 thus increasing the GDP in the long run. Improving infrastructure, poverty reduction, improved health care, increased investments, reduced unemployment rates, and increased forest conservation will result to a higher GDP in the long run. 2.14 Debt and CO2 Emissions Based on our model Afghanistan is currently doing fine on its debt and CO2 emissions with scores of 99.7 and 99.2 respectively on a scale of 100. With the current trend there are no solutions just a recommendation that they should continue using their current policies as they are proving to be sustainable so far. 2.15 Proposals to Test After discussion, our group has decided to narrow ICM’s potential investments to three proposals. Firstly, we want to look into providing Afghans in poverty with farming equipment, training, and facilities and to implement intensive farming to improve the poverty rate. Secondly, we would like to see the effects all-girl boarding schools would have on the gender inequality of Afghanistan. Finally, we would like to know more about the effects repairing the roads would have on Afghanistan’s infrastructure. We explore the possible effects of these proposals in Task 3.
  • 17.
    Team #41768 Page17 of 21 Task 3: Evaluating Programs Through a Simulation 3.1 Determining Afghanistan’s Sustainability without ICM Aid For this task, we produced a Python simulation in order to demonstrate prospective changes with Afghanistan’s sustainability. The simulation extrapolates data gathered by various sources in order to predict future sustainability indicators from 2015 to 2034. Our first simulation uses a best fit line to determine the rates of change for each component based on recorded stats since 2007. Once the prospective rate is produced, the simulation uses that rate to predict future values of each component and the final sustainability score as determined by Equation 16. Table 3.1 shows the results of this first simulation Table 3.1: Estimation 1 of Afghanistan Stats in 2034 Poverty 36.0 % Infrastructure 3.91 score Unemployment 7.24 % Forest 2.0 % of landarea GDP 1789.8(USD) per capita Water 129.74% Education 118.63% gross Foreign Investments -0.28239773399999996billions (USD) inflow Political Stability -2.267 units CO2 Emissions 0.0 metrictons per capita Electricity 41.0 % of population Education Difference 6.45 difference in gross % Life Expectancy 71.26 total years National Debt 2.23482 billions (USD) Sustainability Score: 656.1 Looking at the results of the first experiment, some final statistics appear to be unrealistic. Access to improved water sources has exceeded 100%, foreign investments is dropping at an unrealistic pace, infrastructure estimates 2034 Afghanistan to beat the infrastructures of 2015’s Ireland, Spain, and Switzerland, and electricity access has not changed. To fix these impractical estimates, we capped the water percentage to 100% and adjusted the other component’s rates to be more realistic. Since our foreign investments rate of change is greatly influenced by a recent drop in investments in the last few years and is largely unpredictable, we elected to have it not change in the next 20 years. 2007’s infrastructure rating of 1.1 seems to be an outlier against the 1.87, 2.00, and 1.82 of 2010, 2012, and 2014 respectively. Dropping this outlier gives us a new rate of -0.013 against the previous rate of 0.11. We still believe that infrastructure will increase since the war has ended, so we averaged the two rates together and are using the rate of 0.049 in the new simulation. We also predict that electricity access will grow at a similar but slower rate than water access, so we are
  • 18.
    Team #41768 Page18 of 21 implementing half the rate of water access growth for the electricity access growth, which is a conservative 1.73. 2034 Afghanistan with the new rates is shown in Table 3.2. Table 3.2: Adjusted Estimation of Afghanistan Stats in 2034 Poverty 36.0 % Infrastructure 2.751 score Unemployment 7.24 % Forest 2.0 % of landarea GDP 1789.8(USD) per capita Water 100 % Education 118.63% gross Foreign Investments 0.0596billions (USD) inflow Political Stability -2.267 units CO2 Emissions 0.0 metrictons per capita Electricity 73.87 % of population Education Difference 6.45 difference in gross % Life Expectancy 71.26 total years National Debt 2.23482 billions (USD) Sustainability Score: 618.5 3.2 Simulating the effects of programs on Afghanistan Our first potential proposal is to provide the Afghans in poverty with farming equipment, training, seeds, and land to provide more food and lower the poverty rate. With research done in task two, we estimate that providing Afghans with such resources can increase the rate of depletion of the poverty rate by 0.9% per year. By adding this new rate to the existing rate in the simulation, whose results can be seen in Table 3.3, the 2034 poverty rate has decreased from 36.0% to 18.9%, and the sustainability score is 18.0 points higher than estimated value without aid in Table 3.2. Table 3.3: Adjusted Estimation of Afghanistan Stats in 2034 with Agricultural Aid Poverty 18.9 % Infrastructure 2.751 score Unemployment 7.24 % Forest 2.0 % of landarea GDP 1789.8(USD) per capita Water 100 % Education 118.63% gross Foreign Investments 0.0596billions (USD) inflow Political Stability -2.267 units CO2 Emissions 0.0 metrictons per capita Electricity 73.87 % of population Education Difference 6.45 difference in gross % Life Expectancy 71.26 total years National Debt 2.23482 billions (USD) Sustainability Score: 635.6 Our second potential proposal is to increase the gender equality and decrease the difference in education rates between boys and girls by implementing girl-exclusive boarding
  • 19.
    Team #41768 Page19 of 21 schools. By gradually offering young Afghan girls an opportunity to seek an education with female role models without the cultural responsibilities placed on Afghan women, we believe that these schools could decrease the gender gap by 0.1 percent every year in schooling. With this new rate implemented into our simulation, whose results can be seen in Table 3.4, the 2034 gender gap has decreased from a 6.45 difference in percent to a 4.55 difference in percent, and the sustainability score has increased by 8.3 points. Table 3.4: Adjusted Estimation of Afghanistan Stats in 2034 with Female Boarding Schools Poverty 36.0 % Infrastructure 2.751 score Unemployment 7.24 % Forest 2.0 % of landarea GDP 1789.8(USD) per capita Water 100 % Education 118.63% gross Foreign Investments 0.0596billions (USD) inflow Political Stability -2.267 units CO2 Emissions 0.0 metrictons per capita Electricity 73.87 % of population Education Difference 4.55 difference in gross % Life Expectancy 71.26 total years National Debt 2.23482 billions (USD) Sustainability Score: 626.8 Our final potential proposal is to increase Afghanistan’s infrastructure by helping to repair their roads. With some funding from ICM, Afghan roads could be better repaired and increase several factors of their quality of life through trade and transportation. We predict that road repairs could increase World Bank’s infrastructure rating of Afghanistan by 0.025 points per year. Using this added rate into the simulation, whose results can be seen in Table 3.5, the 2034 infrastructure rating increases from 2.751 to 3.226, and the 2034 sustainability score increases by 9.5 points. These results indicate that the first proposal aiming to decrease poverty through agriculture will increases the sustainability of Afghanistan the most out of the three proposals. Table 3.5: Adjusted Estimation of Afghanistan Stats in 2034 with Road Repair Aid Poverty 36.0 % Infrastructure 3.226 score Unemployment 7.24 % Forest 2.0 % of landarea GDP 1789.8(USD) per capita Water 100 % Education 118.63% gross Foreign Investments 0.0596billions (USD) inflow Political Stability -2.267 units CO2 Emissions 0.0 metrictons per capita Electricity 73.87 % of population Education Difference 6.45 difference in gross % Life Expectancy 71.26 total years National Debt 2.23482 billions (USD)
  • 20.
    Team #41768 Page20 of 21 Sustainability Score: 628.0 Conclusion Proposal to ICM After developing a model that both measures the sustainability of a country and measures the components of sustainability, we found that Afghanistan has several components that are in need of dire help. We researched each of the components’ current impacts in Afghanistan’s sustainability, and we decided to focus ICM’s efforts specifically towards Afghanistan’s poverty, gender equality, and infrastructure. We came up with programs to improve each of these areas, and we predicted the effects of these programs through a simulation to determine what our proposal shall be. With our research at its end, we propose that ICM creates a program to fund Afghans in poverty with farming equipment, training, seeds, and facilities. With an improved agriculture system and the implementation of intensive farming rather than subsistence farming, Afghanistan will see more food security, more jobs with sustainable income, and an almost reduction in the poverty rate. Future Work In a future extension of our research described by this paper, there are many more aspects to improve on in all three tasks of the project. While the concept of our structured sustainability model with fourteen components is comprehensive, much of the math behind it can get cluttered. The limitations of the model are listed in section 1.6 of this paper and should be addressed in future research. Financial research should also be taken to compare each of our original program ideas, for if the agricultural projects is too much more expensive than either of the other two proposals, either of these two options should be considered instead. Also, more extensive research or mathematically intensive predictions in the rates of change of each component in the next 20 years should be considered to create more accurate estimates. Finally, our simulation assumes that there are no outside influences that may accelerate or inhibit the effectiveness of our proposed programs such as other programs of aid, natural disasters, terrorism, or wars. Any of these limitations can be addressed in future research.
  • 21.
    Team #41768 Page21 of 21 References http://www.robecosam.com/images/CS_Ranking_E_Rel.FINAL.pdf https://www.cia.gov/library/publications/the-world-factbook/fields/2046.html http://data.worldbank.org/indicator/SL.UEM.TOTL.ZS http://data.worldbank.org/indicator/NY.GDP.PCAP.CD http://data.worldbank.org/indicator/SE.PRM.ENRR/countries http://data.worldbank.org/indicator/SE.PRM.ENRR.MA http://data.worldbank.org/indicator/SE.PRM.ENRR.FE http://data.worldbank.org/indicator/SP.DYN.LE00.IN http://data.worldbank.org/indicator/SH.H2O.SAFE.ZS http://data.worldbank.org/indicator/EG.ELC.ACCS.ZS http://data.worldbank.org/indicator/AG.LND.FRST.ZS http://data.worldbank.org/indicator/EN.ATM.CO2E.PC http://lpi.worldbank.org/international/global?sort=asc&order=Country#datatable http://data.worldbank.org/indicator/BX.KLT.DINV.CD.WD https://www.quandl.com/c/society/estimated-political-stability-by-country http://data.worldbank.org/indicator/DT.DOD.DECT.CD/countries?display=default http://www.washingtonpost.com/world/asia_pacific/after-billions-in-us-investment-afghan- roads-are-falling-apart/2014/01/30/9bd07764-7986-11e3-b1c5-739e63e9c9a7_story.html http://www.unicef.org/infobycountry/afghanistan_statistics.html http://www.unicef.org/mdg/gender.html http://www.imf.org/external/pubs/ft/scr/2008/cr08153.pdf http://en.wikipedia.org/wiki/Environmental_issues_in_Afghanistan http://www.defense.gov/news/1230_Report_final.pdf http://www.who.int/hac/donorinfo/afg/en/index1.html