Download as PDF, PPTX


![Copyright © 2016, Oracle and/or its affiliates. All rights reserved. |
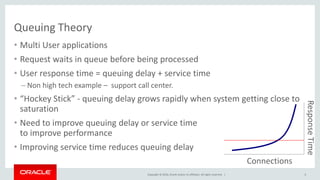
Basic1: Checking Server Configurations
• The MySQL server is controlled by “System Variables”
• Set via:
– Option File: my.cnf / my.ini
– Temporary change: SET [GLOBAL] <vriable>=<value>
• Can be per connection (LOCAL) or server wide (GLOBAL)
13](https://image.slidesharecdn.com/1oracle-mysql-perf-170802060314/85/3-MySQL-Performance-13-320.jpg)
![Copyright © 2016, Oracle and/or its affiliates. All rights reserved. |
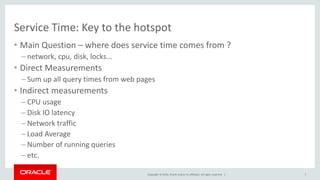
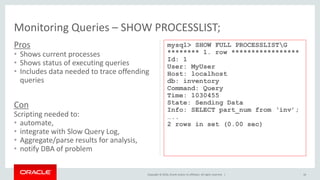
Monitoring Queries - Slow Query Log
#Time: 08073101 16:25:24
#User@Host: root[root] @ localhost [127.0.0.1]
#Query_time: 8 Lock_time: 0 Rows_sent: 20 Rows_examined: 243661
SELECT part_num FROM `inventory`.`parts` WHERE
(`ven` = "foo") ORDER BY `delivery_datetime` DESC LIMIT 100;
Pros
• Logs queries that took longer than X (user defined)
• Logs queries that do not use indexes (5.0 and higher)
• Includes data needed to trace offending queries
Cons
• Growth must be managed using FLUSH LOGS
• Entries must be parsed/sorted for relevance
• mysqldumpslow helps, but still tedious, takes time
15](https://image.slidesharecdn.com/1oracle-mysql-perf-170802060314/85/3-MySQL-Performance-15-320.jpg)
![Copyright © 2016, Oracle and/or its affiliates. All rights reserved. |
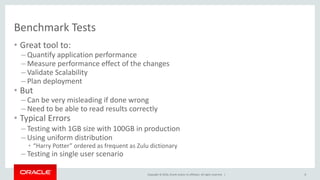
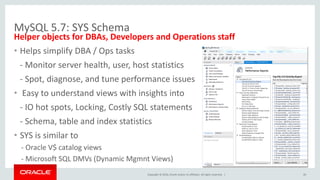
MySQL 5.7: Optimizer - Cost Info in JSON EXPLAIN
• Expanded JSON EXPLAIN
– Now includes all available cost info
– Used for Visual Explain In MySQL Workbench
{
"query_block": {
"select_id": 1,
"cost_info": {
"query_cost": "200.40"
},
"table": {
"table_name": "nicer_but_slower_film_list",
"access_type": "ALL",
"rows_examined_per_scan": 992,
"rows_produced_per_join": 992,
"filtered": 100,
"cost_info": {
"read_cost": "2.00",
"eval_cost": "198.40",
"prefix_cost": "200.40",
"data_read_per_join": "852K"
},
"used_columns": [
"FID",
"title",
"description",
"category",
"price",
"length",
"rating",
"actors"
],
...
18](https://image.slidesharecdn.com/1oracle-mysql-perf-170802060314/85/3-MySQL-Performance-18-320.jpg)


The document discusses MySQL performance tuning basics. It covers key topics like defining performance metrics, MySQL server architecture, commands and tools for monitoring performance like slow query log and processlist, and server configuration parameters that impact performance like connection settings and buffer sizes. The presentation aims to provide an overview of MySQL performance optimization.

![[발표자료] 오픈소스 Pacemaker 활용한 zabbix 이중화 방안(w/ Zabbix Korea Community)](https://cdn.slidesharecdn.com/ss_thumbnails/high-availabilityzabbixforopensourcepaceamker-191204120827-thumbnail.jpg?width=640&height=640&fit=bounds)

![[OpenInfra Days Korea 2018] (Track 3) - CephFS with OpenStack Manila based on...](https://cdn.slidesharecdn.com/ss_thumbnails/36openinfra-2018-naver-cephfs-180704055415-thumbnail.jpg?width=640&height=640&fit=bounds)