_MINISTRY_Come Let Us Adore Him #4_Mary & Josephrohandredge
Matthew’s gospel focuses on the role of Joseph in the advent story whilst Luke tends to lean towards the experiences and role that Mary played. Put the two together and you see that God chooses unremarkable people to do impossible things.
The danger here is that we romanticise the Christmas story. It’s really a story of trust, sacrifice, perseverance and a whole lot of courage in the fact that when God calls you, even in the midst of challenge, he is present to perform his purpose.
Joseph, in my opinion, is an unsung hero of Scripture. What a mighty and magnificent man. Choosing to obey God, honour Mary and Father Jesus at what would have amounted to significant personal cost. A picture of true biblical manhood.
The other lessons I would invite you to consider is what it means to be called and used by God for significant purposes. You and I are as much candidates for the purposes of God as Mary and Joseph. I trust you are open and willing to be invited into His grand plan and story.
Summer series at Discovery Church will be off the charts. You are welcome.
Make it a great completion to 2013. See you in 2014.
Strategi dan Teknologi Militer: Ambisi Indonesia Memproduksi Pesawat Jet Temp...Satrio Arismunandar
Warisan Presiden SBY untuk presiden baru RI 2014 adalah kebangkitan industri pertahanan, yang berprospek bagus dan perlu terus didukung. Khususnya, proyek pesawat jet tempur siluman KFX/IFX, buatan bersama Indonesia-Korea Selatan, yang sekelas lebih unggul dari pesawat tempur F-16 Amerika.
Como melhorar a sua gestão de resíduos? Como parar de desperdiçar e começar a poupar? Como melhorar a taxa de reciclagem?
A Bakuara presta serviços para cocriar respostas a estas perguntas, com intuito de diminuir o impacto ambiental, diminuir o desperdício e aumentar a eficiência da gestão de resíduos de shopping centers, indústrias e outros geradores.
menos é MAIS!!!
In the XXI century, droughts in the Brazilian Northeast continue to be treated with the same kind of approach of the XIX century. Droughts are a big business therefore nobody wants to change the status quo and the rusted policies.
QNBFS Daily Market Report December 24, 2023QNB Group
The QE Index rose 0.8% to close at 10,285.3. Gains were led by the Transportation and Banks & Financial Services indices, gaining 1.4% and 1.2%, respectively.
QNBFS Daily Market Report October 04, 2023QNB Group
The QE Index rose 0.2% to close at 10,273.3. Gains were led by the Transportation and Consumer Goods & Services indices, gaining 1.7% and 0.1%, respectively.
QNBFS Daily Technical Trader Qatar - October 04, 2023 التحليل الفني اليومي لب...QNB Group
The General Index failed to sustain its breakout above the double-bottom formation’s neckline and continued with its decline into the formation’s territory.
QNBFS Daily Technical Trader Qatar - September 28, 2023 التحليل الفني اليومي ...QNB Group
The General Index failed to sustain its breakout above the double-bottom formation’s neckline and continued with its decline into the formation’s territory.
QNBFS Daily Market Report September 24, 2023QNB Group
The QE Index rose 0.3% to close at 10,323.0. Gains were led by the Transportation and Industrials indices, gaining 0.8% each. Top gainers were Qatar Navigation and Al Khaleej Takaful Insurance Co., rising 3.3% and 2.0%, respectively.
QNBFS Daily Technical Trader Qatar - September 24, 2023 التحليل الفني اليومي ...QNB Group
The General Index failed to sustain its breakout above the double-bottom formation’s neckline and continued with its decline into the formation’s territory.
QNBFS Daily Technical Trader Qatar - September 19, 2023 التحليل الفني اليومي ...QNB Group
The General Index failed to sustain its breakout above the double-bottom formation’s neckline and continued with its decline into the formation’s territory.
QNBFS Daily Market Report September 17, 2023QNB Group
The QE Index declined 0.5% to close at 10,319.3. Losses were led by the Industrials and Consumer Goods & Services indices, falling 1.4% and 1.1%, respectively.
QNBFS Daily Technical Trader Qatar - September 07, 2023 التحليل الفني اليومي ...QNB Group
The General Index failed to
sustain its breakout above the
double-bottom formation’s
neckline and continued with
its decline into the
formation’s territory.
Turin Startup Ecosystem 2024 - Ricerca sulle Startup e il Sistema dell'Innov...Quotidiano Piemontese
Turin Startup Ecosystem 2024
Una ricerca de il Club degli Investitori, in collaborazione con ToTeM Torino Tech Map e con il supporto della ESCP Business School e di Growth Capital
how to sell pi coins in Hungary (simple guide)DOT TECH
If you are interested in selling your pi coins, i have a verified pi merchant, who buys pi coins and resell them to exchanges looking forward to hold till mainnet launch.
Because the core team has announced that pi network will not be doing any pre-sale. The only way exchanges like huobi, bitmart and hotbit can get pi is by buying from miners.
Now a merchant stands in between these exchanges and the miners. As a link to make transactions smooth. Because right now in the enclosed mainnet you can't sell pi coins your self. You need the help of a merchant,
i will leave the what'sapp contact of my personal pi merchant below. 👇
+12349014282
1. Elemental Economics - Introduction to mining.pdfNeal Brewster
After this first you should: Understand the nature of mining; have an awareness of the industry’s boundaries, corporate structure and size; appreciation the complex motivations and objectives of the industries’ various participants; know how mineral reserves are defined and estimated, and how they evolve over time.
Abhay Bhutada Leads Poonawalla Fincorp To Record Low NPA And Unprecedented Gr...Vighnesh Shashtri
Under the leadership of Abhay Bhutada, Poonawalla Fincorp has achieved record-low Non-Performing Assets (NPA) and witnessed unprecedented growth. Bhutada's strategic vision and effective management have significantly enhanced the company's financial health, showcasing a robust performance in the financial sector. This achievement underscores the company's resilience and ability to thrive in a competitive market, setting a new benchmark for operational excellence in the industry.
BONKMILLON Unleashes Its Bonkers Potential on Solana.pdfcoingabbar
Introducing BONKMILLON - The Most Bonkers Meme Coin Yet
Let's be real for a second – the world of meme coins can feel like a bit of a circus at times. Every other day, there's a new token promising to take you "to the moon" or offering some groundbreaking utility that'll change the game forever. But how many of them actually deliver on that hype?
What price will pi network be listed on exchangesDOT TECH
The rate at which pi will be listed is practically unknown. But due to speculations surrounding it the predicted rate is tends to be from 30$ — 50$.
So if you are interested in selling your pi network coins at a high rate tho. Or you can't wait till the mainnet launch in 2026. You can easily trade your pi coins with a merchant.
A merchant is someone who buys pi coins from miners and resell them to Investors looking forward to hold massive quantities till mainnet launch.
I will leave the what's app number of my personal pi vendor to trade with.
+12349014282
how to sell pi coins in South Korea profitably.DOT TECH
Yes. You can sell your pi network coins in South Korea or any other country, by finding a verified pi merchant
What is a verified pi merchant?
Since pi network is not launched yet on any exchange, the only way you can sell pi coins is by selling to a verified pi merchant, and this is because pi network is not launched yet on any exchange and no pre-sale or ico offerings Is done on pi.
Since there is no pre-sale, the only way exchanges can get pi is by buying from miners. So a pi merchant facilitates these transactions by acting as a bridge for both transactions.
How can i find a pi vendor/merchant?
Well for those who haven't traded with a pi merchant or who don't already have one. I will leave the what'sapp number of my personal pi merchant who i trade pi with.
Message: +12349014282 VIA Whatsapp.
#pi #sell #nigeria #pinetwork #picoins #sellpi #Nigerian #tradepi #pinetworkcoins #sellmypi
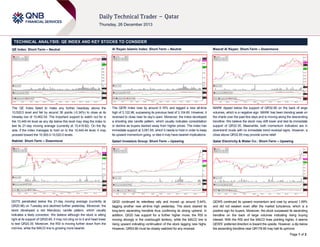
1. TECHNICAL ANALYSIS: QE INDEX AND KEY STOCKS TO CONSIDER
QE Index: Short-Term – Neutral
Al Rayan Islamic Index: Short-Term – Neutral
Masraf Al Rayan: Short-Term – Downmove
The QE Index failed to make any further headway above the
10,520.0 level and fell by around 36 points (-0.34%) to close at its
intraday low of 10,462.54. The important support to watch out for is
the 10,445.44 level as any dip below this level may drag the index to
test its 21-day moving average (currently at 10,418.82). On the flip
side, if the index manages to hold on to the 10,445.44 level, it may
proceed toward the 10,500.0-10,520.0 levels.
The QERI Index rose by around 0.10% and tagged a new all-time
high of 3,122.96, surpassing its previous best of 3,104.60. However, it
reversed to close near its day’s open. Moreover, the index developed
a shooting star candle pattern, which usually indicates consolidation
or decline as buyers backed away from higher prices. The index has
immediate support at 3,091.65, which it needs to hold in order to keep
its upward momentum going, or else it may have bearish implications.
MARK dipped below the support of QR32.85 on the back of large
volumes, which is a negative sign. MARK has been trending weak on
the charts over the past few days and is moving along the descending
trendline. We believe the stock may drift lower and test its immediate
support of QR32.35. Meanwhile, both momentum indicators are in
downtrend mode with no immediate trend reversal signs. However, a
close above QR32.85 may provide some relief.
Nakilat: Short-Term – Downmove
Qatari Investors Group: Short-Term – Upswing
Qatar Electricity & Water Co.: Short-Term – Upswing
QGTS penetrated below the 21-day moving average (currently at
QR20.98) on Tuesday and declined further yesterday. Moreover, the
stock developed a red Marubozu candle pattern, which usually
indicates a likely correction. We believe although the stock is sitting
right at its support of QR20.60, it may not cling on to it and head lower
to test QR20.35. Moreover, the RSI is moving further down from the
mid-line, while the MACD line is growing more bearish.
QIGD continued its relentless rally and moved up around 5.44%,
tagging another new all-time high yesterday. The stock cleared its
long-term ascending trendline thus confirming its strong uptrend. In
addition, QIGD has support for a further higher move; the RSI is
moving strongly in the overbought territory, while the MACD line is
rising upward indicating continuation of the stock tagging new highs.
However, QR53.80 must be closely watched for any reversal.
QEWS continued its upward momentum and rose by around 1.69%
and did not weaken even after the market turbulence, which is a
positive sign for buyers. Moreover, the stock surpassed its ascending
trendline on the back of large volumes indicating rising buying
interest. With the RSI and the MACD lines pointing higher, it seems
QEWS’ preferred direction is toward the upside. However, a dip below
the ascending trendline near QR178.90 may halt its upmove.
Page 1 of 2
2. Name (Ticker)
Last Close
Trend
Short Term
Support
Long Term
First
Resistance
Second
First
Second
Qatar Exchange Index (QE Index)
10,462.54
UP
UP
10,445.44
10,400.00
10,520.00
10,550.00
Al Rayan Islamic Index (QERI Index)
3,099.95
UP
UP
3,091.65
3,071.36
3,104.60
3,125.00
Masraf Al Rayan (MARK QD)*
32.50
DOWN
UP
32.35
32.00
32.85
33.50
Commercial Bank of Qatar (CBQK QD)
70.50
UP
UP
69.65
69.20
70.50
70.90
Doha Bank (DHBK QD)
58.00
UP
UP
57.40
56.90
58.20
58.50
Qatar Islamic Bank (QIBK QD)
69.10
DOWN
UP
69.00
68.50
69.50
70.30
Qatar International Islamic Bank (QIIK QD)
60.20
DOWN
UP
60.00
59.50
60.50
61.00
Qatar Insurance (QATI QD)
65.30
DOWN
UP
65.00
64.40
65.90
66.50
National Leasing Holding Co. (NLCS QD)
30.00
DOWN
DOWN
30.00
29.55
30.60
31.00
Widam Food Co. (WDAM QD)
53.80
UP
UP
53.00
51.90
54.50
55.00
Al Meera Consumer Goods Co. (MERS)
132.30
DOWN
DOWN
132.00
130.00
133.40
133.90
Industries Qatar (IQCD QD)
166.50
DOWN
UP
166.50
165.00
167.25
168.10
Qatar Electricity & Water Co. (QEWS QD)*
180.00
UP
UP
178.90
176.00
182.00
184.80
Gulf International Services (GISS QD)
60.60
UP
UP
60.00
59.80
61.50
62.20
Qatari Investors Group (QIGD QD)*
54.30
UP
UP
53.80
53.00
56.00
57.00
Barwa Real Estate Co. (BRES QD)
30.25
DOWN
UP
30.10
29.70
30.85
31.20
United Development Co. (UDCD QD)
22.85
DOWN
FLAT
22.85
22.50
23.15
23.65
Ooredoo (ORDS QD)
136.50
FLAT
DOWN
136.00
135.00
137.00
138.00
Vodafone Qatar (VFQS QD)
11.17
DOWN
UP
10.83
10.20
11.19
11.44
Nakilat (QGTS QD)*
20.60
DOWN
UP
20.60
20.35
21.07
21.32
Milaha (QNNS QD)
84.70
DOWN
UP
84.50
84.10
85.00
86.00
Banks and Financial Services
Banks and
Consumer Goods and Services
Consumer G
Industrials
Industrials
Real Estate
Real Estate
Telecom
Telecom
Transportation
Transportat
*These stocks are today’s suggested ideas
Overall Methodology: The charts and descriptions on Page 1 provide an indicative view of the future direction of the equities mentioned. The table on page 2 has been provided to denote historical movements in certain stocks. The historical trend analysis uses 21- and 55day SMAs for indicating short-term and long-term trends, respectively. Based on these SMAs, the historical direction of the trend is denoted as UP, DOWN or FLAT.
Selection of Key Stocks of the Day: Key stocks’ selection is based on our analysis of 19 members of the QE Index (excludes QNBK QD). Analysis includes identifying trends (short-term as well as long-term), patterns and support/resistance levels.
Trend Direction: The methods used to determine trend direction are subjective in nature. We use 21-day SMA and 55-day SMA, absolute price movements, price movements relative to SMAs and accurately drawn trend lines and chart patterns to determine the short- and
long-term trends.
Investment Horizon: The definition of short term and long term depends upon investors’ preferences and their investment objectives. As a rule of thumb, the time horizon for traders/short-term trend is 1-3 weeks while it is 1-3 months for investors/long-term trend.
Combining Technical and Fundamental Analysis: Investors can combine technical analysis (TA) with fundamental analysis (FA) to maximize their investment returns. While the “True Value” of stocks could be estimated by FA, the entry and exit timings could be fine
tuned using technical analysis to benefit from short-term movements in stock prices.
Trading Tactics: The trend direction should be analyzed based on the time-horizon of your investments. In general, investors attempt selling close to resistance levels during a downtrend and attempt buying close to support levels during uptrend.
Definitions:
1>
Simple Moving Average (SMA): A SMA is the average of the closing price of a security for a given period.
2>
RSI (Relative Strength Index): A technical momentum indicator that ranges from 0 to 100 and compares the stock’s recent price movements by evaluating recent gains and losses. Stocks with RSI above 70 could be considered overbought and below 30 could be
considered oversold. If the RSI falls below 70, it is a bearish signal. On the other hand, if the RSI rises above 30 it is considered bullish. We use a RSI of 14 days.
3>
MACD (Moving Average Convergence Divergence): MACD denotes the relationship between two moving averages, which is used to spot changes in strength, direction, momentum and duration of a stock price trend. The MACD is calculated by subtracting the 26-day
exponential moving average (EMA) from the 12-day EMA. A nine-day EMA of the MACD, called the signal line, is also plotted on top of the MACD, functioning as a trigger for buy/sell signals. The MACD line above the signal line provides a positive signal and vice versa.
Contacts
Saugata Sarkar
Ahmed M. Shehada
Keith Whitney
Sahbi Kasraoui
QNB Financial Services SPC
Head of Research
Tel: (+974) 4476 6534
saugata.sarkar@qnbfs.com.qa
Head of Trading
Tel: (+974) 4476 6535
ahmed.shehada@qnbfs.com.qa
Head of Sales
Tel: (+974) 4476 6533
keith.whitney@qnbfs.com.qa
Manager - HNWI
Tel: (+974) 4476 6544
sahbi.alkasraoui@qnbfs.com.qa
Contact Center: (+974) 4476 6666
PO Box 24025
Doha, Qatar
DISCLAIMER: This publication has been prepared by QNB Financial Services SPC (“QNBFS”) a wholly-owned subsidiary of Qatar National Bank (“QNB”). QNBFS is regulated by the Qatar Financial Markets Authority and the Qatar Exchange; QNB is
regulated by the Qatar Central Bank. This publication expresses the views and opinions of QNBFS at a given time only. It is not an offer, promotion or recommendation to buy or sell securities or other investments, nor is it intended to constitute legal,
tax, accounting, or financial advice. We therefore strongly advise potential investors to seek independent professional advice before making any investment decision. Although the information in this report has been obtained from sources that QNBFS
believes to be reliable, we have not independently verified such information and it may not be accurate or complete. While this publication has been prepared with the utmost degree of care by our analysts, QNBFS does not make any representations or
warranties as to the accuracy and completeness of the information it may contain, and declines any liability in that respect. QNBFS reserves the right to amend the views and opinions expressed in this publication at any time. It may also express
viewpoints or make investment decisions that differ significantly from, or even contradict, the views and opinions included in this report.
COPYRIGHT: No part of this document may be reproduced without the explicit written permission of QNBFS.
Page 2 of 2