SETHU INSTITUTE OFTECHNOLOGY
An Autonomous Institution
Pulloor, Kariapatti –Taulk. Virudhunagar Dist-626115.
Department of Computer Science and Engineering
Course Code Course Name L T P C
21UCS603 Artificial Intelligence And Machine Learning
(Common to CSE &IT)
3 0 0 3
Course Objectives:
To introduce the fundamental concepts in Artificial Intelligence.
To give an idea about the basics of designing intelligent agents that can solve general
purpose problems.
To introduce the concept of Machine Learning
UNIT - I AI AND PROBLEM SOLVING 9
Introduction - Agents - Problem formulation - uninformed search strategies – heuristics -
informed search strategies - Heuristic functions.
UNIT - II KNOWLEDGE REPRESENTATION AND REASONING 9
Logical agents - propositional logic - inferences - first-order logic - inferences in first order logic
- Knowledge engineering in FOL - unification - forward chaining - backward chaining -
resolution.
UNIT - III REASONING UNDER UNCERTAINTY 9
Uncertainty - review of probability - Inference using full joint distribution-probabilistic
Reasoning - Bayesian networks - Syntax and semantics of Bayesian networks - Bayesian nets
with continuous variable - Exact inference in Bayesian networks - Naive Bayes algorithm.
UNIT - IV INTRODUCTION TO MACHINE LEARNING 9
Learning from agents - inductive learning - Types of Machine learning - Supervised learning -
learning decision trees - support vector machines - Neural and Belief networks - Perceptron -
Multi-layer feed forward networks - Regression - Linear Regression.
UNIT - V UNSUPERVISED LEARNING 9
Unsupervised learning - K-means clustering - hierarchical clustering - Agglomerative and
Divisive clustering - Fuzzy clustering.
Total: 45 Periods
2.
Text Books:
1. S.Russel and P. Norvig, “Artificial Intelligence – A Modern Approach”, Second
Edition, Pearson Education, 2003.
2. D. Poole and A. Mackworth. Artificial Intelligence: Foundations of Computational
Agents, Cambridge University Press, 2010.
References:
1. David Poole, Alan Mackworth, Randy Goebel, ”Computational Intelligence: a logical
approach”, Oxford University Press, 2004.
2. G. Luger, “Artificial Intelligence: Structures and Strategies for complex problem
solving”, Fourth Edition, Pearson Education, 2002.
3. J. Nilsson, “Artificial Intelligence: A new Synthesis”, Elsevier Publishers, 1998.
4. Brachman, H. Levesque. Knowledge Representationand Reasoning,
Morgan Kaufmann, 2004.
5. JiaweiHan ,MichelineKamber, Jian Pei ,” Data Mining: Concepts and Techniques”, 3rd
edition.
Course Outcomes
At the end of the course the student will be able to
COs Course Outcome Statement Taxonomy Domain POs/PSOs
CO1 Explain the concepts of Artificial
Intelligence and Machine Learning.
Understand Cognitive -
CO2 Apply the concepts of Artificial Intelligence and Machine
Learning to solve the real world problems.
Apply Cognitive PO1, PSO1
CO3 Analyze the problem solving and reasoning techniques to find
an optimal solution for a real world problem.
Analyze Cognitive PO2, PSO1
CO4 Evaluate various parameters to improve the performance of a
learning algorithm to find solution of a complex engineering
problem.
Evaluate Cognitive PO4, PSO1
CO5 Design a model to develop solution for a real world problem. Create Cognitive PO3,
PO5,PSO1
CO6 Work individually or in teams and demonstrate the solutions
to the given problems through presentation.
Value Affective PO9,
PO10.
3.
CO-PO mapping
PO1 PO2PO3 PO4 PO5 PO6 PO7 PO8 PO9 PO10 PO11 PO12 PSO1 PSO2
CO1
CO2 3 3
CO3 2 2
CO4 2 2
CO5 2 2 2
CO6 2 2
Question Pattern (Periodical Test)
10*2 marks =20marks
5*16marks=80marks
Question Pattern (End Semester Exam)
10*2 marks =20marks
5*16marks=80marks
2 Marks 16 Marks
Unit - I 2 Questions 1 Question
Unit - II 2 Questions 1 Question
Unit - III 2 Questions 1 Question
Unit - IV 2 Questions 1 Question
Unit - V 2 Questions 1 Question
10*2 = 20 Marks 5*16=80 Marks
Competency addressed inthe Course and Corresponding Performance Indicators
PO Competency Performance Indicators
PO
1
1.7:Demonstrate competence in specialized
engineering knowledge to the program
1.7.1 Apply theory and principles of computer
science and engineering to solve an engineering
problem
PO
2
2.1: Demonstrate an ability to identify and
formulate complex engineering problem
2.5.2 Identify processes/modules/algorithms of
a computer-based system and parameters to
solve a problem
PO
3
3.6: Demonstrate an ability to generate a
diverse set of alternative design solutions
3.6.2 Able to produce a variety of potential
design solutions suited to meet functional
requirements.
PO
4De 4.2: Demonstrate an ability to design
experiments to solve open-ended problems
4.2. 4.2.1Design and develop an experimental
approach, specify appropriate equipment and
procedures
PO
5
PO 5.5: Demonstrate an ability to select and
apply discipline specific tools, techniques
and resources
5.5.2 Demonstrate proficiency in using
discipline-specific tools
7.
Sample Assessment Questions
UnderstandLevel
Unit 1
S.NO Questions Marks
Assessment
Tool
1.
Define the term "agent" in the context of Artificial
Intelligence. How does it interact with its environment?
2
Test 1
2.
Define the term "heuristic function" and its role in
informed search strategies.
2
Test 1
3.
How do you distinguish between the problem space and
the state space in problem formulation?
2
Test 1
4.
Explain the difference between the problem state and the
goal state in a problem-solving context.
2
Test 1
5. What is the primary goal of Artificial Intelligence (AI)? 2 Test 1
6. What is the difference between DFS and BFS? 2 Test 1
7.
How does a heuristic function contribute to the efficiency
of a search algorithm?
2
Test 1
8.
What is a heuristic function, and how does it contribute to
the efficiency of search algorithms?Can you give an
example of a heuristic function used in a real-world
problem?
16
Test 1
9.
How do informed search strategies differ from
uninformed ones, and what advantages do they offer?
Explain the concept of A* search algorithm and how it
uses heuristics.
16 Test 1
10.
a) What are uninformed search strategies, and how do
they explore solution spaces? (8M)
b) Describe the key characteristics of depth-first search
and breadth-first search algorithms. (8 M)
16
Test 1
Unit 2
S.NO Questions Marks
Assessment
Tool
1.
What is a logical agent in the context of artificial
intelligence?
2
Test 1
2. How does first-order logic differ from propositional logic? 2 Test 1
3. What types of inferences are possible in first-order logic? 2 Test 1
4.
Explain the concept of forward chaining in the context of
knowledge representation.
2 Test 1
5.
How does backward chaining differ from forward
chaining?
2 Test 1
6. What is the role of resolution in logical inference? 2 Test 1
7. Define Unification Algorithm with an Example. 2 Test 1
8. Give the components of the knowledge Based System? 2 Test 1
9.
Differentiate between forward chaining and backward
chaining as reasoning strategies in logical agents. Provide
an example scenario for each strategy.
16 Test 1
10. Explain the role and interactions of logical agents,
propositional logic, first-order logic, and various inference
techniques. Elaborate on knowledge engineering in the
context of first-order logic and its associated processes,
16 Test 1
8.
including unification, forwardchaining, backward
chaining, and resolution. Provide examples to illustrate
key concepts.
Unit 3
S.NO Questions Marks
Assessment
Tool
1. Define uncertainty in the context of artificial intelligence. 2 Test 2
2. What is the fundamental concept of probability theory? 2 Test 2
3. What is the primary purpose of Bayesian networks in AI? 2 Test 2
4. Define the syntax of a Bayesian network. 2 Test 2
5.
What are the challenges associated with exact inference in
Bayesian networks?
2 Test 2
6. What are the other approaches to uncertain reasoning? 2 Test 2
7. Define Bayes theorem 2 Test 2
8. What are the properties of Atomic event? 2 Test 2
9.
Explain in detail about Bayesian networks concepts with
suitable examples.
16 Test 2
10.
Explain the working of the naïve Bayesian classifier with
an example
16 Test 2
Unit 4
S.NO Questions Marks
Assessment
Tool
1.
Name two primary types of machine learning and provide
a brief distinction between them.
2
Test 2
2.
What is the primary goal of Support Vector Machines
(SVM) in machine learning?
2
Test 2
3.
Explain the concept of learning decision trees in
supervised learning.
2
Test 2
4.
Differentiate between neural networks and belief networks
in machine learning.
2
Test 2
5. What is a perceptron, and what is its basic operation? 2 Test 2
6.
What is the primary goal of regression in machine
learning?
2
Test 2
7.
Define multi-layer feed forward networks in neural
networks.
2
Test 2
8.
State the need for pruning phase indecision tree
construction.
2
Test 2
9.
Briefly explain the concept of inductive learning in
machine learning.
2
Test 2
10.
Explain the concept of Support Vector Machine in detail
with suitable examples.
16 Test 2
11.
Explain in detail about the Neural Networks in Machine
learning with examples.
16 Test 2
12.
Explain any two supervised learning algorithms in detail
with suitable examples.
16 Test 2
13.
What is regression? Explain in detail about the concept of
linear regression with examples.
16 Test 2
Unit 5
S.NO Questions Marks
Assessment
Tool
1. State the difference between classification and clustering? 2 Test 2
9.
2. What arethe requirements of cluster analysis? 2 Test 2
3. List the types of data used in cluster analysis. 2 Test 2
4. Give the categorization of major clustering methods. 2 Test 2
5. What is unsupervised learning? Give some examples. 2 Test 2
6. Classify hierarchical clustering methods. 2 Test 2
7.
Differentiate agglomerative and divisive approaches of
clustering.
2
Test 2
8.
Describe the concept of single link and complete link in
the context of hierarchical clustering.
2
Test 2
9. What is dendrogram? Explain its uses. 2 Test 2
10.
State the strengths and weaknesses of k-means clustering
algorithm
2
Test 2
11.
Describe the concept of single link and complete link in
the context of hierarchical clustering.
2
Test 2
12.
Explain in detail about the method involved in hierarchical
clustering and Write the difference between the partitioning
method and Hierarchical method.
16
Test 2
13.
Explain in detail about the centroid based techniques (k-means)
with relevant example.
16
Test 2
14.
Explain in detail about the fuzzy clustering with relevant
example.
16
Test 2
Apply Level
Unit 1
S.NO Questions
Mark
s
Assessment
Tool
1.
Consider a state space where the start state is number 1 and the successor
function for state n returns two states, numabe5rs 2n and 2n+1.Draw the
portion of the state space for states 1 to 15
2 Test 1
2.
You are given the following 8-puzzle problem with start state and end state
Your task is to draw a state space tree from given start state, only to the given
specific end state.
2 Test 1
3. Imagine you are designing an intelligent agent for an autonomous delivery
robot tasked with delivering packages within a city. The robot needs to
navigate through a complex urban environment with various obstacles, traffic
conditions, and delivery destinations. Apply the concepts of uninformed
2 Test 1
10.
Search Strategies todesign an effective navigation system for the delivery
robot.
4.
Consider the Missionaries and cannibals problem: 3 Missionaries and 3
Cannibals are on one side of a river, along with a boat that can hold one or
two people. Find a way to get everyone to the other side. Draw a diagram of
the complete state space graph or tree.
2 Test 1
5.
Provide the PEAS description of the task environment for Internet book-
shopping agent, Vacuum Cleaner Agent, Medical Diagnosis System and
Autonomous Mars rover. Compare and contrast the properties of task
environment.
16 Test 1
6.
Give the initial state, goal test, successor function, and cost function for each
of the following. Choose a formulation that is precise enough to be
implemented.
1.You have to color a planar map using only four colors, in such a way that no
two adjacent regions have the same color.
2.In the traveling salesperson problem (TSP) there is a map involving N cities
some of which are connected by roads. The aim is to find the shortest tour that
starts from a city, visits all the cities exactly once and comes back to the
starting city.
3.Missionaries & Cannibals problem: 3 missionaries & 3 cannibals are on one
side of the river. 1 boat carries 2. Missionaries must never be outnumbered by
cannibals. Give a plan for all to cross the river.
16 Test 1
7.
Consider the tree shown below. The numbers on the arcs are the arc lengths.
Assume that the nodes are expanded in alphabetical order when no other order
is specified by the search, and that the goal is state L. No visited or expanded
lists are used. What order would the states be expanded by each type of
search? Stop when you expand G. Write only the sequence of states expanded
by the following search.
a)Breadth-first search
b)Depth-first search
c)Uniform-Cost Search
16 Test 1
8.
(i)Discuss about Automated taxi driver agent with different types of agent
program in any intelligent system?
(ii) Provide the PEAS description of the task environment for ATM System
and Interactive English teacher and Compare with properties of task
environment.
16 Test 1
Unit 2
S.NO Questions Mark Assessment
11.
s Tool
1.
Convert intoCNF
2 Test 1
2.
Decide whether each of the following sentences is valid, unsatisfiable or
neither. Verify your decisions using truth tables or the equivalence rules.
Smoke→Smoke, Smoke→Fire, Smoke V Fire V¬Fire
2 Test 1
3.
Given the following statements represented by the variables A, B, and C
Translate the following sentence into propositional logic.
A – Alice is elected secretary. B – Bert is elected governor.C – Calvin is
elected treasurer.
If Alice is elected secretary, then either Bert is elected governor or Calvin is
elected treasurer.
2 Test 1
4.
Consider the following facts:
1. Ravi likes all kind of food.
2. Apples and chicken are food
3. Anything anyone eats and is not killed is food
4. Ajay eats peanuts and is still alive
5. Rita eats everything that Ajay eats
(a) Translate these sentences into formulas in predicate logic.
(b) Convert the formulas of a part into clause form.
(c ) Prove by Resolution that “Ravi likes peanuts.
(d) Use Forward Chaining to prove that “what food Rita eats”
16 Test 1
5.
Illustrate the various steps associated with the knowledge engineering Process
for the following full adder circuit.
16 Test 1
6.
Given the following CNF knowledge base.
A.Determined (Mario)
B.¬ Determined(x) v Marry(x, Princess)
C.¬ Practice(x) v Defeat(x, y)
D.¬ Defeat(x, Bowser) v ¬ Marry(x, Princess) v Joyful(x)
E.¬ Determined(x) v Defeat(x, y)
F.¬ Practice (Mario)
Please demonstrate how one can prove Joyful(Mario) using Forward
Chaining, Backward Chaining and Resolution as the inference. Show all
details of unification needed for each step of the inference process. (You may
assume that Mario, Princess, and Bowser are constants, and x and y are
variables).
16 Test 1
7. Consider the following facts and query
“The law says that it is a crime for an American to sell weapons to hostile
nations. The country Nono, an enemy of America, has some missiles, and all
of its missiles were sold to it by Colonel West, who is American” and we must
Prove that Col. West is a criminal using forward Chaining algorithm and
16 Test 1
12.
Backward chaining algorithm.
8.
Transformthe following facts into FOL and those convert into CNF.
•Everyone who loves all animals is loved by someone.
•Jack loves all animals.
•Either Jack or Curiosity killed the cat, which is named Tuna.
•Did Curiosity kill the cat?
16 Test 1
9.
Consider the following 5 facts that are added to a knowledge base in turn.
Hobbit, Hero, Hafling are predicates, FinalBattle is a function, Frodo and
Mount Doom are constants, and x and y are variables that are universally
quantified.
1. Journey(Frodo, Mount Doom)
2. Hafling(x) → Hobbit(x)
3. Journey(x, y) → Final Battle(x, y)
4. Hafling (Frodo)
5. Hobbit(x) ^ Final Battle(x, Mount Doom)→ Hero(x)
i) Show how forward chaining can be used to infer whether Frodo is a Hero
(i.e.Hero(Frodo)).
ii) Show how backward chaining can be used to infer whether Frodo is a
Hero (i.e. Hero(Frodo)).
iii) Justify “Frodo is Hero” by resolution.
16 Test 1
Unit 3
S.NO Questions
Mark
s
Assessment
Tool
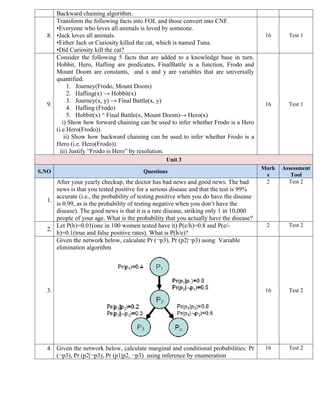
1.
After your yearly checkup, the doctor has bad news and good news. The bad
news is that you tested positive for a serious disease and that the test is 99%
accurate (i.e., the probability of testing positive when you do have the disease
is 0.99, as is the probability of testing negative when you don’t have the
disease). The good news is that it is a rare disease, striking only 1 in 10,000
people of your age. What is the probability that you actually have the disease?
2 Test 2
2.
Let P(h)=0.01(one in 100 women tested have it) P(e/h)=0.8 and P(e/-
h)=0.1(true and false positive rates). What is P(h/e)?
2 Test 2
3.
Given the network below, calculate Pr (¬p3), Pr (p2|¬p3) using Variable
elimination algorithm
16 Test 2
4. Given the network below, calculate marginal and conditional probabilities: Pr
(¬p3), Pr (p2|¬p3), Pr (p1|p2, ¬p3) using inference by enumeration
16 Test 2
13.
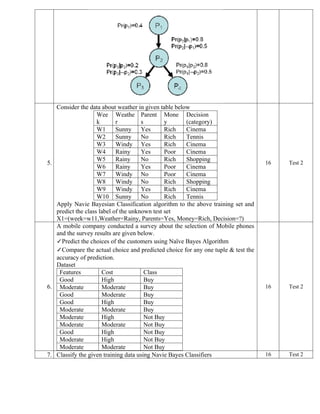
5.
Consider the dataabout weather in given table below
Wee
k
Weathe
r
Parent
s
Mone
y
Decision
(category)
W1 Sunny Yes Rich Cinema
W2 Sunny No Rich Tennis
W3 Windy Yes Rich Cinema
W4 Rainy Yes Poor Cinema
W5 Rainy No Rich Shopping
W6 Rainy Yes Poor Cinema
W7 Windy No Poor Cinema
W8 Windy No Rich Shopping
W9 Windy Yes Rich Cinema
W10 Sunny No Rich Tennis
Apply Navie Bayesian Classification algorithm to the above training set and
predict the class label of the unknown test set
X1=(week=w11,Weather=Rainy, Parents=Yes, Money=Rich, Decision=?)
16 Test 2
6.
A mobile company conducted a survey about the selection of Mobile phones
and the survey results are given below.
✓Predict the choices of the customers using Naïve Bayes Algorithm
✓Compare the actual choice and predicted choice for any one tuple & test the
accuracy of prediction.
Dataset
Features Cost Class
Good High Buy
Moderate Moderate Buy
Good Moderate Buy
Good High Buy
Moderate Moderate Buy
Moderate High Not Buy
Moderate Moderate Not Buy
Good High Not Buy
Moderate High Not Buy
Moderate Moderate Not Buy
16 Test 2
7. Classify the given training data using Navie Bayes Classifiers 16 Test 2
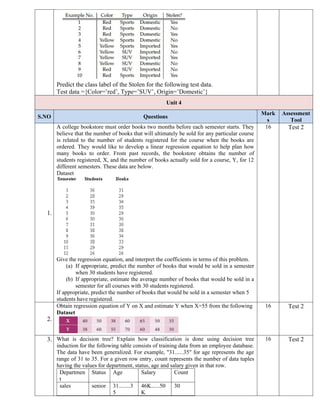
14.
Predict the classlabel of the Stolen for the following test data.
Test data ={Color=’red’, Type=’SUV’, Origin=’Domestic’}
Unit 4
S.NO Questions
Mark
s
Assessment
Tool
1.
A college bookstore must order books two months before each semester starts. They
believe that the number of books that will ultimately be sold for any particular course
is related to the number of students registered for the course when the books are
ordered. They would like to develop a linear regression equation to help plan how
many books to order. From past records, the bookstore obtains the number of
students registered, X, and the number of books actually sold for a course, Y, for 12
different semesters. These data are below.
Dataset
Give the regression equation, and interpret the coefficients in terms of this problem.
(a) If appropriate, predict the number of books that would be sold in a semester
when 30 students have registered.
(b) If appropriate, estimate the average number of books that would be sold in a
semester for all courses with 30 students registered.
If appropriate, predict the number of books that would be sold in a semester when 5
students have registered.
16 Test 2
2.
Obtain regression equation of Y on X and estimate Y when X=55 from the following
Dataset
16 Test 2
3. What is decision tree? Explain how classification is done using decision tree
induction for the following table consists of training data from an employee database.
The data have been generalized. For example, "31......35" for age represents the age
range of 31 to 35. For a given row entry, count represents the number of data tuples
having the values for department, status, age and salary given in that row.
Departmen
t
Status Age Salary Count
sales senior 31........3
5
46K......50
K
30
16 Test 2
15.
sales junior 26.........3
0
26K.......30
K
40
salesjunior 31. . . 35 31K. . .
35K
40
systems junior 21. . . 25 46K. . .
50K
20
systems senior 31. . . 35 66K. . .
70K
5
systems junior 26. . . 30 46K. . .
50K
3
systems senior 41. . . 45 66K. . .
70K
3
marketing senior 36. . . 40 46K. . .
50K
10
marketing junior 31.....45 41K...45K 4
Secretary senior 46....50 36K.....40K 4
Secretary junior 26.....30 26K.....30K 6
Let status be the class label attribute.
Use Your algorithm to construct a decision tree from the given data.
4.
Use a simple perceptron with weights w0,w1 and w2 as -1,2,1 respectively, to
classify data points (3,4);(5,2);(1,-3);(-8,-3),(-3,0).
16 Test 2
5.
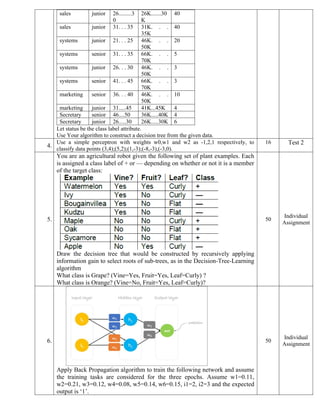
You are an agricultural robot given the following set of plant examples. Each
is assigned a class label of + or — depending on whether or not it is a member
of the target class:
Draw the decision tree that would be constructed by recursively applying
information gain to select roots of sub-trees, as in the Decision-Tree-Learning
algorithm
What class is Grape? (Vine=Yes, Fruit=Yes, Leaf=Curly) ?
What class is Orange? (Vine=No, Fruit=Yes, Leaf=Curly)?
50
Individual
Assignment
6.
Apply Back Propagation algorithm to train the following network and assume
the training tasks are considered for the three epochs. Assume w1=0.11,
w2=0.21, w3=0.12, w4=0.08, w5=0.14, w6=0.15, i1=2, i2=3 and the expected
output is ‘1’.
50
Individual
Assignment
16.
7.
A pharmacodynamic studywas conducted at Yale in the 1960’s to determine
the relationship between LSD concentration and math scores in a group of
volunteers. The independent (predictor) variable was the mean tissue
concentration of LSD in a group of 5 volunteers, and the dependent (response)
variable was the mean math score among the volunteers. There were n=7
observations, collected at different time points throughout the experiment
using Regression model and Find the prediction equation.
Time
(i)
Score
(Y)
Conc
(X)
1 78.93 1.17
2 58.20 2.97
3 67.47 3.26
4 37.47 4.69
5 45.65 5.83
6 32.92 6.00
7 29.97 6.41
50
Individual
Assignment
8.
Construct a support vector machine that computes the XOR function. It will
be convenient to use values of 1 and -1 instead of 1 and 0 fair the inputs and
for the outputs. So an example looks like ( [- 1, I], 1) or ( [- 1, - 11, - 1). It is
typical to map an input x into a space consisting of five dimensions, the two
original dimensions x1 and x2, and the three: combination
. But for this exercise we will consider only the two
dimensions xl and xI x2. Draw the four input points in this space, and the
maximal margin separator. What is the margin? Now draw the separating line
back in the original Euclidean input space.
50
Individual
Assignment
9.
Consider a fictional dataset that describes the weather conditions for playing a
game of golf. Given the weather conditions, each tuple classifies the
conditions as fit(“Yes”) or unfit(“No”) for playing golf. Design a Decision
Tree for the dataset and test the chance of playing golf if the weather
condition today = (Sunny, Hot, Normal, False)
Outlook Temperature Humidity Windy Play Golf
0 Rainy Hot High False No
1 Rainy Hot High True No
2 Overcast Hot High False Yes
3 Sunny Mild High False Yes
4 Sunny Cool Normal False Yes
5 Sunny Cool Normal True No
6 Overcast Cool Normal True Yes
7 Rainy Mild High False No
8 Rainy Cool Normal False Yes
9 Sunny Mild Normal False Yes
10 Rainy Mild Normal True Yes
11 Overcast Mild High True Yes
12 Overcast Hot Normal False Yes
13 Sunny Mild High True No
50
Individual
Assignment
Unit 5
S.NO Questions
Mark
s
Assessment
Tool
17.
1.
Given two objectsrepresented by the tuples (22, 1, 42, 10) and (10, 15, 20,
8): Compute the Euclidean distance between the two objects.
2 Test 2
2.
Given two objects represented by the tuples (2, 5, 6, 1) and (20, 0, 36, 8):
Compute the Minkowski distance between the two objects.
2 Test 2
3.
Let x1= (1, 2) and x2= (3, 5) represent two points. Calculate the Manhattan
and Euclidean distance between the two points.
2 Test 2
4.
Consider five points{x1,x2,x3,x4,x5} with the following co-ordinates as a
two dimensional sample for clustering:
x1=(0,2), x2=(1,0), x3=(2,1), x4=(4,1) and x5=(5,3). Illustrate the k-means
algorithm on the above data set. The required number of cluster is two, &
initially clusters are formed from random distribution of samples: c1={x1,
x2, x4} and c2= {x3, x5}.
16 Test 2
5.
Apply Divisive clustering to the following 8 examples to convert into them
into no of clusters: A1=(2,10), A2=(2,5), A3=(8,4), A4=(5,8), A5=(7,5),
A6=(6,4), A7=(1,2), A8=(4,9).
16 Test 2
6.
Apply Agglomerative Hierarchical clustering to the following 8 examples to
convert into them into cluster: A1=(2,10), A2=(2,5), A3=(8,4), A4=(5,8),
A5=(7,5), A6=(6,4), A7=(1,2), A8=(4,9).
16 Test 2
7.
Apply Fuzzy C means clustering to the following examples to convert into
them into two clusters: A1=(1,3), A2=(1.5,3.2), A3=(1.3,2.5), A4=(3,1).
16 Test 2
8.
Consider the following dataset, it consisting of height and weight information
of 10 players. We need to group them into two clusters based on their height
and weight. Initial cluster is K1(185,70) and K2(170,80)
Height Weight
180 80
172 73
178 69
189 82
164 70
186 71
180 69
170 76
166 71
180 72
16 Test 2
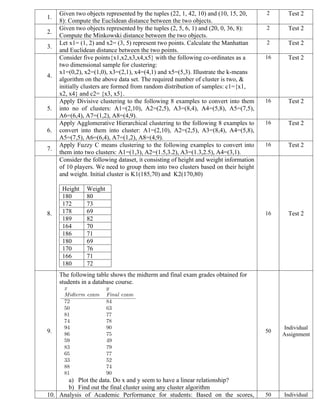
9.
The following table shows the midterm and final exam grades obtained for
students in a database course.
a) Plot the data. Do x and y seem to have a linear relationship?
b) Find out the final cluster using any cluster algorithm
50
Individual
Assignment
10. Analysis of Academic Performance for students: Based on the scores, 50 Individual
18.
students are categorizedinto grades like A, B, or C using any one Clustering
method
Assignment
11.
Cluster the following data set consisting of the scores of two variables on
each of seven individuals and k=2 using any one Clustering method.
Subject A B
1 1.0 1.0
2 1.5 2.0
3 3.0 4.0
4 5.0 7.0
5 3.5 5.0
6 4.5 5.0
7 3.5 4.5
50
Individual
Assignment
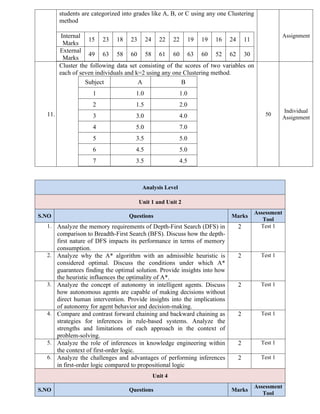
Analysis Level
Unit 1 and Unit 2
S.NO Questions Marks
Assessment
Tool
1. Analyze the memory requirements of Depth-First Search (DFS) in
comparison to Breadth-First Search (BFS). Discuss how the depth-
first nature of DFS impacts its performance in terms of memory
consumption.
2 Test 1
2. Analyze why the A* algorithm with an admissible heuristic is
considered optimal. Discuss the conditions under which A*
guarantees finding the optimal solution. Provide insights into how
the heuristic influences the optimality of A*.
2 Test 1
3. Analyze the concept of autonomy in intelligent agents. Discuss
how autonomous agents are capable of making decisions without
direct human intervention. Provide insights into the implications
of autonomy for agent behavior and decision-making.
2 Test 1
4. Compare and contrast forward chaining and backward chaining as
strategies for inferences in rule-based systems. Analyze the
strengths and limitations of each approach in the context of
problem-solving.
2 Test 1
5. Analyze the role of inferences in knowledge engineering within
the context of first-order logic.
2 Test 1
6. Analyze the challenges and advantages of performing inferences
in first-order logic compared to propositional logic
2 Test 1
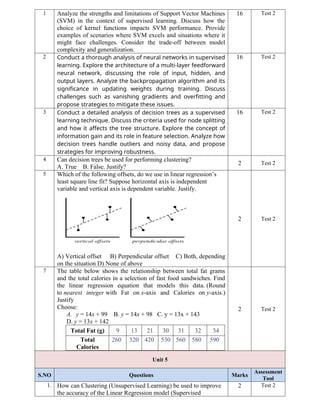
Unit 4
S.NO Questions Marks
Assessment
Tool
Internal
Marks
15 23 18 23 24 22 22 19 19 16 24 11
External
Marks
49 63 58 60 58 61 60 63 60 52 62 30
19.
1 Analyze thestrengths and limitations of Support Vector Machines
(SVM) in the context of supervised learning. Discuss how the
choice of kernel functions impacts SVM performance. Provide
examples of scenarios where SVM excels and situations where it
might face challenges. Consider the trade-off between model
complexity and generalization.
16 Test 2
2 Conduct a thorough analysis of neural networks in supervised
learning. Explore the architecture of a multi-layer feedforward
neural network, discussing the role of input, hidden, and
output layers. Analyze the backpropagation algorithm and its
significance in updating weights during training. Discuss
challenges such as vanishing gradients and overfitting and
propose strategies to mitigate these issues.
16 Test 2
3 Conduct a detailed analysis of decision trees as a supervised
learning technique. Discuss the criteria used for node splitting
and how it affects the tree structure. Explore the concept of
information gain and its role in feature selection. Analyze how
decision trees handle outliers and noisy data, and propose
strategies for improving robustness.
16 Test 2
4 Can decision trees be used for performing clustering?
A. True B. False. Justify?
2 Test 2
5 Which of the following offsets, do we use in linear regression’s
least square line fit? Suppose horizontal axis is independent
variable and vertical axis is dependent variable. Justify.
A) Vertical offset B) Perpendicular offset C) Both, depending
on the situation D) None of above
2 Test 2
7 The table below shows the relationship between total fat grams
and the total calories in a selection of fast food sandwiches. Find
the linear regression equation that models this data. (Round
to nearest integer with Fat on x-axis and Calories on y-axis.)
Justify
Choose:
A. y = 14x + 99 B. y = 14x + 98 C. y = 13x + 143
D. y = 13x + 142
Total Fat (g) 9 13 21 30 31 32 34
Total
Calories
260 320 420 530 560 580 590
2 Test 2
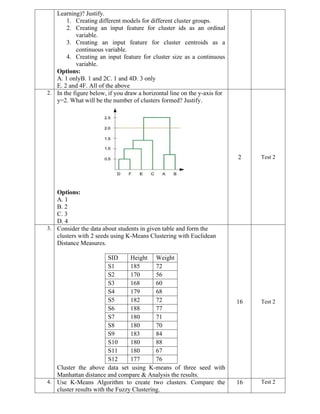
Unit 5
S.NO Questions Marks
Assessment
Tool
1. How can Clustering (Unsupervised Learning) be used to improve
the accuracy of the Linear Regression model (Supervised
2 Test 2
20.
Learning)? Justify.
1. Creatingdifferent models for different cluster groups.
2. Creating an input feature for cluster ids as an ordinal
variable.
3. Creating an input feature for cluster centroids as a
continuous variable.
4. Creating an input feature for cluster size as a continuous
variable.
Options:
A. 1 onlyB. 1 and 2C. 1 and 4D. 3 only
E. 2 and 4F. All of the above
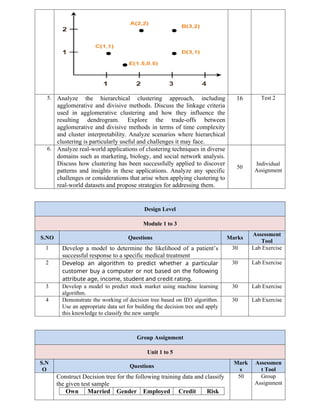
2. In the figure below, if you draw a horizontal line on the y-axis for
y=2. What will be the number of clusters formed? Justify.
Options:
A. 1
B. 2
C. 3
D. 4
2 Test 2
3. Consider the data about students in given table and form the
clusters with 2 seeds using K-Means Clustering with Euclidean
Distance Measures.
SID Height Weight
S1 185 72
S2 170 56
S3 168 60
S4 179 68
S5 182 72
S6 188 77
S7 180 71
S8 180 70
S9 183 84
S10 180 88
S11 180 67
S12 177 76
Cluster the above data set using K-means of three seed with
Manhattan distance and compare & Analysis the results.
16 Test 2
4. Use K-Means Algorithm to create two clusters. Compare the
cluster results with the Fuzzy Clustering.
16 Test 2
21.
5. Analyze thehierarchical clustering approach, including
agglomerative and divisive methods. Discuss the linkage criteria
used in agglomerative clustering and how they influence the
resulting dendrogram. Explore the trade-offs between
agglomerative and divisive methods in terms of time complexity
and cluster interpretability. Analyze scenarios where hierarchical
clustering is particularly useful and challenges it may face.
16 Test 2
6. Analyze real-world applications of clustering techniques in diverse
domains such as marketing, biology, and social network analysis.
Discuss how clustering has been successfully applied to discover
patterns and insights in these applications. Analyze any specific
challenges or considerations that arise when applying clustering to
real-world datasets and propose strategies for addressing them.
50
Individual
Assignment
Design Level
Module 1 to 3
S.NO Questions Marks
Assessment
Tool
1 Develop a model to determine the likelihood of a patient’s
successful response to a specific medical treatment
30 Lab Exercise
2 Develop an algorithm to predict whether a particular
customer buy a computer or not based on the following
attribute age, income, student and credit rating.
30 Lab Exercise
3 Develop a model to predict stock market using machine learning
algorithm.
30 Lab Exercise
4 Demonstrate the working of decision tree based on ID3 algorithm.
Use an appropriate data set for building the decision tree and apply
this knowledge to classify the new sample
30 Lab Exercise
Group Assignment
Unit 1 to 5
S.N
O
Questions
Mark
s
Assessmen
t Tool
Construct Decision tree for the following training data and classify
the given test sample
Own Married Gender Employed Credit Risk
50 Group
Assignment
22.
Home Rating Class
YesYes Male Yes A B
No No Female Yes A A
Yes Yes Female Yes B C
Yes No Male No B B
No Yes Female Yes B C
No No Female Yes B A
No No Male No B B
Yes No Female Yes A A
No Yes Female Yes A C
Yes Yes Female Yes A C
a) Predict the following test sample
X1=(Ownhome=No, Married=Yes, Gender=Male, Employed=Yes,
Credit Rating=B, Risk Class=?)
X2=(Ownhome=Yes, Married=Yes, Gender=Female,
Employed=No, Credit Rating=A, Risk Class=?)
Predict the above samples using any two classifiers and compare
the results
Classify the given training data using following Classifiers
Own
Home
Marrie
d
Gender Employed Credit
Rating
Risk
Class
Yes Yes Male Yes A B
No No Female Yes A A
Yes Yes Female Yes B C
Yes No Male No B B
No Yes Female Yes B C
No No Female Yes B A
No No Male No B B
Yes No Female Yes A A
No Yes Female Yes A C
Yes Yes Female Yes A C
a) Predict the following test sample using SVM
X1=(Ownhome=No, Married=Yes, Gender=Male,
Employed=Yes, Credit Rating=B, Risk Class=?)
b) Predict the following test sample using Naïve Baiyes
Classifier
X2=(Ownhome=Yes, Married=Yes,
Gender=Female, Employed=No, Credit Rating=A,
Risk Class=?)
50
Group
Assignment
Consider the data about students in given table and form the
clusters with three seeds using
a) K-Means Clustering with Euclidean Distance Measure
Student Age Mark1 Mark2 Mark3
S1 18 73 75 57
S2 18 79 85 75
S3 23 70 70 52
S4 20 55 55 55
S5 22 85 86 87
S6 19 91 90 89
S7 20 70 65 60
S8 21 53 56 59
50 Group
Assignment
23.
S9 19 8282 60
S10 47 75 76 77
b) Cluster the above data set using K-means of Three seed with
Manhattan distance and compare & Analysis the results.
Consider the data about weather in given table below
Weekend Weather Parents Money
Decision
(category)
W1 Sunny Yes Rich Cinema
W2 Sunny No Rich Tennis
W3 Windy Yes Rich Cinema
W4 Rainy Yes Poor Cinema
W5 Rainy No Rich Stay in
W6 Rainy Yes Poor Cinema
W7 Windy No Poor Cinema
W8 Windy No Rich Shopping
W9 Windy Yes Rich Cinema
W10 Sunny No Rich Tennis
Apply NB Classification algorithm to the above training
set and predict the class label of the unknown test set
X1 = (weekend=w11, Weather=Rainy,Parents=Yes,
Money=Rich, Decision=?)
X2=(weekend=w12, Weather=Windy,Parents=Yes,
Money=No, Decision=?)
50
Group
Assignment
RUBRICS FOR ASSIGNMENT EVALUATION
GROUP AND INDIVIDUAL ASSIGNMENT
Students will be split into groups and each group will be assigned five complex engineering
problems, in which the students figure out the solution to the problem.
Each Question carries 20 marks
Component (90
Marks) Excellent
(90 Marks)
Good
(60 Marks)
Average
(30Marks)
Poor
(10Marks)
Description of
Concepts (10
M)
& Apply
technical
details(10 M)
Complete
explanation of the
key concepts and
strong description
of the technical
requirements of the
topic.
Complete
explanation of the
key concepts but
sufficient
description of the
technical
requirements of the
topic.
Complete
explanation of the
key concepts and
insufficient
description of the
technical
requirements of the
topic.
Inappropriate
Complete
explanation of the
key concepts and
poor description of
the technical
requirements of the
topic.
24.
Analyse the
concept of
Supervised
Learning(10M)
Understand and
apply the concept of
Supervised
Learning and
analyse the problem
to find optimal
solution.
Understand the
concept of
Supervised
Learning and
partially analyse the
problem to find
optimal solution.
Partially understand
the concept of
Supervised
Learning and
partially analyse the
problem to find
optimal solution.
Don’t understand
the concept of
Supervised
Learning and not
able to analyse the
problem.
Development(1
0 M)&
Performance
Evaluation
(10 M)
Main points well
developed with high
quality and quantity
support. Reveals
high degree of
optimal solution.
Main points well
developed with
quality supporting
details and
quantity. Optimal
Solution is weaved
into points.
Main points are
present with limited
detail and
development. Some
optimal Solution is
present.
Not understandable
Evaluating
various
parameters (10
M)
Optimal Solutions
reached by
evaluating the
various
performances.
Partial optimal
Solutions reached
by evaluating the
various
performances.
Needs
improvements.
Not
understandable.
Involvement in
the work (10 M)
The team worked
well together to
achieve objectives.
Each member
contributed in a
valuable way to the
topic. All data
sources indicated a
high level of mutual
respect and
collaboration.
The team worked
well together most
of the time, with
only a few
occurrences of
communication
breakdown or
failure to
collaborate when
appropriate.
Members were
mostly respectful of
each other.
Team did not
collaborate or
communicate well.
Some members
would work
independently,
without regard to
objectives or
priorities. A lack of
respect and regard
was frequently
noted
No involvement
(No Marks)
Usage of
Modern Tool
(10 M)
Most Relevant
Tools Used
Tool is related
Partially used
Tool does not add
to the topic
Presentation
Skills (10 M)
Communicate the
technical
information
effectively
Communicate the
technical
information
moderately
Some parts were
clear
Not understandable
(No Marks)
26.
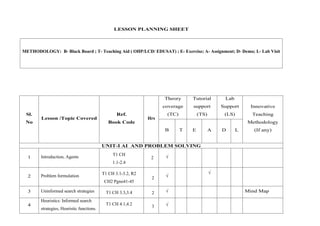
LESSON PLANNING SHEET
Sl.
No
Lesson/Topic Covered
Ref.
Book Code
Hrs
Theory
coverage
(TC)
Tutorial
support
(TS)
Lab
Support
(LS)
Innovative
Teaching
Methodology
(If any)
B T E A D L
UNIT-I AI AND PROBLEM SOLVING
1 Introduction, Agents
T1 CH
1.1-2.4
2 √
2 Problem formulation
T1 CH 3.1-3.2, R2
CH2 Pgno41-45
2 √
√
3 Uninformed search strategies T1 CH 3.3,3.4 2 √ Mind Map
4
Heuristics: Informed search
strategies, Heuristic functions.
T1 CH 4.1,4.2
3 √
METHODOLOGY: B- Black Board ; T- Teaching Aid ( OHP/LCD/ EDUSAT) ; E- Exercise; A- Assignment; D- Demo; L- Lab Visit


![7.
A pharmacodynamic study was conducted at Yale in the 1960’s to determine
the relationship between LSD concentration and math scores in a group of
volunteers. The independent (predictor) variable was the mean tissue
concentration of LSD in a group of 5 volunteers, and the dependent (response)
variable was the mean math score among the volunteers. There were n=7
observations, collected at different time points throughout the experiment
using Regression model and Find the prediction equation.
Time
(i)
Score
(Y)
Conc
(X)
1 78.93 1.17
2 58.20 2.97
3 67.47 3.26
4 37.47 4.69
5 45.65 5.83
6 32.92 6.00
7 29.97 6.41
50
Individual
Assignment
8.
Construct a support vector machine that computes the XOR function. It will
be convenient to use values of 1 and -1 instead of 1 and 0 fair the inputs and
for the outputs. So an example looks like ( [- 1, I], 1) or ( [- 1, - 11, - 1). It is
typical to map an input x into a space consisting of five dimensions, the two
original dimensions x1 and x2, and the three: combination
. But for this exercise we will consider only the two
dimensions xl and xI x2. Draw the four input points in this space, and the
maximal margin separator. What is the margin? Now draw the separating line
back in the original Euclidean input space.
50
Individual
Assignment
9.
Consider a fictional dataset that describes the weather conditions for playing a
game of golf. Given the weather conditions, each tuple classifies the
conditions as fit(“Yes”) or unfit(“No”) for playing golf. Design a Decision
Tree for the dataset and test the chance of playing golf if the weather
condition today = (Sunny, Hot, Normal, False)
Outlook Temperature Humidity Windy Play Golf
0 Rainy Hot High False No
1 Rainy Hot High True No
2 Overcast Hot High False Yes
3 Sunny Mild High False Yes
4 Sunny Cool Normal False Yes
5 Sunny Cool Normal True No
6 Overcast Cool Normal True Yes
7 Rainy Mild High False No
8 Rainy Cool Normal False Yes
9 Sunny Mild Normal False Yes
10 Rainy Mild Normal True Yes
11 Overcast Mild High True Yes
12 Overcast Hot Normal False Yes
13 Sunny Mild High True No
50
Individual
Assignment
Unit 5
S.NO Questions
Mark
s
Assessment
Tool](https://image.slidesharecdn.com/21ucs603-aiml-isdupdated3-251127061207-31c65308/85/21UCS603-AIML-INSTRUCTION-DELIVERY-DESIGN-16-320.jpg)