2017 HOUSEHOLD ENERGYCONSUMPTION SURVEY
STATISTICAL TABLES
Bureau of Statistics
P.O. Box 455
Maseru 100
Lesotho
Tel: +266 22 323 852/22 326 393
Fax: +266 22 310 177
E-mail: ees@bos.gov.ls
Website: www.bos.gov.ls
Mission: To coordinate the National Statistical System (NSS)
and produce accurate, timely and reliable culturally
relevant and internationally comparable statistical
data for evidence-based planning, decision making,
research, policy, program formulation and
monitoring and evaluation to satisfy the needs of
users and producers.
2.
i
Table of Contents
Introduction......................................................................................................................................1
Section 1: Housing Characteristics ......................................................................................................2
Table 1.1: Total Usable Area by Type of House and Season.....................................................................2
Table 1.2: Number of Houses Connected to Electricity by Type of House and Electrification Method,
2017 HECS.................................................................................................................................................2
Section 2: Biomass .............................................................................................................................3
Table 2.1: Number of Households by Method of Acquisition and Type of Biomass, 2017 HECS - Winter
..................................................................................................................................................................3
Table 2.2: Number of Households by District and Methods of Acquisition for Fuel wood, 2017 HECS -
Winter .......................................................................................................................................................3
Table 2.3: Number of Households by District and Methods of Acquisition for Crop Waste by, 2017
HECS - Winter............................................................................................................................................4
Table 2.4: Number of Households by Household Earnings and Methods of Acquisition for Fuel wood ,
2017 HECS - Winter...................................................................................................................................4
Table 2.5: Number of Households by Time (Minutes) taken to Travel and Collect Fuel wood, 2017
HECS - Winter............................................................................................................................................4
Table 2.6: Number of Households by District and Time (Minutes) taken to Collect Fuel wood, 2017
HECS..........................................................................................................................................................5
Table 2.7: Quantity (kg) of Fuel wood Used by District, Settlement and Wetness/Dryness of Wood,
2017 HECS - Winter...................................................................................................................................5
Table 2.8: Number of Households by Frequency (Month) and Type of Fuel wood Collected, 2017 HECS
- Winter.....................................................................................................................................................5
Table 2.9: Number of Households by Quantity (Kg) of Fuel wood and Number of Pots used for Cooking
Breakfast, 2017 HECS- Winter...................................................................................................................6
Table 2.10: Number of Households by District and Type of Improved Fuel wood Stove, 2017 HECS -
Winter .......................................................................................................................................................6
Table 2.11: Number of Households by Period (Months) in Use and Type of Improved Fuel wood Stove,
2017 HECS - Winter...................................................................................................................................6
3.
ii
Section 3: Sourcesof Energy and Sex of Household Head ....................................................................7
Table 3.1: Percentage Distribution of Households by Main Source of Energy for Cooking and Sex of
Household Head, 2017 HECS- Summer.....................................................................................................7
Table 3.2: Percentage Distribution of Households by Main Source of Energy for Space Heating and Sex
of Household Head, 2017 HECS................................................................................................................8
Table 3.3: Percentage Distribution of Household Head by Main Source of Energy for Lighting and Sex
of Household Head, 2017 HECS................................................................................................................8
Table 3.4: Percentage Distribution of Households by Time Taken to Travel and Collect Fuelwood and
Sex of Household Head, 2017 HECS..........................................................................................................8
Table 3.5: Percentage Distribution of Households by Biomass and Sex of Household Head, 2017 HECS9
Table 3.6: Percentage Distribution of Households by Electricity Connection and Sex of Household
Head, 2017 HECS.......................................................................................................................................9
Table 3.7: Percentage Distribution of Households by Other Energy Sources and Sex of Household
Head, 2017 HECS.......................................................................................................................................9
SECTION 4: Electricity and Appliances...............................................................................................10
Table 4.1a: Number of Households by District and Grid Electricity Connection, 2017 HECS- Summer.10
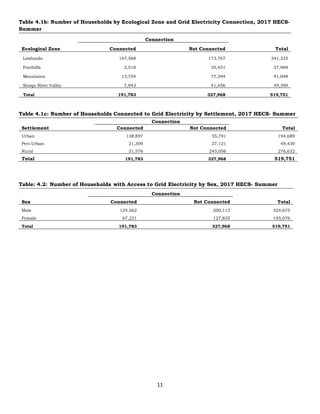
Table 4.1b: Number of Households by Ecological Zone and Grid Electricity Connection, 2017 HECS-
Summer...................................................................................................................................................11
Table 4.1c: Number of Households Connected to Grid Electricity by Settlement, 2017 HECS- Summer
................................................................................................................................................................11
Table: 4.2: Number of Households with Access to Grid Electricity by Sex, 2017 HECS- Summer ..........11
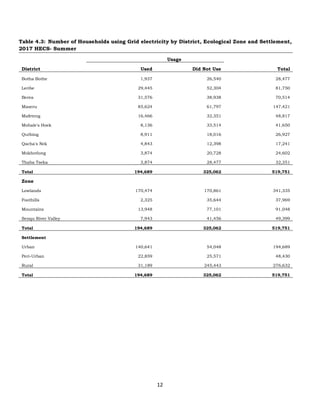
Table 4.3: Number of Households using Grid electricity by District, Ecological Zone and Settlement,
2017 HECS- Summer ...............................................................................................................................12
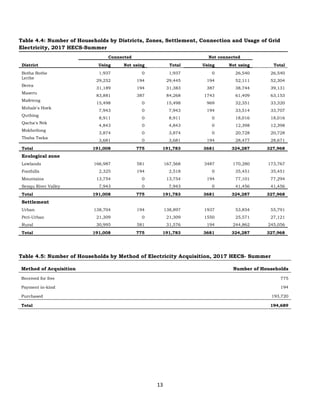
Table 4.4: Number of Households by Districts, Zones, Settlement, Connection and Usage of Grid
Electricity, 2017 HECS-Summer ..............................................................................................................13
Table 4.5: Number of Households by Method of Electricity Acquisition, 2017 HECS- Summer.............13
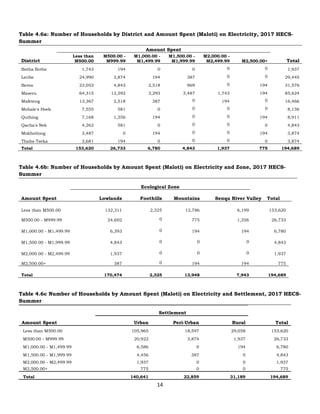
Table 4.6a: Number of Households by District and Amount Spent (Maloti) on Electricity, 2017 HECS-
Summer...................................................................................................................................................14
Table 4.6b: Number of Households by Amount Spent (Maloti) on Electricity and Zone, 2017 HECS-
Summer...................................................................................................................................................14
4.
iii
Table 4.6c Numberof Households by Amount Spent (Maloti) on Electricity and Settlement, 2017
HECS- Summer ........................................................................................................................................14
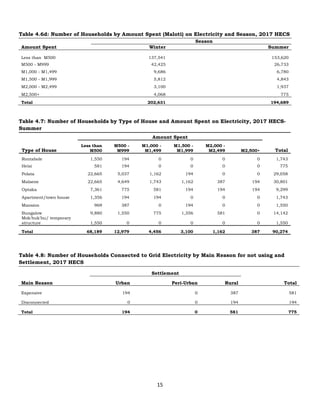
Table 4.6d: Number of Households by Amount Spent (Maloti) on Electricity and Season, 2017 HECS.15
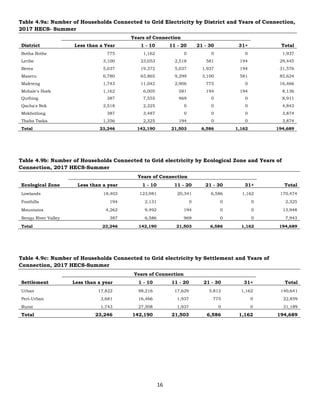
Table 4.7: Number of Households by Type of House and Amount Spent on Electricity, 2017 HECS-
Summer...................................................................................................................................................15
Table 4.8: Number of Households Connected to Grid Electricity by Main Reason for not using and
Settlement, 2017 HECS ...........................................................................................................................15
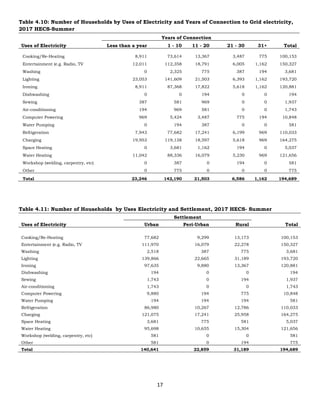
Table 4.9a: Number of Households Connected to Grid Electricity by District and Years of Connection,
2017 HECS- Summer ...............................................................................................................................16
Table 4.9b: Number of Households Connected to Grid electricity by Ecological Zone and Years of
Connection, 2017 HECS-Summer............................................................................................................16
Table 4.9c: Number of Households Connected to Grid electricity by Settlement and Years of
Connection, 2017 HECS-Summer............................................................................................................16
Table 4.10: Number of Households by Uses of Electricity and Years of Connection to Grid electricity,
2017 HECS-Summer ................................................................................................................................17
Table 4.11: Number of Households by Uses Electricity and Settlement, 2017 HECS- Summer ............17
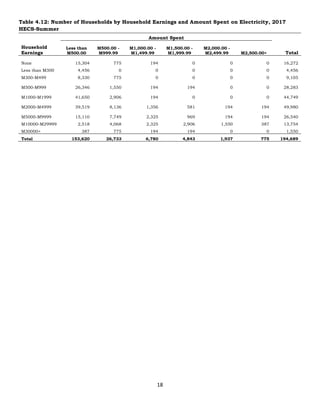
Table 4.12: Number of Households by Household Earnings and Amount Spent on Electricity, 2017
HECS-Summer .........................................................................................................................................18
Table 4.13: Number of Households by Uses of Electricity and Household Earnings, 2017 HECS-Summer
................................................................................................................................................................19
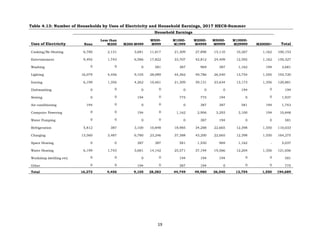
Table 4.14: Number of Households by Ownership of Appliances and Household Earnings, 2017 HECS-
Summer...................................................................................................................................................20
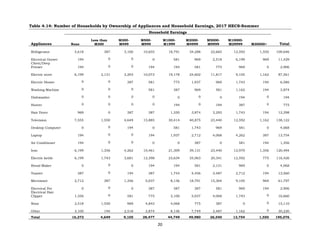
Table 4.15: Number of Households by Type of Electrical Appliance Owned and District , 2017 HECS-
Summer...................................................................................................................................................21
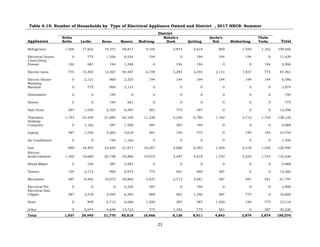
Table 4.16: Number of Households by Settlement, Method of Electrification and Type of House
Electrified, 2017 HECS-Summer..............................................................................................................22
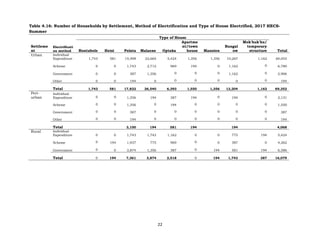
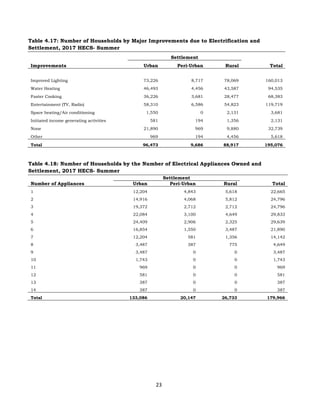
Table 4.17: Number of Households by Major Improvements due to Electrification and Settlement,
2017 HECS- Summer ...............................................................................................................................23
Table 4.18: Number of Households by the Number of Electrical Appliances Owned and Settlement,
2017 HECS- Summer ...............................................................................................................................23
5.
iv
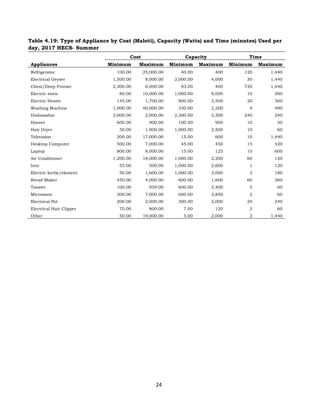
Table 4.19: Typeof Appliance by Cost (Maloti), Capacity (Watts) and Time (minutes) Used per day,
2017 HECS- Summer ...............................................................................................................................24
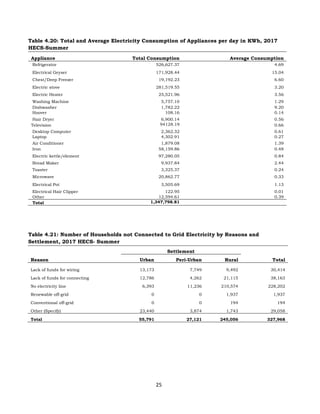
Table 4.20: Total and Average Electricity Consumption of Appliances per day in KWh, 2017 HECS-
Summer...................................................................................................................................................25
Table 4.21: Number of Households not Connected to Grid Electricity by Reasons and Settlement, 2017
HECS- Summer ........................................................................................................................................25
Section 5: Access to Car and Solar Photovoltaic Systems ...................................................................26
Table 5.1: Number of Households with Access to Car by Household Earnings, 2017 HECS-Summer....26
Table 5.2: Number of Households with Access to Car by Type, 2017 HECS-Summer ............................27
Table 5.3: Amount of Money (Maloti) Spent on Fuel by Household Earnings and Fuel Type, 2017 HECS-
Summer...................................................................................................................................................27
Table 5.4: Quantity (Litres) of Fuel Used on Vehicle by Household Earnings and Fuel Type, 2017 HECS-
Summer...................................................................................................................................................28
Table 5.5: Amount of Money (Maloti) Spent on Fuel by Household Earnings and Fuel Type, 2017 HECS-
Winter .....................................................................................................................................................28
Table 5.6: Quantity (Litres) of Fuel Consumed on Vehicle by Household Earnings and Fuel Type, 2017
HECS-Winter............................................................................................................................................29
Table 5.7: Quantity of Lubricants Used on Car by Household Earnings and Lubricant Type, 2017 HECS-
Summer...................................................................................................................................................29
Table 5.8: Quantity of Lubricants Used on Car by Household Earnings and Lubricant Type, 2017 HEC-
Winter .....................................................................................................................................................29
Table 5.9: Number of Households by Household Earnings and Solar Photovoltaic System Ownership,
2017 HECS- Summer ...............................................................................................................................30
Table 5.10: Number of Households by Household Earnings and Solar Photovoltaic System Ownership,
2017 HECS- Winter..................................................................................................................................30
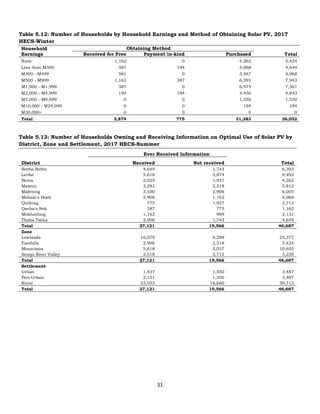
Table 5.11: Number of Households by Household Earnings and Method of Obtaining Solar PV, 2017
HECS- Summer ........................................................................................................................................30
Table 5.12: Number of Households by Household Earnings and Method of Obtaining Solar PV, 2017
HECS-Winter............................................................................................................................................31
Table 5.13: Number of Households Owning and Receiving Information on Optimal Use of Solar PV by
District, Zone and Settlement, 2017 HECS-Summer...............................................................................31
6.
v
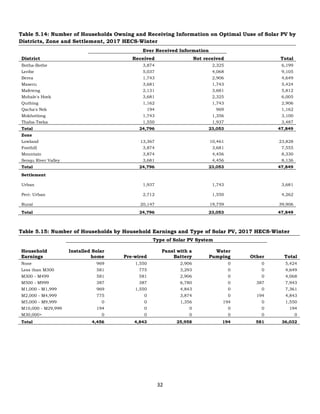
Table 5.14: Numberof Households Owning and Receiving Information on Optimal Uuse of Solar PV by
Districts, Zone and Settlement, 2017 HECS-Winter................................................................................32
Table 5.15: Number of Households by Household Earnings and Type of Solar PV, 2017 HECS-Winter 32
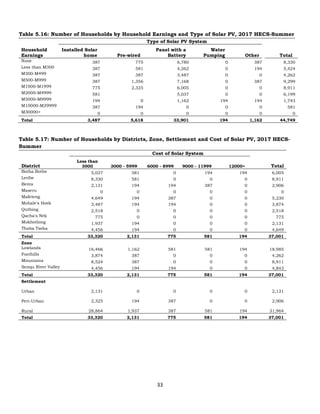
Table 5.16: Number of Households by Household Earnings and Type of Solar PV, 2017 HECS-Summer
................................................................................................................................................................33
Table 5.17: Number of Households by Districts, Zone, Settlement and Cost of Solar PV, 2017 HECS-
Summer...................................................................................................................................................33
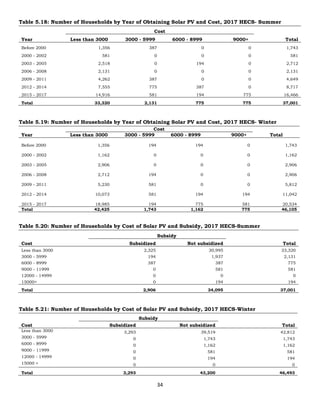
Table 5.18: Number of Households by Year of Obtaining Solar PV and Cost, 2017 HECS- Summer......34
Table 5.19: Number of Households by Year of Obtaining Solar PV and Cost, 2017 HECS- Winter ........34
Table 5.20: Number of Households by Cost of Solar PV and Subsidy, 2017 HECS-Summer ..................34
Table 5.21: Number of Households by Cost of Solar PV and Subsidy, 2017 HECS-Winter.....................34
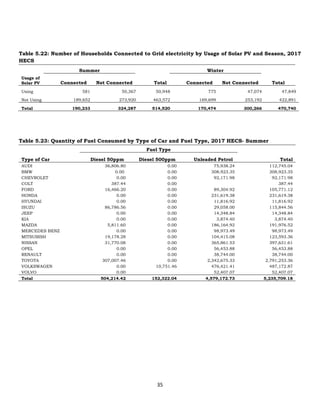
Table 5.22: Number of Households Connected to Grid electricity by Usage of Solar PV and Season,
2017 HECS...............................................................................................................................................35
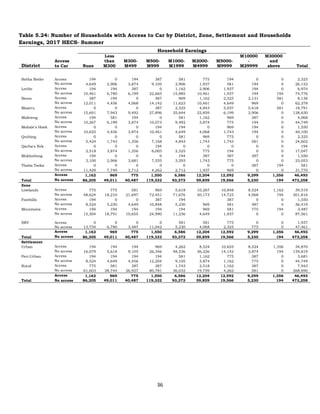
Table 5.23: Quantity of Fuel Consumed by Type of Car and Fuel Type, 2017 HECS- Summer...............35
Table 5.24: Number of Households with Access to Car by District, Zone, Settlement and Households
Earnings, 2017 HECS- Summer................................................................................................................36
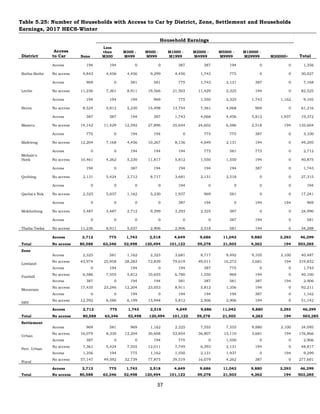
Table 5.25: Number of Households with Access to Car by District, Zone, Settlement and Households
Earnings, 2017 HECS-Winter...................................................................................................................37
Section 6: Cooking In Households .....................................................................................................38
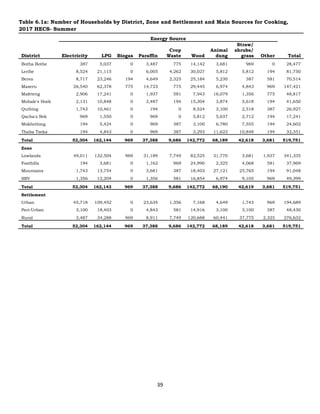
Table 6.1a: Number of Households by District, Zone and Settlement and Main Sources for Cooking,
2017 HECS- Summer ...............................................................................................................................39
Table 6.1b: Number of Households by Main Sources for Cooking by District and Settlement, 2017
HECS- Winter...........................................................................................................................................40
Table 6.1c: Number of Households by Alternative Sources of Energy for Cooking and Settlement, 2017
HECS- Summer ........................................................................................................................................40
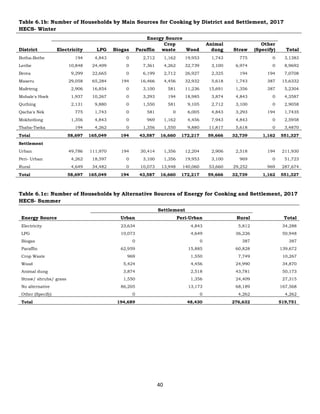
Table 6.2a: Average Quantity of Energy Sources Used for Cooking/day and Energy Used (MJ), 2017
HECS- Summer ........................................................................................................................................41
Table 6.2b: Average Quantity of Energy Sources Used for Cooking per Month and Energy Used (MJ),
2017 HECS- Summer ...............................................................................................................................41
7.
vi
Table 6.2c: AverageQuantity of Energy Sources Used for Cooking per Month and Energy Used (MJ),
2017 HECS- Winter..................................................................................................................................41
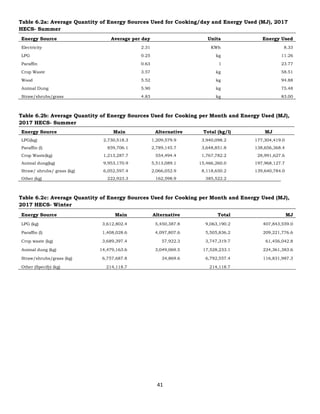
Table 6.3: Average Quantity of Main Energy Sources Used for Cooking per Month by District, Zone and
Settlement, 2017 HECS- Summer ...........................................................................................................42
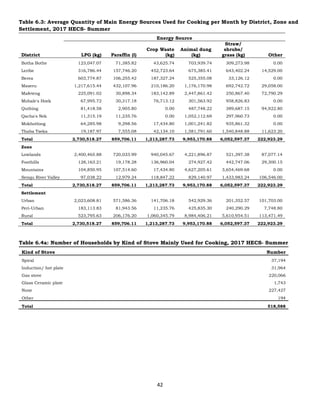
Table 6.4a: Number of Households by Kind of Stove Mainly Used for Cooking, 2017 HECS- Summer..42
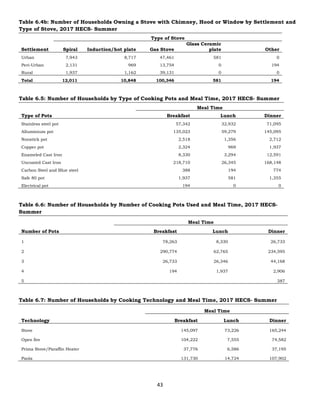
Table 6.4b: Number of Households Owning a Stove with Chimney, Hood or Window by Settlement
and Type of Stove, 2017 HECS- Summer ................................................................................................43
Table 6.5: Number of Households by Type of Cooking Pots and Meal Time, 2017 HECS- Summer.......43
Table 6.6: Number of Households by Number of Cooking Pots Used and Meal Time, 2017 HECS-
Summer...................................................................................................................................................43
Table 6.7: Number of Households by Cooking Technology and Meal Time, 2017 HECS- Summer........43
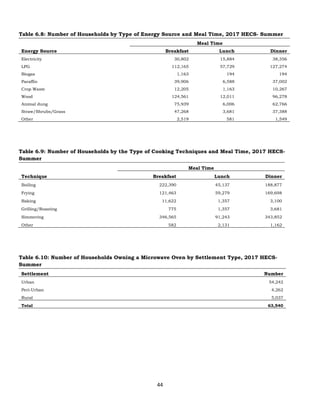
Table 6.8: Number of Households by Type of Energy Source and Meal Time, 2017 HECS- Summer ....44
Table 6.9: Number of Households by the Type of Cooking Techniques and Meal Time, 2017 HECS-
Summer...................................................................................................................................................44
Table 6.10: Number of Households Owning a Microwave Oven by Settlement Type, 2017 HECS-
Summer...................................................................................................................................................44
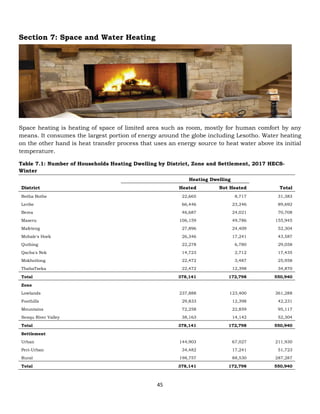
Section 7: Space and Water Heating .................................................................................................45
Table 7.1: Number of Households Heating Dwelling by District, Zone and Settlement, 2017 HECS-
Winter .....................................................................................................................................................45
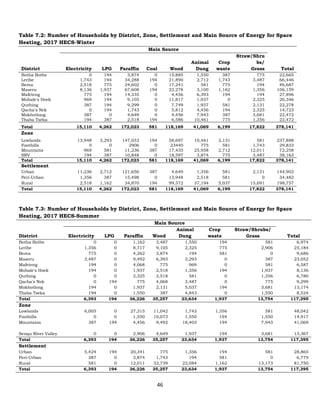
Table 7.2: Number of Households by District, Zone, Settlement and Main Source of Energy for Space
Heating, 2017 HECS-Winter....................................................................................................................46
Table 7.3: Number of Households by District, Zone, Settlement and Main Source of Energy for Space
Heating, 2017 HECS-Summer..................................................................................................................46
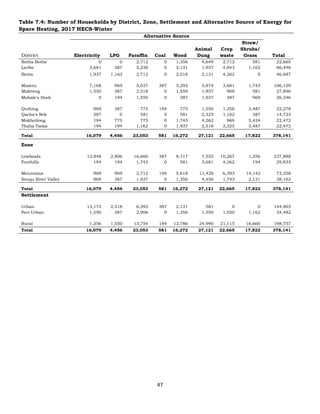
Table 7.4: Number of Households by District, Zone, Settlement and Alternative Source of Energy for
Space Heating, 2017 HECS-Winter..........................................................................................................47
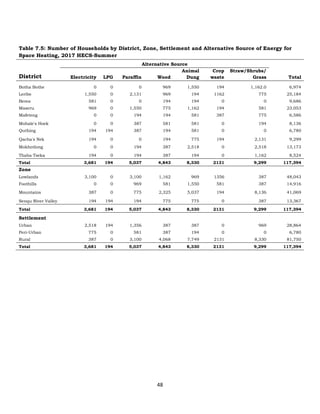
Table 7.5: Number of Households by District, Zone, Settlement and Alternative Source of Energy for
Space Heating, 2017 HECS-Summer .......................................................................................................48
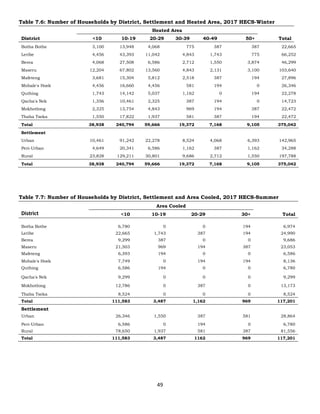
Table 7.6: Number of Households by District, Settlement and Heated Area, 2017 HECS-Winter .........49
Table 7.7: Number of Households by District, Settlement and Area Cooled, 2017 HECS-Summer .......49
8.
vii
Table 7.8: Numberof Households by District, Zone, Settlement and Main Source of Energy for Water
Heating, 2017 HECS-Winter....................................................................................................................50
Table 7.9: Number of Households by District, Zone, Settlement and Main Source of Energy for Water
Heating, 2017 HECS-Summer..................................................................................................................51
Table 7.10: Number of Households by District, Zone, Settlement and Alternative Source of Energy for
Water Heating, 2017 HECS-Winter.........................................................................................................52
Table 7.11: Number of Households by District, Zone, Settlement and Alternative Source of Energy for
Water Heating, 2017 HECS -Summer......................................................................................................53
Table7.12: Number of Households by Main Source of Energy for Space Heating and Household
Earnings, 2017 HECS-Winter...................................................................................................................54
Table7.13: Number of Households by Main Source of Energy for Space Heating and Household
Earnings, 2017 HECS- Summer................................................................................................................54
Section 8: Lighting............................................................................................................................55
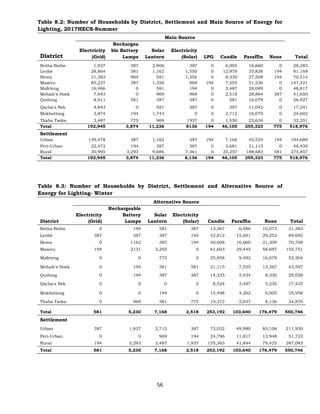
Table 8.1: Number of Households by District, Settlement and Main Source of Energy for Lighting, 2017
HECS-Winter............................................................................................................................................55
Table 8.2: Number of Households by District, Settlement and Main Source of Energy for Lighting,
2017HECS-Summer.................................................................................................................................56
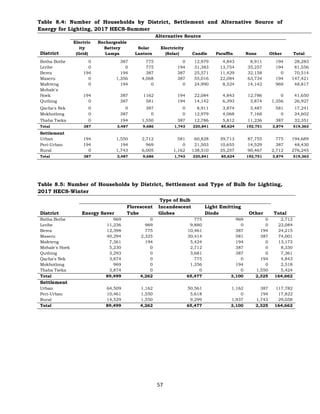
Table 8.3: Number of Households by District, Settlement and Alternative Source of Energy for
Lighting- Winter ......................................................................................................................................56
Table 8.4: Number of Households by District, Settlement and Alternative Source of Energy for
Lighting, 2017 HECS-Summer .................................................................................................................57
Table 8.5: Number of Households by District, Settlement and Type of Bulb for Lighting, 2017 HECS-
Winter .....................................................................................................................................................57
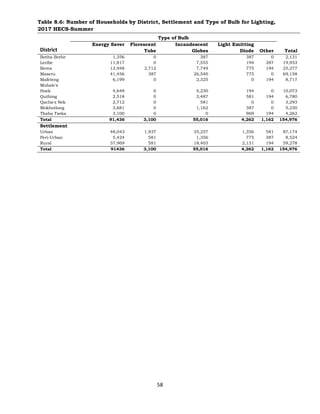
Table 8.6: Number of Households by District, Settlement and Type of Bulb for Lighting, 2017 HECS-
Summer...................................................................................................................................................58
Section 9: Household use of Solar Water Heaters and Generators .....................................................59
Table 9.1: Number of Solar Heating Systems by Litres, Area, Production and Capacity, 2017 HECS-
Summer...................................................................................................................................................59
Table 9.2: Number of Households by Ownership of Solar Water Heating System and a Solar PV
system, 2017 HECS-Summer...................................................................................................................59
9.
viii
Table 9.3: Numberof Households by Ownership of a Solar Water Heater and Connection to Grid
Electricity- HECS 2017.............................................................................................................................60
Table 9.4: Number of Households Owning a Functional Generator by Household Earnings and
Settlement, 2017 HECS ...........................................................................................................................60
Table 9.5: Cost (maloti)and Type of Fuel Used in Generators by District, HECS 2017 ...........................60
Table 9.6: Generator Brand by Mean Capacity (kVA), 2017 HECS.........................................................61
Section 10: Other Energy Sources and Preferences............................................................................62
Table 10.1: Number of Households by Source of Energy Used and Season, 2017 HECS.......................62
Table 10.2: Number of Households by Method of Acquisition and Energy Source, 2017 HECS-Winter62
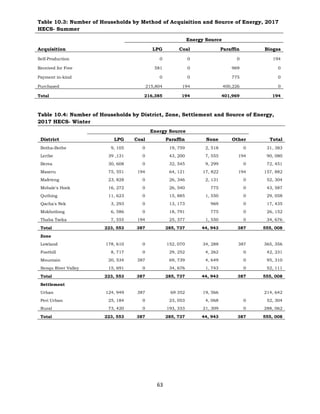
Table 10.3: Number of Households by Method of Acquisition and Source of Energy, 2017 HECS-
Summer...................................................................................................................................................63
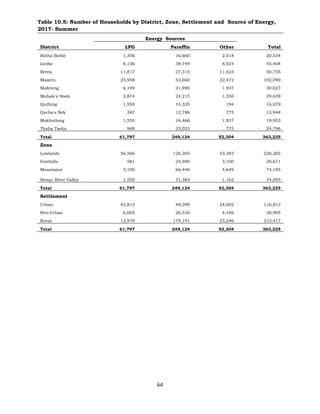
Table 10.4: Number of Households by District, Zone, Settlement and Source of Energy, 2017 HECS-
Winter .....................................................................................................................................................63
Table 10.5: Number of Households by District, Zone, Settlement and Source of Energy, 2017-
Summer...................................................................................................................................................64
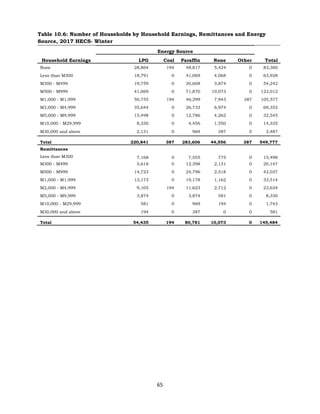
Table 10.6: Number of Households by Household Earnings, Remittances and Energy Source, 2017
HECS- Winter...........................................................................................................................................65
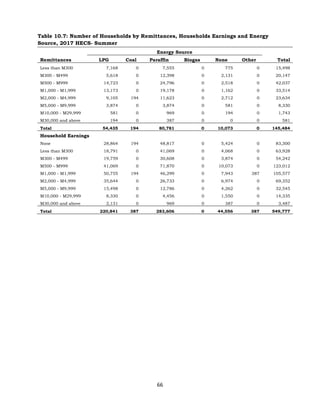
Table 10.7: Number of Households by Remittances, Households Earnings and Energy Source, 2017
HECS- Summer ........................................................................................................................................66
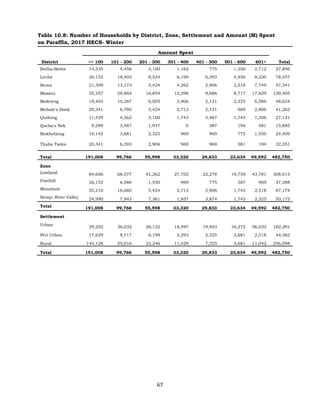
Table 10.8: Number of Households by District, Zone, Settlement and Amount (M) Spent on Paraffin,
2017 HECS- Winter..................................................................................................................................67
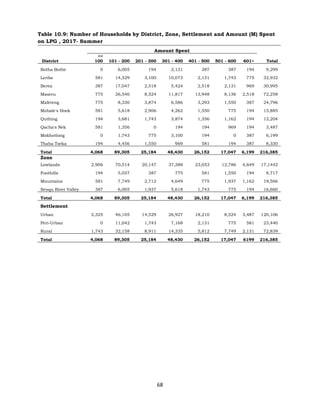
Table 10.9: Number of Households by District, Zone, Settlement and Amount (M) Spent on LPG ,
2017- Summer.........................................................................................................................................68
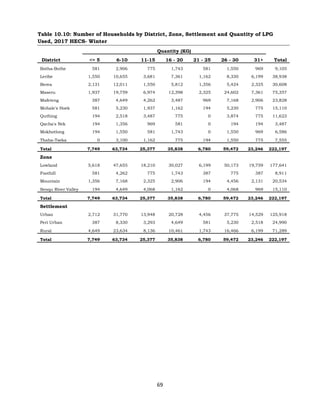
Table 10.10: Number of Households by District, Zone, Settlement and Quantity of LPG Used, 2017
HECS- Winter...........................................................................................................................................69
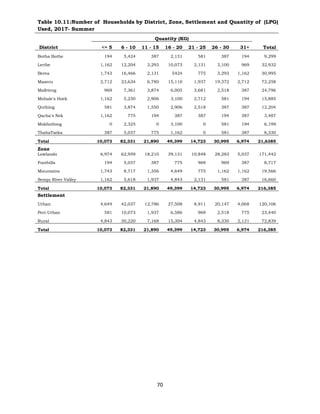
Table 10.11:Number of Households by District, Zone, Settlement and Quantity of (LPG) Used, 2017-
Summer...................................................................................................................................................70
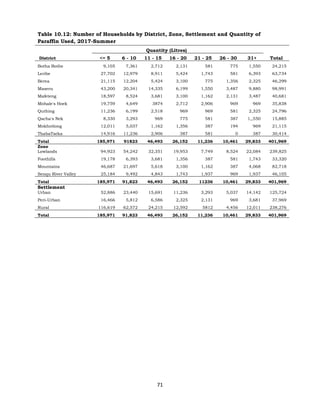
Table 10.12: Number of Households by District, Zone, Settlement and Quantity of Paraffin Used, 2017-
Summer...................................................................................................................................................71
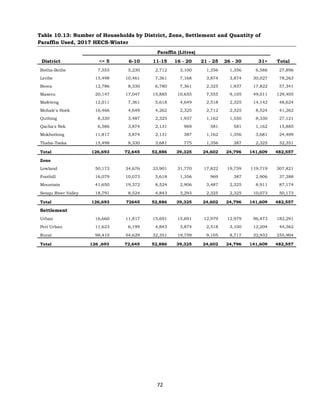
Table 10.13: Number of Households by District, Zone, Settlement and Quantity of Paraffin Used, 2017
HECS-Winter............................................................................................................................................72
10.
ix
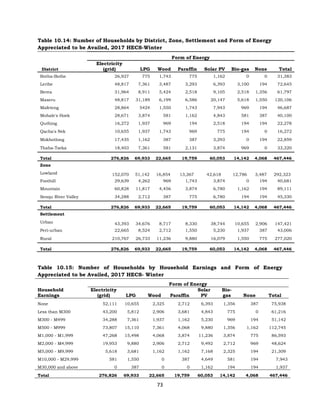
Table 10.14: Numberof Households by District, Zone, Settlement and Form of Energy Appreciated to
be Availed, 2017 HECS-Winter................................................................................................................73
Table 10.15: Number of Households by Household Earnings and Form of Energy Appreciated to be
Availed, 2017 HECS- Winter....................................................................................................................73
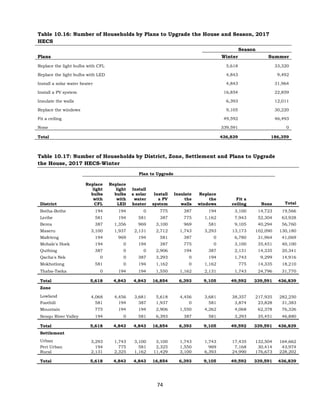
Table 10.16: Number of Households by Plans to Upgrade the House and Season, 2017 HECS.............74
Table 10.17: Number of Households by District, Zone, Settlement and Plans to Upgrade the House,
2017 HECS-Winter...................................................................................................................................74
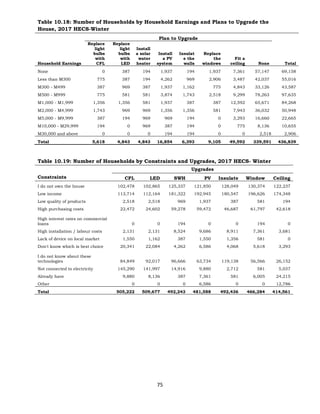
Table 10.18: Number of Households by Household Earnings and Plans to Upgrade the House, 2017
HECS-Winter............................................................................................................................................75
Table 10.19: Number of Households by Constraints and Upgrades, 2017 HECS- Winter......................75
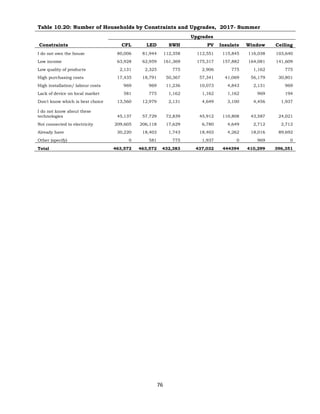
Table 10.20: Number of Households by Constraints and Upgrades, 2017- Summer............................76
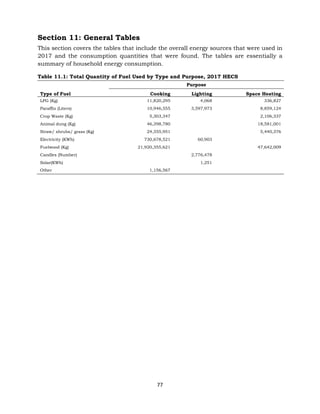
Section 11: General Tables ...............................................................................................................77
Table 11.1: Total Quantity of Fuel Used by Type and Purpose, 2017 HECS ...........................................77
11.
1
Introduction
Household Energy ConsumptionSurvey (HECS) provides a picture of energy consumption in
Lesotho for 2017. It was conducted in two phases consisting of two seasons; winter and summer.
The winter season spanned four months starting from April to July and summer from August to
November. The same households were selected and interviewed in both seasons.
This compendium complements the 2017 HECS analytical report. It includes detailed data in form
of tables for all energy sources used in households. The report consists of tables on use of Biomass,
Electricity, Petroleum products and Solar Photovoltaic systems. Tables on different uses of energy
sources such as space and water heating, lighting and cooking are also included.
The report consists of the following sections:
• Housing Characteristics
• Biomass
• Electricity
• Energy Sources by Sex of household head
• Petroleum Products
• Cooking
• Space and Water Heating
• Lighting
• Solar Photovoltaic System
• Other Energy Sources and Preferences
• General Tables
12.
2
Section 1: HousingCharacteristics
In many parts of Africa, lack of affordability and insufficient supply of titled land make housing
developments a solution restricted mostly to the middle classes, Infrastructure in Africa, 2017. It is
further stated that construction costs are very high, especially in land locked countries like Lesotho.
Cement, iron and other materials are imported and costly to transport, making housing
unaffordable.
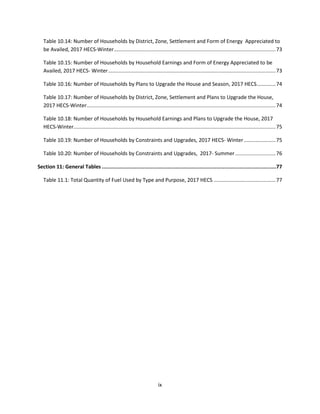
Table 1.1: Total Usable Area by Type of House and Season
Type of House
Usable Area (M2)
Summer Winter
Rontable 3,872,528.50 4,028,633
Heisi 615,829.92 679,113
Polata 8,397,874.31 8,833,098
Malaene 1,840,413.78 2,428,949
Optaka 3,008,631.04 3,423,813
Apartment 235,832.71 269,621
Bungalow 3,406,000.46 3,304,387
Mokhukhu 461,572.90 476,329
Table 1.2: Number of Houses Connected to Electricity by Type of House and Electrification Method,
2017 HECS
Type of
House
Electrification Method
Individual Scheme Government Other Total
Rontabole 581 2,906 2,712 0 6,199
Heisi 775 581 775 0 2,131
Polata 35,451 20,147 10,848 2,518 68,964
Malaene 53,854 1,356 1,743 194 57,147
Optaka 18,210 3,293 4,068 387 25,958
Apartment 2,712 194 194 194 3,293
Mansion 969 194 0 0 1,162
Bungalow 18,016 6,199 2,906 0 27,121
Mokhukhu 2,518 194 969 0 3,681
Total 133,086 35,064 24,215 3,293 195,656
13.
3
Section 2: Biomass
Lesotho’senergy balance is dominated by biomass energy, which contributes 66.0 percent to the
energy mix. The overwhelming reliance of rural households on biomass fuels places tremendous
pressure on this forest resource. The percentage of households in Lesotho with access to energy
efficient stoves is growing and an estimated 2,900 stoves are in operation in the country, however
this reliance on biomass is not sustainable.
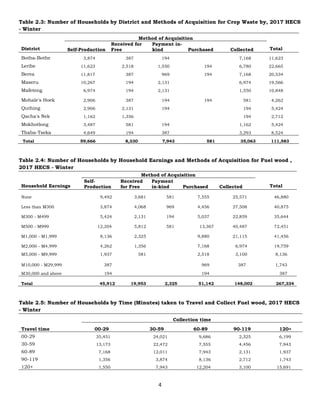
Table 2.1: Number of Households by Method of Acquisition and Type of Biomass, 2017 HECS - Winter
Method of
acquisition
Biomass
Charcoal
Fuel
wood
Wood
waste
Wood
chips
Wood
pellets
Crop
waste
Animal
waste Aloe Shrubs
Self-Production 45,912 387 194 194 59,666 56,566 1,743 1,550
Received for
Free 19,953 194 387 387 8,330 7,361 194 1,356
Payment in-kind 2,325 3,293 7,943 387 194
Purchased 969 51,142 3,874 387 581 775 3,100
Collected 148,002 553,264 1,550 387 35,063 81,362 12,979 78,650
Table 2.2: Number of Households by District and Methods of Acquisition for Fuel wood, 2017 HECS -
Winter
District
Method of Acquisition
Total
Self-
Production
Received for
Free
Payment
in-kind Purchased Collected
Botha-Bothe 6,199 2,131 387 6,005 11,817 26,540
Leribe 12,204 3,100 14,335 22,472 52,111
Berea 7,168 4,262 969 11,623 13,754 37,775
Maseru 6,393 2,712 581 7,361 33,707 50,755
Mafeteng 6,199 2,325 3,100 9,686 21,309
Mohale's Hoek 1,550 1,743 194 2,325 18,403 24,215
Quthing 2,131 387 194 1,937 11,623 16,272
Qacha's Nek 387 581 969 6,586 8,524
Mokhotlong 1,743 1,743 775 4,456 8,717
Thaba-Tseka 1,937 969 2,712 15,498 21,115
Total 45,912 19,953 2,325 51,142 148,002 267,334
14.
4
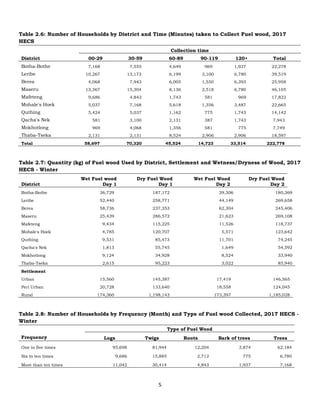
Table 2.3: Numberof Households by District and Methods of Acquisition for Crop Waste by, 2017 HECS
- Winter
District
Method of Acquisition
Total
Self-Production
Received for
Free
Payment in-
kind Purchased Collected
Botha-Bothe 3,874 387 194 7,168 11,623
Leribe 11,623 2,518 1,550 194 6,780 22,665
Berea 11,817 387 969 194 7,168 20,534
Maseru 10,267 194 2,131 6,974 19,566
Mafeteng 6,974 194 2,131 1,550 10,848
Mohale's Hoek 2,906 387 194 194 581 4,262
Quthing 2,906 2,131 194 194 5,424
Qacha's Nek 1,162 1,356 194 2,712
Mokhotlong 3,487 581 194 1,162 5,424
Thaba-Tseka 4,649 194 387 3,293 8,524
Total 59,666 8,330 7,943 581 35,063 111,583
Table 2.4: Number of Households by Household Earnings and Methods of Acquisition for Fuel wood ,
2017 HECS - Winter
Household Earnings
Method of Acquisition
Total
Self-
Production
Received
for Free
Payment
in-kind Purchased Collected
None 9,492 3,681 581 7,555 25,571 46,880
Less than M300 3,874 4,068 969 4,456 27,508 40,875
M300 - M499 5,424 2,131 194 5,037 22,859 35,644
M500 - M999 12,204 5,812 581 13,367 40,487 72,451
M1,000 - M1,999 8,136 2,325 9,880 21,115 41,456
M2,000 - M4,999 4,262 1,356 7,168 6,974 19,759
M5,000 - M9,999 1,937 581 2,518 3,100 8,136
M10,000 - M29,999 387 969 387 1,743
M30,000 and above 194 194 387
Total 45,912 19,953 2,325 51,142 148,002 267,334
Table 2.5: Number of Households by Time (Minutes) taken to Travel and Collect Fuel wood, 2017 HECS
- Winter
Travel time
Collection time
00-29 30-59 60-89 90-119 120+
00-29 35,451 24,021 9,686 2,325 6,199
30-59 13,173 22,472 7,555 4,456 7,943
60-89 7,168 12,011 7,943 2,131 1,937
90-119 1,356 3,874 8,136 2,712 1,743
120+ 1,550 7,943 12,204 3,100 15,691
15.
5
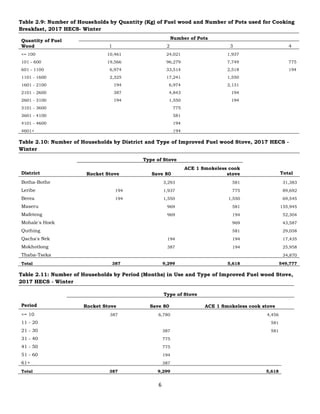
Table 2.6: Numberof Households by District and Time (Minutes) taken to Collect Fuel wood, 2017
HECS
District
Collection time
00-29 30-59 60-89 90-119 120+ Total
Botha-Bothe 7,168 7,555 4,649 969 1,937 22,278
Leribe 10,267 13,173 6,199 3,100 6,780 39,519
Berea 4,068 7,943 6,005 1,550 6,393 25,958
Maseru 13,367 15,304 8,136 2,518 6,780 46,105
Mafeteng 9,686 4,843 1,743 581 969 17,822
Mohale's Hoek 5,037 7,168 5,618 1,356 3,487 22,665
Quthing 5,424 5,037 1,162 775 1,743 14,142
Qacha's Nek 581 3,100 2,131 387 1,743 7,943
Mokhotlong 969 4,068 1,356 581 775 7,749
Thaba-Tseka 2,131 2,131 8,524 2,906 2,906 18,597
Total 58,697 70,320 45,524 14,723 33,514 222,778
Table 2.7: Quantity (kg) of Fuel wood Used by District, Settlement and Wetness/Dryness of Wood, 2017
HECS - Winter
District
Wet Fuel wood
Day 1
Dry Fuel Wood
Day 1
Wet Fuel Wood
Day 2
Dry Fuel Wood
Day 2
Botha-Bothe 36,729 187,172 39,306 180,369
Leribe 52,440 258,771 44,149 269,658
Berea 58,736 237,353 62,304 245,406
Maseru 25,439 286,572 21,623 269,108
Mafeteng 9,434 115,225 11,526 118,737
Mohale's Hoek 4,785 120,707 5,571 123,642
Quthing 9,531 85,473 11,701 74,245
Qacha's Nek 1,813 55,745 1,649 54,592
Mokhotlong 9,124 34,928 8,524 33,940
Thaba-Tseka 2,615 95,223 3,022 85,940
Settlement
Urban 15,560 145,387 17,419 146,565
Peri Urban 20,728 133,640 18,558 124,045
Rural 174,360 1,198,143 173,397 1,185,028
Table 2.8: Number of Households by Frequency (Month) and Type of Fuel wood Collected, 2017 HECS -
Winter
Frequency
Type of Fuel Wood
Logs Twigs Roots Bark of trees Trees
One to five times 95,698 81,944 12,204 3,874 62,184
Six to ten times 9,686 15,885 2,712 775 6,780
More than ten times 11,042 30,414 4,843 1,937 7,168
16.
6
Table 2.9: Numberof Households by Quantity (Kg) of Fuel wood and Number of Pots used for Cooking
Breakfast, 2017 HECS- Winter
Quantity of Fuel
Wood
Number of Pots
1 2 3 4
<= 100 10,461 24,021 1,937
101 - 600 19,566 96,279 7,749 775
601 - 1100 6,974 33,514 2,518 194
1101 - 1600 2,325 17,241 1,550
1601 - 2100 194 6,974 2,131
2101 - 2600 387 4,843 194
2601 - 3100 194 1,550 194
3101 - 3600 775
3601 - 4100 581
4101 - 4600 194
4601+ 194
Table 2.10: Number of Households by District and Type of Improved Fuel wood Stove, 2017 HECS -
Winter
District
Type of Stove
Total
Rocket Stove Save 80
ACE 1 Smokeless cook
stove
Botha-Bothe 3,293 581 31,383
Leribe 194 1,937 775 89,692
Berea 194 1,550 1,550 69,545
Maseru 969 581 155,945
Mafeteng 969 194 52,304
Mohale's Hoek 969 43,587
Quthing 581 29,058
Qacha's Nek 194 194 17,435
Mokhotlong 387 194 25,958
Thaba-Tseka 34,870
Total 387 9,299 5,618 549,777
Table 2.11: Number of Households by Period (Months) in Use and Type of Improved Fuel wood Stove,
2017 HECS - Winter
Period
Type of Stove
Rocket Stove Save 80 ACE 1 Smokeless cook stove
<= 10 387 6,780 4,456
11 - 20 581
21 - 30 387 581
31 - 40 775
41 - 50 775
51 - 60 194
61+ 387
Total 387 9,299 5,618
17.
7
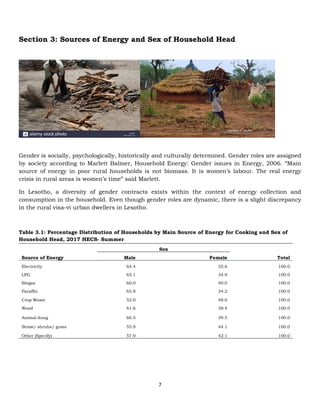
Section 3: Sourcesof Energy and Sex of Household Head
Gender is socially, psychologically, historically and culturally determined. Gender roles are assigned
by society according to Marlett Balmer, Household Energy: Gender issues in Energy, 2006. “Main
source of energy in poor rural households is not biomass. It is women’s labour. The real energy
crisis in rural areas is women’s time” said Marlett.
In Lesotho, a diversity of gender contracts exists within the context of energy collection and
consumption in the household. Even though gender roles are dynamic, there is a slight discrepancy
in the rural visa-vi urban dwellers in Lesotho.
Table 3.1: Percentage Distribution of Households by Main Source of Energy for Cooking and Sex of
Household Head, 2017 HECS- Summer
Source of Energy
Sex
Male Female Total
Electricity 64.4 35.6 100.0
LPG 65.1 34.9 100.0
Biogas 60.0 40.0 100.0
Paraffin 65.8 34.2 100.0
Crop Waste 52.0 48.0 100.0
Wood 61.6 38.4 100.0
Animal dung 60.5 39.5 100.0
Straw/ shrubs/ grass 55.9 44.1 100.0
Other (Specify) 57.9 42.1 100.0
18.
8
Table 3.2: PercentageDistribution of Households by Main Source of Energy for Space Heating and Sex
of Household Head, 2017 HECS
Source of Energy
Sex
Male Female Total
Electricity 60.6 39.4 100.0
LPG 100.0 0.0 100.0
Paraffin 67.9 32.1 100.0
Wood 59.3 40.7 100.0
Animal Dung 51.6 48.4 100.0
Crop Waste 50.0 50.0 100.0
Straw/ shrubs/ grass 53.5 46.5 100.0
Table 3.3: Percentage Distribution of Household Head by Main Source of Energy for Lighting and Sex of
Household Head, 2017 HECS
Source of Energy
Sex
Male Female Total
Electricity (Grid) 65.3 34.7 100.0
Electricity (Generator) 100.0 0.0 100.0
Electricity (Battery) 0.0 100.0 100.0
Rechargeable Battery Lamps 65.0 35.0 100.0
Solar Lantern 62.1 37.9 100.0
Electricity (Solar) 81.0 19.0 100.0
LPG 0.0 100.0 100.0
Candle 63.9 36.1 100.0
Paraffin 59.4 40.6 100.0
None 75.0 25.0 100.0
Table 3.4: Percentage Distribution of Households by Time Taken to Travel and Collect Fuelwood and
Sex of Household Head, 2017 HECS
Sex
Time Taken Male Female Total
Travel Time
00-29 59.7 40.3 100.0
30-59 65.0 35.0 100.0
60-89 62.3 37.7 100.0
90-119 72.0 28.0 100.0
120+ 54.8 45.2 100.0
Collection Time
00-29 61.8 38.2 100.0
30-59 60.5 39.5 100.0
60-89 61.0 39.0 100.0
90-119 61.7 38.3 100.0
120+ 66.7 33.3 100.0
19.
9
Table 3.5: PercentageDistribution of Households by Biomass and Sex of Household Head, 2017 HECS
Sex
Biomass Male Female Total
Charcoal 100.0 0.0 100.0
Fuelwood 61.3 38.7 100.0
Woodwaste 60.0 40.0 100.0
Woodchips 50.0 50.0 100.0
Wood pellets 60.0 40.0 100.0
Crop waste 56.5 43.5 100.0
Animal waste 59.3 40.7 100.0
Aloe 44.3 55.7 100.0
Shrubs 60.6 39.4 100.0
Other 60.0 40.0 100.0
Table 3.6: Percentage Distribution of Households by Electricity Connection and Sex of Household
Head, 2017 HECS
Sex
Electricity Connection Male Female
Off-grid 70.3 29.7
Grid Electricity 64.9 35.1
Table 3.7: Percentage Distribution of Households by Other Energy Sources and Sex of Household Head,
2017 HECS
Sex
Energy Sources Male Female Total
LPG 65.3 34.7 100.0
Coal 100.0 0.0 100.0
Paraffin 61.4 38.6 100.0
Biogas 0.0 100.0 100.0
Other 65.6 34.4 100.0
20.
10
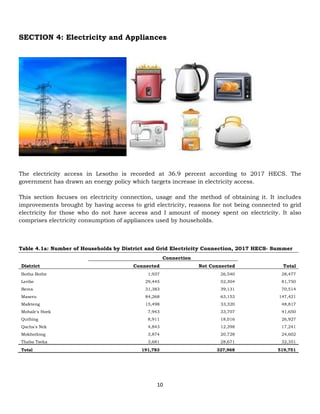
SECTION 4: Electricityand Appliances
The electricity access in Lesotho is recorded at 36.9 percent according to 2017 HECS. The
government has drawn an energy policy which targets increase in electricity access.
This section focuses on electricity connection, usage and the method of obtaining it. It includes
improvements brought by having access to grid electricity, reasons for not being connected to grid
electricity for those who do not have access and I amount of money spent on electricity. It also
comprises electricity consumption of appliances used by households.
Table 4.1a: Number of Households by District and Grid Electricity Connection, 2017 HECS- Summer
District
Connection
Total
Connected Not Connected
Botha Bothe 1,937 26,540 28,477
Leribe 29,445 52,304 81,750
Berea 31,383 39,131 70,514
Maseru 84,268 63,153 147,421
Mafeteng 15,498 33,320 48,817
Mohale's Hoek 7,943 33,707 41,650
Quthing 8,911 18,016 26,927
Qacha's Nek 4,843 12,398 17,241
Mokhotlong 3,874 20,728 24,602
Thaba Tseka 3,681 28,671 32,351
Total 191,783 327,968 519,751
21.
11
Table 4.1b: Numberof Households by Ecological Zone and Grid Electricity Connection, 2017 HECS-
Summer
Ecological Zone
Connection
Total
Connected Not Connected
Lowlands 167,568 173,767 341,335
Foothills 2,518 35,451 37,969
Mountains 13,754 77,294 91,048
Senqu River Valley 7,943 41,456 49,399
Total 191,783 327,968 519,751
Table 4.1c: Number of Households Connected to Grid Electricity by Settlement, 2017 HECS- Summer
Settlement
Connection
Total
Connected Not Connected
Urban 138,897 55,791 194,689
Peri-Urban 21,309 27,121 48,430
Rural 31,576 245,056 276,632
Total 191,783 327,968 519,751
Table: 4.2: Number of Households with Access to Grid Electricity by Sex, 2017 HECS- Summer
Sex
Connection
Total
Connected Not Connected
Male 124,562 200,113 324,675
Female 67,221 127,855 195,076
Total 191,783 327,968 519,751
22.
12
Table 4.3: Numberof Households using Grid electricity by District, Ecological Zone and Settlement,
2017 HECS- Summer
District
Usage
Total
Used Did Not Use
Botha Bothe 1,937 26,540 28,477
Leribe 29,445 52,304 81,750
Berea 31,576 38,938 70,514
Maseru 85,624 61,797 147,421
Mafeteng 16,466 32,351 48,817
Mohale's Hoek 8,136 33,514 41,650
Quthing 8,911 18,016 26,927
Qacha's Nek 4,843 12,398 17,241
Mokhotlong 3,874 20,728 24,602
Thaba Tseka 3,874 28,477 32,351
Total 194,689 325,062 519,751
Zone
Lowlands 170,474 170,861 341,335
Foothills 2,325 35,644 37,969
Mountains 13,948 77,101 91,048
Senqu River Valley 7,943 41,456 49,399
Total 194,689 325,062 519,751
Settlement
Urban 140,641 54,048 194,689
Peri-Urban 22,859 25,571 48,430
Rural 31,189 245,443 276,632
Total 194,689 325,062 519,751
23.
13
Table 4.4: Numberof Households by Districts, Zones, Settlement, Connection and Usage of Grid
Electricity, 2017 HECS-Summer
District
Connected Not connected
Total
Using Not using Total Using Not using
Botha Bothe 1,937 0 1,937 0 26,540 26,540
Leribe
29,252 194 29,445 194 52,111 52,304
Berea
31,189 194 31,383 387 38,744 39,131
Maseru
83,881 387 84,268 1743 61,409 63,153
Mafeteng
15,498 0 15,498 969 32,351 33,320
Mohale's Hoek
7,943 0 7,943 194 33,514 33,707
Quthing
8,911 0 8,911 0 18,016 18,016
Qacha's Nek
4,843 0 4,843 0 12,398 12,398
Mokhotlong
3,874 0 3,874 0 20,728 20,728
Thaba Tseka
3,681 0 3,681 194 28,477 28,671
Total 191,008 775 191,783 3681 324,287 327,968
Ecological zone
Lowlands 166,987 581 167,568 3487 170,280 173,767
Foothills 2,325 194 2,518 0 35,451 35,451
Mountains 13,754 0 13,754 194 77,101 77,294
Senqu River Valley 7,943 0 7,943 0 41,456 41,456
Total 191,008 775 191,783 3681 324,287 327,968
Settlement
Urban 138,704 194 138,897 1937 53,854 55,791
Peri-Urban 21,309 0 21,309 1550 25,571 27,121
Rural 30,995 581 31,576 194 244,862 245,056
Total 191,008 775 191,783 3681 324,287 327,968
Table 4.5: Number of Households by Method of Electricity Acquisition, 2017 HECS- Summer
Method of Acquisition Number of Households
Received for free 775
Payment in-kind 194
Purchased 193,720
Total 194,689
24.
14
Table 4.6a: Numberof Households by District and Amount Spent (Maloti) on Electricity, 2017 HECS-
Summer
District
Amount Spent
Less than
M500.00
M500.00 -
M999.99
M1,000.00 -
M1,499.99
M1,500.00 -
M1,999.99
M2,000.00 -
M2,499.99 M2,500.00+ Total
Botha Bothe 1,743 194 0 0 0 0 1,937
Leribe 24,990 3,874 194 387 0 0 29,445
Berea 23,053 4,843 2,518 969 0 194 31,576
Maseru 64,315 12,592 3,293 3,487 1,743 194 85,624
Mafeteng 13,367 2,518 387 0 194 0 16,466
Mohale's Hoek 7,555 581 0 0 0 0 8,136
Quthing 7,168 1,356 194 0 0 194 8,911
Qacha's Nek 4,262 581 0 0 0 0 4,843
Mokhotlong 3,487 0 194 0 0 194 3,874
Thaba-Tseka 3,681 194 0 0 0 0 3,874
Total 153,620 26,733 6,780 4,843 1,937 775 194,689
Table 4.6b: Number of Households by Amount Spent (Maloti) on Electricity and Zone, 2017 HECS-
Summer
Ecological Zone
Amount Spent Lowlands Foothills Mountains Senqu River Valley Total
Less than M500.00 132,311 2,325 12,786 6,199 153,620
M500.00 - M999.99 24,602 0 775 1,356 26,733
M1,000.00 - M1,499.99 6,393 0 194 194 6,780
M1,500.00 - M1,999.99 4,843 0 0 0 4,843
M2,000.00 - M2,499.99 1,937 0 0 0 1,937
M2,500.00+ 387 0 194 194 775
Total 170,474 2,325 13,948 7,943 194,689
Table 4.6c Number of Households by Amount Spent (Maloti) on Electricity and Settlement, 2017 HECS-
Summer
Amount Spent
Settlement
Total
Urban Peri-Urban Rural
Less than M500.00 105,965 18,597 29,058 153,620
M500.00 - M999.99 20,922 3,874 1,937 26,733
M1,000.00 - M1,499.99 6,586 0 194 6,780
M1,500.00 - M1,999.99 4,456 387 0 4,843
M2,000.00 - M2,499.99 1,937 0 0 1,937
M2,500.00+ 775 0 0 775
Total 140,641 22,859 31,189 194,689
25.
15
Table 4.6d: Numberof Households by Amount Spent (Maloti) on Electricity and Season, 2017 HECS
Amount Spent
Season
Winter Summer
Less than M500 137,541 153,620
M500 - M999 42,425 26,733
M1,000 - M1,499 9,686 6,780
M1,500 - M1,999 5,812 4,843
M2,000 - M2,499 3,100 1,937
M2,500+ 4,068 775
Total 202,631 194,689
Table 4.7: Number of Households by Type of House and Amount Spent on Electricity, 2017 HECS-
Summer
Type of House
Amount Spent
Total
Less than
M500
M500 -
M999
M1,000 -
M1,499
M1,500 -
M1,999
M2,000 -
M2,499 M2,500+
Rontabole 1,550 194 0 0 0 0 1,743
Heisi 581 194 0 0 0 0 775
Polata 22,665 5,037 1,162 194 0 0 29,058
Malaene 22,665 4,649 1,743 1,162 387 194 30,801
Optaka 7,361 775 581 194 194 194 9,299
Apartment/town house 1,356 194 194 0 0 0 1,743
Mansion 969 387 0 194 0 0 1,550
Bungalow 9,880 1,550 775 1,356 581 0 14,142
Mok'huk'hu/ temporary
structure 1,550 0 0 0 0 0 1,550
Total 68,189 12,979 4,456 3,100 1,162 387 90,274
Table 4.8: Number of Households Connected to Grid Electricity by Main Reason for not using and
Settlement, 2017 HECS
Main Reason
Settlement
Total
Urban Peri-Urban Rural
Expensive 194 0 387 581
Disconnected 0 0 194 194
Total 194 0 581 775
26.
16
Table 4.9a: Numberof Households Connected to Grid Electricity by District and Years of Connection,
2017 HECS- Summer
District
Years of Connection
Total
Less than a Year 1 - 10 11 - 20 21 - 30 31+
Botha Bothe 775 1,162 0 0 0 1,937
Leribe 3,100 23,053 2,518 581 194 29,445
Berea 5,037 19,372 5,037 1,937 194 31,576
Maseru 6,780 65,865 9,299 3,100 581 85,624
Mafeteng 1,743 11,042 2,906 775 0 16,466
Mohale's Hoek 1,162 6,005 581 194 194 8,136
Quthing 387 7,555 969 0 0 8,911
Qacha's Nek 2,518 2,325 0 0 0 4,843
Mokhotlong 387 3,487 0 0 0 3,874
Thaba Tseka 1,356 2,325 194 0 0 3,874
Total 23,246 142,190 21,503 6,586 1,162 194,689
Table 4.9b: Number of Households Connected to Grid electricity by Ecological Zone and Years of
Connection, 2017 HECS-Summer
Ecological Zone
Years of Connection
Total
Less than a year 1 - 10 11 - 20 21 - 30 31+
Lowlands 18,403 123,981 20,341 6,586 1,162 170,474
Foothills 194 2,131 0 0 0 2,325
Mountains 4,262 9,492 194 0 0 13,948
Senqu River Valley 387 6,586 969 0 0 7,943
Total 23,246 142,190 21,503 6,586 1,162 194,689
Table 4.9c: Number of Households Connected to Grid electricity by Settlement and Years of
Connection, 2017 HECS-Summer
Settlement
Years of Connection
Total
Less than a year 1 - 10 11 - 20 21 - 30 31+
Urban 17,822 98,216 17,629 5,812 1,162 140,641
Peri-Urban 3,681 16,466 1,937 775 0 22,859
Rural 1,743 27,508 1,937 0 0 31,189
Total 23,246 142,190 21,503 6,586 1,162 194,689
27.
17
Table 4.10: Numberof Households by Uses of Electricity and Years of Connection to Grid electricity,
2017 HECS-Summer
Uses of Electricity
Years of Connection
Total
Less than a year 1 - 10 11 - 20 21 - 30 31+
Cooking/Re-Heating 8,911 73,614 13,367 3,487 775 100,153
Entertainment (e.g. Radio, TV 12,011 112,358 18,791 6,005 1,162 150,327
Washing 0 2,325 775 387 194 3,681
Lighting 23,053 141,609 21,503 6,393 1,162 193,720
Ironing 8,911 87,368 17,822 5,618 1,162 120,881
Dishwashing 0 0 194 0 0 194
Sewing 387 581 969 0 0 1,937
Air-conditioning 194 969 581 0 0 1,743
Computer Powering 969 5,424 3,487 775 194 10,848
Water Pumping 0 194 387 0 0 581
Refrigeration 7,943 77,682 17,241 6,199 969 110,033
Charging 19,953 119,138 18,597 5,618 969 164,275
Space Heating 0 3,681 1,162 194 0 5,037
Water Heating 11,042 88,336 16,079 5,230 969 121,656
Workshop (welding, carpentry, etc) 0 387 0 194 0 581
Other 0 775 0 0 0 775
Total 23,246 142,190 21,503 6,586 1,162 194,689
Table 4.11: Number of Households by Uses Electricity and Settlement, 2017 HECS- Summer
Uses of Electricity
Settlement
Total
Urban Peri-Urban Rural
Cooking/Re-Heating 77,682 9,299 13,173 100,153
Entertainment (e.g. Radio, TV 111,970 16,079 22,278 150,327
Washing 2,518 387 775 3,681
Lighting 139,866 22,665 31,189 193,720
Ironing 97,635 9,880 13,367 120,881
Dishwashing 194 0 0 194
Sewing 1,743 0 194 1,937
Air-conditioning 1,743 0 0 1,743
Computer Powering 9,880 194 775 10,848
Water Pumping 194 194 194 581
Refrigeration 86,980 10,267 12,786 110,033
Charging 121,075 17,241 25,958 164,275
Space Heating 3,681 775 581 5,037
Water Heating 95,698 10,655 15,304 121,656
Workshop (welding, carpentry, etc) 581 0 0 581
Other 581 0 194 775
Total 140,641 22,859 31,189 194,689
25
Table 4.20: Totaland Average Electricity Consumption of Appliances per day in KWh, 2017
HECS-Summer
Appliance Total Consumption Average Consumption
Refrigerator 526,627.37 4.69
Electrical Geyser 171,928.44 15.04
Chest/Deep Freezer 19,192.23 6.60
Electric stove 281,519.55 3.20
Electric Heater 25,521.96 3.56
Washing Machine 5,757.10 1.29
Dishwasher 1,782.22 9.20
Hoover 108.16 0.14
Hair Dryer 6,900.14 0.56
Television 94128.19 0.66
Desktop Computer 2,362.32 0.61
Laptop 4,302.91 0.27
Air Conditioner 1,879.08 1.39
Iron 58,159.86 0.48
Electric kettle/element 97,280.05 0.84
Bread Maker 9,937.84 2.44
Toaster 3,325.37 0.24
Microwave 20,862.77 0.33
Electrical Pot 3,505.69 1.13
Electrical Hair Clipper 122.95 0.01
Other 12,594.61 0.39
Total 1,347,798.81
Table 4.21: Number of Households not Connected to Grid Electricity by Reasons and
Settlement, 2017 HECS- Summer
Reason
Settlement
Total
Urban Peri-Urban Rural
Lack of funds for wiring 13,173 7,749 9,492 30,414
Lack of funds for connecting 12,786 4,262 21,115 38,163
No electricity line 6,393 11,236 210,574 228,202
Renewable off-grid 0 0 1,937 1,937
Conventional off-grid 0 0 194 194
Other (Specify) 23,440 3,874 1,743 29,058
Total 55,791 27,121 245,056 327,968
36.
26
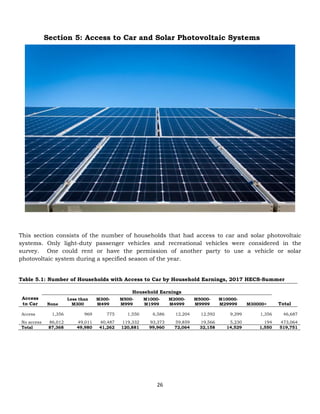
Section 5: Accessto Car and Solar Photovoltaic Systems
This section consists of the number of households that had access to car and solar photovoltaic
systems. Only light-duty passenger vehicles and recreational vehicles were considered in the
survey. One could rent or have the permission of another party to use a vehicle or solar
photovoltaic system during a specified season of the year.
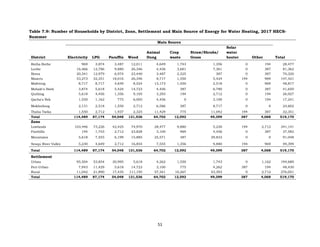
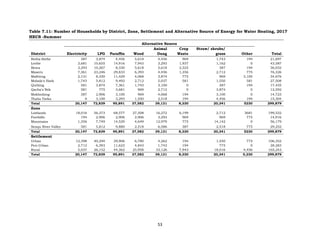
Table 5.1: Number of Households with Access to Car by Household Earnings, 2017 HECS-Summer
Access
to Car
Household Earnings
Total
None
Less than
M300
M300-
M499
M500-
M999
M1000-
M1999
M2000-
M4999
M5000-
M9999
M10000-
M29999 M30000+
Access 1,356 969 775 1,550 6,586 12,204 12,592 9,299 1,356 46,687
No access 86,012 49,011 40,487 119,332 93,373 59,859 19,566 5,230 194 473,064
Total 87,368 49,980 41,262 120,881 99,960 72,064 32,158 14,529 1,550 519,751
37.
27
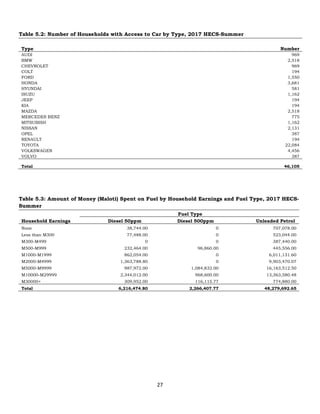
Table 5.2: Numberof Households with Access to Car by Type, 2017 HECS-Summer
Type Number
AUDI 969
BMW 2,518
CHEVROLET 969
COLT 194
FORD 1,550
HONDA 3,681
HYUNDAI 581
ISUZU 1,162
JEEP 194
KIA 194
MAZDA 2,518
MERCEDES BENZ 775
MITSUBISH 1,162
NISSAN 2,131
OPEL 387
RENAULT 194
TOYOTA 22,084
VOLKSWAGEN 4,456
VOLVO 387
Total 46,105
Table 5.3: Amount of Money (Maloti) Spent on Fuel by Household Earnings and Fuel Type, 2017 HECS-
Summer
Household Earnings
Fuel Type
Diesel 50ppm Diesel 500ppm Unleaded Petrol
None 38,744.00 0 707,078.00
Less than M300 77,488.00 0 523,044.00
M300-M499 0 0 387,440.00
M500-M999 232,464.00 96,860.00 445,556.00
M1000-M1999 862,054.00 0 6,011,131.60
M2000-M4999 1,363,788.80 0 9,903,470.07
M5000-M9999 987,972.00 1,084,832.00 16,163,512.50
M10000-M29999 2,344,012.00 968,600.00 13,363,580.48
M30000+ 309,952.00 116,115.77 774,880.00
Total 6,216,474.80 2,266,407.77 48,279,692.65
38.
28
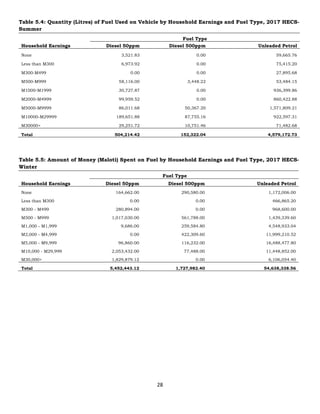
Table 5.4: Quantity(Litres) of Fuel Used on Vehicle by Household Earnings and Fuel Type, 2017 HECS-
Summer
Fuel Type
Household Earnings Diesel 50ppm Diesel 500ppm Unleaded Petrol
None 3,521.83 0.00 59,665.76
Less than M300 6,973.92 0.00 75,415.20
M300-M499 0.00 0.00 27,895.68
M500-M999 58,116.00 3,448.22 53,484.15
M1000-M1999 30,727.87 0.00 936,399.86
M2000-M4999 99,959.52 0.00 860,422.88
M5000-M9999 86,011.68 50,367.20 1,571,809.21
M10000-M29999 189,651.88 87,755.16 922,597.31
M30000+ 29,251.72 10,751.46 71,482.68
Total 504,214.42 152,322.04 4,579,172.73
Table 5.5: Amount of Money (Maloti) Spent on Fuel by Household Earnings and Fuel Type, 2017 HECS-
Winter
Household Earnings
Fuel Type
Diesel 50ppm Diesel 500ppm Unleaded Petrol
None 164,662.00 290,580.00 1,172,006.00
Less than M300 0.00 0.00 466,865.20
M300 - M499 280,894.00 0.00 968,600.00
M500 - M999 1,017,030.00 561,788.00 1,439,339.60
M1,000 - M1,999 9,686.00 259,584.80 4,548,933.04
M2,000 - M4,999 0.00 422,309.60 11,999,210.52
M5,000 - M9,999 96,860.00 116,232.00 16,488,477.80
M10,000 - M29,999 2,053,432.00 77,488.00 11,448,852.00
M30,000+ 1,829,879.12 0.00 6,106,054.40
Total 5,452,443.12 1,727,982.40 54,638,338.56
39.
29
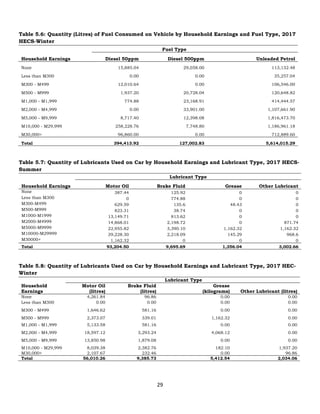
Table 5.6: Quantity(Litres) of Fuel Consumed on Vehicle by Household Earnings and Fuel Type, 2017
HECS-Winter
Household Earnings
Fuel Type
Diesel 50ppm Diesel 500ppm Unleaded Petrol
None 15,885.04 29,058.00 113,132.48
Less than M300 0.00 0.00 35,257.04
M300 - M499 12,010.64 0.00 106,546.00
M500 - M999 1,937.20 20,728.04 120,648.82
M1,000 - M1,999 774.88 23,168.91 414,444.57
M2,000 - M4,999 0.00 33,901.00 1,107,661.90
M5,000 - M9,999 8,717.40 12,398.08 1,816,473.70
M10,000 - M29,999 258,228.76 7,748.80 1,186,961.18
M30,000+ 96,860.00 0.00 712,889.60
Total 394,413.92 127,002.83 5,614,015.29
Table 5.7: Quantity of Lubricants Used on Car by Household Earnings and Lubricant Type, 2017 HECS-
Summer
Household Earnings
Lubricant Type
Motor Oil Brake Fluid Grease Other Lubricant
None 387.44 125.92 0 0
Less than M300 0 774.88 0 0
M300-M499 629.59 135.6 48.43 0
M500-M999 823.31 38.74 0 0
M1000-M1999 13,149.71 813.62 0 0
M2000-M4999 14,868.01 2,198.72 0 871.74
M5000-M9999 22,955.82 3,390.10 1,162.32 1,162.32
M10000-M29999 39,228.30 2,218.09 145.29 968.6
M30000+ 1,162.32 0 0 0
Total 93,204.50 9,695.69 1,356.04 3,002.66
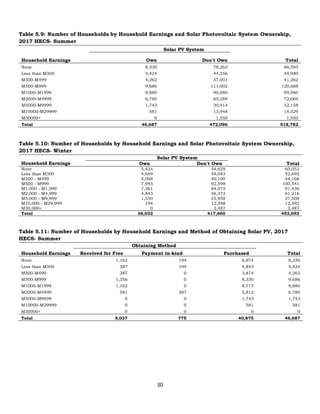
Table 5.8: Quantity of Lubricants Used on Car by Household Earnings and Lubricant Type, 2017 HEC-
Winter
Household
Earnings
Lubricant Type
Motor Oil
(litres)
Brake Fluid
(litres)
Grease
(kilograms) Other Lubricant (litres)
None 4,261.84 96.86 0.00 0.00
Less than M300 0.00 0.00 0.00 0.00
M300 - M499 1,646.62 581.16 0.00 0.00
M500 - M999 2,373.07 339.01 1,162.32 0.00
M1,000 - M1,999 5,133.58 581.16 0.00 0.00
M2,000 - M4,999 18,597.12 3,293.24 4,068.12 0.00
M5,000 - M9,999 13,850.98 1,879.08 0.00 0.00
M10,000 - M29,999 8,039.38 2,382.76 182.10 1,937.20
M30,000+ 2,107.67 232.46 0.00 96.86
Total 56,010.26 9,385.73 5,412.54 2,034.06
40.
30
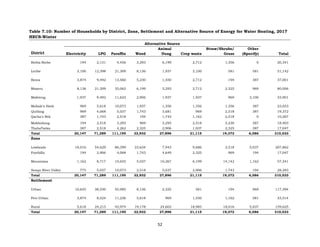
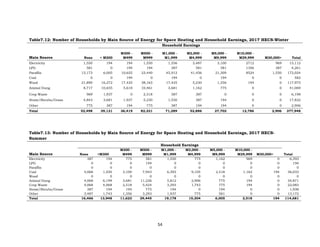
Table 5.9: Numberof Households by Household Earnings and Solar Photovoltaic System Ownership,
2017 HECS- Summer
Solar PV System
Total
Household Earnings Own Don't Own
None 8,330 78,263 86,593
Less than M300 5,424 44,556 49,980
M300-M499 4,262 37,001 41,262
M500-M999 9,686 111,002 120,688
M1000-M1999 9,880 90,080 99,960
M2000-M4999 6,780 65,284 72,064
M5000-M9999 1,743 30,414 32,158
M10000-M29999 581 13,948 14,529
M30000+ 0 1,550 1,550
Total 46,687 472,096 518,782
Table 5.10: Number of Households by Household Earnings and Solar Photovoltaic System Ownership,
2017 HECS- Winter
Household Earnings
Solar PV System
Own Don't Own Total
None 5,424 54,629 60,053
Less than M300 4,649 48,043 52,692
M300 - M499 4,068 40,100 44,168
M500 - M999 7,943 92,598 100,541
M1,000 - M1,999 7,361 84,074 91,436
M2,000 - M4,999 4,843 56,373 61,216
M5,000 - M9,999 1,550 25,958 27,508
M10,000 - M29,999 194 12,398 12,592
M30,000+ 0 3,487 3,487
Total 36,032 417,660 453,692
Table 5.11: Number of Households by Household Earnings and Method of Obtaining Solar PV, 2017
HECS- Summer
Household Earnings
Obtaining Method
Received for Free Payment in-kind Purchased Total
None 1,162 194 6,974 8,330
Less than M300 387 194 4,843 5,424
M300-M499 387 0 3,874 4,262
M500-M999 1,356 0 8,330 9,686
M1000-M1999 1,162 0 8,717 9,880
M2000-M4999 581 387 5,812 6,780
M5000-M9999 0 0 1,743 1,743
M10000-M29999 0 0 581 581
M30000+ 0 0 0 0
Total 5,037 775 40,875 46,687
41.
31
Table 5.12: Numberof Households by Household Earnings and Method of Obtaining Solar PV, 2017
HECS-Winter
Household
Earnings
Obtaining Method
Received for Free Payment in-kind Purchased Total
None 1,162 0 4,262 5,424
Less than M300 387 194 4,068 4,649
M300 - M499 581 0 3,487 4,068
M500 - M999 1,162 387 6,393 7,943
M1,000 - M1,999 387 0 6,974 7,361
M2,000 - M4,999 194 194 4,456 4,843
M5,000 - M9,999 0 0 1,550 1,550
M10,000 - M29,999 0 0 194 194
M30,000+ 0 0 0 0
Total 3,874 775 31,383 36,032
Table 5.13: Number of Households Owning and Receiving Information on Optimal Use of Solar PV by
District, Zone and Settlement, 2017 HECS-Summer
District
Ever Received Information
Total
Received Not received
Botha Bothe 4,649 1,743 6,393
Leribe 5,618 3,874 9,492
Berea 2,325 1,937 4,262
Maseru 3,293 2,518 5,812
Mafeteng 3,100 2,906 6,005
Mohale's Hoek 2,906 1,162 4,068
Quthing 775 1,937 2,712
Qacha's Nek 387 775 1,162
Mokhotlong 1,162 969 2,131
Thaba Tseka 2,906 1,743 4,649
Total 27,121 19,566 46,687
Zone
Lowlands 16,079 9,299 25,377
Foothills 2,906 2,518 5,424
Mountains 5,618 5,037 10,655
Senqu River Valley 2,518 2,712 5,230
Total 27,121 19,566 46,687
Settlement
Urban 1,937 1,550 3,487
Peri-Urban 2,131 1,356 3,487
Rural 23,053 16,660 39,713
Total 27,121 19,566 46,687
42.
32
Table 5.14: Numberof Households Owning and Receiving Information on Optimal Uuse of Solar PV by
Districts, Zone and Settlement, 2017 HECS-Winter
District
Ever Received Information
Received Not received Total
Botha-Bothe 3,874 2,325 6,199
Leribe 5,037 4,068 9,105
Berea 1,743 2,906 4,649
Maseru 3,681 1,743 5,424
Mafeteng 2,131 3,681 5,812
Mohale's Hoek 3,681 2,325 6,005
Quthing 1,162 1,743 2,906
Qacha's Nek 194 969 1,162
Mokhotlong 1,743 1,356 3,100
Thaba-Tseka 1,550 1,937 3,487
Total 24,796 23,053 47,849
Zone
Lowland 13,367 10,461 23,828
Foothill 3,874 3,681 7,555
Mountain 3,874 4,456 8,330
Senqu River Valley 3,681 4,456 8,136
Total 24,796 23,053 47,849
Settlement
Urban 1,937 1,743 3,681
Peri- Urban 2,712 1,550 4,262
Rural 20,147 19,759 39,906
Total 24,796 23,053 47,849
Table 5.15: Number of Households by Household Earnings and Type of Solar PV, 2017 HECS-Winter
Household
Earnings
Type of Solar PV System
Installed Solar
home Pre-wired
Panel with a
Battery
Water
Pumping Other Total
None 969 1,550 2,906 0 0 5,424
Less than M300 581 775 3,293 0 0 4,649
M300 - M499 581 581 2,906 0 0 4,068
M500 - M999 387 387 6,780 0 387 7,943
M1,000 - M1,999 969 1,550 4,843 0 0 7,361
M2,000 - M4,999 775 0 3,874 0 194 4,843
M5,000 - M9,999 0 0 1,356 194 0 1,550
M10,000 - M29,999 194 0 0 0 0 194
M30,000+ 0 0 0 0 0 0
Total 4,456 4,843 25,958 194 581 36,032
43.
33
Table 5.16: Numberof Households by Household Earnings and Type of Solar PV, 2017 HECS-Summer
Household
Earnings
Type of Solar PV System
Installed Solar
home Pre-wired
Panel with a
Battery
Water
Pumping Other Total
None 387 775 6,780 0 387 8,330
Less than M300 387 581 4,262 0 194 5,424
M300-M499 387 387 3,487 0 0 4,262
M500-M999 387 1,356 7,168 0 387 9,299
M1000-M1999 775 2,325 6,005 0 0 8,911
M2000-M4999 581 5,037 0 0 6,199
M5000-M9999 194 0 1,162 194 194 1,743
M10000-M29999 387 194 0 0 0 581
M30000+ 0 0 0 0 0 0
Total 3,487 5,618 33,901 194 1,162 44,749
Table 5.17: Number of Households by Districts, Zone, Settlement and Cost of Solar PV, 2017 HECS-
Summer
District
Cost of Solar System
Less than
3000 3000 - 5999 6000 - 8999 9000 - 11999 12000+ Total
Botha Bothe 5,037 581 0 194 194 6,005
Leribe 8,330 581 0 0 0 8,911
Berea 2,131 194 194 387 0 2,906
Maseru 0 0 0 0 0 0
Mafeteng 4,649 194 387 0 0 5,230
Mohale's Hoek 3,487 194 194 0 0 3,874
Quthing 2,518 0 0 0 0 2,518
Qacha's Nek 775 0 0 0 0 775
Mokhotlong 1,937 194 0 0 0 2,131
Thaba Tseka 4,456 194 0 0 0 4,649
Total 33,320 2,131 775 581 194 37,001
Zone
Lowlands 16,466 1,162 581 581 194 18,985
Foothills 3,874 387 0 0 0 4,262
Mountains 8,524 387 0 0 0 8,911
Senqu River Valley 4,456 194 194 0 0 4,843
Total 33,320 2,131 775 581 194 37,001
Settlement
Urban 2,131 0 0 0 0 2,131
Peri-Urban 2,325 194 387 0 0 2,906
Rural 28,864 1,937 387 581 194 31,964
Total 33,320 2,131 775 581 194 37,001
44.
34
Table 5.18: Numberof Households by Year of Obtaining Solar PV and Cost, 2017 HECS- Summer
Year
Cost
Less than 3000 3000 - 5999 6000 - 8999 9000+ Total
Before 2000 1,356 387 0 0 1,743
2000 - 2002 581 0 0 0 581
2003 - 2005 2,518 0 194 0 2,712
2006 - 2008 2,131 0 0 0 2,131
2009 - 2011 4,262 387 0 0 4,649
2012 - 2014 7,555 775 387 0 8,717
2015 - 2017 14,916 581 194 775 16,466
Total 33,320 2,131 775 775 37,001
Table 5.19: Number of Households by Year of Obtaining Solar PV and Cost, 2017 HECS- Winter
Year
Cost
Total
Less than 3000 3000 - 5999 6000 - 8999 9000+
Before 2000 1,356 194 194 0 1,743
2000 - 2002 1,162 0 0 0 1,162
2003 - 2005 2,906 0 0 0 2,906
2006 - 2008 2,712 194 0 0 2,906
2009 - 2011 5,230 581 0 0 5,812
2012 - 2014 10,073 581 194 194 11,042
2015 - 2017 18,985 194 775 581 20,534
Total 42,425 1,743 1,162 775 46,105
Table 5.20: Number of Households by Cost of Solar PV and Subsidy, 2017 HECS-Summer
Cost
Subsidy
Total
Subsidized Not subsidized
Less than 3000 2,325 30,995 33,320
3000 - 5999 194 1,937 2,131
6000 - 8999 387 387 775
9000 - 11999 0 581 581
12000 - 14999 0 0 0
15000+ 0 194 194
Total 2,906 34,095 37,001
Table 5.21: Number of Households by Cost of Solar PV and Subsidy, 2017 HECS-Winter
Cost
Subsidy
Total
Subsidized Not subsidized
Less than 3000 3,293 39,519 42,812
3000 - 5999 0 1,743 1,743
6000 - 8999 0 1,162 1,162
9000 - 11999 0 581 581
12000 - 14999 0 194 194
15000 + 0 0 0
Total 3,293 43,200 46,493
45.
35
Table 5.22: Numberof Households Connected to Grid electricity by Usage of Solar PV and Season, 2017
HECS
Usage of
Solar PV
Summer Winter
Total
Connected Not Connected Total Connected Not Connected
Using 581 50,367 50,948 775 47,074 47,849
Not Using 189,652 273,920 463,572 169,699 253,192 422,891
Total 190,233 324,287 514,520 170,474 300,266 470,740
Table 5.23: Quantity of Fuel Consumed by Type of Car and Fuel Type, 2017 HECS- Summer
Type of Car
Fuel Type
Total
Diesel 50ppm Diesel 500ppm Unleaded Petrol
AUDI 36,806.80 0.00 75,938.24 112,745.04
BMW 0.00 0.00 308,923.35 308,923.35
CHEVROLET 0.00 0.00 92,171.98 92,171.98
COLT 387.44 0.00 387.44
FORD 16,466.20 0.00 89,304.92 105,771.12
HONDA 0.00 0.00 231,619.38 231,619.38
HYUNDAI 0.00 0.00 11,816.92 11,816.92
ISUZU 86,786.56 0.00 29,058.00 115,844.56
JEEP 0.00 0.00 14,348.84 14,348.84
KIA 0.00 0.00 3,874.40 3,874.40
MAZDA 5,811.60 0.00 186,164.92 191,976.52
MERCEDES BENZ 0.00 0.00 98,973.49 98,973.49
MITSUBISH 19,178.28 0.00 104,415.08 123,593.36
NISSAN 31,770.08 0.00 365,861.53 397,631.61
OPEL 0.00 0.00 56,453.88 56,453.88
RENAULT 0.00 0.00 38,744.00 38,744.00
TOYOTA 307,007.46 0.00 2,342,675.33 2,791,253.36
VOLKSWAGEN 0.00 10,751.46 476,421.41 487,172.87
VOLVO 0.00 52,407.07 52,407.07
Total 504,214.42 152,322.04 4,579,172.73 5,235,709.18
38
Section 6: CookingIn Households
A lot of energy in the household is consumed in cooking, so it is important to look into the cooking
habits of the respective households. This section covers main sources of energy used by households
for cooking and alternative sources. It also covers the average amount of energy sources used for
cooking per day and per month.
Information on the kind of stove mainly used for cooking and whether they had a chimney, hood or
window was collected. Information on type of cooking pots, number of cooking pots, cooking
technologies, cooking techniques and type of energy sources used at the time of cooking
breakfast/lunch/dinner was also collected to monitor energy intensive at the time of cooking.
41
Table 6.2a: AverageQuantity of Energy Sources Used for Cooking/day and Energy Used (MJ), 2017
HECS- Summer
Energy Source Average per day Units Energy Used
Electricity 2.31 KWh 8.33
LPG 0.25 kg 11.26
Paraffin 0.63 l 23.77
Crop Waste 3.57 kg 58.51
Wood 5.52 kg 94.88
Animal Dung 5.90 kg 75.48
Straw/shrubs/grass 4.83 kg 83.00
Table 6.2b: Average Quantity of Energy Sources Used for Cooking per Month and Energy Used (MJ),
2017 HECS- Summer
Energy Source Main Alternative Total (kg/l) MJ
LPG(kg) 2,730,518.3 1,209,579.9 3,940,098.2 177,304,419.0
Paraffin (l) 859,706.1 2,789,145.7 3,648,851.8 138,656,368.4
Crop Waste(kg) 1,213,287.7 554,494.4 1,767,782.2 28,991,627.6
Animal dung(kg) 9,953,170.9 5,513,089.1 15,466,260.0 197,968,127.7
Straw/ shrubs/ grass (kg) 6,052,597.4 2,066,052.9 8,118,650.2 139,640,784.0
Other (kg) 222,923.3 162,598.9 385,522.2
Table 6.2c: Average Quantity of Energy Sources Used for Cooking per Month and Energy Used (MJ),
2017 HECS- Winter
Energy Source Main Alternative Total MJ
LPG (kg) 3,612,802.4 5,450,387.8 9,063,190.2 407,843,559.0
Paraffin (l) 1,408,028.6 4,097,807.6 5,505,836.2 209,221,776.6
Crop waste (kg) 3,689,397.4 57,922.3 3,747,319.7 61,456,042.8
Animal dung (kg) 14,479,163.6 3,049,069.5 17,528,233.1 224,361,383.6
Straw/shrubs/grass (kg) 6,757,687.8 34,869.6 6,792,557.4 116,831,987.3
Other (Specify) (kg) 214,118.7 214,118.7
52.
42
Table 6.3: AverageQuantity of Main Energy Sources Used for Cooking per Month by District, Zone and
Settlement, 2017 HECS- Summer
Energy Source
District LPG (kg) Paraffin (l)
Crop Waste
(kg)
Animal dung
(kg)
Straw/
shrubs/
grass (kg) Other
Botha Bothe 123,047.07 71,385.82 43,625.74 703,939.74 309,273.98 0.00
Leribe 316,786.44 157,746.20 452,723.64 675,385.41 643,402.24 14,529.00
Berea 603,774.87 106,255.42 187,327.24 525,355.08 33,126.12 0.00
Maseru 1,217,615.44 432,107.96 210,186.20 1,176,170.98 692,742.72 29,058.00
Mafeteng 225,091.02 30,898.34 183,142.89 2,447,861.42 250,867.40 72,790.29
Mohale's Hoek 67,995.72 30,317.18 76,713.12 301,563.92 958,826.83 0.00
Quthing 81,418.58 2,905.80 0.00 487,748.22 389,687.15 94,922.80
Qacha's Nek 11,315.19 11,235.76 0.00 1,052,112.69 297,960.73 0.00
Mokhotlong 64,285.98 9,298.56 17,434.80 1,001,241.82 935,861.32 0.00
Thaba Tseka 19,187.97 7,555.08 42,134.10 1,581,791.60 1,540,848.88 11,623.20
Total 2,730,518.27 859,706.11 1,213,287.73 9,953,170.88 6,052,597.37 222,923.29
Zone
Lowlands 2,400,465.88 720,033.99 940,045.67 4,221,896.87 521,397.38 87,077.14
Foothills 128,163.21 19,178.28 136,960.04 274,927.42 442,747.06 29,300.15
Mountains 104,850.95 107,514.60 17,434.80 4,627,205.61 3,654,469.68 0.00
Senqu River Valley 97,038.22 12,979.24 118,847.22 829,140.97 1,433,983.24 106,546.00
Total 2,730,518.27 859,706.11 1,213,287.73 9,953,170.88 6,052,597.37 222,923.29
Settlement
Urban 2,023,608.81 571,586.36 141,706.18 542,929.36 201,352.57 101,703.00
Peri-Urban 183,113.83 81,943.56 11,235.76 425,835.30 240,290.29 7,748.80
Rural 523,795.63 206,176.20 1,060,345.79 8,984,406.21 5,610,954.51 113,471.49
Total 2,730,518.27 859,706.11 1,213,287.73 9,953,170.88 6,052,597.37 222,923.29
Table 6.4a: Number of Households by Kind of Stove Mainly Used for Cooking, 2017 HECS- Summer
Kind of Stove Number
Spiral 37,194
Induction/ hot plate 31,964
Gas stove 220,066
Glass Ceramic plate 1,743
None 227,427
Other 194
Total 518,588
53.
43
Table 6.4b: Numberof Households Owning a Stove with Chimney, Hood or Window by Settlement and
Type of Stove, 2017 HECS- Summer
Type of Stove
Settlement Spiral Induction/hot plate Gas Stove
Glass Ceramic
plate Other
Urban 7,943 8,717 47,461 581 0
Peri-Urban 2,131 969 13,754 0 194
Rural 1,937 1,162 39,131 0 0
Total 12,011 10,848 100,346 581 194
Table 6.5: Number of Households by Type of Cooking Pots and Meal Time, 2017 HECS- Summer
Meal Time
Type of Pots Breakfast Lunch Dinner
Stainless steel pot 57,342 32,932 71,095
Alluminium pot 135,023 59,279 145,095
Nonstick pot 2,518 1,356 2,712
Copper pot 2,324 969 1,937
Enameled Cast Iron 8,330 3,294 12,591
Uncoated Cast Iron 218,710 26,345 168,148
Carbon Steel and Blue steel 388 194 774
Safe 80 pot 1,937 581 1,355
Electrical pot 194 0 0
Table 6.6: Number of Households by Number of Cooking Pots Used and Meal Time, 2017 HECS-
Summer
Meal Time
Number of Pots Breakfast Lunch Dinner
1 78,263 8,330 26,733
2 290,774 62,765 234,595
3 26,733 26,346 44,168
4 194 1,937 2,906
5 387
Table 6.7: Number of Households by Cooking Technology and Meal Time, 2017 HECS- Summer
Meal Time
Technology Breakfast Lunch Dinner
Stove 145,097 73,226 165,244
Open fire 104,222 7,555 74,582
Prima Stove/Paraffin Heater 37,776 6,586 37,195
Paola 131,730 14,724 107,902
54.
44
Table 6.8: Numberof Households by Type of Energy Source and Meal Time, 2017 HECS- Summer
Meal Time
Energy Source Breakfast Lunch Dinner
Electricity 30,802 15,884 38,356
LPG 112,165 57,729 127,274
Biogas 1,163 194 194
Paraffin 39,906 6,588 37,002
Crop Waste 12,205 1,163 10,267
Wood 124,561 12,011 96,278
Animal dung 75,939 6,006 62,766
Straw/Shrubs/Grass 47,268 3,681 37,388
Other 2,519 581 1,549
Table 6.9: Number of Households by the Type of Cooking Techniques and Meal Time, 2017 HECS-
Summer
Meal Time
Technique Breakfast Lunch Dinner
Boiling 222,390 45,137 188,877
Frying 121,463 59,279 169,698
Baking 11,622 1,357 3,100
Grilling/Roasting 775 1,357 3,681
Simmering 346,565 91,243 343,852
Other 582 2,131 1,162
Table 6.10: Number of Households Owning a Microwave Oven by Settlement Type, 2017 HECS-
Summer
Settlement Number
Urban 54,242
Peri-Urban 4,262
Rural 5,037
Total 63,540
55.
45
Section 7: Spaceand Water Heating
Space heating is heating of space of limited area such as room, mostly for human comfort by any
means. It consumes the largest portion of energy around the globe including Lesotho. Water heating
on the other hand is heat transfer process that uses an energy source to heat water above its initial
temperature.
Table 7.1: Number of Households Heating Dwelling by District, Zone and Settlement, 2017 HECS-
Winter
Heating Dwelling
District Heated Not Heated Total
Botha Bothe 22,665 8,717 31,383
Leribe 66,446 23,246 89,692
Berea 46,687 24,021 70,708
Maseru 106,159 49,786 155,945
Mafeteng 27,896 24,409 52,304
Mohale's Hoek 26,346 17,241 43,587
Quthing 22,278 6,780 29,058
Qacha's Nek 14,723 2,712 17,435
Mokhotlong 22,472 3,487 25,958
ThabaTseka 22,472 12,398 34,870
Total 378,141 172,798 550,940
Zone
Lowlands 237,888 123,400 361,288
Foothills 29,833 12,398 42,231
Mountains 72,258 22,859 95,117
Senqu River Valley 38,163 14,142 52,304
Total 378,141 172,798 550,940
Settlement
Urban 144,903 67,027 211,930
Peri-Urban 34,482 17,241 51,723
Rural 198,757 88,530 287,287
Total 378,141 172,798 550,940
59
Section 9: Householduse of Solar Water Heaters and
Generators
Solar water heaters can also be called domestic hot water systems. They are a cost-
effective way to generate hot water for homes since they use sunshine. There are two
types of solar water systems: Direct circulation systems and indirect circulation
systems.
A generator is a device that converts motive power (Mechanical energy) into electrical
power through a process called electromagnetic induction for use in an external
circuit. There are three types of generators: portable, inverter and standby.
Table 9.1: Number of Solar Heating Systems by Litres, Area, Production and Capacity,
2017 HECS-Summer
Number of Systems Litres Area Production Capacity
194 150 225 193,050 157.5
194 200 770 660,660 539
194 100 120 102,960 84
194 50 120 102,960 84
Table 9.2: Number of Households by Ownership of Solar Water Heating System and a
Solar PV system, 2017 HECS-Summer
Solar PV System
Solar Water Heating System Own Not own
Own 194 581
Not own 47,655 500,573
70.
60
Table 9.3: Numberof Households by Ownership of a Solar Water Heater and Connection
to Grid Electricity- HECS 2017
Grid Electricity
Solar Water Heater Connected Not Connected
Own 775 0
Not Own 197,788 350,828
Table 9.4: Number of Households Owning a Functional Generator by Household Earnings
and Settlement, 2017 HECS
Settlement
Household Earnings Urban Peri-Urban Rural
None 194 0 1,743
Less than M300 0 0 775
M300 - M499 0 0 581
M500 - M999 581 194 1,937
M1,000 - M1,999 0 387 3,487
M2,000 - M4,999 194 0 1,356
M5,000 + 0 0 1,356
Table 9.5: Cost (maloti)and Type of Fuel Used in Generators by District, HECS 2017
District
Type of Fuel
Diesel 50ppm Unleaded Petrol
Botha-Bothe 0 539,316
Leribe 0 1,323,108
Berea 0 743,110
Maseru 0 1,220,436
Mafeteng 0 749,696
Mohale’s Hoek 58,116 106,546
Quthing 0 654,774
Qacha's Nek 0 333,198
Mokhotlong 0 46,493
Thaba-Tseka 0 0
Total 58,116 5,716,677
62
Section 10: OtherEnergy Sources and Preferences
Other energy sources are categorized as liquid petroleum gas (LPG), Coal, Paraffin and
other materials used as energy sources not elsewhere mentioned in the tables. The
survey also sought to find out what forms of energy households would appreciate to be
availed.
Table 10.1: Number of Households by Source of Energy Used and Season, 2017 HECS
Season
Source of Energy Winter Summer
LPG 223,553 61,797
Coal 387 0
Paraffin 285,737 249,124
None 44,943 0
Other 387 52,304
Total 555,008 363,225
Table 10.2: Number of Households by Method of Acquisition and Energy Source, 2017
HECS-Winter
Energy Sources
Acquisition LPG Coal Paraffin Biogas Other
Self-Production 0 0 0 194 0
Received for Free 581 194 969 0 0
Payment in-kind 0 0 969 0 0
Purchased 222,972 1,162 481,588 0 0
Collected 0 0 0 0 581
Total 223,553 1,356 483,525 194 581
73
Table 10.14: Numberof Households by District, Zone, Settlement and Form of Energy
Appreciated to be Availed, 2017 HECS-Winter
Form of Energy
District
Electricity
(grid) LPG Wood Paraffin Solar PV Bio-gas None Total
Botha-Bothe 26,927 775 1,743 775 1,162 0 0 31,383
Leribe 48,817 7,361 3,487 3,293 6,393 3,100 194 72,645
Berea 31,964 8,911 5,424 2,518 9,105 2,518 1,356 61,797
Maseru 48,817 31,189 6,199 6,586 20,147 5,618 1,550 120,106
Mafeteng 28,864 5424 1,550 1,743 7,943 969 194 46,687
Mohale's Hoek 28,671 3,874 581 1,162 4,843 581 387 40,100
Quthing 16,272 1,937 969 194 2,518 194 194 22,278
Qacha's Nek 10,655 1,937 1,743 969 775 194 0 16,272
Mokhotlong 17,435 1,162 387 387 3,293 0 194 22,859
Thaba-Tseka 18,403 7,361 581 2,131 3,874 969 0 33,320
Total 276,826 69,933 22,665 19,759 60,053 14,142 4,068 467,446
Zone
152,070 51,142 16,854 13,367 42,618 12,786 3,487 292,323
Lowland
Foothill 29,639 4,262 969 1,743 3,874 0 194 40,681
Mountain 60,828 11,817 4,456 3,874 6,780 1,162 194 89,111
Senqu River Valley 34,288 2,712 387 775 6,780 194 194 45,330
Total 276,826 69,933 22,665 19,759 60,053 14,142 4,068 467,446
Settlement
43,393 34,676 8,717 8,330 38,744 10,655 2,906 147,421
Urban
Peri-urban 22,665 8,524 2,712 1,550 5,230 1,937 387 43,006
Rural 210,767 26,733 11,236 9,880 16,079 1,550 775 277,020
Total 276,826 69,933 22,665 19,759 60,053 14,142 4,068 467,446
Table 10.15: Number of Households by Household Earnings and Form of Energy
Appreciated to be Availed, 2017 HECS- Winter
Form of Energy
Household
Earnings
Electricity
(grid) LPG Wood Paraffin
Solar
PV
Bio-
gas None Total
None 52,111 10,655 2,325 2,712 6,393 1,356 387 75,938
Less than M300 43,200 5,812 2,906 3,681 4,843 775 0 61,216
M300 - M499 34,288 7,361 1,937 1,162 5,230 969 194 51,142
M500 - M999 73,807 15,110 7,361 4,068 9,880 1,356 1,162 112,745
M1,000 - M1,999 47,268 15,498 4,068 3,874 11,236 3,874 775 86,593
M2,000 - M4,999 19,953 9,880 2,906 2,712 9,492 2,712 969 48,624
M5,000 - M9,999 5,618 3,681 1,162 1,162 7,168 2,325 194 21,309
M10,000 - M29,999 581 1,550 0 387 4,649 581 194 7,943
M30,000 and above 0 387 0 0 1,162 194 194 1,937
Total 276,826 69,933 22,665 19,759 60,053 14,142 4,068 467,446
84.
74
Table 10.16: Numberof Households by Plans to Upgrade the House and Season, 2017
HECS
Season
Plans Winter Summer
Replace the light bulbs with CFL 5,618 33,320
Replace the light bulbs with LED 4,843 9,492
Install a solar water heater 4,843 31,964
Install a PV system 16,854 22,859
Insulate the walls 6,393 12,011
Replace the windows 9,105 30,220
Fit a ceiling 49,592 46,493
None 339,591 0
Total 436,839 186,359
Table 10.17: Number of Households by District, Zone, Settlement and Plans to Upgrade
the House, 2017 HECS-Winter
Plan to Upgrade
Total
District
Replace
light
bulbs
with
CFL
Replace
light
bulbs
with
LED
Install
a solar
water
heater
Install
a PV
system
Insulate
the
walls
Replace
the
windows
Fit a
ceiling None
Botha-Bothe 194 194 0 775 387 194 3,100 14,723 19,566
Leribe 581 194 581 387 775 1,162 7,943 52,304 63,928
Berea 387 1,356 969 3,100 969 581 9,105 40,294 56,760
Maseru 3,100 1,937 2,131 2,712 1,743 3,293 13,173 102,090 130,180
Mafeteng 194 969 194 581 387 0 6,780 31,964 41,069
Mohale's Hoek 194 0 194 387 775 0 3,100 35,451 40,100
Quthing 387 0 0 2,906 194 387 2,131 14,335 20,341
Qacha's Nek 0 0 387 3,293 0 194 1,743 9,299 14,916
Mokhotlong 581 0 194 1,162 0 1,162 775 14,335 18,210
Thaba-Tseka 0 194 194 1,550 1,162 2,131 1,743 24,796 31,770
Total 5,618 4,843 4,843 16,854 6,393 9,105 49,592 339,591 436,839
Zone
4,068 4,456 3,681 5,618 4,456 3,681 38,357 217,935 282,250
Lowland
Foothill 581 194 387 1,937 0 581 3,874 23,828 31,383
Mountain 775 194 194 2,906 1,550 4,262 4,068 62,378 76,326
Senqu River Valley 194 0 581 6,393 387 581 3,293 35,451 46,880
Total 5,618 4,843 4,843 16,854 6,393 9,105 49,592 339,591 436,839
Settlement
3,293 1,743 3,100 3,100 1,743 1,743 17,435 132,504 164,662
Urban
Peri Urban 194 775 581 2,325 1,550 969 7,168 30,414 43,974
Rural 2,131 2,325 1,162 11,429 3,100 6,393 24,990 176,673 228,202
Total 5,618 4,843 4,843 16,854 6,393 9,105 49,592 339,591 436,839
85.
75
Table 10.18: Numberof Households by Household Earnings and Plans to Upgrade the
House, 2017 HECS-Winter
Plan to Upgrade
Household Earnings
Replace
light
bulbs
with
CFL
Replace
light
bulbs
with
LED
Install
a solar
water
heater
Install
a PV
system
Insulat
e the
walls
Replace
the
windows
Fit a
ceiling None Total
None 0 387 194 1,937 194 1,937 7,361 57,147 69,158
Less than M300 775 387 194 4,262 969 2,906 3,487 42,037 55,016
M300 - M499 387 969 387 1,937 1,162 775 4,843 33,126 43,587
M500 - M999 775 581 581 3,874 1,743 2,518 9,299 78,263 97,635
M1,000 - M1,999 1,356 1,356 581 1,937 387 387 12,592 65,671 84,268
M2,000 - M4,999 1,743 969 969 1,356 1,356 581 7,943 36,032 50,948
M5,000 - M9,999 387 194 969 969 194 0 3,293 16,660 22,665
M10,000 - M29,999 194 0 969 387 194 0 775 8,136 10,655
M30,000 and above 0 0 0 194 194 0 0 2,518 2,906
Total 5,618 4,843 4,843 16,854 6,393 9,105 49,592 339,591 436,839
Table 10.19: Number of Households by Constraints and Upgrades, 2017 HECS- Winter
Upgrades
Constraints CFL LED SWH PV Insulate Window Ceiling
I do not own the house 102,478 102,865 125,337 121,850 128,049 130,374 122,237
Low income 113,714 112,164 181,322 192,945 180,547 196,626 174,348
Low quality of products 2,518 2,518 969 1,937 387 581 194
High purchasing costs 22,472 24,602 59,278 59,472 46,687 61,797 42,618
High interest rates on commercial
loans 0 0 194 0 0 194 0
High installation / labour costs 2,131 2,131 8,524 9,686 8,911 7,361 3,681
Lack of device on local market 1,550 1,162 387 1,550 1,356 581 0
Don't know which is best choice 20,341 22,084 4,262 6,586 4,068 5,618 3,293
I do not know about these
technologies 84,849 92,017 96,666 63,734 119,138 56,566 26,152
Not connected to electricity 145,290 141,997 14,916 9,880 2,712 581 5,037
Already have 9,880 8,136 387 7,361 581 6,005 24,215
Other 0 0 0 6,586 0 0 12,786
Total 505,222 509,677 492,243 481,588 492,436 466,284 414,561
86.
76
Table 10.20: Numberof Households by Constraints and Upgrades, 2017- Summer
Upgrades
Constraints CFL LED SWH PV Insulate Window Ceiling
I do not own the house 80,006 81,944 112,358 112,551 115,845 116,038 103,640
Low income 63,928 62,959 161,369 175,317 157,882 164,081 141,609
Low quality of products 2,131 2,325 775 2,906 775 1,162 775
High purchasing costs 17,435 18,791 50,367 57,341 41,069 56,179 30,801
High installation/ labour costs 969 969 11,236 10,073 4,843 2,131 969
Lack of device on local market 581 775 1,162 1,162 1,162 969 194
Don't know which is best choice 13,560 12,979 2,131 4,649 3,100 4,456 1,937
I do not know about these
technologies 45,137 57,729 72,839 45,912 110,808 43,587 24,021
Not connected to electricity 209,605 206,118 17,629 6,780 4,649 2,712 2,712
Already have 30,220 18,403 1,743 18,403 4,262 18,016 89,692
Other (specify) 0 581 775 1,937 0 969 0
Total 463,572 463,572 432,383 437,032 444394 410,299 396,351
87.
77
Section 11: GeneralTables
This section covers the tables that include the overall energy sources that were used in
2017 and the consumption quantities that were found. The tables are essentially a
summary of household energy consumption.
Table 11.1: Total Quantity of Fuel Used by Type and Purpose, 2017 HECS
Type of Fuel
Purpose
Cooking Lighting Space Heating
LPG (Kg) 11,820,295 4,068 336,827
Paraffin (Liters) 10,946,555 3,597,973 8,859,124
Crop Waste (Kg) 5,303,347 2,106,337
Animal dung (Kg) 46,398,780 18,581,001
Straw/ shrubs/ grass (Kg) 24,355,951 5,440,376
Electricity (KWh) 730,678,521 60,903
Fuelwood (Kg) 21,920,355,621 47,642,009
Candles (Number) 2,776,478
Solar(KWh) 1,251
Other 1,156,567