The document provides an overview of InfraREIT's recent performance and events. Some key points:
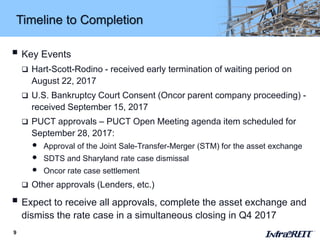
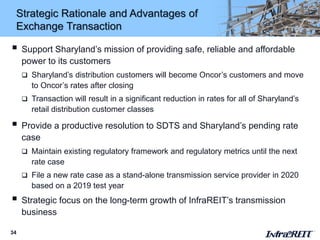
- InfraREIT reached agreements for an asset exchange transaction with Oncor and proposed dismissal of a rate case.
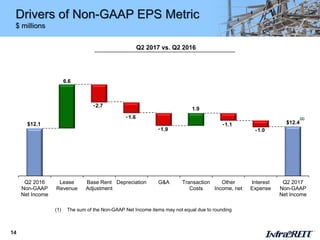
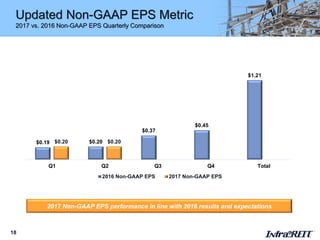
- InfraREIT reported solid Q2 2017 performance with increases in lease revenue and net income. Non-GAAP metrics were consistent with prior year.
- The asset exchange and rate case dismissal are expected to close simultaneously in Q4 2017 pending required regulatory approvals.
InfraREIT reported its Q2 2017 results with the following highlights:
- Revenue and net income increased 20% and 10% respectively due to rate case outcomes.
- Non-GAAP metrics like EPS of $0.20 and CAD of $13.6 million were consistent with or up from prior year.
- The company reached agreements to exchange $400 million in distribution assets for $380 million in transmission assets from Oncor and dismiss ongoing rate cases, pending approvals.
- The footprint shift and agreements are expected to provide a more stable regulatory environment and increased investment opportunities going forward.
InfraREIT's quarterly performance was slightly better than expected, though net income decreased due to lower lease revenue growth and transaction expenses. The corporate tax rate cut from 35% to 21% may reduce InfraREIT's lease payments and non-GAAP EPS in the future if implemented before existing leases expire. REIT dividends will now be taxed as business income up to 29.6% rather than ordinary income up to 39.6%. InfraREIT is evaluating impacts of the tax law changes.
The document provides an overview of InfraREIT's 2017 Q3 performance and recent events, including:
- Lease revenue increased 4% driven by increased assets under lease, partially offset by lower lease pricing. Net income decreased 10% primarily due to lower lease revenue growth and asset exchange transaction expenses.
- Non-GAAP EPS was $0.36 compared to $0.37 in Q3 2016. Cash available for distribution was $22.6 million.
- The company updated 2017 EPS guidance to $1.15 to $1.19 and 2018 EPS guidance to $1.32 to $1.42. Transmission capital expenditures for 2017-2019 are expected to be $180-300
InfraREIT reported strong Q1 2015 results that were in line with expectations, including year-over-year growth in lease revenue, adjusted EBITDA, and cash available for distribution. Major footprint projects like the Golden Spread Interconnection and Cross Valley Transmission Line are progressing on schedule. InfraREIT is on track to achieve its 2015 financial targets and expects 10-15% annual growth in cash available for distribution per share through 2018.
InfraREIT reported solid third quarter 2017 results with most metrics slightly better than expectations. Lease revenue increased 4% due to more assets under lease, partially offset by lower lease pricing. Net income decreased 10% primarily due to lower lease revenue growth and costs related to an asset exchange transaction. Non-GAAP EPS was $0.36. The company also provided an update on the asset exchange transaction with Oncor and highlighted growth opportunities in its expanded footprint in Texas, including a pipeline of projects with Hunt. Forward guidance was updated with 2017 Non-GAAP EPS expected in the range of $1.20 to $1.24.
4Q2017 Results and Supplemental InformationInfraREIT
InfraREIT reported full year 2017 results with the following key points:
1) Lease revenue grew 11% due to increased assets under lease, partially offset by lower lease pricing reflecting a lower allowed cost of debt assumption.
2) Net income decreased $52 million primarily due to a $56 million regulatory adjustment for the Tax Cuts and Jobs Act.
3) Cash available for distribution increased 8% to $80 million and adjusted EBITDA rose 9% to $169 million.
InfraREIT provided a corporate update and summarized its Q4 2015 and full year 2015 performance. Key points include:
- Q4 2015 and full year 2015 financial results were in line with expectations and showed growth over the prior year.
- InfraREIT is updating its estimates for footprint capital expenditures from 2016-2018 to be in the range of $640-740 million.
- InfraREIT initiated 2016 guidance for CAD per share, non-GAAP EPS, and dividends per share.
- Two ROFO projects under construction by Hunt were discussed, with potential future acquisition by InfraREIT.
- InfraREIT reported strong 2015 full year results, with cash available for distribution growing 21% over 2014 and adjusted EBITDA growing 11%.
- Lease revenue increased 13% in both Q4 2015 and full year 2015, driving earnings growth.
- InfraREIT has $280.5 million in available liquidity through revolving credit facilities and cash on hand to fund future growth opportunities.
- The company's financing strategy focuses on acquiring regulated transmission and distribution opportunities within its existing footprint to maintain a strong financial profile and grow dividends over the long term.
InfraREIT reported solid first quarter 2018 results with increased lease revenue and net income. Management is evaluating terminating the company's REIT status and pursuing an alternative corporate structure. The board has directed pursuing a C-corp structure but has not set a timeline. InfraREIT reaffirmed 2018 guidance and expects $70-180 million in footprint capital expenditures from 2018-2020.
Daseke reported Q1 2017 financial results consistent with expectations. Total revenue increased 2.2% compared to Q1 2016 due to driving more miles, though additional operating costs from new leases and higher fuel costs slightly reduced efficiency. The company continues executing its consolidation strategy in the open deck specialized transportation market through acquisitions. An improving industry environment is also noted.
Daseke is looking to consolidate the highly fragmented North American flatbed and specialized trucking market through strategic acquisitions. It has acquired 13 companies since 2008 and achieved 41% annual adjusted EBITDA growth. With a large fleet and focus on asset-right operations, Daseke is well-positioned to benefit from improving industrial freight fundamentals and further consolidate the industry through its acquisition pipeline. Management aims to achieve $140 million in adjusted EBITDA for 2017 through organic growth and recent acquisitions.
InfraREIT reported its Q1 2016 results, which showed strong performance in line with expectations. Key highlights included a 5% increase in cash available for distribution to $19.3 million and an 11% rise in adjusted EBITDA to $38.1 million. The company also reaffirmed its 2016 guidance metrics and estimates $640-740 million in footprint capital expenditures over 2016-2018. Major ongoing Hunt transmission projects include the Southline Transmission project in Arizona and New Mexico.
This document provides Q3 2016 results and supplemental information for InfraREIT, Inc. It highlights solid Q3 2016 performance with increases in lease revenue, net income, Non-GAAP EPS, CAD, and Adjusted EBITDA. It also discusses InfraREIT's pending rate case and updates on its Hunt Projects, including the Southline and Verde Transmission projects. Financial summaries show increases in key metrics like lease revenue, net income, and Adjusted EBITDA for both Q3 2016 compared to Q3 2015 and year-to-date 2016 compared to the same period in 2015.
This document provides an overview of the key similarities and differences between US GAAP and IFRS accounting standards. It covers several accounting areas such as financial statement presentation, business combinations, leases, and revenue recognition. The document notes that while US GAAP and IFRS have many similarities, some differences remain in areas such as the classification of debt, treatment of expenses, and interim financial reporting. It also discusses ongoing convergence projects by the FASB and IASB to further align certain standards.
InfraREIT provided its 2016 full year results and supplemental information. It reported solid Q4 2016 performance with an increase in lease revenue and net income in line with expectations. Key highlights included strong growth in Sharyland's service territory with peak load and distribution volume increases, as well as ongoing projects with Hunt. InfraREIT is focused on regulated transmission and distribution opportunities within its footprint, maintaining a strong financial profile to support growth, and growing dividends.
Daseke inverstor presentation - november 2018irdaseke
- Daseke is a high-growth company that moves industries through mergers and acquisitions, growing revenue from $30M in 2009 to an estimated $1.55B in 2018 and adjusted EBITDA from $6M to an estimated $170M over the same period.
- The company's strategy is to first build scale through acquisitions to become the largest flatbed and specialized logistics carrier in North America, and then focus on margin expansion, EBITDA growth, and free cash flow going forward.
Daseke, Inc. held an acquisition conference call in September 2017 to discuss consolidating the flatbed and specialized logistics market. They have acquired four companies since May 2017, adding an estimated $218 million in revenue and $26 million in adjusted EBITDA. Daseke has $20 million in cash, a $70 million undrawn credit line, and $23.7 million available on a delayed draw term loan to fund further growth. They remain on track to achieve their 2017 pro forma adjusted EBITDA target of $140 million through continued acquisition execution.
The document is a Q3 2018 earnings presentation for Daseke, a transportation company. Some key points:
- Revenue increased 99% to a record $461.6 million in Q3 2018 compared to Q3 2017. Adjusted EBITDA also increased 96% to a record $52.8 million.
- Revenue and adjusted EBITDA grew for both the Flatbed Solutions and Specialized Solutions segments. Rates per mile increased for both segments as well.
- The company has a net debt of $666.8 million and leverage of 3.4x as of September 30, 2018, which is below the covenant level.
- Acquisition-adjusted EBITDA, which
Daseke held an acquisition conference call to discuss consolidating the flatbed and specialized logistics market. They have completed three acquisitions since May 2017, adding over $20 million in estimated revenue and adjusted EBITDA. Daseke believes consolidation and integration opportunities will allow them to achieve their 2017 adjusted EBITDA target of $140 million.
QTS Realty Trust reported earnings results for the fourth quarter of 2019. Key highlights included:
- Signed new and modified leases totaling $27.7 million in incremental annualized rent, the strongest leasing quarter in company history.
- Commenced construction on a new 250+ megawatt data center campus in Hillsboro, Oregon, with initial development delivering in mid-2020.
- Provided full year 2020 guidance with 10-12% revenue and adjusted EBITDA growth expected over 2019 results.
- Maintains a strong balance sheet with $220 million in available undrawn equity proceeds and extended credit facilities.
This document provides an overview of CPI Card Group, including:
1) CPI Card Group is a leading provider of payment card solutions in the US markets for large issuers, small/mid-sized issuers, and prepaid debit cards.
2) The company serves over 4,000 customers with a focus on end-to-end payment solutions including EMV cards, instant card issuance systems, personalization services, and prepaid cards.
3) CPI Card Group expects continued growth in the US payment card market driven by the ongoing transition to EMV cards and growth in prepaid debit cards. The company is also innovating new product offerings like metal cards.
Cpi card group q1 2017 earnings presentationcpi2016ir
The document is the transcript from CPI Card Group's first quarter 2017 earnings conference call. It includes a discussion of the company's financial results for Q1 2017 which showed a year-over-year decrease in total net sales and net income. Management provides commentary on market conditions, strategic focus, innovation highlights and reaffirms full year 2017 guidance ranges. The call also includes segments results and discussions of cash flow, free cash flow, and non-GAAP financial measures.
- The document is a presentation by BMC Stock Holdings, Inc. providing an overview of the company's financial performance and outlook.
- It includes forward-looking statements about sales growth, earnings, and demand, and cautions that actual results could differ materially from projections.
- It also defines non-GAAP financial metrics like Adjusted EBITDA that exclude items like merger costs to provide additional tools for investors to evaluate ongoing performance.
- The presentation provides context on BMC's formation through the 2015 merger of Stock Building Supply Holdings and Building Materials Holding Corporation.
Dske q4 and 2017 earnings presentation finalirdaseke
The document provides an earnings presentation for Daseke, Inc. for Q4 and full year 2017. Some key highlights include:
- Q4 2017 revenue was $257.2 million, up from $150.4 million in Q4 2016. Full year 2017 revenue was $846.3 million, up from $651.8 million in 2016.
- Q4 2017 adjusted EBITDA was $23.1 million, up from $15.3 million in Q4 2016. Full year 2017 adjusted EBITDA was $91.9 million, up from $88.2 million in 2016.
- Net income for Q4 2017 was $38.8 million compared to a net loss of $
This document contains forward-looking statements, disclaimers, and definitions related to CPI Card Group's financial reporting. It discusses risks and uncertainties inherent in forward-looking statements. It also provides context around non-GAAP financial measures reported by CPI Card Group and reconciliations to GAAP measures. The document establishes CPI Card Group as a North American leader in payment card solutions with leading market positions and addresses a large growing market driven by long-term trends in the payments industry.
BMC reported financial results for Q4 2017 that included 12.5% sales growth and improved adjusted EBITDA. Key highlights included strong growth in structural components sales, success of the Ready-Frame business, and cost savings from synergies after the 2015 merger. BMC also outlined its strategic priorities and outlook, which focus on organic growth through customer service leadership and value-added products, as well as pursuing strategic expansion through acquisitions.
Daseke, inc. – consolidating north america’s open deck transportation & l...irdaseke
- Daseke is consolidating the fragmented North American open deck transportation and logistics market through acquisitions.
- Daseke has achieved 48% Adjusted EBITDA compound annual growth rate from 2009 to pro forma 2016 through its acquisition strategy.
- Two acquisitions completed shortly after going public added 14% to Daseke's 2016 pro forma Adjusted EBITDA and positions the company to achieve its 2019 Adjusted EBITDA target of $200 million.
InfraREIT reported solid Q1 2017 results with increases in lease revenue and net income in line with expectations. However, some non-GAAP measures were mixed. Non-GAAP EPS decreased slightly to $0.30 per share due to growth in operating expenses offsetting increased lease revenue. Adjusted EBITDA increased 7% to $40.8 million due to lease revenue growth. Capital expenditures were $52 million for ongoing system upgrades and to accommodate load growth in the service territory.
SemGroup reported adjusted EBITDA of $60.7 million for the first quarter of 2017, down from $66.2 million in the fourth quarter of 2016. The Crude Facilities segment was down nearly $5 million due to the absence of a take-or-pay adjustment in the prior quarter. SemGroup reaffirmed its 2017 adjusted EBITDA guidance range of $270-310 million and expects its annualized fourth quarter 2017 adjusted EBITDA run rate to be between $325-340 million. Key growth projects including the Maurepas Pipeline and SemGas Canton Pipeline are on track for completion by the end of 2017.
- SemGroup reported adjusted EBITDA of $60.7 million for the first quarter of 2017, down from $66.2 million in the fourth quarter of 2016.
- The Crude Facilities segment was down nearly $5 million due to the absence of a fourth quarter 2016 take-or-pay adjustment.
- SemGroup reaffirmed its 2017 adjusted EBITDA guidance range of $270-310 million and expects an annualized fourth quarter 2017 adjusted EBITDA run rate of $325-340 million.
EnLink Midstream reported strong operational and financial results for 4Q and full-year 2017. The company exceeded its guidance targets for the year, including net income, adjusted EBITDA, distribution coverage, and leverage ratio. Operationally, the company increased volumes across its systems, with significant growth in the Delaware Basin and on its Oklahoma and Midland Basin assets. Looking ahead, EnLink is well positioned for continued growth due to rig activity by producer customers outpacing broader market trends and an inventory of opportunities across its asset portfolio.
This document provides guidance for EnLink Midstream's 2018 financial and operational performance. It begins with forward-looking statements and risk factors that could impact projections. The guidance projects adjusted EBITDA, distributable cash flow, debt levels, distribution coverage, capital expenditures, and segment profit. Non-GAAP terms are defined, including adjusted EBITDA and distributable cash flow.
InfraREIT provided its Q2 2016 results and supplemental information. It reported solid Q2 2016 performance with an increase in lease revenue and adjusted EBITDA in line with expectations. Cash available for distribution and non-GAAP EPS were also in line with expectations, reflecting the impact of higher interest expense and depreciation. InfraREIT has a focus on regulated transmission and distribution opportunities, maintaining a strong financial profile, and growing dividends. Sharyland's rate case filed in April 2016 is pending a preliminary order from the PUCT.
QTS Realty Trust presented its fourth quarter and full year 2020 earnings results. Key highlights included:
- Signed leasing activity in Q4 2020 was the highest on record for QTS and 40% higher than the prior year annual level.
- Full year 2020 revenue increased 12% year-over-year to $539 million.
- Adjusted EBITDA for 2020 was $299 million, an increase of 12% compared to 2019.
- 2021 guidance projects revenue growth of 12% and adjusted EBITDA growth also of 12% compared to 2020.
QTS' results demonstrated strong leasing momentum with record backlog entering 2021 to support continued growth.
QTS Realty Trust presented its fourth quarter and full year 2020 earnings results. Key highlights included:
- Signed leasing activity in Q4 2020 was the highest on record for QTS and 40% higher than the prior year annual level.
- Full year 2020 revenue increased 12% year-over-year to $539 million.
- Adjusted EBITDA for 2020 was $299 million, an increase of 12% compared to the previous year.
- 2021 guidance projects revenue growth of 12% and adjusted EBITDA growth also of 12% compared to 2020 results.
- QTS' development pipeline includes over 300 megawatts of new and expansion capital projects in 2021, primarily tied to signed le
May investor presentation earnings only 05 07-18 440 pmbmcstockholdings
BMC reported strong financial results in the first quarter of 2018, with net income growing $11.6 million to $15.4 million compared to the first quarter of 2017. Adjusted EBITDA increased $13.6 million to $47.2 million, driven by a 10.1% increase in total net sales. Gross profit dollars and margins improved due to a focus on value-added components and operational excellence initiatives. Management remains focused on unlocking productivity and efficiency to continue delivering profitable growth.
Calgary-based Mainstreet Equity Corp. has reviewed & recorded its 18th consecutive quarter of year-over-year double-digit growth in pre-tax funds from operations and net operating income.
In its second quarter for fiscal year 2015, pre-tax funds from operations were up 39 per cent to $6.9 million and FFO per basic share increased 26 per cent to 66 cents. Net operating income from continuing operations increased 20 per cent to $16.2 million, while growing 13 per cent to $15.2 million on a same asset basis.
- US Foods reported strong financial results for Q4 and FY 2016, with adjusted EBITDA growth of 12.5% for the full year.
- Volume growth, margin expansion, and five successful acquisitions contributed to the positive results.
- The company made progress on key strategic initiatives such as new product launches, food cost management, and efficiency improvements.
- Management reiterated mid-term guidance of 7-10% annual adjusted EBITDA growth and remains optimistic given favorable industry trends.
BMC Stock Holdings reported third quarter 2017 earnings. Net sales increased 7.3% to $881 million due to commodity price inflation, acquisitions, and a small amount of volume growth, despite hurricanes negatively impacting sales by $12-15 million. Adjusted EBITDA improved to $59.3 million from benefits of acquisitions, cost synergies, and operational improvements, partially offset by changes in sales days and hurricane impacts. The company is focused on adding higher-margin product capabilities and pursuing acquisition opportunities to drive long-term shareholder value.
InfraREIT reported its Q3 2015 results, showing strong performance in line with expectations. Key highlights include:
- Cash available for distribution grew 19% in Q3 2015 and 23% year-to-date compared to the prior year periods due to increased lease revenue and adjusted EBITDA.
- Adjusted EBITDA grew 9% in Q3 2015 and 12% year-to-date driven by growth in lease revenue.
- Long-term debt totaled $615 million with $334 million in available liquidity, including $305 million available under revolving credit facilities.
- The company's financing strategy focuses on acquiring regulated transmission and distribution assets, maintaining a strong balance sheet, and growing
This document provides an overview of SemGroup's non-GAAP financial measures and forward-looking statements. It discusses how SemGroup uses Adjusted EBITDA and Total Segment Profit to evaluate performance in addition to GAAP measures. It also notes that SemGroup's forward-looking statements are based on current expectations and are subject to risks and uncertainties. The document warns that actual results could differ materially from expectations.
This document provides an overview of SemGroup's non-GAAP financial measures and forward-looking statements. It summarizes SemGroup's 2017 results as a year of transition with the addition of stable refinery-facing assets and geographic diversification. It outlines 2018 as a year of executing the operating budget and strategic plan by streamlining operations and focusing on three high quality areas: Canada, Mid-Continent and Gulf Coast. The document also provides definitions of SemGroup's non-GAAP measures of Adjusted EBITDA and Total Segment Profit, which exclude certain items to improve comparability between reporting periods, and cautions that non-GAAP measures should not be considered in isolation.
The operations report discusses first quarter 2017 execution across EnLink's asset portfolio. Key highlights include expansion projects in Central Oklahoma bringing total processing capacity to nearly 1 Bcf/d by year-end. In the Delaware Basin, the Lobo system is expanding its capacity to 185 MMcf/d. The Ascension pipeline began operations in Louisiana. In the Midland Basin, the Chickadee crude oil gathering system became operational. Overall, EnLink continues focused execution across its integrated asset base.
InfraREIT provides a presentation on its business. It owns $1.1 billion in regulated electric transmission and distribution assets in Texas and the Southwest. It has a track record of growing its rate base from $60 million in 2009 to $1.1 billion currently through developing projects like the CREZ transmission system and pursuing acquisitions. InfraREIT expects to continue growing through developing additional projects from its pipeline with Hunt Consolidated and potentially acquiring other third party assets. It maintains a stable cash flow through long term leases of its regulated assets.
EnLink Midstream provides a strong operations report for May 3, 2016. The report discusses solid execution of their 2016 plan including meeting guidance targets and stable cash flows. It highlights their premier positions in key basins with high growth demand and confidence in their business model with quality customers and contracts. Segment performance showed growth in the Oklahoma segment from the Tall Oak acquisition and continued growth in the Permian region through expanding infrastructure.
SemGroup reported fourth quarter and full-year 2017 results. Key highlights include $111 million in Adjusted EBITDA for Q4 and $328 million for the full year. SemGroup also executed several strategic transactions including a $350 million preferred equity raise, selling its interest in Glass Mountain Pipeline for $300 million, and estimated proceeds of $140 million from selling SemMaterials Mexico and SemLogistics assets. SemGroup provided 2018 Adjusted EBITDA guidance of $385-$415 million and capital expenditures guidance of $40 million for maintenance spending.
This document contains forward-looking statements, disclaimers, and definitions related to CPI Card Group's financial reporting. It discusses risks and uncertainties inherent in forward-looking statements. It also provides context around non-GAAP financial measures reported by CPI Card Group and reconciliations to GAAP measures. The document establishes CPI Card Group as a North American leader in payment card solutions with leading market positions in key segments and an attractive financial profile supported by recurring revenue, industry trends, and operating leverage.
Similar to 2017 09 27 Wolfe_Final_Presentation (20)
ZKsync airdrop of 3.6 billion ZK tokens is scheduled by ZKsync for next week.pdfSOFTTECHHUB
The world of blockchain and decentralized technologies is about to witness a groundbreaking event. ZKsync, the pioneering Ethereum Layer 2 network, has announced the highly anticipated airdrop of its native token, ZK. This move marks a significant milestone in the protocol's journey, empowering the community to take the reins and shape the future of this revolutionary ecosystem.
UnityNet World Environment Day Abraham Project 2024 Press ReleaseLHelferty
June 12, 2024 UnityNet International (#UNI) World Environment Day Abraham Project 2024 Press Release from Markham / Mississauga, Ontario in the, Greater Tkaronto Bioregion, Canada in the North American Great Lakes Watersheds of North America (Turtle Island).
Methanex is the world's largest producer and supplier of methanol. We create value through our leadership in the global production, marketing and delivery of methanol to customers. View our latest Investor Presentation for more details.
The E-Way Bill revolutionizes logistics by digitizing the documentation of goods transport, ensuring transparency, tax compliance, and streamlined processes. This mandatory, electronic system reduces delays, enhances accountability, and combats tax evasion, benefiting businesses and authorities alike. Embrace the E-Way Bill for efficient, reliable transportation operations.
Cleades Robinson, a respected leader in Philadelphia's police force, is known for his diplomatic and tactful approach, fostering a strong community rapport.
World economy charts case study presented by a Big 4
World economy charts case
World economy charts case study presented by a Big 4
World economy charts case study presented by a Big 4World economy charts case study presented by a Big 4
World economy charts case study presented by a Big 4
World economy charts case study presented by a Big 4World economy charts case study presented by a Big 4World economy charts case study presented by a Big 4World economy charts case study presented by a Big 4World economy charts case study presented by a Big 4World economy charts case study presented by a Big 4World economy charts case study presented by a Big 4World economy charts case study presented by a Big 4World economy charts case study presented by a Big 4World economy charts case study presented by a Big 4World economy charts case study presented by a Big 4World economy charts case study presented by a Big 4World economy charts case study presented by a Big 4World economy charts case study presented by a Big 4study presented by a Big 4
2. 1
Safe Harbor
Forward Looking Statements
This presentation contains “forward-looking statements” about the business, financial performance, contracts, leases and prospects of InfraREIT, Inc. (the Company). Words
such as “could,” “will,” “may,” “assume,” “forecast,” “position,” “predict,” “strategy,” “guidance,” “outlook,” “target,” “expect,” “intend,” “plan,” “estimate,” “anticipate,” “believe,”
“project,” “budget,” “potential” or “continue” and similar expressions are used to identify forward-looking statements, although not all forward-looking statements contain such
identifying words. These forward-looking statements are based on management’s current expectations and assumptions about future events and are based on currently
available information as to the outcome and timing of future events. This presentation also contains forward-looking statements that have previously been publicly disclosed by
the Company. These previously disclosed forward-looking statements should not be deemed reaffirmed or updated by their inclusion in this presentation. The Company’s
actual results, performance or achievements could differ materially from those expressed or implied by any forward-looking statements made in connection with this
presentation, and in no event should the inclusion of forecasted information in this presentation be regarded as a representation by any person that the results contained
therein will be achieved. Statements about the Company’s expectations regarding the dismissal of the rate case, the consummation of the exchange transaction with Oncor
Electric Delivery Company LLC (Oncor), the benefits of the exchange transaction with Oncor, the Company’s anticipated financial and operating performance, including
projected or forecasted financial results, distributions to stockholders, capital expenditures, debt ratios, capitalization matters and other forecasted metrics, as well as any other
statements that are not historical facts in this presentation are forward-looking statements that involve certain risks and uncertainties, many of which are difficult to predict and
beyond the Company’s control. Factors that could cause actual results to differ materially from the results contemplated by such forward-looking statements include, without
limitation, the inability to complete the exchange transaction or achieve the dismissal of the rate case due to the failure to obtain required approvals, or other unsatisfied closing
conditions; the incurrence of unexpected liabilities or failure to achieve the expected benefits of the exchange transaction; the amount of available investment to grow the
Company’s rate base; decisions by regulators or changes in governmental policies or regulations with respect to the Company’s organizational structure, lease arrangements,
capitalization, acquisitions and dispositions of assets, recovery of investments, authorized rate of return and other regulatory parameters; the Company’s current reliance on its
tenant for all of its revenues and, as a result, the Company’s dependence on its tenant’s solvency and financial and operating performance; the effects of existing and future
tax and other laws and governmental regulations; the Company's failure to qualify or maintain its status as a real estate investment trust (REIT) or changes in the tax laws
applicable to REITs; and insufficient cash available to meet distribution requirements. When considering forward-looking statements, you should keep in mind the risk factors
and other cautionary statements described under the heading “Risk Factors” included in the Company’s filings with the U.S. Securities and Exchange Commission. Should
one or more of these risks or uncertainties materialize, or should underlying assumptions prove incorrect, actual results may vary materially from those indicated. Forward-
looking statements speak only as of the date made and reaffirmed, and the Company disclaims any obligation to update or revise any forward-looking statements, whether as
a result of new information, future events or otherwise, except as required by law.
Non-GAAP Legend
This presentation contains certain financial measures that are not recognized under generally accepted accounting principles (GAAP). InfraREIT’s management uses non-
GAAP measures as important supplemental measures of its operating performance. For example, management uses the cash available for distribution (CAD) measurement
when recommending dividends to its Board of Directors. These non-GAAP measures are also presented because management believes they help investors understand
InfraREIT’s business, performance and ability to earn and distribute cash to its stockholders by providing perspectives not immediately apparent from net income. InfraREIT
has a diverse set of investors, including investors that primarily focus on utilities, yieldcos, MLPs or REITs. Management believes that each of these different classes of
investors focus on different types of metrics in their evaluation of InfraREIT. For instance, many utility investors focus on earnings per share (EPS) and management believes
its presentation of non-GAAP earnings per share (Non-GAAP EPS) enables a better comparison to other utilities. Management believes it is appropriate to calculate and
provide these measures in order to be responsive to these investors. Including the reporting on these measures in InfraREIT’s public disclosures also ensures that this
information is available to all of InfraREIT’s investors. The presentation of Non-GAAP EPS; CAD; net income (loss) before interest expense, net, income tax expense,
depreciation and amortization (EBITDA); Adjusted EBITDA; funds from operations (FFO); and adjusted FFO (AFFO) in this presentation are not intended to be considered in
isolation or as a substitute for, or superior to, the financial information prepared and presented in accordance with GAAP. In addition, InfraREIT’s method of calculating these
measures may be different from methods used by other companies, and, accordingly, may not be comparable to similar measures as calculated by other companies that do
not use the same methodology as InfraREIT. Reconciliations of these measures to their most directly comparable GAAP measures are included in Schedules 1-5 to this
presentation.
3. Q2 Highlights and Recent Events
2
▪ Solid Q2 2017 performance; in line with expectations
Increases in both lease revenue (20 percent) and net income (10 percent)
Non-GAAP metrics no longer include adjustments for percentage rent
• Non-GAAP EPS of $0.20; consistent with prior year
• Cash available for distribution (CAD) of $13.6 million; 11 percent increase over prior
year
• Adjusted earnings before interest, taxes, depreciation and amortization (Adjusted
EBITDA) of $35.8 million; 13 percent increase over prior year
$39 million of capital expenditures
▪ SDTS closed $200 million senior secured term loan
▪ Reached agreement on proposed asset exchange transaction with Oncor
and rate case dismissal
▪ Hunt projects – Nogales Interconnection Project initiated an open
solicitation process in July 2017
4. Asset Exchange and Proposed
Rate Case Dismissal
3
▪ InfraREIT’s regulated subsidiary (SDTS), Sharyland and Oncor signed definitive
agreements to enter into an asset exchange
SDTS to exchange ~$400 million of Distribution assets for ~$380 million of Transmission
assets and ~$20 million of cash from Oncor
▪ In conjunction with the asset exchange, SDTS and Sharyland reached an
agreement with key parties regarding the proposed dismissal of the rate case
Key regulatory parameters will remain in place until the next rate case, which SDTS and
Sharyland have committed to file in 2020, based on a test year ending December 31,
2019
▪ Separately, Oncor entered into an agreement regarding the proposed settlement
of its rate case
▪ Assuming required approvals are received, the simultaneous closing of the
exchange transaction, dismissal of the SDTS and Sharyland rate case and the
effectiveness of the Oncor rate case settlement expected in Q4 2017
Key parties to each rate case support the proposed agreements
5. 4
InfraREIT’s New Footprint
Current Assets Assets Post-Exchange
PANHANDLEPANHANDLE
CELESTE
BRADY
STANTON
McALLEN
PERMIAN
BASIN
Transmission
Distribution
PERMIAN
BASIN
HOUSTON
SAN ANTONIO
AUSTIN
DALLAS
6. Pipeline of Hunt Projects
5
Additional U.S. –
Mexico DC Ties
Generation Interconnections
South Plains
Reinforcement
Southline
Transmission
Project
Cross Valley
Transmission Line
Golden Spread
Electric
Cooperative (GSEC)
Interconnection
Lubbock Power &
Light Interconnection
Under Development
Operational; Owned by
Sharyland Utilities, L.P.
As of August 2, 2017
Nogales DC Tie
7. Permian Region Total
Oil Production
6
1.02
1.19
1.35
1.63
1.88
2.03
2.25
2.34
2011 2012 2013 2014 2015 2016 Q1 2017 Q2 2017
Millions barrels (bbls) / day (1)
Change in Annual Average
bbls/day 2011-2016
2012 vs. 2011 16.8%
2013 vs. 2012 14.0%
2014 vs. 2013 20.4%
2015 vs. 2014 15.0%
2016 vs. 2015 8.2%
Change in Quarterly
Average bbls/day 2016-2017
Q1 2016 vs. Q4 2015 2.5%
Q2 2016 vs. Q1 2016 1.9%
Q3 2016 vs. Q2 2016 2.5%
Q4 2016 vs. Q3 2016 4.0%
Q1 2017 vs. Q4 2016 5.8%
Q2 2017 vs. Q1 2017 4.3%
(1) Represents the average bbls/day of the respective time period from the U.S. EIA Monthly Drilling
Productivity Report for the Permian Basin released July 17, 2017
8. Interconnections Agreements
for Panhandle Wind Generation
7
208 208
1,278
2,672
3,429
4,197 4,197 4,197
460 829
1,298200
3,394
3,894
208 MW 208 MW
1,278 MW
2,672 MW
3,429 MW
4,857 MW
8,420 MW
9,389 MW
0 MW
2,000 MW
4,000 MW
6,000 MW
8,000 MW
10,000 MW
2012 2013 2014 2015 2016 2017 2018 2019
Cumulative MW Installed IA Signed - Financial Security Posted IA Signed - No Financial Security
Source: ERCOT – Spring 2017 Final Seasonal Assessment of Resource Adequacy and Generation Interconnection Status Report (March 2017)
9. 8
InfraREIT’s Investment Highlights
Post-Asset Exchange
Attractive Asset
Portfolio
Strong Track
Record
Stable Cash Flow
» $1.4 billion in regulated electric transmission and wholesale distribution
assets (rate base)
» Increased rate base from $60 million in 2009 to $1.4 billion in 2017
» Successfully developed 300 miles and 4 substations in the CREZ
transmission system
» 100 percent of revenue driven by regulated asset base
» 90 percent of assets in transmission, remainder in wholesale distribution
(no end-use retail customers)
» Constructive regulatory framework in Texas
» Ability to do interim transmission rate filings minimizing regulatory lag
Constructive
Regulation
Strong Sponsor
Growth
Opportunities
» Hunt has long-term track record and relationships in Texas and the
Southwest
» High alignment between Hunt and other stakeholders
» Pro-business, high-growth state with growing infrastructure needs in West
and South Texas
» Well-positioned relative to future expansion of wind and solar generation
in the Panhandle, West Texas and South Plains
» Pipeline of projects with Hunt Developer
10. Timeline to Completion
9
▪ Key Events
Hart-Scott-Rodino - received early termination of waiting period on
August 22, 2017
U.S. Bankruptcy Court Consent (Oncor parent company proceeding) -
received September 15, 2017
PUCT approvals – PUCT Open Meeting agenda item scheduled for
September 28, 2017:
• Approval of the Joint Sale-Transfer-Merger (STM) for the asset exchange
• SDTS and Sharyland rate case dismissal
• Oncor rate case settlement
Other approvals (Lenders, etc.)
▪ Expect to receive all approvals, complete the asset exchange and
dismiss the rate case in a simultaneous closing in Q4 2017
11. Q2 2017 Performance Summary
$ millions, except per share amounts
10
Growth in lease revenue in line with expectations; net income lower than expected due to increased general and
administrative expense related to the proposed exchange transaction
Net Income Attributable to InfraREIT, Inc.
Common Stockholders Per Share
$0.15
$0.17
Q2 2016 Q2 2017
Lease Revenue
$33.8
$40.4
Q2 2016 Q2 2017
+20%
Net Income
$9.2
$10.1
Q2 2016 Q2 2017
+10%
+13%
12. Q2 2017 Performance Summary
$ millions, except per share amounts
11
Non-GAAP results flat to up versus 2016 and in line with expectations
Cash Available for Distribution
$12.2
$13.6
Q2 2016 Q2 2017
Non-GAAP EPS
$0.20 $0.20
Q2 2016 Q2 2017
Adjusted EBITDA
$31.8
$35.8
Q2 2016 Q2 2017
+13%
+11%
13. June YTD 2017 Performance Summary
$ millions, except per share amounts
12
Growth in lease revenue in line with expectations; net income lower than expected due to increased general and
administrative expense related to regulatory matters and the proposed exchange transaction
Net Income Attributable to InfraREIT, Inc.
Common Stockholders Per Share
$0.30
$0.35
YTD 2016 YTD 2017
Lease Revenue
$67.5
$80.0
YTD 2016 YTD 2017
+19%
Net Income
$18.0
$21.1
YTD 2016 YTD 2017
+17%
+17%
14. June YTD 2017 Performance Summary
$ millions, except per share amounts
13
Non-GAAP results flat to up versus 2016 and in line with expectations
Cash Available for Distribution
$24.6 $26.7
YTD 2016 YTD 2017
Non-GAAP EPS
$0.40 $0.40
YTD 2016 YTD 2017
Adjusted EBITDA
$62.9
$70.4
YTD 2016 YTD 2017
+12%
+9%
15. Drivers of Non-GAAP EPS Metric
$ millions
14
$12.1
6.6
2.7
1.6
1.9
1.9
1.1
1.0
$12.4
5
7
9
11
13
15
17
19
21
Q2 2016
Non-GAAP
Net Income
Lease
Revenue
Base Rent
Adjustment
Depreciation G&A Transaction
Costs
Other
Income, net
Interest
Expense
Q2 2017
Non-GAAP
Net Income
-
-
-
-
-
Q2 2017 vs. Q2 2016
(1) The sum of the Non-GAAP Net Income items may not equal due to rounding
(1)
16. Drivers of Non-GAAP EPS Metric
$ millions
15
$24.0
12.5
4.7
3.2
2.3
1.9
1.9
1.9
$24.4
5
10
15
20
25
30
35
40
2016 YTD
Non-GAAP
Net Income
Lease
Revenue
Base Rent
Adjustment
Depreciation G&A Transaction
Costs
Other
Income, net
Interest
Expense
2017 YTD
Non-GAAP
Net Income
-
-
- -
-
2017 YTD vs. 2016 YTD
17. Non-GAAP EPS Calculation Change
16
▪ InfraREIT’s calculation of Non-GAAP EPS no longer includes an
adjustment for percentage rent
Does not impact total year Non-GAAP EPS
Changes the quarterly profile of Non-GAAP EPS
▪ Percentage rent revenue is only recognized once Sharyland’s
revenue has exceeded an annual specified breakpoint in the
leases – generally occurs in the third quarter of each year
Q3 and Q4 Non-GAAP EPS generally expected to be higher than Q1
and Q2 Non-GAAP EPS in each year, with little to no percentage rent
recognized in Q1 and Q2 of each year and largest amounts
recognized in Q3 and Q4
18. $0.14 $0.15
$0.39
$0.46
$1.14
$0.19 $0.20
$0.37
$0.45
$1.21
Q1 2016 Q2 2016 Q3 2016 Q4 2016 2016 Total
EPS Non-GAAP EPS
Updated Non-GAAP EPS Metric
2016 Quarterly Results
17
EPS and Non-GAAP EPS have similar quarterly earnings profiles when Non-GAAP EPS
does not include a percentage rent adjustment
As currently calculated, >65% of Non-GAAP EPS occurred in the second half of 2016
19. Updated Non-GAAP EPS Metric
2017 vs. 2016 Non-GAAP EPS Quarterly Comparison
18
$0.19 $0.20
$0.37
$0.45
$1.21
$0.20 $0.20
Q1 Q2 Q3 Q4 Total
2016 Non-GAAP EPS 2017 Non-GAAP EPS
2017 Non-GAAP EPS performance in line with 2016 results and expectations
20. 2017E – 2019E Footprint Capital Expenditures
Transmission Only
19
Transmission capex guidance range of $185 million – $315 million for 2017 – 2019
Long-term opportunities tied to generation interconnections and renewables expansion, regional
growth and new projects required to improve reliability and relieve congestion
$ millions 2017 2018 2019
Base Footprint Capex $35 - $55 $35 - $65 $10 - $35
Synchronous
Condensers & Second
Circuit
$95 - $105 $10 - $30 $0 - $25
Total Footprint Capex $130 - $160 $45 - $95 $10 - $60
21. Growth and Financing Strategy
20
Focus on
Regulated
Asset
Opportunities
Maintain Strong
Financial Profile
Grow
Dividends
► Sign long-term leases that reflect regulated
rate structure
► Construct Footprint Projects
► Opportunistically acquire regulated assets
► Maintain significant liquidity to support
capex plan and financial flexibility
► Maintain 55 percent debt to capitalization
at InfraREIT’s regulated subsidiary, SDTS
► Target consolidated credit metrics of
60 percent debt to capitalization and
12 percent AFFO to debt
23. Schedule 1:
Explanation and Reconciliation of Non-GAAP EPS
Q2 2017 vs. Q2 2016
22
Changes to Non-GAAP Metrics
The Company is adjusting its non-GAAP performance measures as of June 30, 2017 to exclude the adjustment for percentage rent previously
reported by the Company. Historically, the percentage rent adjustment reflected a quarterly, not annual, adjustment for the difference between
the amount of percentage rent payments the Company expected to receive with respect to the applicable period and the amount of percentage
rent the Company recognized under GAAP during the period. Accordingly, all non-GAAP performance measures for periods previously
presented have been adjusted to remove the effects of the percentage rent adjustment for the respective period. In addition, this quarter, the
Company added an adjustment for the transaction costs related to the proposed exchange transaction with Oncor.
($ thousands, except per share amounts)
Q2 2017
Amount Per Share (3)
Q2 2016
Amount Per Share (4)
Net income attributable to InfraREIT, Inc. $ 7,308 $ 0.17 $ 6,608 $ 0.15
Net income attributable to noncontrolling interest 2,821 0.17 2,576 0.15
Net income 10,129 0.17 9,184 0.15
Base rent adjustment (1) 342 — 2,963 0.05
Transaction costs (2) 1,937 0.03 — —
Non-GAAP net income $ 12,408 $ 0.20 $ 12,147 $ 0.20
Non-GAAP EPS
InfraREIT defines non-GAAP net income as net income (loss) adjusted in a manner the Company believes is appropriate to show its core
operational performance, including an adjustment for the difference between the amount of base rent payments that the Company receives with
respect to the applicable period and the amount of straight-line base rent recognized under GAAP and an adjustment for the transaction costs
related to the proposed exchange transaction with Oncor. The Company defines Non-GAAP EPS as non-GAAP net income (loss) divided by
the weighted average shares outstanding calculated in the manner described in the footnotes below.
The following table sets forth a reconciliation of net income attributable to InfraREIT, Inc. per diluted share to Non-GAAP EPS for the three
months ended June 30, 2017 and 2016:
24. Schedule 1:
Explanation and Reconciliation of Non-GAAP EPS
YTD 2017 vs. YTD 2016
23
Non-GAAP EPS
The following table sets forth a reconciliation of net income attributable to InfraREIT, Inc. per diluted share to Non-GAAP EPS for
the six months ended June 30, 2017 and 2016:
($ thousands, except per share amounts)
YTD 2017
Amount Per Share (3)
YTD 2016
Amount Per Share (4)
Net income attributable to InfraREIT, Inc. $ 15,257 $ 0.35 $ 12,923 $ 0.30
Net income attributable to noncontrolling interest 5,889 0.35 5,038 0.30
Net income 21,146 0.35 17,961 0.30
Base rent adjustment (1) 1,299 0.02 5,998 0.10
Transaction costs (2) 1,937 0.03 — —
Non-GAAP net income $ 24,382 $ 0.40 $ 23,959 $ 0.40
25. 24
Schedule 1:
Explanation and Reconciliation of Non-GAAP EPS
(1) This adjustment relates to the difference between the timing of cash base rent payments made under the Company’s leases and
when the Company recognizes base rent revenue under GAAP. The Company recognizes base rent on a straight-line basis over
the applicable term of the lease commencing when the related assets are placed in service, which is frequently different than the
period in which the cash rent becomes due.
(2) This adjustment reflects the transaction costs related to the proposed exchange transaction with Oncor. These costs are
exclusive of the Company’s routine business operations or typical rate case costs and have been excluded to present additional
insights on InfraREIT’s core operations.
(3) The weighted average common shares outstanding of 43.8 million was used to calculate net income attributable to InfraREIT, Inc.
per diluted share. The weighted average redeemable partnership units outstanding of 16.9 million was used to calculate the net
income attributable to noncontrolling interest per share. The combination of the weighted average common shares and
redeemable partnership units outstanding of 60.7 million was used for the remainder of the per share calculations.
(4) The weighted average common shares outstanding of 43.6 million was used to calculate net income attributable to InfraREIT, Inc.
per diluted share. The weighted average redeemable partnership units outstanding of 17.0 million was used to calculate the net
income attributable to noncontrolling interest per share. The combination of the weighted average common shares and
redeemable partnership units outstanding of 60.6 million was used for the remainder of the per share calculations.
26. Schedule 2:
Explanation and Reconciliation of CAD
Q2 2017 vs. Q2 2016
25
CAD
The Company defines CAD in a manner that it believes is appropriate to show its core operational performance, which includes a
deduction of the portion of capital expenditures needed to maintain its net assets. This deduction equals depreciation expense
within the applicable period. The portion of the capital expenditures in excess of depreciation, which the Company refers to as
growth capital expenditures, will increase the Company’s net assets. The CAD calculation also includes various other
adjustments from net income, as outlined below and described in more detail on Schedules 1, 3 and 4.
The following table sets forth a reconciliation of net income to CAD for the three months ended June 30, 2017 and 2016:
(1) See footnote (1) on Schedule 1 on Explanation and Reconciliation on Non-GAAP EPS
(2) See footnote (2) on Schedule 1 on Explanation and Reconciliation on Non-GAAP EPS
(3) Includes allowance for funds used during construction (AFUDC) on other funds of $1.1 million for the three months ended
June 30, 2016. There were no AFUDC on other funds recorded during the three months ended June 30, 2017.
($ thousands) Q2 2017 Q2 2016
Net income $ 10,129 $ 9,184
Depreciation 12,982 11,410
Base rent adjustment (1) 342 2,963
Amortization of deferred financing costs 1,026 1,004
Non-cash equity compensation 145 228
Transaction costs (2) 1,937 —
Other income, net (3) (17) (1,137)
Capital expenditures to maintain net assets (12,982) (11,410)
CAD $ 13,562 $ 12,242
27. Schedule 2:
Explanation and Reconciliation of CAD
YTD 2017 vs. YTD 2016
26
CAD
The following table sets forth a reconciliation of net income to CAD for the six months ended June 30, 2017 and 2016:
(1) See footnote (1) on Schedule 1 on Explanation and Reconciliation on Non-GAAP EPS
(2) See footnote (2) on Schedule 1 on Explanation and Reconciliation on Non-GAAP EPS
(3) Includes allowance for funds used during construction (AFUDC) on other funds of $1.9 million for the six months ended
June 30, 2016. There were no AFUDC on other funds recorded during the six months ended June 30, 2017.
($ thousands) YTD 2017 YTD 2016
Net income $ 21,146 $ 17,961
Depreciation 25,669 22,484
Base rent adjustment (1) 1,299 5,998
Amortization of deferred financing costs 2,030 2,007
Non-cash equity compensation 285 520
Transaction costs (2) 1,937 —
Other income, net (3) (20) (1,896)
Capital expenditures to maintain net assets (25,669) (22,484)
CAD $ 26,677 $ 24,590
28. Schedule 3:
Explanation and Reconciliation of EBITDA
and Adjusted EBITDA
Q2 2017 vs. Q2 2016
27
EBITDA and Adjusted EBITDA
InfraREIT defines EBITDA as net income (loss) before interest expense, net; income tax expense; depreciation and amortization.
Adjusted EBITDA is defined as EBITDA adjusted in a manner the Company believes is appropriate to show its core operational
performance, including: (a) an adjustment for the difference between the amount of base rent payments that the Company receives
with respect to the applicable period and the amount of straight-line base rent recognized under GAAP; (b) an adjustment for the
transaction costs related to the proposed exchange transaction with Oncor; and (c) adjusting for other income (expense), net.
The following table sets forth a reconciliation of net income to EBITDA and Adjusted EBITDA for the three months ended
June 30, 2017 and 2016:
(1) See footnote (1) on Schedule 1 on Explanation and Reconciliation of Non-GAAP EPS
(2) See footnote (2) on Schedule 1 on Explanation and Reconciliation of Non-GAAP EPS
(3) See footnote (3) on Schedule 2 on Explanation and Reconciliation of CAD
($ thousands) Q2 2017 Q2 2016
Net income $ 10,129 $ 9,184
Interest expense, net 10,141 9,055
Income tax expense 321 293
Depreciation 12,982 11,410
EBITDA 33,573 29,942
Base rent adjustment (1) 342 2,963
Transaction costs (2) 1,937 —
Other income, net (3) (17) (1,137)
Adjusted EBITDA $ 35,835 $ 31,768
29. Schedule 3:
Explanation and Reconciliation of EBITDA
and Adjusted EBITDA
YTD 2017 vs. YTD 2016
28
EBITDA and Adjusted EBITDA
The following table sets forth a reconciliation of net income to EBITDA and Adjusted EBITDA for the six months ended
June 30, 2017 and 2016:
(1) See footnote (1) on Schedule 1 on Explanation and Reconciliation of Non-GAAP EPS
(2) See footnote (2) on Schedule 1 on Explanation and Reconciliation of Non-GAAP EPS
(3) See footnote (3) on Schedule 2 on Explanation and Reconciliation of CAD
($ thousands) YTD 2017 YTD 2016
Net income $ 21,146 $ 17,961
Interest expense, net 19,839 17,897
Income tax expense 565 479
Depreciation 25,669 22,484
EBITDA 67,219 58,821
Base rent adjustment (1) 1,299 5,998
Transaction costs (2) 1,937 —
Other income, net (3) (20) (1,896)
Adjusted EBITDA $ 70,435 $ 62,923
30. 29
Schedule 4:
Explanation and Reconciliation of FFO and AFFO
Q2 2017 vs. Q2 2016
FFO and AFFO
The National Association of Real Estate Investment Trusts (NAREIT) defines FFO as net income (computed in accordance with
GAAP), excluding gains and losses from sales of property (net) and impairments of depreciated real estate, plus real estate
depreciation and amortization (excluding amortization of deferred financing costs) and after adjustments for unconsolidated
partnerships and joint ventures. Applying the NAREIT definition to the Company’s consolidated financial statements, which is the
basis for the FFO and the reconciliations below, results in FFO representing net income (loss) before depreciation, impairment of
assets and gain (loss) on sale of assets. FFO does not represent cash generated from operations as defined by GAAP and it is not
indicative of cash available to fund all cash needs, including distributions.
AFFO is defined as FFO adjusted in a manner the Company believes is appropriate to show its core operational performance,
including: (a) an adjustment for the difference between the amount of base rent payments that the Company receives with respect to
the applicable period and the amount of straight-line base rent recognized under GAAP; (b) an adjustment for the transaction costs
related to the proposed exchange transaction with Oncor; and (c) adjusting for other income (expense), net.
The following table sets forth a reconciliation of net income to FFO and AFFO for the three months ended June 30, 2017 and 2016:
($ thousands) Q2 2017 Q2 2016
Net income $ 10,129 $ 9,184
Depreciation 12,982 11,410
FFO 23,111 20,594
Base rent adjustment (1) 342 2,963
Transaction costs (2) 1,937 —
Other income, net (3) (17) (1,137)
AFFO $ 25,373 $ 22,420
(1) See footnote (1) on Schedule 1 on Explanation and Reconciliation of Non-GAAP EPS
(2) See footnote (2) on Schedule 1 on Explanation and Reconciliation of Non-GAAP EPS
(3) See footnote (3) on Schedule 2 on Explanation and Reconciliation of CAD
31. Schedule 4:
Explanation and Reconciliation of FFO & AFFO
YTD 2017 vs. YTD 2016
30
FFO and AFFO
The following table sets forth a reconciliation of net income to FFO and AFFO for the six months ended June 30, 2017 and 2016:
(1) See footnote (1) on Schedule 1 on Explanation and Reconciliation of Non-GAAP EPS
(2) See footnote (2) on Schedule 1 on Explanation and Reconciliation of Non-GAAP EPS
(3) See footnote (3) on Schedule 2 on Explanation and Reconciliation of CAD
($ thousands) YTD 2017 YTD 2016
Net income $ 21,146 $ 17,961
Depreciation 25,669 22,484
FFO 46,815 40,445
Base rent adjustment (1) 1,299 5,998
Transaction costs (2) 1,937 —
Other income, net (3) (20) (1,896)
AFFO $ 50,031 $ 44,547
32. Schedule 5:
Explanation and Reconciliation of Non-GAAP EPS
2016 Quarterly and Full Year
31
2016 Non-GAAP EPS
The following tables set forth a reconciliation of net income attributable to InfraREIT, Inc. per diluted share to Non-GAAP EPS for
each quarter of 2016:
($ thousands, except per share amounts)
Q1 2016
Amount Per Share (2)
Q2 2016
Amount Per Share (2)
Net income attributable to InfraREIT, Inc. $ 6,315 $ 0.14 $ 6,608 $ 0.15
Net income attributable to noncontrolling interest 2,462 0.14 2,576 0.15
Net income 8,777 0.14 9,184 0.15
Base rent adjustment (1) 3,035 0.05 2,963 0.05
Non-GAAP net income $ 11,812 $ 0.19 $ 12,147 $ 0.20
($ thousands, except per share amounts)
Q3 2016
Amount Per Share (3)
Q4 2016
Amount Per Share (3)
Net income attributable to InfraREIT, Inc. $ 17,041 $ 0.39 $ 19,990 $ 0.46
Net income attributable to noncontrolling interest 6,560 0.39 7,749 0.46
Net income 23,601 0.39 27,739 0.46
Base rent adjustment (1) (1,396) (0.02) (567) (0.01)
Non-GAAP net income $ 22,205 $ 0.37 $ 27,172 $ 0.45
33. Schedule 5:
Explanation and Reconciliation of Non-GAAP EPS
2016 Quarterly and Full Year
32
2016 Non-GAAP EPS
The following table sets forth a reconciliation of net income attributable to InfraREIT, Inc. per diluted share to Non-GAAP EPS for
the full year of 2016:
($ thousands, except per share amounts)
Full Year 2016
Amount Per Share (4)
Net income attributable to InfraREIT, Inc. $ 49,954 $ 1.14
Net income attributable to noncontrolling interest 19,347 1.14
Net income 69,301 1.14
Base rent adjustment (1) 4,035 0.07
Non-GAAP net income $ 73,336 $ 1.21
(1) See footnote (1) on Schedule 1 on Explanation and Reconciliation of Non-GAAP EPS
(2) The weighted average common shares outstanding of 43.6 million was used to calculate net income attributable to InfraREIT, Inc.
per diluted share. The weighted average redeemable partnership units outstanding of 17.0 million was used to calculate the net
income attributable to noncontrolling interest per share. The combination of the weighted average common shares and
redeemable partnership units outstanding of 60.6 million was used for the remainder of the per share calculations.
(3) The weighted average common shares outstanding of 43.7 million was used to calculate net income attributable to InfraREIT, Inc.
per diluted share. The weighted average redeemable partnership units outstanding of 16.9 million was used to calculate the net
income attributable to noncontrolling interest per share. The combination of the weighted average common shares and
redeemable partnership units outstanding of 60.6 million was used for the remainder of the per share calculations.
(4) The weighted average common shares outstanding of 43.6 million was used to calculate net income attributable to InfraREIT, Inc.
per diluted share. The weighted average redeemable partnership units outstanding of 17.0 million was used to calculate the net
income attributable to noncontrolling interest per share. The combination of the weighted average common shares and
redeemable partnership units outstanding of 60.6 million was used for the remainder of the per share calculations.
35. Strategic Rationale and Advantages of
Exchange Transaction
34
▪ Support Sharyland’s mission of providing safe, reliable and affordable
power to its customers
Sharyland’s distribution customers will become Oncor’s customers and move
to Oncor’s rates after closing
Transaction will result in a significant reduction in rates for all of Sharyland’s
retail distribution customer classes
▪ Provide a productive resolution to SDTS and Sharyland’s pending rate
case
Maintain existing regulatory framework and regulatory metrics until the next
rate case
File a new rate case as a stand-alone transmission service provider in 2020
based on a 2019 test year
▪ Strategic focus on the long-term growth of InfraREIT’s transmission
business
36. Hunt Projects (1)
As of August 2, 2017
35
Project State Net Plant
Golden Spread TX ~ $90 mm
Cross Valley TX ~ $170 mm
Project State Status
Generation Interconnections TX Development
South Plains / LP&L Integration TX Development
Nogales – DC Tie AZ Development
Southline AZ – NM Development
Construction or Development Projects
Assets in Operation
(1) InfraREIT holds a right of first offer applicable to many, but not all, of Hunt’s development projects. However, Hunt has informed InfraREIT that it intends for
InfraREIT to be the primary owner of its development projects as they are completed and placed in service.
37. Debt Obligations and Liquidity
$ millions
36
Long-Term Debt (rate / maturity)
Outstanding
As of
June 30, 2017
TDC – Senior Secured Notes (8.50% / December 30, 2020) $ 16.9
SDTS – Senior Secured Notes (5.04% / June 20, 2018) 60.0
SDTS – Senior Secured Term Loan (2.33% / June 5, 2020) 200.0
SDTS – Senior Secured Notes, Series A (3.86% / December 3, 2025) 400.0
SDTS – Senior Secured Notes, Series B (3.86% / January 14, 2026) 100.0
SDTS – Senior Secured Notes (7.25% / December 30, 2029) 41.6
SDTS – Senior Secured Notes (6.47% / September 30, 2030) 95.1
Total $ 913.6
Liquidity Facilities Amount
Outstanding
As of
June 30, 2017 Available
InfraREIT Partners Revolver $ 75.0 $ — $ 75.0
SDTS Revolver 250.0 — 250.0
Total $ 325.0 $ — $ 325.0
Cash (as of June 30, 2017) 9.7
Total Available Liquidity $ 334.7
38. 37
Structure Mechanics
SDTS (2)
SDTS owns our
regulated assets and
leases them to
Sharyland
Sharyland collects rate-
regulated revenue from
other utilities and retail
electric providers
Sharyland makes regular
lease payments to SDTS
InfraREIT pays dividends
to stockholders
1
2
3
4
Shareholders
InfraREIT (1)
Hunt Family
Sharyland
Utilities
Customers
Regulated Services Cash
Lease
Rent
1
2
3
4
▪ Ownership (3)
▪ Hunt Manager
▪ Hunt Developer
100% Interest
(1) Represents InfraREIT, Inc., InfraREIT Partners, LP (Operating Partnership) and Transmission and Distribution Company, L.L.C. (TDC)
(2) Represents Sharyland Distribution & Transmission Services, L.L.C. (SDTS)
(3) Represents Hunt Transmission Services, L.L.C. (limited partner of the Operating Partnership, shareholder of InfraREIT and Hunt Developer)
Conducted business as a REIT since 2010
Hunt
Consolidated,
Inc.
39. 38
Governance and Management
Board Structure
Management
Related Party
Transactions
Management
Agreement
» 9 total members, 6 independent
» CEO, CFO and General Counsel are officers of InfraREIT and Hunt
Manager; InfraREIT’s CEO is also CEO of Sharyland
» Require majority approval by the independent board members (i.e.
Hunt project acquisitions)
» Responsible for the day-to-day business and legal activities of
InfraREIT
» Annual base fee equal to $14.2 million for April 1, 2017 through
March 31, 2018 representing 1.50% of total book equity as of year-
end 2016
◊ Capped at $30 million per year
» Incentive fee equal to 20% of quarterly dividends per share in excess
of the threshold distribution amount payable quarterly
◊ 2017 dividend per share: $0.25
◊ Threshold dividend: $0.27