Encuesta a niños y adolescentes sobre la radio y televisión peruana 2014 | Por ciudades
•
0 likes•299 views

Encuesta realizada por el Consejo Consultivo de Radio y Televisión (Concortv) a niños y adolescentes sobre la radio y televisión peruana 2014. Encuesta por ciudades. Educación Mediática ► http://www.mundoacesp.org/

Recommended
More Related Content
Similar to Encuesta a niños y adolescentes sobre la radio y televisión peruana 2014 | Por ciudades
Similar to Encuesta a niños y adolescentes sobre la radio y televisión peruana 2014 | Por ciudades (20)
Recently uploaded
Recently uploaded (20)
Encuesta a niños y adolescentes sobre la radio y televisión peruana 2014 | Por ciudades
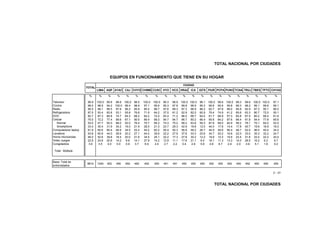
- 1. LIMA AQP AYAC CAJ CHYO CHIMB CUSC HYO HCO HRAZ ICA IQTS PIUR PCPA PUNO TCNA TRUJ TBES TPTO CHYAS % % % % % % % % % % % % % % % % % % % % % Televisor 99.9 100.0 99.8 99.8 100.0 98.5 100.0 100.0 99.3 98.9 100.0 100.0 99.1 100.0 99.8 100.0 99.3 99.6 100.0 100.0 97.1 Cocina 98.5 98.9 94.2 100.0 96.4 98.9 97.1 95.6 95.3 97.8 99.8 96.9 95.3 99.8 95.6 95.8 99.3 98.2 99.1 99.6 99.1 Radio 95.5 96.1 96.5 97.8 96.2 85.9 85.4 98.7 97.6 99.3 97.3 96.9 86.2 92.7 97.8 98.0 95.8 92.9 87.3 95.1 96.0 Refrigeradora 87.5 93.4 83.8 53.1 55.8 76.6 71.9 64.2 37.5 61.2 52.9 82.0 62.9 79.4 74.9 41.2 85.6 63.3 80.7 72.0 55.1 DVD 82.7 87.3 66.8 74.7 64.2 68.2 64.2 72.4 83.4 71.2 96.0 68.7 64.0 61.7 66.9 57.3 65.8 67.5 60.2 66.4 61.6 Celular 75.5 72.2 77.4 99.6 67.1 90.5 89.4 99.3 94.7 94.7 96.7 80.2 66.4 95.8 84.2 97.6 68.4 91.8 94.4 77.8 65.6 Normal 53.0 47.7 50.0 68.0 52.0 76.4 75.7 94.2 74.3 75.2 58.2 63.8 55.3 87.8 68.0 92.9 58.2 76.1 75.1 64.0 52.0 Smartphone 33.4 35.4 31.9 34.2 16.0 21.9 28.5 21.3 23.7 29.3 42.9 19.8 12.0 44.0 17.8 14.4 17.8 40.7 19.6 18.9 16.0 Computadora/ laptop 61.9 65.6 60.4 46.9 34.0 53.2 54.2 62.2 55.4 50.3 56.9 48.2 26.7 44.9 49.6 56.4 48.7 52.0 46.0 40.4 34.0 Lavadora 53.8 60.9 44.0 29.6 20.2 27.1 44.0 35.6 22.2 27.9 37.8 33.3 23.6 34.7 20.2 16.6 22.0 33.0 35.3 32.2 24.7 Horno microondas 46.0 52.6 39.8 18.4 20.0 21.6 34.5 25.1 22.2 17.3 27.8 30.2 12.2 19.9 12.2 19.5 22.4 31.6 22.0 22.2 20.4 Video Juegos 22.9 24.8 20.6 14.2 9.8 14.1 27.9 14.2 12.9 11.1 17.8 21.1 6.0 18.1 11.3 13.3 14.0 28.5 16.2 6.2 6.7 Congeladora 3.6 3.5 4.0 0.0 0.9 3.7 6.9 2.4 2.7 2.2 0.4 2.9 5.8 4.6 6.7 2.9 2.0 4.9 5.1 1.6 0.2 Total : Múltiple Base: Total de entrevistados 9814 1240 452 450 450 462 452 450 451 451 450 450 450 452 450 452 450 452 450 450 450 C - 01 TOTAL NACIONAL POR CIUDADES CIUDAD EQUIPOS EN FUNCIONAMIENTO QUE TIENE EN SU HOGAR TOTAL TOTAL NACIONAL POR CIUDADES
- 2. LIMA AQP AYAC CAJ CHYO CHIMB CUSC HYO HCO HRAZ ICA IQTS PIUR PCPA PUNO TCNA TRUJ TBES TPTO CHYAS % % % % % % % % % % % % % % % % % % % % % TV pagada 75.0 84.2 55.8 41.6 40.2 40.9 49.1 35.3 34.6 43.2 55.8 50.0 52.7 43.4 36.9 27.4 39.6 47.8 52.4 81.1 38.7 Internet dedicado 50.5 56.3 49.8 19.3 17.3 34.4 43.4 23.3 26.6 33.5 38.7 37.8 7.6 35.8 17.1 15.0 30.2 43.1 30.9 27.1 12.4 Teléfono fijo 43.4 48.3 30.8 8.7 13.6 30.7 44.9 21.8 26.6 21.5 20.2 33.1 32.9 33.6 21.1 14.2 11.8 38.9 12.7 19.6 4.7 Ninguno 20.1 12.9 38.1 57.3 56.7 37.2 33.8 58.2 53.7 50.8 37.8 41.3 36.9 44.7 53.6 67.7 47.1 32.5 39.8 17.1 60.0 Total : Múltiple Base: Total de entrevistados 9814 1240 452 450 450 462 452 450 451 451 450 450 450 452 450 452 450 452 450 450 450 C - 02 LIMA AQP AYAC CAJ CHYO CHIMB CUSC HYO HCO HRAZ ICA IQTS PIUR PCPA PUNO TCNA TRUJ TBES TPTO CHYAS % % % % % % % % % % % % % % % % % % % % % TELEVISOR Ningún televisor 0.1 0.0 0.2 0.2 0.0 1.5 0.0 0.0 0.4 1.1 0.0 0.0 1.1 0.0 0.2 0.0 0.7 0.4 0.0 0.0 2.7 1 televisor 51.2 49.4 54.4 73.8 72.0 56.1 29.6 39.1 51.7 58.8 83.8 49.8 78.9 86.5 64.0 45.1 50.9 27.7 86.4 72.4 70.0 2 televisores 31.4 32.3 33.2 21.3 21.1 28.4 40.7 42.7 33.0 34.4 14.0 23.3 11.8 10.0 33.6 36.7 31.6 38.5 11.8 24.0 22.7 3 televisores 12.5 13.2 11.3 4.4 4.0 10.2 16.8 15.3 12.0 5.1 2.2 18.2 6.4 3.5 2.2 11.3 11.6 21.2 1.3 2.0 3.8 4 televisores 3.6 3.7 0.9 0.2 1.6 2.6 10.8 2.2 2.2 0.7 0.0 6.7 1.3 0.0 0.0 5.3 4.7 9.3 0.4 1.3 0.7 5 televisores 0.6 0.6 0.0 0.0 0.9 1.1 2.0 0.7 0.7 0.0 0.0 2.0 0.4 0.0 0.0 1.1 0.7 2.4 0.0 0.2 0.2 6 televisores 0.6 0.8 0.0 0.0 0.4 0.2 0.0 0.0 0.0 0.0 0.0 0.0 0.0 0.0 0.0 0.4 0.0 0.4 0.0 0.0 0.0 Promedio 1.7 1.8 1.6 1.3 1.4 1.6 2.1 1.8 1.7 1.5 1.2 1.9 1.3 1.2 1.4 1.8 1.7 2.2 1.2 1.3 1.3 RADIO / EQUIPOS Ninguna radio / equipo 4.5 3.9 3.5 2.2 3.8 14.3 14.6 1.3 2.4 0.4 2.7 3.1 13.1 7.3 2.4 2.0 4.2 7.1 12.7 4.9 3.8 1 radio 80.5 80.6 80.3 83.3 81.1 72.9 77.7 68.0 79.4 91.4 94.7 90.2 82.7 88.5 93.1 68.8 79.1 75.2 84.2 78.2 74.9 TOTAL NACIONAL POR CIUDADES NÚMERO DE ARTEFACTOS QUE TIENE EN EL HOGAR SERVICIOS QUE TIENE EN SU HOGAR TOTAL CIUDAD CIUDAD TOTAL
- 3. 2 radios 12.8 13.3 15.0 14.2 12.7 10.6 6.2 26.0 16.0 7.8 2.7 6.0 3.1 3.8 4.4 22.6 15.1 13.7 2.9 16.7 19.8 3 radios 1.5 1.5 1.1 0.2 2.0 1.3 1.1 4.2 1.8 0.4 0.0 0.7 1.1 0.4 0.0 5.8 1.3 3.3 0.2 0.2 1.6 4 radios 0.4 0.4 0.0 0.0 0.2 0.4 0.2 0.4 0.2 0.0 0.0 0.0 0.0 0.0 0.0 0.9 0.2 0.4 0.0 0.0 0.0 5 radios 0.1 0.2 0.0 0.0 0.2 0.2 0.2 0.0 0.2 0.0 0.0 0.0 0.0 0.0 0.0 0.0 0.0 0.2 0.0 0.0 0.0 6 radios 0.1 0.2 0.0 0.0 0.0 0.2 0.0 0.0 0.0 0.0 0.0 0.0 0.0 0.0 0.0 0.0 0.0 0.0 0.0 0.0 0.0 Promedio 1.1 1.2 1.1 1.1 1.1 1.0 1.0 1.3 1.2 1.1 1.0 1.0 0.9 1.0 1.0 1.3 1.1 1.2 0.9 1.1 1.2 COMPUT. / LAPTOP / TABLET Ninguna computadora/laptop/tablet 38.1 34.4 39.6 53.1 66.4 47.4 45.8 37.8 44.6 49.9 43.1 52.2 73.3 55.8 51.3 43.6 51.3 48.0 54.7 59.6 66.0 1 computadora/laptop 48.6 50.7 56.4 35.6 28.9 46.5 40.9 54.4 47.2 36.4 52.2 40.0 24.0 38.3 40.0 47.6 42.2 36.7 41.8 36.4 32.2 2 computadoras/laptops 10.2 11.5 2.7 10.9 2.2 4.1 10.0 6.4 6.9 9.3 4.7 7.6 2.0 5.5 5.3 4.4 5.3 12.2 3.6 3.3 1.3 3 computadoras/laptops 2.3 2.6 1.1 0.4 1.8 1.7 2.4 1.1 1.1 4.0 0.0 0.2 0.4 0.4 3.3 3.8 1.1 2.7 0.0 0.4 0.2 4 computadoras/laptops 0.6 0.6 0.2 0.0 0.7 0.2 0.9 0.2 0.2 0.4 0.0 0.0 0.2 0.0 0.0 0.7 0.0 0.4 0.0 0.2 0.2 5 computadoras/laptops 0.2 0.2 0.0 0.0 0.0 0.0 0.0 0.0 0.0 0.0 0.0 0.0 0.0 0.0 0.0 0.0 0.0 0.0 0.0 0.0 0.0 Promedio 0.8 0.9 0.7 0.6 0.4 0.6 0.7 0.7 0.7 0.7 0.6 0.6 0.3 0.5 0.6 0.7 0.6 0.7 0.5 0.5 0.4 VIDEO JUEGO Ningún video juego 77.2 75.2 79.4 85.8 90.9 87.0 72.1 85.8 86.9 88.9 82.2 79.8 94.0 82.1 89.8 86.7 86.0 72.8 84.4 93.8 93.3 1 video juego 21.7 23.5 19.9 14.2 8.2 12.3 25.0 14.0 13.1 10.6 17.6 20.2 5.8 17.7 10.0 13.3 13.3 24.3 15.6 6.0 6.7 2 video juego 1.0 1.1 0.7 0.0 0.9 0.2 2.7 0.0 0.0 0.4 0.2 0.0 0.2 0.2 0.2 0.0 0.7 2.7 0.0 0.2 0.0 3 video juego 0.1 0.1 0.0 0.0 0.0 0.0 0.2 0.2 0.0 0.0 0.0 0.0 0.0 0.0 0.0 0.0 0.0 0.2 0.0 0.0 0.0 4 video juego 0.1 0.1 0.0 0.0 0.0 0.4 0.0 0.0 0.0 0.0 0.0 0.0 0.0 0.0 0.0 0.0 0.0 0.0 0.0 0.0 0.0 Promedio 0.2 0.3 0.2 0.1 0.1 0.1 0.3 0.1 0.1 0.1 0.2 0.2 0.1 0.2 0.1 0.1 0.1 0.3 0.2 0.1 0.1 Total : 100% Base: Total de entrev. 9814 1240 452 450 450 462 452 450 451 451 450 450 450 452 450 452 450 452 450 450 450 C - 03 TOTAL NACIONAL POR CIUDADES
- 4. LIMA AQP AYAC CAJ CHYO CHIMB CUSC HYO HCO HRAZ ICA IQTS PIUR PCPA PUNO TCNA TRUJ TBES TPTO CHYAS % % % % % % % % % % % % % % % % % % % % % Sala 87.8 90.4 82.9 99.8 63.8 73.8 90.7 42.2 58.8 71.7 97.3 84.9 87.6 100.0 91.8 40.7 95.7 75.3 99.6 81.6 75.6 Dormitorio principal 41.5 41.5 34.4 20.5 29.6 47.0 61.1 75.8 48.1 42.6 14.2 51.6 22.5 10.8 27.4 79.9 43.4 67.3 8.9 20.2 17.1 Dormitorio del encuestado 22.0 21.4 37.9 3.8 15.8 24.4 37.8 34.9 32.5 12.3 4.4 32.7 8.5 5.1 7.3 27.2 18.6 44.4 5.6 11.6 13.7 Comedor 5.4 5.7 0.4 0.2 17.3 3.7 1.1 14.0 3.3 2.0 0.0 5.6 1.3 0.0 4.0 11.9 1.1 8.7 0.0 9.8 13.5 Cocina 3.1 2.7 1.6 0.4 4.0 3.1 3.8 6.0 10.7 10.1 0.0 4.4 2.2 0.2 3.6 8.0 2.9 12.0 0.0 0.9 1.6 Otro lugar 12.0 13.4 1.3 6.0 7.6 9.0 17.7 7.8 11.8 7.8 2.4 8.0 7.6 0.9 4.0 13.1 9.6 11.6 1.8 7.8 12.1 Total : Múltiple Base: Total de entrevistados que tienen algún televisor 9775 1240 451 449 450 455 452 450 449 446 450 450 445 452 449 452 447 450 450 450 438 C - 04 CIUDAD TOTAL TOTAL NACIONAL POR CIUDADES LUGAR DONDE SE ENCUENTRA LA RADIO / EQUIPO DE SONIDO TOTAL CIUDAD LUGAR DONDE SE ENCUENTRA EL TELEVISOR
- 5. LIMA AQP AYAC CAJ CHYO CHIMB CUSC HYO HCO HRAZ ICA IQTS PIUR PCPA PUNO TCNA TRUJ TBES TPTO CHYAS % % % % % % % % % % % % % % % % % % % % % Sala 76.7 78.3 68.6 99.3 42.7 69.4 86.5 45.3 50.7 61.9 100.0 77.1 81.6 100.0 67.4 27.3 83.1 76.0 100.0 50.7 42.7 Dormitorio principal 10.7 10.0 7.6 2.0 10.2 14.6 8.5 31.5 15.2 21.6 0.7 8.7 12.8 1.9 18.0 48.3 6.7 14.0 0.8 14.5 15.7 Cocina 10.3 9.4 18.8 9.8 26.8 6.6 3.9 22.1 31.4 13.6 1.1 9.9 2.6 2.1 7.1 26.2 21.1 11.9 0.5 20.1 28.6 Comedor 8.9 9.6 2.5 1.4 28.6 7.8 2.3 15.3 6.8 2.7 0.2 6.4 1.8 0.2 5.5 14.7 1.6 6.0 0.0 21.7 26.1 Dormitorio del encuestado 5.7 5.0 18.6 1.1 6.5 12.4 7.5 15.3 9.1 3.8 0.5 4.6 2.0 0.7 1.4 10.8 3.2 9.5 2.0 4.7 5.8 Otro lugar 6.6 7.4 1.8 1.4 3.9 5.8 2.6 6.5 8.0 5.1 0.2 0.9 5.4 0.0 5.2 9.5 3.2 5.0 0.5 6.3 4.6 Total : Múltiple Base: Total de entrevistados que tienen alguna radio 9287 1192 436 440 433 396 386 444 440 449 438 436 391 419 439 443 431 420 393 428 433 C - 05 LIMA AQP AYAC CAJ CHYO CHIMB CUSC HYO HCO HRAZ ICA IQTS PIUR PCPA PUNO TCNA TRUJ TBES TPTO CHYAS % % % % % % % % % % % % % % % % % % % % % Sala 57.0 57.9 64.5 80.1 18.5 35.8 57.6 45.0 41.2 53.5 96.9 46.0 55.8 90.5 49.8 29.0 67.6 41.7 91.2 17.0 14.4 Dormitorio principal 25.0 24.7 8.8 23.7 33.8 32.9 25.7 29.3 22.4 42.5 5.1 29.8 23.3 8.5 46.6 52.2 17.4 42.1 1.0 18.7 24.8 TOTAL TOTAL NACIONAL POR CIUDADES LUGAR DONDE SE ENCUENTRA LA COMPUTADORA / LAPTOP / TABLET TOTAL CIUDAD
- 6. Dormitorio del encuestado 22.3 21.9 33.0 6.6 37.7 28.0 31.0 22.9 23.2 21.7 2.3 30.7 15.0 8.5 11.9 15.3 18.3 36.6 6.4 24.2 26.8 Comedor 1.6 1.6 0.4 0.0 1.3 1.2 0.4 8.9 0.8 0.4 0.0 1.4 1.7 0.0 1.4 2.7 0.0 1.7 0.5 1.6 0.7 Cocina 0.2 0.1 0.4 0.0 0.7 0.0 0.0 0.7 0.0 0.0 0.0 0.5 1.7 0.0 2.7 1.6 0.0 0.9 0.0 0.0 0.0 Otro lugar 20.8 22.7 2.2 14.7 27.2 12.8 15.5 6.4 28.0 19.5 3.9 8.4 14.2 7.0 11.9 21.2 11.9 11.5 8.8 48.9 39.9 Total : Múltiple Base: Total de entrevistados que tienen alguna computadora / laptop 4951 814 273 211 151 243 245 280 250 226 256 215 120 200 219 255 219 235 204 182 153 C - 06 LIMA AQP AYAC CAJ CHYO CHIMB CUSC HYO HCO HRAZ ICA IQTS PIUR PCPA PUNO TCNA TRUJ TBES TPTO CHYAS % % % % % % % % % % % % % % % % % % % % % Dormitorio del encuestado 40.7 39.9 72.0 23.4 53.7 36.7 37.3 54.7 52.5 40.0 18.8 37.4 11.1 23.5 37.0 51.7 55.6 46.3 27.1 60.7 30.0 Sala 22.0 20.1 15.1 45.3 14.6 30.0 38.9 14.1 23.7 36.0 57.5 15.4 70.4 63.0 30.4 6.7 22.2 27.6 57.1 10.7 13.3 Dormitorio principal 13.0 13.3 3.2 23.4 4.9 20.0 7.1 14.1 0.0 2.0 8.8 12.1 14.8 6.2 10.9 13.3 4.8 22.8 2.9 3.6 6.7 Comedor 0.4 0.3 0.0 0.0 0.0 0.0 0.0 6.3 0.0 0.0 0.0 0.0 0.0 0.0 0.0 1.7 0.0 1.6 0.0 0.0 0.0 Cocina 0.3 0.3 0.0 0.0 0.0 0.0 0.0 0.0 0.0 0.0 0.0 0.0 0.0 0.0 0.0 0.0 0.0 0.0 0.0 0.0 0.0 Otro lugar 28.4 30.5 12.9 7.8 34.1 20.0 26.2 14.1 23.7 26.0 16.3 36.3 7.4 8.6 23.9 26.7 22.2 12.2 12.9 28.6 50.0 TOTAL NACIONAL POR CIUDADES LUGAR DONDE SE ENCUENTRA EL VIDEO JUEGO TOTAL CIUDAD
- 7. Total : Múltiple Base: Total de entrevistados que tienen algún video juego 1564 308 93 64 41 60 126 64 59 50 80 91 27 81 46 60 63 123 70 28 30 C - 07 LIMA AQP AYAC CAJ CHYO CHIMB CUSC HYO HCO HRAZ ICA IQTS PIUR PCPA PUNO TCNA TRUJ TBES TPTO CHYAS % % % % % % % % % % % % % % % % % % % % % VER TV Diario 86.8 88.5 74.1 97.8 86.4 81.6 80.8 71.1 74.5 77.4 88.0 82.0 80.4 93.6 92.0 73.9 77.8 77.4 88.0 86.7 81.8 Algunos días de la semana 12.8 11.2 25.2 2.2 13.6 16.9 18.8 27.3 25.3 22.2 12.0 17.8 19.6 6.4 7.3 24.1 20.9 21.7 11.8 13.3 17.3 Algunas veces al mes 0.3 0.2 0.7 0.0 0.0 1.5 0.4 1.3 0.2 0.4 0.0 0.2 0.0 0.0 0.2 1.8 1.3 0.9 0.2 0.0 0.9 Nunca 0.1 0.1 0.0 0.0 0.0 0.0 0.0 0.2 0.0 0.0 0.0 0.0 0.0 0.0 0.4 0.2 0.0 0.0 0.0 0.0 0.0 ESCUCHAR RADIO Diario 37.7 38.5 40.7 40.2 44.2 32.5 20.8 51.8 35.9 21.5 43.3 44.2 36.7 31.4 22.0 37.2 39.1 25.4 35.1 50.4 52.2 Algunos días de la semana 29.7 28.2 43.6 25.3 31.8 29.2 32.5 29.6 43.5 35.7 22.2 21.1 45.1 32.3 37.3 42.0 26.7 38.7 27.3 28.0 21.8 Algunas veces al mes 3.0 1.9 4.0 0.0 3.1 10.0 9.1 6.2 13.1 16.0 0.2 8.7 2.9 0.2 8.7 6.6 8.0 9.3 0.9 1.1 1.6 Nunca 29.5 31.3 11.7 34.4 20.9 28.4 37.6 12.4 7.5 26.8 34.2 26.0 15.3 36.1 32.0 14.2 26.2 26.5 36.7 20.4 24.4 JUGAR VIDEO JUEGOS Diario 4.8 5.2 1.8 0.2 2.7 3.7 7.1 4.7 3.1 1.6 2.9 8.4 2.7 2.7 2.2 3.3 2.7 5.8 7.8 2.2 2.0 Algunos días de la semana 18.1 18.8 13.9 10.0 10.0 11.5 22.6 21.1 12.6 15.5 12.9 10.9 15.1 15.5 18.4 21.2 12.7 22.8 22.0 10.0 7.3 FRECUENCIA DE CONSUMO TOTAL CIUDAD TOTAL NACIONAL POR CIUDADES
- 8. Algunas veces al mes 6.4 5.4 10.8 1.1 8.0 12.3 11.9 8.2 13.1 12.9 0.0 6.9 1.8 1.3 8.2 9.7 12.0 20.6 1.8 4.0 5.3 Nunca 70.8 70.6 73.5 88.7 79.3 72.5 58.4 66.0 71.2 70.1 84.2 73.8 80.4 80.5 71.1 65.7 72.7 50.9 68.4 83.8 85.3 NAVEGAR EN INTERNET Diario 36.5 40.9 33.2 9.6 14.7 26.4 33.2 18.2 14.6 14.2 19.6 33.1 6.9 20.1 18.7 18.6 17.6 28.1 25.6 20.9 9.1 Algunos días de la semana 43.2 42.7 38.1 60.9 47.1 40.5 46.9 51.8 59.4 46.1 53.3 36.9 30.2 44.9 39.8 38.9 48.0 52.0 36.4 48.0 52.4 Algunas veces al mes 4.4 3.0 10.8 0.7 7.8 12.3 7.5 14.9 13.3 11.1 0.4 11.3 1.1 1.5 7.8 18.6 13.8 11.3 0.7 3.8 2.7 Nunca 16.0 13.5 17.9 28.9 30.4 20.8 12.4 15.1 12.6 28.6 26.7 18.7 61.8 33.4 33.8 23.9 20.7 8.6 37.3 27.3 35.8 Total : 100% Base: Total de entrevistados 9814 1240 452 450 450 462 452 450 451 451 450 450 450 452 450 452 450 452 450 450 450 C - 08 LIMA AQP AYAC CAJ CHYO CHIMB CUSC HYO HCO HRAZ ICA IQTS PIUR PCPA PUNO TCNA TRUJ TBES TPTO CHYAS % % % % % % % % % % % % % % % % % % % % % Veo TV 99.3 99.3 99.8 99.8 99.8 97.8 99.8 98.2 100.0 99.3 99.8 99.8 100.0 99.6 99.8 99.1 98.2 99.6 99.8 99.8 97.8 Voy a clases 99.2 99.2 99.6 99.8 99.8 99.8 99.6 98.9 98.9 97.1 99.6 97.6 98.2 100.0 96.7 99.6 99.3 100.0 99.6 99.8 99.8 Estudio / Hago tareas 97.9 97.7 98.7 99.8 96.7 99.4 99.3 98.7 99.6 98.0 99.6 98.2 97.1 98.0 94.4 98.9 97.8 99.6 98.4 99.3 98.7 Navego por internet 76.9 79.6 81.2 70.0 48.0 61.0 77.4 77.1 80.7 57.0 72.4 72.9 34.7 65.0 53.6 70.6 71.6 88.9 60.4 48.0 40.2 Apoyo en labores del hogar 76.1 76.0 49.6 89.8 56.2 88.1 86.1 90.0 91.1 82.7 84.2 52.7 85.1 73.5 83.1 79.9 70.0 84.7 90.2 59.8 56.7 Juego 66.2 66.7 54.0 71.6 60.0 53.7 46.9 79.8 72.5 68.3 73.6 67.1 66.7 65.9 78.9 81.9 76.2 60.4 88.4 49.3 53.3 Escucho la radio 63.7 61.6 85.6 66.7 68.0 60.0 56.6 80.4 83.8 62.3 66.2 71.6 76.0 63.3 58.7 83.2 67.8 70.8 62.2 69.1 67.1 Hago deporte 43.9 40.9 29.9 20.9 56.2 54.5 26.3 65.3 67.4 50.8 15.1 53.1 89.8 51.3 70.7 47.6 59.3 61.1 72.2 63.3 55.3 ACTIVIDADES REALIZADAS DE LUNES A VIERNES TOTAL CIUDAD TOTAL NACIONAL POR CIUDADES
- 9. Uso los video juegos 18.9 19.0 16.8 10.0 8.9 15.8 22.8 26.9 15.5 15.5 13.6 16.7 16.2 15.9 16.7 28.1 15.1 32.1 28.7 7.6 6.0 Trabajo 0.5 0.3 0.7 0.4 2.0 1.5 0.2 0.7 0.9 0.2 0.9 0.4 2.2 0.9 0.0 0.9 2.2 2.9 0.7 1.3 0.4 Total : Múltiple Base: Total de entrevistados 9814 1240 452 450 450 462 452 450 451 451 450 450 450 452 450 452 450 452 450 450 450 C - 09 LIMA AQP AYAC CAJ CHYO CHIMB CUSC HYO HCO HRAZ ICA IQTS PIUR PCPA PUNO TCNA TRUJ TBES TPTO CHYAS % % % % % % % % % % % % % % % % % % % % % 04:00 0.1 0.1 0.0 0.0 0.7 0.0 0.2 0.4 0.4 0.4 0.0 0.2 3.1 0.0 0.2 0.2 0.0 0.0 0.0 0.4 0.7 05:00 28.5 25.7 1.5 91.1 61.3 18.6 16.4 56.2 36.4 9.1 88.7 30.0 46.9 87.2 20.2 15.0 17.8 32.1 81.1 61.8 54.9 05:30 1.2 0.2 4.2 0.0 0.0 8.0 31.4 0.9 0.0 0.9 0.0 5.3 0.4 0.0 0.0 0.2 1.8 10.2 0.0 0.0 0.0 06:00 36.4 35.0 46.7 4.4 30.9 45.7 46.5 29.1 41.0 72.1 10.0 38.0 37.8 8.8 72.4 73.2 57.6 52.7 16.4 28.0 32.2 06:30 0.5 0.4 4.6 0.0 0.0 0.2 0.7 0.2 0.2 1.6 0.0 2.0 0.0 0.0 0.0 0.0 4.2 0.7 0.0 0.0 0.0 07:00 19.9 22.8 23.5 4.0 6.0 24.7 4.2 7.1 15.5 8.2 0.2 14.7 7.3 2.7 3.1 7.1 12.7 4.2 1.6 7.3 9.6 07:30 0.1 0.1 0.4 0.0 0.0 0.0 0.0 0.2 0.2 0.7 0.0 0.2 0.0 0.0 0.0 0.0 0.0 0.0 0.0 0.0 0.0 08:00 12.1 14.6 18.6 0.0 0.4 1.7 0.2 4.7 4.7 4.0 0.7 6.2 2.2 1.3 0.4 3.8 4.0 0.2 0.4 2.2 2.0 08:30 0.1 0.1 0.0 0.0 0.0 0.0 0.0 0.0 0.0 0.0 0.0 0.2 0.0 0.0 0.0 0.0 0.2 0.0 0.0 0.0 0.0 09:00 0.2 0.2 0.0 0.0 0.2 0.9 0.0 0.0 0.2 0.2 0.0 0.2 0.0 0.0 0.0 0.0 0.9 0.0 0.0 0.0 0.0 No realiza la actividad 0.8 0.8 0.4 0.2 0.2 0.2 0.4 1.1 1.1 2.9 0.4 2.4 1.8 0.0 3.3 0.4 0.7 0.0 0.4 0.2 0.2 Horas promedio 05:46 06:16 06:36 05:07 05:27 06:04 05:43 05:35 05:52 06:05 05:07 05:57 05:33 05:10 05:49 05:59 06:04 05:40 05:12 05:29 05:34 Total 100% Base: Total de entrevistados 9814 1240 452 450 450 462 452 450 451 451 450 450 450 452 450 452 450 452 450 450 450 TOTAL NACIONAL POR CIUDADES TOTAL CIUDAD CANTIDAD DE HORAS DIARIAS DEDICADAS A IR A CLASES DE LUNES A VIERNES
- 10. C - 10 LIMA AQP AYAC CAJ CHYO CHIMB CUSC HYO HCO HRAZ ICA IQTS PIUR PCPA PUNO TCNA TRUJ TBES TPTO CHYAS % % % % % % % % % % % % % % % % % % % % % 00:10 0.1 0.2 0.0 0.0 0.0 0.2 0.0 0.0 0.0 0.0 0.2 0.0 0.0 0.0 0.0 0.0 0.0 0.0 0.2 0.0 0.0 00:20 0.1 0.1 0.0 0.0 0.0 0.2 0.0 0.2 0.0 0.0 0.2 0.0 0.0 0.2 0.0 0.2 0.0 0.0 0.7 0.0 0.0 00:30 3.5 3.5 3.5 9.3 0.4 5.0 6.6 0.9 2.4 1.6 3.8 1.8 2.4 2.7 2.9 0.2 3.3 4.0 7.1 0.0 0.0 01:00 26.2 25.5 23.0 37.8 47.3 24.5 29.4 25.3 26.8 39.0 23.1 17.3 28.9 24.3 51.1 22.8 16.7 32.3 27.1 29.6 31.8 01:30 1.9 2.1 2.0 0.4 0.0 1.7 3.8 0.2 1.8 0.9 0.7 1.1 0.9 1.1 0.4 0.2 3.6 1.5 2.2 0.0 0.0 02:00 48.4 48.5 57.1 46.0 41.1 36.6 45.1 50.0 48.8 48.3 60.4 56.0 46.2 54.4 34.7 53.5 47.8 48.7 38.0 50.4 55.3 02:30 0.5 0.5 1.1 0.0 0.0 0.6 0.4 0.7 0.2 0.4 0.0 1.3 0.2 0.9 0.0 0.0 0.7 0.9 0.4 0.0 0.0 03:00 13.5 13.7 11.1 5.1 6.7 19.0 12.6 16.4 16.4 7.1 8.9 16.4 15.3 10.4 4.2 19.2 18.2 10.8 16.9 17.1 8.9 03:30 0.1 0.1 0.0 0.0 0.0 0.0 0.2 0.0 0.0 0.0 0.0 0.2 0.0 0.0 0.0 0.0 1.1 0.0 0.0 0.0 0.0 04:00 2.9 3.0 0.9 0.2 1.1 8.7 0.9 2.9 2.4 0.4 0.9 2.9 3.1 3.1 0.9 1.8 4.2 1.1 4.4 2.2 2.2 05:00 0.4 0.4 0.0 0.0 0.0 1.3 0.2 1.6 0.7 0.0 0.2 0.7 0.0 0.4 0.0 0.9 1.6 0.0 1.1 0.0 0.4 06:00 0.2 0.2 0.0 0.0 0.0 1.1 0.0 0.2 0.0 0.2 0.0 0.0 0.0 0.0 0.0 0.0 0.2 0.0 0.0 0.0 0.0 No realiza la actividad 2.1 2.3 1.3 0.2 3.3 0.6 0.7 1.3 0.4 2.0 0.4 1.8 2.9 2.0 5.6 1.1 2.2 0.4 1.6 0.7 1.3 Horas promedio 01:50 01:53 01:50 01:31 01:35 02:06 01:44 02:00 01:55 01:39 01:47 02:02 01:53 01:52 01:29 02:01 02:06 01:44 01:53 01:55 01:49 Total 100% Base: Total de entrevistados 9814 1240 452 450 450 462 452 450 451 451 450 450 450 452 450 452 450 452 450 450 450 C - 11 TOTAL CIUDAD TOTAL NACIONAL POR CIUDADES CANTIDAD DE HORAS DIARIAS DEDICADAS A ESTUDIAR O HACER LAS TAREAS DE LUNES A VIERNES TOTAL NACIONAL POR CIUDADES
- 11. LIMA AQP AYAC CAJ CHYO CHIMB CUSC HYO HCO HRAZ ICA IQTS PIUR PCPA PUNO TCNA TRUJ TBES TPTO CHYAS % % % % % % % % % % % % % % % % % % % % % 00:10 0.1 0.1 0.0 0.2 0.0 0.0 0.0 0.0 0.0 0.0 0.0 0.0 0.0 0.0 0.0 0.0 0.0 0.0 0.2 0.0 0.0 00:15 0.2 0.2 0.4 0.0 0.0 0.0 1.3 3.6 0.0 0.0 0.4 0.2 0.0 0.0 0.0 0.0 0.2 0.7 0.0 0.0 0.0 00:20 0.1 0.0 0.0 0.0 0.0 0.0 0.9 1.6 0.0 0.2 0.0 0.0 0.0 1.8 0.0 0.0 1.1 0.7 0.7 0.0 0.0 00:30 8.3 8.9 16.6 13.6 0.0 3.0 8.4 4.7 10.2 4.7 7.3 7.6 2.4 5.1 1.8 1.5 8.9 3.8 5.1 0.0 0.0 01:00 38.1 39.8 22.3 32.4 43.3 26.8 20.8 42.2 32.2 37.7 47.1 28.7 30.2 40.0 44.0 39.4 32.7 29.2 43.8 32.4 38.4 01:30 0.2 0.1 0.4 0.2 0.0 1.1 1.1 0.4 0.9 0.4 0.0 1.1 0.2 0.0 0.0 0.2 1.1 0.9 0.4 0.0 0.0 02:00 15.7 15.0 13.1 23.8 14.4 18.2 10.6 22.4 19.7 21.5 15.6 24.9 20.4 12.8 26.4 27.7 20.7 16.2 23.1 13.3 13.3 03:00 2.8 2.3 0.7 1.1 2.2 3.5 2.7 2.9 8.0 2.7 3.1 3.3 12.0 2.9 5.3 11.3 4.9 6.4 9.8 2.7 1.3 04:00 0.6 0.4 0.4 0.0 0.0 0.6 0.4 0.9 1.3 0.7 0.0 0.7 0.9 2.0 1.1 1.8 3.3 1.5 3.6 0.9 0.0 05:00 0.1 0.0 0.0 0.0 0.0 0.2 0.0 0.2 0.2 0.4 0.0 0.2 0.2 0.2 0.0 0.0 1.3 0.4 1.1 0.0 0.2 No realiza la actividad 33.8 33.3 46.0 28.4 40.0 46.3 53.1 20.2 27.5 31.7 26.4 32.9 33.3 34.1 21.1 18.1 23.8 39.6 11.6 50.7 46.7 Horas promedio 01:24 01:14 01:08 01:16 01:18 01:30 01:15 01:19 01:29 01:24 01:14 01:27 01:42 01:19 01:30 01:40 01:34 01:33 01:38 01:25 01:19 Total 100% Base: Total de entrevistados 9814 1240 452 450 450 462 452 450 451 451 450 450 450 452 450 452 450 452 450 450 450 C - 12 LIMA AQP AYAC CAJ CHYO CHIMB CUSC HYO HCO HRAZ ICA IQTS PIUR PCPA PUNO TCNA TRUJ TBES TPTO CHYAS TOTAL CIUDAD CANTIDAD DE HORAS DIARIAS DEDICADAS AL JUEGO DE LUNES A VIERNES TOTAL CIUDAD TOTAL NACIONAL POR CIUDADES CANTIDAD DE HORAS DIARIAS DEDICADAS AL APOYO EN LABORES DEL HOGAR DE LUNES A VIERNES
- 12. % % % % % % % % % % % % % % % % % % % % % 00:05 0.1 0.1 0.0 0.0 0.0 0.0 0.2 0.0 0.0 0.0 0.0 0.0 0.0 0.4 0.0 0.0 0.0 0.0 0.4 0.0 0.0 00:10 1.7 1.7 1.1 3.1 0.0 0.9 0.9 0.2 0.0 0.0 6.7 0.0 0.0 11.9 0.2 0.0 0.4 0.4 5.3 0.0 0.0 00:15 1.7 1.6 3.1 0.0 0.0 3.9 6.2 1.8 3.3 0.0 2.4 0.2 0.2 0.2 0.0 0.4 6.0 2.2 1.8 0.0 0.0 00:20 1.1 1.0 0.2 0.7 0.0 0.6 2.2 1.3 0.0 0.0 1.6 0.0 0.0 7.3 0.0 0.2 3.3 0.7 3.1 0.0 0.0 00:30 22.9 24.4 29.2 32.4 0.2 13.9 26.8 3.3 13.7 13.5 29.1 12.0 19.3 29.6 10.4 4.9 25.3 15.7 25.1 0.0 0.0 00:40 0.1 0.1 0.0 0.0 0.0 0.4 0.4 0.2 0.2 0.0 0.0 0.0 0.0 1.1 0.0 0.0 0.4 0.7 0.2 0.0 0.0 00:45 0.1 0.1 0.2 0.0 0.0 0.0 0.0 0.0 0.0 0.0 0.0 0.0 0.0 0.0 0.0 0.0 0.2 0.0 0.2 0.0 0.0 01:00 34.5 34.4 11.9 37.6 45.1 40.7 36.5 51.8 40.8 39.7 36.7 28.9 41.6 18.8 40.9 50.2 22.7 38.3 40.7 56.0 50.7 01:30 0.6 0.6 0.4 0.0 0.0 0.9 1.5 0.2 1.1 0.0 0.2 1.1 0.2 0.4 0.0 0.2 2.7 1.8 0.9 0.0 0.0 02:00 10.0 9.1 2.7 14.7 10.4 17.3 8.2 22.9 22.4 24.4 6.7 8.0 17.6 2.9 24.9 19.5 6.2 15.9 8.0 3.3 5.6 03:00 2.8 2.7 0.4 1.1 0.4 7.1 2.2 6.0 6.0 3.3 0.9 1.1 4.7 0.7 4.7 3.1 1.6 7.3 1.8 0.2 0.2 04:00 0.4 0.2 0.0 0.2 0.0 1.5 0.2 1.6 2.2 1.1 0.0 0.7 1.3 0.0 0.4 1.1 0.2 0.9 1.3 0.2 0.0 No realiza la actividad 23.9 24.0 50.4 10.2 43.8 11.9 13.9 10.0 8.9 17.3 15.8 47.3 14.9 26.5 16.9 20.1 30.0 15.3 9.8 40.2 43.3 Horas promedio 01:07 00:59 00:43 00:58 01:11 01:19 00:55 01:25 01:24 01:22 00:49 01:10 01:15 00:38 01:27 01:20 00:55 01:17 00:59 01:04 01:07 Total 100% Base: Total de entrevistados 9814 1240 452 450 450 462 452 450 451 451 450 450 450 452 450 452 450 452 450 450 450 C - 13 LIMA AQP AYAC CAJ CHYO CHIMB CUSC HYO HCO HRAZ ICA IQTS PIUR PCPA PUNO TCNA TRUJ TBES TPTO CHYAS % % % % % % % % % % % % % % % % % % % % % 00:05 0.1 0.1 0.0 0.0 0.0 0.0 0.0 0.2 0.0 0.0 0.0 0.0 0.0 0.0 0.2 0.0 0.0 0.0 0.0 0.0 0.0 00:10 0.4 0.4 0.0 0.0 0.0 0.0 0.0 0.0 0.0 0.0 0.0 0.0 0.0 2.2 0.0 0.0 1.1 0.4 0.4 0.0 0.0 00:15 0.4 0.2 0.9 0.2 0.0 0.9 0.4 2.2 6.7 0.2 0.0 0.2 0.0 0.2 0.0 0.0 2.2 0.7 0.0 0.0 0.0 TOTAL NACIONAL POR CIUDADES CANTIDAD DE HORAS DIARIAS DEDICADAS A ESCUCHAR RADIO DE LUNES A VIERNES TOTAL CIUDAD
- 13. 00:20 0.3 0.2 0.0 0.7 0.0 0.6 0.9 0.4 0.2 0.4 0.0 0.0 0.0 2.9 0.7 0.0 1.6 0.7 0.2 0.0 0.0 00:30 11.9 11.8 33.0 12.2 0.7 6.1 12.8 5.3 23.1 12.0 7.6 15.6 12.2 11.3 10.2 8.8 15.1 4.6 6.9 0.2 0.2 00:40 0.1 0.1 0.0 0.0 0.0 0.0 0.0 0.2 0.2 0.0 0.2 0.0 0.0 0.9 0.0 0.0 0.2 0.0 0.0 0.0 0.0 01:00 30.7 30.4 40.9 34.7 45.1 27.5 20.1 33.1 31.9 15.7 34.0 34.0 35.6 26.5 24.9 35.6 28.2 30.1 24.2 39.8 45.3 01:30 0.5 0.6 0.4 0.0 0.0 0.4 0.4 0.0 0.4 0.9 0.0 0.9 0.0 0.7 0.0 0.2 0.4 1.1 0.9 0.0 0.0 02:00 12.2 11.5 8.0 14.2 17.8 10.2 13.3 19.1 11.1 17.3 18.2 18.2 16.9 13.5 14.4 23.5 9.6 19.2 18.4 26.9 16.4 03:00 4.3 4.0 1.3 3.8 2.2 7.1 5.5 10.7 4.9 9.3 4.0 1.3 7.1 3.3 6.0 8.0 4.0 8.0 5.3 1.6 2.0 04:00 1.7 1.7 0.4 0.7 1.3 4.1 2.0 3.8 2.0 4.2 1.1 0.2 1.3 0.2 1.1 2.0 1.3 2.0 2.7 0.7 2.4 05:00 0.7 0.6 0.4 0.0 0.4 1.1 0.4 3.8 2.4 1.1 0.9 0.2 1.1 1.1 0.4 4.0 1.3 2.4 1.3 0.0 0.4 06:00 0.3 0.2 0.0 0.2 0.4 1.5 0.0 1.1 0.4 0.4 0.0 0.2 1.6 0.0 0.7 0.7 0.7 0.7 0.7 0.0 0.2 No realiza la actividad 36.3 38.4 14.4 33.3 32.0 40.0 43.4 19.6 16.2 37.7 33.8 28.4 24.0 36.7 41.3 16.8 32.2 29.2 37.8 30.9 32.9 Horas promedio 01:29 01:21 00:57 01:16 01:26 01:47 01:26 01:52 01:18 01:52 01:27 01:18 01:33 01:16 01:29 01:44 01:21 01:46 01:47 01:27 01:27 Total 100% Base: Total de entrevistados 9814 1240 452 450 450 462 452 450 451 451 450 450 450 452 450 452 450 452 450 450 450 C - 14 LIMA AQP AYAC CAJ CHYO CHIMB CUSC HYO HCO HRAZ ICA IQTS PIUR PCPA PUNO TCNA TRUJ TBES TPTO CHYAS % % % % % % % % % % % % % % % % % % % % % 00:30 4.7 5.2 8.0 6.0 0.2 1.3 0.9 2.2 4.9 2.2 5.1 5.3 0.2 3.8 0.9 0.9 7.1 1.1 3.8 0.0 0.0 01:00 20.6 22.1 20.8 38.7 11.6 11.7 12.6 25.6 15.5 10.4 30.2 14.0 5.6 16.8 9.8 14.4 25.3 11.9 22.0 13.3 21.8 01:30 1.5 1.6 3.3 0.0 0.0 0.6 1.3 0.9 1.6 1.1 2.0 0.9 0.2 0.0 0.2 0.2 2.2 1.3 1.1 0.0 0.0 02:00 35.2 35.7 52.7 42.7 44.7 29.7 24.8 38.9 28.4 21.7 40.2 22.2 21.6 41.4 22.2 33.8 39.1 25.0 25.8 36.0 36.0 02:30 0.6 0.6 0.7 0.0 0.0 0.2 2.4 0.2 0.0 0.2 0.0 0.2 0.2 0.0 0.0 0.0 0.9 1.8 0.0 0.0 0.0 03:00 23.4 22.4 11.9 11.1 37.1 30.1 29.4 19.8 35.0 39.9 18.9 29.3 26.0 28.3 29.8 35.4 12.9 29.2 25.1 31.3 31.6 TOTAL NACIONAL POR CIUDADES CANTIDAD DE HORAS DIARIAS DEDICADAS A VER TELEVISION DE LUNES A VIERNES TOTAL CIUDAD
- 14. 03:30 0.2 0.2 0.0 0.0 0.0 0.6 1.3 0.0 0.0 0.9 0.0 0.2 0.0 0.0 0.0 0.0 0.2 1.5 0.0 0.0 0.0 04:00 9.4 8.2 2.4 0.7 5.3 16.5 15.9 5.8 10.4 18.0 2.7 25.3 31.3 6.2 27.3 11.1 7.3 20.4 11.8 14.4 6.7 05:00 2.8 2.4 0.0 0.7 0.7 4.8 6.9 1.3 3.1 3.8 0.4 2.0 13.3 2.7 7.3 2.7 2.0 6.6 7.1 4.7 1.6 06:00 0.7 0.7 0.0 0.0 0.2 1.7 2.9 0.7 0.4 0.9 0.0 0.0 0.9 0.2 1.3 0.4 0.2 0.2 1.8 0.0 0.2 07:00 0.1 0.1 0.0 0.0 0.0 0.0 0.2 0.0 0.0 0.0 0.0 0.0 0.0 0.2 0.2 0.0 0.0 0.0 0.7 0.0 0.0 08:00 0.1 0.1 0.0 0.0 0.0 0.2 0.0 0.0 0.0 0.0 0.0 0.0 0.7 0.0 0.2 0.2 0.0 0.0 0.2 0.0 0.0 No realiza la actividad 0.7 0.7 0.2 0.2 0.2 2.2 0.2 1.8 0.0 0.7 0.2 0.2 0.0 0.4 0.2 0.9 1.8 0.4 0.2 0.2 2.2 Horas promedio 02:25 02:11 01:49 01:40 02:23 02:45 02:51 02:02 02:27 02:47 01:51 02:38 03:18 02:17 03:01 02:31 01:57 02:48 02:32 02:36 02:17 Total 100% Base: Total de entrevistados 9814 1240 452 450 450 462 452 450 451 451 450 450 450 452 450 452 450 452 450 450 450 C - 15 LIMA AQP AYAC CAJ CHYO CHIMB CUSC HYO HCO HRAZ ICA IQTS PIUR PCPA PUNO TCNA TRUJ TBES TPTO CHYAS % % % % % % % % % % % % % % % % % % % % % 00:15 0.1 0.0 0.0 0.0 0.0 0.0 0.0 5.1 0.2 0.0 0.0 0.0 0.0 0.0 0.0 0.0 0.2 0.2 0.0 0.0 0.0 00:20 0.1 0.0 0.0 0.0 0.0 0.0 1.5 1.3 0.0 0.0 0.0 0.0 0.0 0.9 0.0 0.0 0.4 1.5 0.0 0.0 0.0 00:30 4.6 4.8 11.3 0.7 0.0 0.9 2.9 2.4 7.3 3.8 0.2 11.1 0.4 2.9 0.7 2.2 9.1 4.2 2.0 0.0 0.0 00:40 0.1 0.1 0.0 0.0 0.0 0.0 0.0 0.0 0.0 0.0 0.0 0.2 0.0 0.0 0.0 0.0 0.4 0.0 0.0 0.0 0.0 00:45 0.1 0.1 0.0 0.0 0.0 0.0 0.0 0.0 0.0 0.0 0.0 0.0 0.0 0.2 0.0 0.2 0.0 0.0 0.0 0.0 0.0 00:50 0.1 0.1 0.0 0.0 0.0 0.0 0.0 0.0 0.0 0.0 0.0 0.0 0.0 0.0 0.0 0.0 0.0 0.0 0.0 0.0 0.0 01:00 27.1 26.2 14.8 16.7 40.4 31.6 14.2 34.7 32.4 27.7 11.3 28.0 40.0 37.4 33.6 25.2 28.9 35.4 43.6 34.7 32.0 01:30 0.3 0.2 1.1 0.0 0.0 0.4 0.2 0.2 0.4 0.4 0.2 1.1 1.6 0.2 0.2 0.4 1.6 1.1 0.7 0.0 0.0 02:00 9.4 7.7 2.0 3.6 14.2 16.9 6.2 18.4 21.3 15.5 3.3 10.0 39.3 7.3 28.9 16.8 16.4 14.2 16.9 27.8 22.9 03:00 1.8 1.5 0.4 0.0 1.6 2.6 1.1 2.2 4.2 2.9 0.0 2.2 8.4 2.2 6.2 2.4 0.9 4.4 5.6 0.9 0.4 04:00 0.2 0.2 0.0 0.0 0.0 1.3 0.2 0.2 1.3 0.4 0.0 0.4 0.0 0.0 0.9 0.0 0.7 0.0 1.8 0.0 0.0 TOTAL NACIONAL POR CIUDADES CANTIDAD DE HORAS DIARIAS DEDICADAS A HACER DEPORTE DE LUNES A VIERNES TOTAL CIUDAD
- 15. 05:00 0.1 0.1 0.0 0.0 0.0 0.2 0.0 0.2 0.2 0.0 0.0 0.0 0.0 0.0 0.0 0.2 0.0 0.0 1.1 0.0 0.0 No realiza la actividad 56.1 59.1 70.1 79.1 43.8 45.5 73.7 34.7 32.6 49.2 84.9 46.9 10.2 48.7 29.3 52.4 40.7 38.9 27.8 36.7 44.7 Horas promedio 01:22 01:13 00:55 01:09 01:18 01:29 01:15 01:16 01:27 01:24 01:13 01:12 01:37 01:11 01:38 01:27 01:17 01:19 01:31 01:28 01:25 Total 100% Base: Total de entrevistados 9814 1240 452 450 450 462 452 450 451 451 450 450 450 452 450 452 450 452 450 450 450 C - 16 LIMA AQP AYAC CAJ CHYO CHIMB CUSC HYO HCO HRAZ ICA IQTS PIUR PCPA PUNO TCNA TRUJ TBES TPTO CHYAS % % % % % % % % % % % % % % % % % % % % % 00:15 0.4 0.2 0.2 0.0 0.0 0.6 0.0 7.6 7.5 0.0 0.0 0.0 0.0 0.2 0.2 0.0 0.2 0.2 0.0 0.0 0.0 00:20 0.1 0.1 0.0 0.2 0.0 0.0 0.2 5.3 0.0 0.2 0.0 0.0 0.0 0.2 0.0 0.0 0.4 0.0 0.2 0.0 0.0 00:30 12.9 12.4 22.6 30.9 0.2 9.3 13.7 9.6 30.2 21.5 20.7 20.2 4.0 15.9 11.3 8.6 19.6 10.0 10.7 0.0 0.7 01:00 36.7 38.1 36.7 32.4 39.6 27.7 30.5 32.7 28.2 22.8 37.8 34.4 18.0 33.6 28.0 42.0 30.2 36.9 26.2 37.8 36.2 01:30 1.2 1.2 0.7 0.2 0.0 1.1 0.9 1.1 1.1 0.4 1.1 0.9 0.7 1.1 0.7 0.2 2.2 2.2 1.1 0.0 0.0 02:00 16.6 17.6 17.9 5.6 6.0 13.2 19.0 14.2 8.4 8.9 9.6 13.6 9.6 9.7 8.9 15.3 11.8 24.8 12.4 8.2 1.6 02:30 0.1 0.2 0.2 0.0 0.0 0.0 0.4 0.0 0.0 0.0 0.0 0.0 0.0 0.0 0.0 0.0 0.4 0.2 0.2 0.0 0.0 03:00 5.5 5.9 2.4 0.2 2.0 5.8 8.6 4.7 4.0 2.2 2.4 2.7 1.1 3.3 1.8 3.1 3.6 10.6 5.3 1.6 1.1 04:00 2.3 2.7 0.2 0.0 0.2 1.7 2.4 0.9 0.4 0.7 0.9 0.4 1.1 0.2 2.0 1.1 1.6 1.5 2.7 0.2 0.2 05:00 1.0 1.1 0.2 0.4 0.0 0.9 1.1 0.2 0.7 0.2 0.0 0.0 0.2 0.0 0.0 0.0 0.9 1.3 1.1 0.2 0.2 06:00 0.1 0.2 0.0 0.0 0.0 0.2 0.4 0.0 0.0 0.0 0.0 0.2 0.0 0.0 0.2 0.2 0.0 0.2 0.2 0.0 0.2 No realiza la actividad 23.1 20.4 18.8 30.0 52.0 39.0 22.6 22.9 19.3 43.0 27.6 27.1 65.3 35.0 46.4 29.4 28.4 11.1 39.6 52.0 59.8 Horas promedio 01:17 01:27 01:10 00:53 01:13 01:32 01:34 01:10 01:00 01:05 01:06 01:09 01:24 01:08 01:18 01:18 01:15 01:36 01:33 01:16 01:09 TOTAL NACIONAL POR CIUDADES CANTIDAD DE HORAS DIARIAS DEDICADAS A NAVEGAR POR INTERNET DE LUNES A VIERNES TOTAL CIUDAD
- 16. Total 100% Base: Total de entrevistados 9814 1240 452 450 450 462 452 450 451 451 450 450 450 452 450 452 450 452 450 450 450 C - 17 LIMA AQP AYAC CAJ CHYO CHIMB CUSC HYO HCO HRAZ ICA IQTS PIUR PCPA PUNO TCNA TRUJ TBES TPTO CHYAS % % % % % % % % % % % % % % % % % % % % % 00:10 0.1 0.0 0.0 0.0 0.0 0.0 0.0 0.0 0.0 0.0 0.0 0.0 0.0 3.1 0.2 0.0 0.0 0.2 0.2 0.0 0.0 00:15 0.1 0.1 0.2 0.0 0.0 0.0 0.7 2.2 1.3 0.0 0.4 0.0 0.0 0.0 0.0 0.2 0.2 0.0 0.2 0.0 0.0 00:20 0.1 0.0 0.0 0.0 0.0 0.2 0.0 2.0 0.2 0.2 0.0 0.0 0.0 2.4 0.2 0.0 0.0 0.7 0.4 0.0 0.0 00:30 6.1 6.5 7.5 7.6 0.0 2.4 8.2 2.9 7.1 7.1 7.3 5.6 2.9 7.3 3.1 3.8 4.4 5.1 7.8 0.2 0.0 01:00 9.2 9.0 8.0 1.6 8.7 9.5 11.1 13.8 4.4 6.9 5.1 8.2 10.0 2.4 10.2 20.4 7.1 21.2 11.6 6.4 5.3 01:30 0.1 0.0 0.2 0.2 0.0 0.4 0.9 0.2 0.2 0.4 0.0 0.9 0.0 0.0 0.0 0.0 0.9 0.4 0.7 0.0 0.0 02:00 2.6 2.8 0.7 0.7 0.0 3.0 1.5 4.0 1.6 0.7 0.4 2.0 2.7 0.7 1.8 2.9 1.6 2.9 5.1 0.9 0.7 03:00 0.4 0.4 0.2 0.0 0.2 0.2 0.2 0.9 0.2 0.2 0.0 0.0 0.4 0.0 0.7 0.9 0.4 1.5 1.1 0.0 0.0 04:00 0.1 0.2 0.0 0.0 0.0 0.0 0.0 0.2 0.2 0.0 0.0 0.0 0.0 0.0 0.0 0.0 0.0 0.0 0.7 0.0 0.0 No realiza la actividad 81.1 81.0 83.2 90.0 91.1 84.2 77.2 73.1 84.5 84.5 86.4 83.3 83.8 84.1 83.3 71.9 84.9 67.9 71.3 92.4 94.0 Horas promedio 01:00 01:02 00:50 00:42 01:03 01:08 00:55 01:03 00:56 00:50 00:43 00:58 01:11 00:32 01:12 01:05 01:02 01:05 01:09 01:06 01:06 Total 100% Base: Total de entrevistados 9814 1240 452 450 450 462 452 450 451 451 450 450 450 452 450 452 450 452 450 450 450 C - 18 TOTAL NACIONAL POR CIUDADES CANTIDAD DE HORAS DIARIAS DEDICADAS A LOS VIDEO JUEGOS DE LUNES A VIERNES TOTAL CIUDAD
- 17. LIMA AQP AYAC CAJ CHYO CHIMB CUSC HYO HCO HRAZ ICA IQTS PIUR PCPA PUNO TCNA TRUJ TBES TPTO CHYAS % % % % % % % % % % % % % % % % % % % % % 01:00 0.1 0.1 0.0 0.0 0.2 0.6 0.0 0.0 0.0 0.0 0.2 0.0 0.2 0.0 0.0 0.7 0.2 0.7 0.2 0.0 0.0 02:00 0.1 0.0 0.4 0.2 0.2 0.2 0.0 0.2 0.0 0.0 0.0 0.2 0.2 0.0 0.0 0.0 1.1 0.7 0.0 0.2 0.0 03:00 0.1 0.0 0.2 0.2 0.9 0.2 0.0 0.0 0.0 0.0 0.2 0.0 0.2 0.4 0.0 0.0 0.4 0.4 0.2 0.4 0.0 04:00 0.1 0.0 0.0 0.0 0.4 0.2 0.2 0.2 0.2 0.2 0.0 0.0 0.7 0.2 0.0 0.2 0.2 0.7 0.0 0.4 0.2 05:00 0.0 0.0 0.0 0.0 0.0 0.0 0.0 0.0 0.0 0.0 0.2 0.2 0.4 0.2 0.0 0.0 0.0 0.2 0.0 0.2 0.2 06:00 0.2 0.2 0.0 0.0 0.0 0.2 0.0 0.0 0.7 0.0 0.0 0.0 0.0 0.0 0.0 0.0 0.0 0.2 0.0 0.0 0.0 08:00 0.0 0.0 0.0 0.0 0.2 0.0 0.0 0.0 0.0 0.0 0.2 0.0 0.4 0.0 0.0 0.0 0.0 0.0 0.2 0.0 0.0 09:00 0.0 0.0 0.0 0.0 0.0 0.0 0.0 0.2 0.0 0.0 0.0 0.0 0.0 0.0 0.0 0.0 0.0 0.0 0.0 0.0 0.0 No realiza la actividad 99.5 99.7 99.3 99.6 98.0 98.5 99.8 99.3 99.1 99.8 99.1 99.6 97.8 99.1 100.0 99.1 97.8 97.1 99.3 98.7 99.6 Horas promedio 03:26 04:45 02:20 02:30 03:26 02:34 04:00 05:00 05:30 04:00 04:15 03:30 04:24 03:45 -- 01:45 02:09 02:55 04:00 03:30 04:30 Total 100% Base: Total de entrevistados 9814 1240 452 450 450 462 452 450 451 451 450 450 450 452 450 452 450 452 450 450 450 C - 19 CIUDAD TOTAL NACIONAL POR CIUDADES TOTAL NACIONAL POR CIUDADES CANTIDAD DE HORAS DIARIAS DEDICADAS AL TRABAJO DE LUNES A VIERNES TOTAL
- 18. LIMA AQP AYAC CAJ CHYO CHIMB CUSC HYO HCO HRAZ ICA IQTS PIUR PCPA PUNO TCNA TRUJ TBES TPTO CHYAS % % % % % % % % % % % % % % % % % % % % % Veo TV 47.9 48.5 49.6 54.9 39.3 44.4 52.0 31.3 30.4 37.3 39.8 68.9 37.8 70.8 37.8 17.3 28.0 50.7 58.4 33.6 42.0 Converso 35.1 34.6 40.5 44.9 53.1 43.1 39.4 36.2 37.7 27.1 39.3 46.7 30.4 26.8 25.8 22.3 37.1 32.1 20.0 54.9 52.9 Solo almuerzo 25.1 24.9 14.8 19.1 15.8 29.2 21.7 34.7 29.7 33.7 25.1 13.8 34.4 14.6 40.0 50.7 38.9 24.1 23.6 32.4 32.4 Escucho radio 6.0 5.6 9.3 3.3 8.4 7.1 6.2 12.7 5.1 8.6 6.9 6.0 5.6 1.8 4.2 14.6 6.4 10.4 2.4 7.1 7.6 Juego 1.2 1.0 1.8 0.9 1.1 1.3 1.8 0.4 0.4 0.0 0.9 1.3 5.1 0.7 0.4 0.9 2.0 4.2 1.6 0.2 0.2 Navego por internet 0.5 0.6 0.7 0.0 0.0 0.2 1.3 0.0 0.2 0.2 0.0 0.4 0.4 0.2 0.2 0.0 0.2 1.3 0.2 0.2 0.2 Estudia 0.1 0.1 0.7 0.0 0.0 0.0 0.0 0.0 0.0 0.0 0.0 0.4 0.0 0.0 0.0 0.0 1.3 0.0 0.0 0.0 0.0 Total : Múltiple Base: Total de entrevistados 9814 1240 452 450 450 462 452 450 451 451 450 450 450 452 450 452 450 452 450 450 450 C - 20 LIMA AQP AYAC CAJ CHYO CHIMB CUSC HYO HCO HRAZ ICA IQTS PIUR PCPA PUNO TCNA TRUJ TBES TPTO CHYAS % % % % % % % % % % % % % % % % % % % % % Veo TV 97.6 97.7 94.2 98.2 97.3 95.9 98.2 95.1 98.2 97.6 96.9 97.6 99.3 97.3 99.3 97.6 94.7 98.0 97.3 98.4 98.4 ACTIVIDADES REALIZADAS MIENTRAS ALMUERZA TOTAL CIUDAD CIUDAD TOTAL NACIONAL POR CIUDADES ACTIVIDADES REALIZADAS LOS SABADOS TOTAL
- 19. Apoyo en labores del hogar 80.8 81.0 66.8 86.4 60.0 91.6 88.3 89.6 91.6 85.8 84.0 51.8 89.6 76.1 86.0 83.2 67.8 86.7 86.9 67.8 65.6 Juego 79.3 79.8 84.3 69.8 77.3 67.3 71.5 84.0 77.8 82.3 75.8 82.0 80.2 70.6 95.3 87.6 83.8 73.2 88.2 60.9 74.4 Navego por internet 77.4 81.3 73.5 58.7 63.3 69.3 83.8 58.9 71.0 64.5 61.3 76.0 26.0 54.0 62.4 52.4 62.2 79.2 55.3 65.8 56.7 Estudio / Hago tareas 73.2 72.5 55.8 34.0 51.3 93.5 88.3 86.4 86.5 93.6 46.7 75.3 91.1 52.7 92.4 83.8 71.1 88.7 71.8 56.7 59.6 Escucho la radio 60.4 58.5 80.3 60.9 74.9 59.1 56.9 69.1 74.1 61.4 61.3 63.3 76.0 58.4 59.3 79.2 53.1 64.6 56.7 74.9 68.7 Hago deporte 52.8 52.7 55.3 26.0 76.7 53.9 31.2 61.8 73.6 69.6 20.0 60.9 43.6 24.6 86.9 48.2 44.2 57.7 53.8 63.6 75.1 Uso los video juegos 22.7 23.5 22.8 5.3 16.2 18.8 28.3 20.0 16.2 17.7 7.8 23.1 13.3 14.2 26.2 21.0 16.4 32.5 22.7 9.6 10.4 Voy a clases 4.9 5.3 1.1 1.3 2.0 8.4 1.8 8.7 6.9 4.4 2.4 0.7 2.9 3.3 1.8 7.3 4.0 1.5 2.7 1.1 2.0 Trabajo 1.2 0.7 2.2 3.6 2.4 3.0 1.3 1.3 5.5 1.3 4.4 0.4 3.6 2.0 0.7 1.5 3.6 5.3 1.8 1.3 0.7 Total : Múltiple Base: Total de entrevistados 9814 1240 452 450 450 462 452 450 451 451 450 450 450 452 450 452 450 452 450 450 450 C - 21 LIMA AQP AYAC CAJ CHYO CHIMB CUSC HYO HCO HRAZ ICA IQTS PIUR PCPA PUNO TCNA TRUJ TBES TPTO CHYAS % % % % % % % % % % % % % % % % % % % % % 01:00 1.2 1.5 0.0 0.0 0.0 2.4 0.4 0.4 0.7 1.1 0.0 0.0 0.0 0.0 0.4 0.2 0.2 0.4 0.0 0.7 0.4 02:00 1.6 1.7 0.4 0.4 1.1 1.1 0.7 2.4 2.7 2.2 0.9 0.4 1.1 2.4 0.7 1.8 2.2 0.7 2.0 0.0 1.3 03:00 0.7 0.6 0.2 0.9 0.0 1.7 0.0 2.4 0.9 0.2 1.1 0.2 1.1 0.7 0.4 2.7 0.7 0.2 0.7 0.2 0.0 03:30 0.1 0.1 0.0 0.0 0.0 0.0 0.0 0.0 0.0 0.0 0.0 0.0 0.0 0.0 0.0 0.0 0.0 0.0 0.0 0.0 0.0 04:00 0.4 0.4 0.0 0.0 0.2 0.9 0.0 1.3 0.4 0.0 0.0 0.0 0.4 0.0 0.0 0.9 0.4 0.0 0.0 0.0 0.0 05:00 0.5 0.5 0.2 0.0 0.7 1.7 0.4 0.9 1.3 0.4 0.2 0.0 0.2 0.0 0.0 0.4 0.2 0.0 0.0 0.2 0.0 06:00 0.3 0.3 0.0 0.0 0.0 0.0 0.0 0.4 0.7 0.4 0.2 0.0 0.0 0.0 0.2 1.3 0.2 0.0 0.0 0.0 0.2 08:00 0.2 0.2 0.0 0.0 0.0 0.0 0.0 0.4 0.0 0.0 0.0 0.0 0.0 0.0 0.0 0.0 0.0 0.0 0.0 0.0 0.0 CANTIDAD DE HORAS DIARIAS DEDICADAS A IR A CLASES LOS SABADOS TOTAL NACIONAL POR CIUDADES TOTAL CIUDAD
- 20. No realiza la actividad 95.1 94.7 98.9 98.7 98.0 91.6 98.2 91.3 93.1 95.6 97.6 99.3 97.1 96.7 98.2 92.7 96.0 98.5 97.3 98.9 98.0 Horas promedio 02:54 02:48 03:30 02:40 03:13 02:59 02:18 03:29 03:08 02:30 03:05 02:20 02:55 02:32 02:30 03:29 02:43 01:38 02:15 02:12 02:13 Total 100% Base: Total de entrevistados 9814 1240 452 450 450 462 452 450 451 451 450 450 450 452 450 452 450 452 450 450 450 C - 22 LIMA AQP AYAC CAJ CHYO CHIMB CUSC HYO HCO HRAZ ICA IQTS PIUR PCPA PUNO TCNA TRUJ TBES TPTO CHYAS % % % % % % % % % % % % % % % % % % % % % 00:30 2.7 3.0 1.1 0.2 0.0 2.6 8.0 1.8 1.8 0.9 0.2 1.8 3.8 0.0 0.7 0.2 2.0 1.1 2.2 0.0 0.0 01:00 20.3 20.4 16.6 2.2 14.9 14.1 21.9 20.9 28.4 33.3 4.0 16.2 24.9 24.6 32.9 25.4 8.0 23.2 16.0 20.2 8.4 01:30 0.4 0.3 0.4 0.0 0.0 1.7 2.9 0.0 1.1 0.7 0.2 0.7 0.7 0.2 0.0 0.0 1.1 0.9 0.9 0.0 0.0 02:00 34.0 33.1 31.9 26.0 29.6 35.5 35.6 42.7 35.5 46.1 36.0 50.9 34.4 24.8 53.3 40.7 35.3 44.0 32.9 32.2 43.6 02:30 0.7 0.7 0.2 0.0 0.0 0.4 1.1 0.2 0.0 0.0 0.0 0.4 0.0 0.0 0.0 0.0 0.9 2.0 0.0 0.0 0.0 03:00 10.9 10.8 4.6 5.3 4.7 21.0 14.4 12.2 15.1 11.8 5.8 5.1 22.0 2.0 4.9 14.2 15.8 13.5 16.9 3.8 5.6 03:30 0.2 0.2 0.0 0.0 0.0 0.2 0.2 0.0 0.0 0.0 0.0 0.0 0.0 0.0 0.0 0.0 1.1 0.7 0.0 0.0 0.0 04:00 3.0 3.1 0.2 0.0 1.6 8.7 4.0 6.0 2.9 0.7 0.0 0.2 5.3 0.7 0.7 2.2 4.7 2.4 2.2 0.4 1.1 05:00 0.8 0.8 0.2 0.0 0.2 4.3 0.2 1.3 0.9 0.2 0.4 0.0 0.0 0.4 0.0 1.1 0.7 0.9 0.7 0.0 0.7 06:00 0.1 0.0 0.0 0.0 0.4 4.5 0.0 1.1 0.4 0.0 0.0 0.0 0.0 0.0 0.0 0.0 0.7 0.0 0.0 0.0 0.2 No realiza la actividad 26.8 27.5 44.2 66.0 48.7 6.5 11.7 13.6 13.5 6.4 53.3 24.7 8.9 47.3 7.6 16.2 28.9 11.3 28.2 43.3 40.4 Horas promedio 01:57 01:55 01:45 02:07 01:54 02:34 01:52 02:07 01:56 01:46 02:03 01:49 02:01 01:37 01:42 01:57 02:16 01:58 02:02 01:43 02:02 Total 100% TOTAL NACIONAL POR CIUDADES CANTIDAD DE HORAS DIARIAS DEDICADAS A ESTUDIAR O HACER LAS TAREAS LOS SABADOS TOTAL CIUDAD
- 21. Base: Total de entrevistados 9814 1240 452 450 450 462 452 450 451 451 450 450 450 452 450 452 450 452 450 450 450 C - 23 LIMA AQP AYAC CAJ CHYO CHIMB CUSC HYO HCO HRAZ ICA IQTS PIUR PCPA PUNO TCNA TRUJ TBES TPTO CHYAS % % % % % % % % % % % % % % % % % % % % % 00:30 1.4 1.2 3.5 0.9 0.0 0.9 2.0 2.0 4.7 3.3 0.2 1.3 0.4 2.0 1.6 1.1 2.4 3.3 0.9 0.0 0.0 01:00 28.4 30.0 35.6 23.3 14.0 18.2 14.6 24.7 22.6 37.7 21.8 14.7 19.3 22.3 41.8 18.6 12.2 19.7 25.3 23.6 22.0 01:30 0.2 0.1 0.2 0.0 0.0 0.4 1.1 0.4 0.4 0.7 0.0 0.0 0.7 0.0 0.0 0.0 0.4 0.9 0.4 0.0 0.0 02:00 30.8 31.2 23.9 33.8 47.6 27.5 25.0 36.9 22.4 29.7 36.4 36.9 30.2 22.3 38.9 37.4 26.0 26.1 28.0 30.2 44.9 03:00 11.4 11.0 4.9 6.7 12.4 14.7 18.6 10.7 17.7 9.8 13.6 11.3 19.8 14.4 8.4 20.4 7.8 13.7 17.3 5.8 5.6 03:30 0.1 0.2 0.0 0.2 0.0 0.0 0.0 0.0 0.0 0.0 0.0 0.2 0.0 0.0 0.0 0.0 0.0 0.2 0.2 0.0 0.0 04:00 5.1 4.8 9.3 4.4 2.7 3.0 7.1 5.1 5.5 0.9 3.1 10.0 8.7 6.4 4.2 7.1 15.6 6.4 12.2 1.1 1.6 05:00 0.9 0.6 1.3 0.4 0.7 1.3 2.4 3.1 3.1 0.0 0.4 1.6 0.9 1.5 0.2 0.9 5.3 2.0 2.4 0.2 0.2 06:00 0.8 0.6 4.4 0.0 0.0 0.4 0.0 0.4 1.1 0.2 0.2 4.2 0.2 0.0 0.2 1.5 9.8 0.0 1.3 0.0 0.2 07:00 0.1 0.1 0.2 0.0 0.0 0.2 0.0 0.2 0.2 0.0 0.0 0.0 0.0 0.0 0.0 0.7 0.9 0.0 0.0 0.0 0.0 08:00 0.1 0.1 0.2 0.0 0.0 0.2 0.0 0.2 0.0 0.0 0.0 0.9 0.0 0.0 0.0 0.0 2.2 0.0 0.0 0.0 0.0 No realiza la actividad 20.7 20.2 15.7 30.2 22.7 32.7 28.5 16.0 22.2 17.7 24.2 18.0 19.8 29.4 4.7 12.4 16.2 26.8 11.8 39.1 25.6 Horas promedio 02:06 01:55 02:05 01:53 02:04 02:07 02:18 02:04 02:10 01:37 01:59 02:30 02:15 02:03 01:43 02:18 03:08 02:06 02:18 01:45 01:50 Total 100% Base: Total de entrevistados 9814 1240 452 450 450 462 452 450 451 451 450 450 450 452 450 452 450 452 450 450 450 TOTAL NACIONAL POR CIUDADES CANTIDAD DE HORAS DIARIAS DEDICADAS AL JUEGO LOS SABADOS TOTAL CIUDAD
- 22. C - 24 LIMA AQP AYAC CAJ CHYO CHIMB CUSC HYO HCO HRAZ ICA IQTS PIUR PCPA PUNO TCNA TRUJ TBES TPTO CHYAS % % % % % % % % % % % % % % % % % % % % % 00:10 0.5 0.3 0.2 1.1 0.0 0.4 0.0 0.0 0.0 0.0 4.2 0.0 0.0 9.7 0.0 0.0 0.2 0.2 1.8 0.0 0.0 00:15 0.5 0.4 2.0 0.0 0.0 0.9 1.3 0.4 0.9 0.4 0.7 0.9 0.0 0.0 0.0 0.2 1.6 1.3 0.7 0.0 0.0 00:20 0.7 0.6 0.0 0.4 0.0 0.4 0.7 0.2 0.0 0.0 1.8 0.0 0.2 9.1 0.9 0.0 1.8 0.9 2.7 0.0 0.0 00:30 13.2 13.7 19.0 14.4 0.0 7.4 18.6 3.1 6.7 8.0 15.6 9.1 16.9 21.5 6.7 2.4 18.0 10.4 21.8 0.0 0.0 01:00 45.0 47.9 33.6 47.8 38.9 39.4 42.0 38.2 34.8 33.0 47.6 22.9 33.8 30.3 37.1 38.7 24.2 32.3 41.1 54.9 49.1 01:30 0.4 0.3 0.4 0.0 0.0 1.5 1.1 0.7 0.2 0.4 0.0 0.9 0.9 0.0 0.0 0.2 1.1 1.5 0.2 0.0 0.0 02:00 13.9 12.3 7.7 21.3 18.0 25.3 15.0 26.0 23.7 26.8 12.9 12.9 26.9 3.5 31.8 30.3 12.4 24.8 12.7 12.4 14.7 03:00 3.8 3.0 1.5 0.9 2.7 10.6 6.4 11.1 15.5 14.4 0.9 3.6 8.2 0.4 7.1 8.4 5.1 10.4 3.1 0.4 1.6 04:00 1.7 1.7 1.8 0.4 0.2 2.8 2.0 4.0 3.8 2.0 0.4 0.4 2.0 0.0 1.1 1.5 1.6 2.7 1.8 0.0 0.0 05:00 0.6 0.6 0.2 0.0 0.2 1.3 1.1 3.6 2.7 0.2 0.0 0.7 0.7 0.0 0.0 1.1 0.2 1.5 0.7 0.0 0.2 06:00 0.2 0.2 0.0 0.0 0.0 0.9 0.0 0.7 2.4 0.4 0.0 0.0 0.0 0.0 0.9 0.2 0.2 0.0 0.2 0.0 0.0 No realiza la actividad 19.2 19.0 33.2 13.6 40.0 8.4 11.7 10.4 8.4 14.2 16.0 48.2 10.4 23.9 14.0 16.8 32.2 13.3 13.1 32.2 34.4 Horas promedio 01:24 01:13 01:05 01:11 01:24 01:40 01:19 01:57 01:59 01:42 01:02 01:23 01:29 00:43 01:36 01:40 01:17 01:37 01:09 01:11 01:17 Total 100% Base: Total de entrevistados 9814 1240 452 450 450 462 452 450 451 451 450 450 450 452 450 452 450 452 450 450 450 C - 25 TOTAL NACIONAL POR CIUDADES CANTIDAD DE HORAS DIARIAS DEDICADAS AL APOYO EN LABORES DEL HOGAR LOS SABADOS TOTAL CIUDAD TOTAL NACIONAL POR CIUDADES
- 23. LIMA AQP AYAC CAJ CHYO CHIMB CUSC HYO HCO HRAZ ICA IQTS PIUR PCPA PUNO TCNA TRUJ TBES TPTO CHYAS % % % % % % % % % % % % % % % % % % % % % 00:10 0.1 0.1 0.0 0.0 0.0 0.2 0.2 0.0 0.0 0.0 0.0 0.0 0.0 2.7 0.0 0.0 0.4 0.4 0.0 0.0 0.0 00:15 0.1 0.0 0.4 0.0 0.0 1.5 0.4 0.0 3.1 0.2 0.0 0.4 0.0 0.0 0.0 0.0 0.7 0.7 0.0 0.0 0.0 00:20 0.1 0.0 0.0 0.0 0.0 0.2 0.2 0.0 0.2 0.0 0.2 0.0 0.0 6.0 0.0 0.0 0.4 0.0 0.0 0.0 0.0 00:30 5.0 4.4 14.8 3.1 0.0 3.7 9.5 4.9 16.9 8.6 3.1 9.8 7.1 5.3 8.9 6.9 3.8 3.5 2.7 0.0 0.0 01:00 30.7 31.5 36.9 37.3 42.4 22.9 20.6 26.0 30.8 20.0 34.4 22.7 32.9 23.9 21.6 33.4 17.8 25.2 17.1 40.9 37.6 01:30 0.1 0.1 0.7 0.0 0.0 0.2 0.4 0.4 0.9 0.2 0.4 0.2 0.9 0.0 0.0 0.0 0.2 0.4 0.0 0.0 0.0 02:00 17.5 17.5 23.5 16.2 26.0 10.4 13.5 15.1 9.5 18.4 18.2 21.3 22.4 14.2 18.0 23.7 14.9 17.0 20.4 27.8 23.3 03:00 3.7 2.9 2.0 3.3 4.7 10.2 6.6 9.8 6.0 5.8 3.1 5.8 7.6 3.1 6.4 9.5 5.6 8.6 9.8 5.3 4.9 04:00 1.2 0.9 1.3 0.4 0.9 3.5 2.0 4.7 2.9 4.9 0.4 0.9 2.2 0.4 1.8 1.8 2.7 2.9 3.6 0.9 2.4 05:00 1.0 0.8 0.4 0.4 0.4 2.6 2.4 5.1 2.2 0.9 1.1 0.7 1.6 1.3 1.3 2.7 1.1 3.1 1.8 0.0 0.0 06:00 0.4 0.2 0.2 0.0 0.2 2.2 0.4 1.3 1.1 2.0 0.2 0.4 1.1 0.0 0.7 0.4 1.3 1.8 1.1 0.0 0.4 08:00 0.1 0.1 0.0 0.0 0.0 0.2 0.0 1.6 0.0 0.2 0.0 0.2 0.0 0.0 0.4 0.4 1.6 0.0 0.0 0.0 0.0 No realiza la actividad 39.6 41.5 19.7 39.1 25.1 40.9 43.1 30.9 25.9 38.6 38.7 36.7 24.0 41.6 40.7 20.8 46.9 35.4 43.3 25.1 31.3 Horas promedio 01:41 01:29 01:20 01:24 01:33 02:07 01:42 02:14 01:28 01:55 01:29 01:39 01:42 01:19 01:43 01:48 02:12 02:01 02:08 01:32 01:37 Total 100% Base: Total de entrevistados 9814 1240 452 450 450 462 452 450 451 451 450 450 450 452 450 452 450 452 450 450 450 C - 26 CIUDAD TOTAL NACIONAL POR CIUDADES CANTIDAD DE HORAS DIARIAS DEDICADAS A VER TELEVISION LOS SABADOS CANTIDAD DE HORAS DIARIAS DEDICADAS A ESCUCHAR RADIO LOS SABADOS TOTAL
- 24. LIMA AQP AYAC CAJ CHYO CHIMB CUSC HYO HCO HRAZ ICA IQTS PIUR PCPA PUNO TCNA TRUJ TBES TPTO CHYAS % % % % % % % % % % % % % % % % % % % % % 00:30 2.3 2.3 6.9 1.6 0.0 0.9 2.9 2.9 3.8 1.1 1.3 3.1 0.2 0.4 0.2 0.7 1.3 1.8 0.2 0.0 0.0 01:00 10.7 10.6 11.7 14.7 3.8 15.8 9.7 17.1 12.6 8.6 16.9 6.4 6.0 5.5 5.3 12.8 16.4 14.8 11.8 3.6 6.4 01:30 0.3 0.2 0.7 0.7 0.0 0.0 1.5 0.9 0.0 0.2 0.2 1.6 0.0 0.2 0.0 0.0 0.7 0.2 0.9 0.0 0.0 02:00 28.3 28.5 33.8 53.3 15.1 29.2 19.9 42.7 25.7 24.8 43.6 18.9 13.1 26.3 23.3 27.2 31.8 27.4 18.2 23.6 19.3 02:30 0.2 0.2 0.2 0.7 0.0 0.6 1.3 0.0 0.2 0.2 0.0 0.2 0.0 0.0 0.0 0.0 0.9 0.7 0.0 0.0 0.0 03:00 31.9 33.0 31.0 24.4 41.3 22.7 32.3 16.9 36.8 36.4 30.2 27.6 20.2 33.0 24.0 36.5 13.1 29.0 19.1 38.9 47.1 03:30 0.4 0.5 0.2 0.0 0.0 0.0 0.9 0.0 0.0 0.0 0.0 0.0 0.0 0.0 0.0 0.0 0.7 0.4 0.0 0.0 0.0 04:00 16.4 16.1 7.7 2.4 32.9 16.0 20.1 10.2 12.4 18.0 2.9 28.4 24.2 17.7 31.1 17.0 18.9 14.2 19.1 26.4 21.6 04:30 0.1 0.2 0.0 0.0 0.0 0.0 0.2 0.0 0.2 0.0 0.0 0.0 0.0 0.0 0.0 0.0 0.4 0.0 0.0 0.0 0.0 05:00 5.0 4.5 0.4 0.0 4.2 5.0 5.5 3.6 4.4 7.3 1.6 9.1 21.1 10.8 10.0 1.8 5.3 4.9 18.4 5.6 3.8 06:00 1.8 1.5 0.7 0.4 0.0 4.1 2.9 0.7 0.9 0.4 0.2 1.8 12.0 2.4 4.2 1.1 4.9 3.1 6.4 0.2 0.2 07:00 0.1 0.0 0.2 0.0 0.0 0.6 0.4 0.0 0.9 0.2 0.0 0.0 1.1 0.9 0.2 0.2 0.2 0.7 1.8 0.0 0.0 08:00 0.2 0.2 0.2 0.0 0.0 0.6 0.0 0.0 0.0 0.2 0.0 0.2 1.3 0.0 0.9 0.2 0.0 0.2 0.7 0.0 0.0 No realiza la actividad 2.4 2.3 5.8 1.8 2.7 4.1 1.8 4.9 1.8 2.4 3.1 2.4 0.7 2.7 0.7 2.4 5.3 2.0 2.7 1.6 1.6 Horas promedio 02:51 02:44 02:19 02:08 03:11 02:47 02:56 02:17 02:39 02:54 02:13 03:06 03:53 03:07 03:20 02:42 02:45 02:45 03:26 03:05 02:58 Total 100% Base: Total de entrevistados 9814 1240 452 450 450 462 452 450 451 451 450 450 450 452 450 452 450 452 450 450 450 C - 27 LIMA AQP AYAC CAJ CHYO CHIMB CUSC HYO HCO HRAZ ICA IQTS PIUR PCPA PUNO TCNA TRUJ TBES TPTO CHYAS TOTAL CIUDAD TOTAL NACIONAL POR CIUDADES CANTIDAD DE HORAS DIARIAS DEDICADAS A HACER DEPORTE LOS SABADOS CIUDAD TOTAL
- 25. % % % % % % % % % % % % % % % % % % % % % 00:30 1.3 1.1 6.4 0.2 0.0 0.9 0.2 1.8 4.2 1.3 0.0 2.4 0.0 0.2 0.4 0.9 1.8 2.2 0.7 0.0 0.0 01:00 27.9 29.2 32.1 12.2 37.8 19.0 11.5 28.0 28.4 34.4 7.8 30.4 13.8 15.7 45.6 24.1 18.0 20.8 25.1 26.2 32.0 01:30 0.4 0.3 0.4 0.2 0.0 1.1 0.9 0.2 0.0 0.4 0.0 0.2 0.2 0.0 0.0 0.2 1.1 1.1 0.4 0.0 0.0 02:00 17.9 17.3 13.1 11.1 35.6 21.2 13.7 22.7 22.6 22.6 12.0 18.9 20.2 8.0 29.1 17.7 16.9 24.1 19.6 35.6 40.9 02:30 0.1 0.1 0.2 0.0 0.0 0.4 0.4 0.0 0.0 0.0 0.0 0.0 0.0 0.0 0.0 0.0 0.0 0.7 0.0 0.0 0.0 03:00 4.0 3.7 1.5 1.6 3.3 8.0 2.7 7.6 12.0 7.8 0.0 3.1 8.0 0.7 7.6 3.3 2.4 7.1 6.0 1.3 2.2 03:30 0.1 0.1 0.0 0.0 0.0 0.0 0.0 0.0 0.0 0.0 0.0 0.0 0.0 0.0 0.0 0.0 0.0 0.0 0.0 0.0 0.0 04:00 0.7 0.5 1.5 0.2 0.0 2.4 1.1 0.4 4.7 2.7 0.0 4.4 1.3 0.0 3.6 0.7 2.9 0.4 1.1 0.4 0.0 05:00 0.2 0.2 0.0 0.2 0.0 0.6 0.7 0.7 1.6 0.4 0.0 0.4 0.0 0.0 0.2 0.4 0.4 0.7 0.4 0.0 0.0 06:00 0.1 0.1 0.0 0.0 0.0 0.0 0.0 0.0 0.0 0.0 0.0 0.4 0.0 0.0 0.2 0.7 0.0 0.0 0.2 0.0 0.0 07:00 0.1 0.1 0.0 0.2 0.0 0.0 0.0 0.0 0.0 0.0 0.0 0.0 0.0 0.0 0.2 0.0 0.0 0.0 0.0 0.0 0.0 No realiza la actividad 47.2 47.3 44.7 74.0 23.3 46.1 68.8 38.2 26.4 30.4 80.0 39.1 56.4 75.4 13.1 51.8 55.8 42.3 46.2 36.4 24.9 Horas promedio 01:39 01:31 01:19 01:39 01:33 01:52 01:50 01:42 01:52 01:40 01:35 01:40 01:55 01:22 01:40 01:38 01:42 01:44 01:41 01:37 01:36 Total 100% Base: Total de entrevistados 9814 1240 452 450 450 462 452 450 451 451 450 450 450 452 450 452 450 452 450 450 450 C - 28 LIMA AQP AYAC CAJ CHYO CHIMB CUSC HYO HCO HRAZ ICA IQTS PIUR PCPA PUNO TCNA TRUJ TBES TPTO CHYAS % % % % % % % % % % % % % % % % % % % % % 00:15 0.1 0.0 0.2 0.2 0.0 0.2 0.0 0.0 3.8 0.0 0.0 0.0 0.0 0.0 0.0 0.2 0.2 0.2 0.2 0.0 0.0 00:30 5.7 5.4 11.7 8.2 0.0 5.4 8.0 6.9 18.8 13.1 9.3 13.3 2.2 2.7 3.3 3.3 4.4 5.1 3.8 0.0 0.0 01:00 36.7 39.5 22.6 36.2 33.6 29.9 20.4 27.8 26.8 28.4 38.2 29.6 10.9 28.5 28.2 34.7 25.1 32.5 18.9 38.0 40.2 01:30 0.8 0.8 0.4 0.0 0.0 1.1 1.3 0.2 1.6 2.7 0.4 0.7 0.4 0.4 0.2 0.2 0.9 1.3 1.1 0.0 0.0 TOTAL NACIONAL POR CIUDADES CANTIDAD DE HORAS DIARIAS DEDICADAS A NAVEGAR POR INTERNET LOS SABADOS TOTAL CIUDAD
- 26. 02:00 21.8 22.8 26.1 11.3 25.8 20.8 27.7 19.3 11.5 16.4 10.7 21.6 8.7 13.1 23.3 10.8 18.7 17.7 16.0 21.8 14.0 02:30 0.1 0.1 0.0 0.0 0.0 0.0 0.7 0.0 0.0 0.0 0.0 0.0 0.0 0.0 0.0 0.0 0.2 0.2 0.0 0.0 0.0 03:00 7.1 7.4 8.6 2.0 3.1 7.1 13.7 2.0 5.5 3.1 2.2 5.8 3.1 4.9 4.7 1.8 5.3 11.3 7.8 4.7 1.8 03:30 0.1 0.1 0.2 0.0 0.0 0.2 0.0 0.0 0.0 0.0 0.0 0.0 0.0 0.0 0.0 0.0 0.0 0.2 0.0 0.0 0.0 04:00 3.1 3.3 2.9 0.4 0.7 1.9 7.3 1.1 1.8 0.4 0.0 3.3 0.2 1.5 1.6 0.2 3.8 7.3 4.7 0.9 0.2 04:30 0.1 0.1 0.0 0.0 0.0 0.0 0.0 0.0 0.0 0.0 0.0 0.0 0.0 0.0 0.0 0.0 0.0 0.0 0.0 0.0 0.0 05:00 1.1 1.2 0.2 0.0 0.2 0.9 2.9 0.7 0.4 0.4 0.4 1.1 0.4 0.7 0.2 1.1 1.3 2.2 1.6 0.4 0.2 06:00 0.4 0.4 0.4 0.0 0.0 0.4 1.1 0.2 0.2 0.0 0.0 0.0 0.0 0.0 0.4 0.0 1.8 1.1 1.1 0.0 0.0 07:00 0.1 0.1 0.0 0.0 0.0 0.4 0.4 0.2 0.0 0.0 0.0 0.0 0.0 0.0 0.0 0.0 0.0 0.0 0.0 0.0 0.0 09:00 0.1 0.1 0.0 0.0 0.0 0.2 0.0 0.0 0.0 0.0 0.0 0.0 0.0 0.0 0.0 0.0 0.0 0.0 0.0 0.0 0.0 No realiza la actividad 22.6 18.7 26.5 41.3 36.7 30.7 16.2 41.1 29.0 35.5 38.7 24.0 74.0 46.0 37.6 47.6 37.8 20.8 44.7 34.2 43.3 Horas promedio 01:36 01:39 01:40 01:12 01:33 01:43 02:08 01:28 01:17 01:19 01:12 01:34 01:37 01:30 01:40 01:20 01:52 01:57 02:02 01:32 01:22 Total 100% Base: Total de entrevistados 9814 1240 452 450 450 462 452 450 451 451 450 450 450 452 450 452 450 452 450 450 450 C - 29 LIMA AQP AYAC CAJ CHYO CHIMB CUSC HYO HCO HRAZ ICA IQTS PIUR PCPA PUNO TCNA TRUJ TBES TPTO CHYAS % % % % % % % % % % % % % % % % % % % % % 00:20 0.1 0.0 0.0 0.0 0.0 0.2 0.0 0.0 0.0 0.2 0.0 0.0 0.0 2.0 0.2 0.0 0.0 0.0 0.0 0.0 0.0 00:30 3.3 3.4 5.8 3.3 0.0 1.7 3.5 3.1 4.2 5.1 5.1 3.1 1.1 1.3 4.7 1.1 2.0 2.9 2.7 0.0 0.0 01:00 13.6 14.4 14.6 1.6 15.3 10.8 16.2 10.4 8.2 8.4 2.2 12.0 8.0 5.8 12.0 13.3 6.7 19.0 13.6 8.7 10.4 01:30 0.1 0.0 0.0 0.0 0.0 0.0 0.2 0.0 0.0 0.4 0.0 0.0 0.4 0.4 0.0 0.0 0.9 0.9 0.7 0.0 0.0 02:00 4.4 4.6 2.0 0.4 0.9 4.1 6.2 4.2 2.4 2.9 0.2 6.9 2.9 2.7 8.4 4.9 4.9 5.1 5.1 0.9 0.0 TOTAL CIUDAD TOTAL NACIONAL POR CIUDADES CANTIDAD DE HORAS DIARIAS DEDICADAS A LOS VIDEO JUEGOS LOS SABADOS
- 27. 02:30 0.1 0.1 0.2 0.0 0.0 0.0 0.2 0.0 0.0 0.0 0.0 0.0 0.0 0.0 0.0 0.0 0.0 0.0 0.0 0.0 0.0 03:00 1.0 1.0 0.2 0.0 0.0 1.3 1.5 1.3 0.4 0.2 0.2 0.9 0.9 0.2 0.7 0.9 1.1 3.3 0.2 0.0 0.0 05:00 0.1 0.1 0.0 0.0 0.0 0.4 0.2 0.0 0.2 0.0 0.0 0.0 0.0 0.0 0.0 0.2 0.0 0.0 0.0 0.0 0.0 No realiza la actividad 77.3 76.5 77.2 94.7 83.8 81.2 71.7 80.0 83.8 82.3 92.2 76.9 86.7 85.8 73.8 79.0 83.6 67.5 77.3 90.4 89.6 Horas promedio 01:15 01:13 00:59 00:46 01:03 01:25 01:18 01:22 01:12 01:07 00:45 01:20 01:19 01:06 01:18 01:24 01:30 01:29 01:13 01:05 01:00 Total 100% Base: Total de entrevistados 9814 1240 452 450 450 462 452 450 451 451 450 450 450 452 450 452 450 452 450 450 450 C - 30 LIMA AQP AYAC CAJ CHYO CHIMB CUSC HYO HCO HRAZ ICA IQTS PIUR PCPA PUNO TCNA TRUJ TBES TPTO CHYAS % % % % % % % % % % % % % % % % % % % % % 01:00 0.2 0.2 0.2 0.2 0.0 0.9 0.2 0.0 0.0 0.0 0.2 0.0 0.4 0.0 0.0 0.2 0.4 0.7 0.0 0.2 0.2 02:00 0.1 0.0 0.7 0.4 0.4 0.6 0.4 0.2 0.7 0.2 0.7 0.0 0.2 0.0 0.0 0.2 0.7 1.1 0.0 0.0 0.0 03:00 0.2 0.2 0.2 0.7 0.4 0.4 0.0 0.7 0.2 0.0 0.9 0.2 0.2 0.9 0.0 0.0 0.2 0.2 0.0 0.4 0.0 04:00 0.1 0.0 0.2 0.2 0.2 0.6 0.0 0.2 1.1 0.4 0.7 0.2 1.3 0.2 0.2 0.0 0.9 1.1 0.0 0.4 0.2 05:00 0.2 0.1 0.2 1.1 0.2 0.2 0.4 0.0 0.4 0.2 1.6 0.0 0.2 0.7 0.4 0.2 0.0 1.1 0.9 0.2 0.0 06:00 0.1 0.1 0.0 0.2 0.9 0.2 0.2 0.0 1.8 0.0 0.4 0.0 0.0 0.2 0.0 0.7 0.4 0.4 0.2 0.0 0.0 08:00 0.2 0.2 0.2 0.7 0.0 0.0 0.0 0.2 0.9 0.0 0.0 0.0 0.9 0.0 0.0 0.2 0.7 0.4 0.4 0.0 0.0 12:00 0.1 0.1 0.0 0.0 0.0 0.0 0.0 0.0 0.0 0.2 0.0 0.0 0.0 0.0 0.0 0.0 0.0 0.0 0.0 0.0 0.0 No realiza la actividad 98.8 99.3 97.8 96.4 97.6 97.0 98.7 98.7 94.5 98.7 95.6 99.6 96.4 98.0 99.3 98.5 96.4 94.7 98.2 98.7 99.3 Horas promedio 04:27 05:13 04:24 04:33 04:49 02:47 03:30 03:50 05:28 05:25 03:54 03:30 04:52 04:06 04:40 04:51 04:33 03:43 06:30 03:20 05:00 CANTIDAD DE HORAS DEDICADAS AL TRABAJO LOS SABADOS TOTAL NACIONAL POR CIUDADES TOTAL CIUDAD
- 28. Total 100% Base: Total de entrevistados 9814 1240 452 450 450 462 452 450 451 451 450 450 450 452 450 452 450 452 450 450 450 C - 31 LIMA AQP AYAC CAJ CHYO CHIMB CUSC HYO HCO HRAZ ICA IQTS PIUR PCPA PUNO TCNA TRUJ TBES TPTO CHYAS % % % % % % % % % % % % % % % % % % % % % Nacionales 31.1 30.4 46.0 4.8 62.4 43.9 32.0 32.7 34.0 22.1 2.0 50.7 22.8 6.1 46.1 29.8 26.4 45.4 13.1 61.9 67.2 Internacionales 68.8 69.5 54.0 95.2 37.6 56.1 68.0 67.3 66.0 77.4 98.0 49.3 77.2 93.4 53.9 70.2 73.6 54.2 83.9 38.1 32.8 No sabe / no opina 0.1 0.1 0.0 0.0 0.0 0.0 0.0 0.0 0.0 0.5 0.0 0.0 0.0 0.5 0.0 0.0 0.0 0.5 3.0 0.0 0.0 Total : 100% Base: Entrevistados que tienen televisión pagada 4952 1044 252 187 181 189 222 159 156 195 251 225 237 196 165 124 178 216 236 365 174 C - 32 CIUDAD TOTAL NACIONAL POR CIUDADES PREFERENCIA DE CANALES NACIONALES O INTERNACIONALES TOTAL NACIONAL POR CIUDADES TOTAL
- 29. LIMA AQP AYAC CAJ CHYO CHIMB CUSC HYO HCO HRAZ ICA IQTS PIUR PCPA PUNO TCNA TRUJ TBES TPTO CHYAS % % % % % % % % % % % % % % % % % % % % % Entretiene / divierte / alegra 75.9 78.5 78.4 33.3 79.6 61.4 67.6 63.5 45.3 44.2 0.0 72.8 35.2 16.7 23.7 54.1 48.9 54.1 19.4 86.3 91.5 Por los programas concursos 55.6 56.8 69.8 88.9 75.2 37.3 57.7 13.5 35.8 44.2 100.0 41.2 27.8 83.3 48.7 16.2 55.3 33.7 45.2 60.2 77.8 Son chistosos / graciosos / hacen reír 53.5 58.0 19.8 0.0 70.8 30.1 45.1 3.8 13.2 11.6 60.0 21.1 13.0 16.7 27.6 5.4 29.8 31.6 12.9 60.2 64.1 Por los dibujos animados 26.3 27.8 31.0 0.0 19.5 25.3 8.5 23.1 26.4 14.0 0.0 22.8 27.8 0.0 5.3 2.7 17.0 13.3 9.7 3.1 8.5 Por la variedad de programas 16.9 17.0 38.8 0.0 10.6 10.8 1.4 21.2 13.2 9.3 0.0 7.0 35.2 8.3 7.9 18.9 6.4 8.2 3.2 8.4 6.8 Por las noticias 12.3 12.0 42.2 0.0 5.3 2.4 9.9 5.8 5.7 16.3 0.0 10.5 20.4 8.3 1.3 10.8 4.3 9.2 12.9 4.0 1.7 Por su programación 10.4 8.5 52.6 22.2 6.2 9.6 15.5 0.0 1.9 11.6 0.0 21.1 33.3 8.3 13.2 10.8 10.6 14.3 19.4 9.7 18.8 Hay más canales 0.8 0.6 1.7 11.1 0.0 1.2 2.8 1.9 0.0 0.0 0.0 0.0 3.7 0.0 0.0 0.0 0.0 3.1 9.7 0.0 0.0 Total : Múltiple Base: Entrevistados que tienen televisión pagada y prefieren canales nacionales 1674 317 116 9 113 83 71 52 53 43 5 114 54 12 76 37 47 98 31 226 117 C - 33 RAZONES POR LAS QUE SE PREFIERE LOS CANALES NACIONALES CIUDAD TOTAL TOTAL NACIONAL POR CIUDADES RAZONES POR LAS QUE SE PREFIERE LOS CANALES INTERNACIONALES TOTAL CIUDAD
- 30. LIMA AQP AYAC CAJ CHYO CHIMB CUSC HYO HCO HRAZ ICA IQTS PIUR PCPA PUNO TCNA TRUJ TBES TPTO CHYAS % % % % % % % % % % % % % % % % % % % % % Por la variedad de programas 56.5 57.6 48.5 38.8 77.9 43.4 55.0 53.3 55.3 60.9 47.6 24.3 53.0 65.6 36.0 49.4 28.2 38.5 52.0 47.5 56.1 Por los dibujos animados 41.7 41.5 64.0 42.7 26.5 45.3 45.7 19.6 52.4 53.6 52.4 37.8 43.7 38.3 57.3 29.9 39.7 26.5 46.5 33.1 31.6 Hay más canales 32.6 32.8 35.3 66.3 2.9 20.8 44.4 18.7 8.7 6.6 32.1 31.5 32.8 43.7 5.6 14.9 55.0 35.9 40.9 15.1 10.5 Entretiene / divierte / alegra 32.1 33.2 45.6 9.0 61.8 48.1 20.5 45.8 20.4 4.0 6.1 38.7 30.6 2.7 11.2 24.1 13.0 22.2 3.5 42.4 43.9 Por su programación 14.1 13.5 20.6 16.3 7.4 19.8 10.6 13.1 7.8 9.3 19.1 26.1 30.1 23.5 10.1 23.0 5.3 17.9 13.6 7.2 8.8 Chistosos / graciosos / hacen reír 11.6 12.1 8.1 0.0 16.2 27.4 10.6 10.3 1.9 1.3 0.0 13.5 7.1 0.0 0.0 12.6 3.8 15.4 0.0 15.1 7.0 Por los programas concursos 5.9 5.6 16.9 0.6 26.5 15.1 2.0 5.6 9.7 1.3 0.0 4.5 12.0 1.1 1.1 6.9 1.5 5.1 1.5 12.9 8.8 Por las noticias 2.9 2.6 11.8 0.6 5.9 7.5 4.0 0.9 0.0 5.3 0.0 2.7 14.8 0.0 0.0 5.7 0.8 3.4 1.5 5.0 3.5 Por los deportes 0.4 0.4 0.0 0.0 0.0 0.0 0.7 0.0 0.0 0.0 0.0 0.0 0.0 0.5 0.0 0.0 0.8 0.9 0.0 1.4 0.0 Son educativos / culturales 0.3 0.3 0.0 0.0 0.0 1.9 0.0 0.9 0.0 0.7 1.6 0.0 0.0 0.0 0.0 4.6 0.0 0.9 1.0 0.7 0.0 Total : Múltiple Base: Entrevistados que tienen televisión pagada y prefieren canales internacionales 3267 726 136 178 68 106 151 107 103 151 246 111 183 183 89 87 131 117 198 139 57 C - 34 CIUDAD TOTAL TOTAL NACIONAL POR CIUDADES ACTIVIDADES REALIZADAS AL NAVEGAR POR INTERNET TOTAL
- 31. LIMA AQP AYAC CAJ CHYO CHIMB CUSC HYO HCO HRAZ ICA IQTS PIUR PCPA PUNO TCNA TRUJ TBES TPTO CHYAS % % % % % % % % % % % % % % % % % % % % % Buscar información para mis tareas 77.1 75.4 91.6 96.9 96.2 80.3 62.9 92.4 87.1 79.5 86.1 88.3 86.6 75.1 66.1 98.5 83.5 75.8 86.5 97.9 99.0 Chatear y usar redes sociales (FB, Twitter) 68.7 69.7 69.3 72.5 65.8 66.7 69.9 42.4 52.8 71.1 71.5 69.1 54.7 80.4 70.5 64.2 56.6 60.5 78.4 71.3 61.6 Jugar en internet / red 40.1 38.6 70.9 6.3 41.9 44.3 67.9 33.2 51.3 47.8 17.6 45.9 18.0 22.9 43.6 18.9 66.4 56.9 13.8 34.3 33.6 Descargar música, fotos, videos 28.2 29.4 25.1 8.8 16.0 29.5 26.5 20.7 17.3 19.3 13.6 32.2 20.9 10.3 22.5 38.7 28.3 33.4 13.8 26.0 20.4 Ver videos en línea 18.6 17.4 24.3 0.6 17.9 27.6 39.9 21.2 23.1 21.1 0.3 28.1 10.5 4.7 23.5 21.2 51.3 30.0 4.3 19.3 13.8 Enviar o recibir e-mails 9.1 8.7 15.9 0.0 16.9 7.9 6.6 4.7 6.6 9.3 0.3 11.7 23.3 1.7 5.4 11.6 19.3 14.5 0.7 25.4 18.3 Escuchar radio por internet 5.5 4.5 19.7 1.6 4.8 8.2 9.8 2.6 1.5 4.7 3.6 13.9 1.2 6.3 4.7 3.8 5.3 21.1 2.8 5.8 1.7 Ver TV por internet 4.4 2.8 21.6 5.3 2.9 9.6 12.4 1.8 2.0 3.4 4.5 10.9 1.7 3.7 7.0 2.6 6.7 25.2 5.3 4.9 1.4 Leer noticias 4.1 3.7 3.2 0.6 6.7 4.1 9.1 2.1 4.6 12.7 0.3 3.8 7.0 0.7 4.7 2.3 7.0 11.1 1.4 6.7 9.0 Escuchar música 0.4 0.4 0.0 0.0 0.0 0.8 3.8 0.0 1.0 0.0 0.0 0.0 0.0 0.0 1.0 0.0 0.0 0.7 0.0 0.0 0.0 Total : Múltiple Base: Entrevistados que navegan por internet 7416 1073 371 320 313 366 396 382 394 322 330 366 172 301 298 344 357 413 282 327 289 C - 35 LIMA AQP AYAC CAJ CHYO CHIMB CUSC HYO HCO HRAZ ICA IQTS PIUR PCPA PUNO TCNA TRUJ TBES TPTO CHYAS % % % % % % % % % % % % % % % % % % % % % TOTAL NACIONAL POR CIUDADES OTRAS FORMAS DE VER TELEVISION TOTAL TOTAL CIUDAD
- 32. Youtube por internet 10.5 10.0 20.6 4.0 2.4 13.6 13.1 9.1 9.8 8.0 6.0 11.6 3.8 7.3 15.1 4.9 8.9 25.9 5.3 3.3 0.4 Sitios de canales por internet 4.9 4.5 6.0 1.1 0.9 8.9 10.4 2.0 8.4 3.5 2.9 4.0 1.6 3.1 2.9 1.5 2.4 19.5 5.1 0.9 0.7 Teléfono Celular 1.4 0.9 2.2 1.1 0.7 3.9 4.4 2.2 7.1 2.2 0.0 0.4 4.7 1.1 0.4 1.8 1.1 8.6 1.1 0.4 0.2 Ninguna 85.9 87.3 74.6 94.4 96.2 78.1 75.9 87.3 76.9 86.9 92.0 87.3 90.0 90.9 83.1 92.9 89.6 56.0 89.3 95.8 98.7 Total : Múltiple Base: Total de entrevistados 9814 1240 452 450 450 462 452 450 451 451 450 450 450 452 450 452 450 452 450 450 450 C - 36 LIMA AQP AYAC CAJ CHYO CHIMB CUSC HYO HCO HRAZ ICA IQTS PIUR PCPA PUNO TCNA TRUJ TBES TPTO CHYAS % % % % % % % % % % % % % % % % % % % % % Te perdiste un capítulo o programa que te gusta 71.4 74.7 81.7 44.0 47.1 67.3 71.6 40.4 46.2 35.6 86.1 70.2 42.2 73.2 51.3 68.8 83.0 63.3 62.5 31.6 83.3 Puedes ver los programas en el momento que quieras 39.2 39.9 40.9 72.0 47.1 42.6 27.5 47.4 22.1 25.4 47.2 24.6 20.0 78.0 36.8 15.6 21.3 36.7 58.3 63.2 0.0 Puedes ver los programas en el lugar que quieras 19.0 20.3 13.9 4.0 5.9 18.8 11.0 14.0 26.0 25.4 0.0 21.1 35.6 2.4 21.1 18.8 8.5 14.6 4.2 21.1 16.7 No te dejan ver los programas y de esta forma los puedes ver 6.9 5.7 5.2 4.0 11.8 4.0 10.1 10.5 10.6 30.5 0.0 15.8 15.6 4.9 14.5 0.0 0.0 13.1 0.0 5.3 0.0 CIUDAD TOTAL NACIONAL POR CIUDADES RAZONES POR LAS QUE HA VISTO TELEVISION POR OTROS MEDIOS TOTAL
- 33. No lo pudo ver en el cable 0.7 0.6 0.9 0.0 0.0 1.0 0.9 0.0 1.9 0.0 2.8 0.0 0.0 4.9 0.0 0.0 0.0 0.0 2.1 5.3 0.0 Total : Múltiple Base: Entrevistados que ven televisión de otras formas 1351 158 115 25 17 101 109 57 104 59 36 57 45 41 76 32 47 199 48 19 6 C - 37 LIMA AQP AYAC CAJ CHYO CHIMB CUSC HYO HCO HRAZ ICA IQTS PIUR PCPA PUNO TCNA TRUJ TBES TPTO CHYAS % % % % % % % % % % % % % % % % % % % % % Si 16.3 15.2 29.6 8.2 3.6 24.2 20.1 24.4 14.2 27.3 11.6 24.7 8.2 15.0 29.6 14.6 14.2 25.7 14.4 7.1 1.6 No 83.7 84.8 70.4 91.8 96.4 75.8 79.9 75.6 85.8 72.7 88.4 75.3 91.8 85.0 70.4 85.4 85.8 74.3 85.6 92.9 98.4 Total : 100% Base: Total de entrevistados 9814 1240 452 450 450 462 452 450 451 451 450 450 450 452 450 452 450 452 450 450 450 C - 38 TOTAL USO DE FACEBOOK PARA OPINAR SOBRE PROGRAMAS DE TELEVISIÓN TOTAL NACIONAL POR CIUDADES CIUDAD
- 34. LIMA AQP AYAC CAJ CHYO CHIMB CUSC HYO HCO HRAZ ICA IQTS PIUR PCPA PUNO TCNA TRUJ TBES TPTO CHYAS % % % % % % % % % % % % % % % % % % % % % Si 3.4 3.3 1.3 0.0 0.7 6.5 3.3 5.3 3.5 4.9 1.3 2.2 2.4 1.1 9.3 3.1 1.3 10.2 1.6 0.9 0.4 No 96.6 96.7 98.7 100.0 99.3 93.5 96.7 94.7 96.5 95.1 98.7 97.8 97.6 98.9 90.7 96.9 98.7 89.8 98.4 99.1 99.6 Total : 100% Base: Total de entrevistados 9814 1240 452 450 450 462 452 450 451 451 450 450 450 452 450 452 450 452 450 450 450 C - 39 LIMA AQP AYAC CAJ CHYO CHIMB CUSC HYO HCO HRAZ ICA IQTS PIUR PCPA PUNO TCNA TRUJ TBES TPTO CHYAS % % % % % % % % % % % % % % % % % % % % % TOTAL NACIONAL POR CIUDADES OTRAS FORMAS DE ESCUCHAR RADIO TOTAL CIUDAD USO DE TWITTER PARA OPINAR SOBRE PROGRAMAS DE TELEVISIÓN TOTAL NACIONAL POR CIUDADES CIUDAD TOTAL
- 35. Teléfono Celular 14.3 13.5 8.4 12.0 5.1 24.0 16.8 13.6 34.4 8.4 17.6 3.3 26.2 15.7 4.4 6.2 7.1 29.2 12.7 24.7 3.3 Youtube por internet 6.6 6.1 10.0 0.2 2.9 10.8 6.9 9.8 6.4 16.0 1.1 15.1 0.4 0.9 14.4 2.2 3.8 18.8 2.2 3.8 0.4 Sitios de emisoras de radio por internet 3.2 2.7 4.0 0.7 1.8 5.8 8.0 2.7 3.3 1.8 2.2 3.6 0.4 2.2 3.6 2.4 5.1 16.2 2.9 0.7 0.4 Ninguna 78.9 80.3 80.3 88.0 91.3 67.3 72.3 74.9 59.4 77.2 80.7 79.6 73.1 83.2 80.2 91.4 86.9 49.3 84.0 71.8 96.2 Total : Múltiple Base: Total de entrevistados 9814 1240 452 450 450 462 452 450 451 451 450 450 450 452 450 452 450 452 450 450 450 C - 40 LIMA AQP AYAC CAJ CHYO CHIMB CUSC HYO HCO HRAZ ICA IQTS PIUR PCPA PUNO TCNA TRUJ TBES TPTO CHYAS % % % % % % % % % % % % % % % % % % % % % Yo mismo 84.3 87.0 83.0 73.1 76.7 68.2 82.7 63.1 71.4 69.2 86.2 88.9 75.3 87.6 65.8 67.3 56.2 72.8 76.4 91.1 83.8 Mis padres 11.4 9.3 13.1 16.4 20.9 23.8 13.1 26.4 19.5 25.5 10.0 9.3 16.0 9.5 26.7 24.3 31.6 20.6 19.1 5.8 14.0 Mis hermanos 3.5 3.0 3.8 10.0 2.4 4.8 4.2 10.2 7.8 4.9 3.6 1.3 6.0 2.9 5.8 8.2 10.0 6.2 4.4 3.1 1.8 Otros familiares 0.7 0.7 0.2 0.0 0.0 2.6 0.0 0.2 1.3 0.2 0.2 0.4 1.6 0.0 1.3 0.2 2.0 0.4 0.0 0.0 0.2 Total : 100% Base: Entrevistados que ven televisión 9814 1240 452 450 450 462 452 450 451 451 450 450 450 452 450 452 450 452 450 450 450 C - 41 CIUDAD TOTAL TOTAL NACIONAL POR CIUDADES PERSONA QUE ELIGE EL CANAL DE TELEVISIÓN QUE VES
- 36. LIMA AQP AYAC CAJ CHYO CHIMB CUSC HYO HCO HRAZ ICA IQTS PIUR PCPA PUNO TCNA TRUJ TBES TPTO CHYAS % % % % % % % % % % % % % % % % % % % % % Con mis padres 57.3 56.3 74.6 24.7 74.7 60.2 61.9 54.2 69.8 51.9 39.6 86.4 57.3 47.8 41.1 58.6 72.9 56.2 58.0 84.4 83.3 Solo 55.0 54.3 74.1 34.9 69.3 50.9 58.6 31.6 60.1 42.4 60.9 90.0 76.4 58.8 39.3 37.8 70.0 40.0 62.0 82.2 79.8 Con mis hermanos 54.9 54.4 54.4 77.3 57.6 47.8 59.3 60.4 50.6 55.0 48.4 57.1 56.9 54.9 54.9 66.8 53.3 56.9 60.7 73.1 66.2 Con otros familiares 7.4 7.2 4.4 3.6 5.3 14.3 10.6 6.2 4.9 6.4 1.1 5.3 18.9 3.8 8.7 15.7 10.4 8.4 2.0 4.2 3.6 Con amigos 1.7 1.0 7.7 0.7 2.4 6.1 9.7 0.9 0.7 2.2 0.0 2.9 2.2 0.2 5.1 0.9 0.9 7.5 0.0 6.4 1.8 Los que están en casa 0.1 0.1 0.0 0.0 0.0 0.0 0.0 0.0 0.0 0.0 0.0 0.0 0.4 0.0 0.0 0.0 0.0 0.0 0.2 0.0 0.0 Total : Múltiple Base: Entrevistados que ven televisión 9814 1240 452 450 450 462 452 450 451 451 450 450 450 452 450 452 450 452 450 450 450 C - 42 LIMA AQP AYAC CAJ CHYO CHIMB CUSC HYO HCO HRAZ ICA IQTS PIUR PCPA PUNO TCNA TRUJ TBES TPTO CHYAS TOTAL CIUDAD TOTAL NACIONAL POR CIUDADES CIUDAD TOTAL NACIONAL POR CIUDADES PERSONAS CON LAS QUE VE TELEVISIÓN TOTAL TIPO DE PROGRAMA DE TELEVISIÓN QUE TE GUSTA VER SOLO
- 37. % % % % % % % % % % % % % % % % % % % % % VER SOLO Infantiles 52.6 51.4 50.7 68.5 34.6 60.0 52.4 52.3 58.4 59.0 66.2 59.8 67.1 66.9 59.1 42.3 61.2 52.2 65.2 35.3 43.5 Entretenimiento, concursos 45.5 43.9 67.1 25.9 61.7 39.3 42.7 51.4 47.4 64.0 28.2 75.6 40.1 36.1 67.6 45.3 45.2 37.2 45.7 75.4 69.0 Series / miniseries / telenovelas 33.9 33.1 72.9 15.4 41.2 25.7 25.1 28.4 25.5 52.4 13.5 69.6 28.8 16.0 48.8 35.0 32.4 22.2 27.2 34.3 37.2 Películas 27.4 26.3 42.3 6.3 29.3 28.1 25.1 28.4 23.3 28.9 7.5 53.1 38.8 14.1 40.5 30.4 18.4 32.3 18.8 13.1 12.0 Deportes 16.7 16.9 13.1 2.8 14.9 23.3 17.4 10.2 12.3 17.3 1.9 24.6 15.6 6.5 17.7 9.6 12.0 26.1 12.1 12.6 6.9 Noticiero 11.1 9.9 42.9 1.4 5.9 12.0 8.0 10.9 14.8 20.4 0.8 32.8 15.9 2.3 9.2 8.2 5.1 8.9 9.3 2.1 3.3 Farándula 9.8 10.3 12.5 1.4 10.5 9.4 7.4 4.3 3.4 5.7 2.3 21.5 7.9 0.8 7.4 5.1 4.8 16.0 5.8 6.0 4.3 Total : Múltiple Base: Entrevistados que respondieron 7945 839 343 143 410 417 351 440 447 422 266 418 441 263 447 428 376 406 313 382 393 C - 43 LIMA AQP AYAC CAJ CHYO CHIMB CUSC HYO HCO HRAZ ICA IQTS PIUR PCPA PUNO TCNA TRUJ TBES TPTO CHYAS % % % % % % % % % % % % % % % % % % % % % VER EN FAMILIA Entretenimiento, concursos 69.4 72.1 48.4 65.8 52.0 58.7 64.3 60.9 55.7 68.4 68.2 66.4 61.5 71.0 52.5 63.6 72.6 61.1 69.3 53.0 51.1 Series / miniseries / telenovelas 66.1 67.0 54.5 60.9 47.8 72.4 70.6 44.9 58.2 70.3 54.0 78.0 58.7 74.0 46.1 67.6 62.6 75.9 64.3 49.5 39.8 Películas 56.8 59.2 64.7 7.9 40.4 51.2 68.8 52.0 53.0 33.9 11.1 73.9 50.8 29.4 34.8 47.8 41.3 55.7 49.3 63.8 61.5 TOTAL NACIONAL POR CIUDADES TIPO DE PROGRAMA DE TELEVISIÓN QUE TE GUSTA VER EN FAMILIA TOTAL CIUDAD
- 38. Infantiles 37.6 40.6 40.6 38.4 12.5 18.2 34.4 25.8 16.2 32.9 33.9 44.3 16.3 25.7 8.9 37.3 59.6 24.1 40.0 27.1 16.1 Noticiero 36.4 33.7 62.5 7.9 38.2 46.5 53.5 36.7 59.8 31.1 10.3 63.7 67.1 15.6 29.4 44.4 35.7 54.5 30.7 58.9 42.3 Deportes 29.4 31.4 17.8 1.2 21.4 28.5 43.1 15.6 18.7 20.5 1.3 24.5 27.0 9.2 13.2 14.5 22.0 41.8 24.0 32.1 29.2 Farándula 21.0 22.9 8.5 1.4 19.4 19.8 34.8 4.0 3.9 8.8 2.6 24.3 14.1 6.0 5.6 9.6 11.1 30.9 13.8 26.1 17.2 Total : Múltiple Base: Entrevistados que respondieron 9422 1188 411 430 448 424 445 450 438 434 387 449 441 435 425 448 431 440 420 436 442 C - 44 LIMA AQP AYAC CAJ CHYO CHIMB CUSC HYO HCO HRAZ ICA IQTS PIUR PCPA PUNO TCNA TRUJ TBES TPTO CHYAS % % % % % % % % % % % % % % % % % % % % % 1 programa 4.0 4.1 6.4 1.8 2.0 2.8 1.1 6.9 2.2 2.9 5.3 2.7 1.8 3.5 2.9 4.2 6.4 3.5 6.9 2.7 5.3 2 programas 24.1 22.4 52.4 46.2 33.3 19.5 17.0 43.1 27.7 28.8 46.0 25.8 14.9 27.2 34.4 21.9 32.7 17.0 24.0 34.7 30.4 3 programas 47.1 49.4 26.1 50.9 56.7 38.3 34.1 39.8 40.8 39.9 45.1 44.4 31.1 55.1 40.2 50.9 42.7 34.7 34.7 36.7 52.4 4 programas 13.1 12.4 9.3 0.9 6.2 19.5 21.0 6.4 18.2 18.8 3.1 22.4 18.9 9.5 16.7 18.6 12.9 22.1 19.6 22.4 10.2 5 programas 7.1 6.9 4.0 0.2 1.3 12.8 14.4 3.1 8.2 5.8 0.4 3.3 19.1 4.0 4.4 2.4 3.3 13.7 10.0 3.1 1.1 6 programas 2.3 2.3 0.4 0.0 0.0 3.5 5.5 0.2 1.6 2.0 0.0 0.9 10.2 0.2 1.3 1.8 0.9 5.1 1.6 0.2 0.0 7 programas 0.9 0.9 0.4 0.0 0.2 0.9 4.0 0.0 0.9 1.1 0.0 0.4 2.2 0.0 0.0 0.2 0.7 2.2 1.8 0.2 0.4 8 programas 0.8 0.9 0.0 0.0 0.0 1.1 1.1 0.0 0.0 0.4 0.0 0.0 1.1 0.2 0.0 0.0 0.4 1.1 0.4 0.0 0.0 9 programas 0.2 0.2 0.2 0.0 0.0 0.6 0.2 0.0 0.0 0.0 0.0 0.0 0.2 0.0 0.0 0.0 0.0 0.2 0.0 0.0 0.0 10 programas 0.5 0.5 0.7 0.0 0.2 0.9 1.3 0.4 0.4 0.2 0.0 0.0 0.4 0.2 0.0 0.0 0.0 0.2 1.1 0.0 0.0 Cantidad promedio 3.1 3.2 2.6 2.5 2.7 3.5 3.8 2.6 3.1 3.1 2.5 3.0 3.9 2.9 2.9 3.0 2.8 3.6 3.2 2.9 2.7 Total : 100% TOTAL NACIONAL POR CIUDADES CANTIDAD DE PROGRAMAS QUE VEN AL DIA CIUDAD TOTAL
- 39. Base: Entrevistados que respondieron 9814 1240 452 450 450 462 452 450 451 451 450 450 450 452 450 452 450 452 450 450 450 C - 45 LIMA AQP AYAC CAJ CHYO CHIMB CUSC HYO HCO HRAZ ICA IQTS PIUR PCPA PUNO TCNA TRUJ TBES TPTO CHYAS % % % % % % % % % % % % % % % % % % % % % Me relaja / entretiene 71.5 71.7 86.7 84.0 64.7 74.7 67.0 68.9 71.0 80.7 57.8 71.3 68.4 63.3 74.7 67.7 76.4 56.6 75.1 65.6 61.1 No tengo nada que hacer 17.3 16.6 2.2 15.1 19.3 14.9 25.4 24.2 21.1 9.8 40.4 6.9 25.6 34.7 9.3 13.9 9.3 32.3 24.7 22.4 33.3 Me sirve de compañía 11.1 11.6 10.6 0.9 16.0 10.4 7.1 6.9 7.8 9.5 1.8 21.8 6.0 2.0 16.0 18.4 14.2 11.1 0.2 11.8 5.1 Lo orienta / educa 0.1 0.1 0.4 0.0 0.0 0.0 0.4 0.0 0.2 0.0 0.0 0.0 0.0 0.0 0.0 0.0 0.0 0.0 0.0 0.2 0.4 Total : 100% Base: Entrevistados que ven televisión 9814 1240 452 450 450 462 452 450 451 451 450 450 450 452 450 452 450 452 450 450 450 C - 46 TOTAL NACIONAL POR CIUDADES TOTAL NACIONAL POR CIUDADES CIUDAD RAZON POR LA QUE SE ELIGE VER TELEVISION TOTAL
- 40. LIMA AQP AYAC CAJ CHYO CHIMB CUSC HYO HCO HRAZ ICA IQTS PIUR PCPA PUNO TCNA TRUJ TBES TPTO CHYAS % % % % % % % % % % % % % % % % % % % % % Nunca 19.6 19.4 15.3 76.9 3.3 13.9 12.2 16.0 12.9 20.8 64.0 5.1 13.6 50.0 20.2 36.5 12.2 9.1 36.9 3.8 3.1 A veces 60.2 61.1 50.4 22.2 80.9 63.4 54.2 67.1 67.8 62.1 34.0 63.1 38.2 48.2 58.4 53.8 50.4 67.3 53.1 79.1 85.1 Varias veces 14.8 14.7 26.3 0.9 13.6 15.4 28.8 9.3 12.4 10.4 1.8 25.8 17.8 1.3 16.2 4.9 30.0 17.0 7.1 10.7 7.8 Siempre 5.3 4.8 8.0 0.0 2.2 7.4 4.9 7.6 6.9 6.7 0.2 6.0 30.4 0.4 5.1 4.9 7.3 6.6 2.9 6.4 4.0 Total : 100% Base: Entrevistados que ven televisión 9814 1240 452 450 450 462 452 450 451 451 450 450 450 452 450 452 450 452 450 450 450 C - 47 LIMA AQP AYAC CAJ CHYO CHIMB CUSC HYO HCO HRAZ ICA IQTS PIUR PCPA PUNO TCNA TRUJ TBES TPTO CHYAS % % % % % % % % % % % % % % % % % % % % % Amigos 51.0 50.6 47.0 54.8 37.7 58.8 73.0 39.2 49.4 63.6 60.5 46.1 55.8 45.1 58.2 38.0 49.4 59.4 46.1 50.8 42.7 TOTAL FRECUENCIA CON LA QUE SE COMENTA / CONVERSA LO QUE SE VE EN TELEVISIÓN CIUDAD PERSONA CON LA QUE SE COMENTA LO QUE SE VE EN TELEVISIÓN TOTAL NACIONAL POR CIUDADES CIUDAD TOTAL
- 41. Padres 40.8 39.8 58.7 21.2 56.3 46.0 31.2 40.5 58.5 34.2 26.5 56.9 41.1 28.3 35.9 43.6 45.8 32.4 34.2 44.3 59.2 Hermanos 36.5 36.3 41.3 22.1 59.8 27.9 32.2 46.8 34.9 43.4 6.2 22.5 26.7 29.2 28.1 55.7 35.4 37.5 31.7 71.8 68.3 Otros familiares 7.4 7.8 1.8 7.7 3.0 12.6 6.8 7.9 5.1 2.2 8.6 1.9 12.9 4.9 3.6 6.3 5.1 6.3 6.0 1.6 1.8 Novio / enamorado 0.4 0.4 0.3 0.0 0.0 0.5 0.0 0.3 0.0 0.0 0.0 1.2 1.8 0.0 0.0 0.0 0.0 0.0 0.0 0.2 0.0 Profesores 0.1 0.1 0.0 0.0 0.0 0.0 0.0 0.0 0.5 0.0 0.0 0.0 1.3 0.0 0.0 0.0 0.0 0.0 0.0 0.0 0.0 Total : Múltiple Base: Entrevistados que comentan / conversan lo que ven en TV 7653 999 383 104 435 398 397 378 393 357 162 427 389 226 359 287 395 411 284 433 436 C - 48 LIMA AQP AYAC CAJ CHYO CHIMB CUSC HYO HCO HRAZ ICA IQTS PIUR PCPA PUNO TCNA TRUJ TBES TPTO CHYAS % % % % % % % % % % % % % % % % % % % % % Cambio de canal / emisora 57.8 60.0 48.2 94.4 26.4 47.2 51.8 57.6 51.0 31.3 89.3 40.2 43.6 75.9 42.7 49.1 28.9 50.0 69.1 28.7 32.0 Lo veo / escucho 24.4 23.9 34.7 2.2 32.2 31.0 26.1 15.6 32.2 37.5 2.2 31.1 35.1 8.4 18.7 26.8 47.3 21.0 11.1 48.7 32.2 No cambio de canal / emisora, pero no le tomo importancia 9.6 8.6 9.1 3.3 28.4 8.7 6.2 20.0 4.9 18.2 8.0 18.4 11.3 14.8 23.1 12.4 9.8 11.5 16.7 8.4 20.4 Hago otras cosas 7.3 6.9 7.3 0.0 12.0 10.6 15.0 6.4 9.8 11.5 0.2 8.2 5.6 0.9 14.0 10.4 9.6 12.8 2.4 14.0 15.1 Lo apago 0.9 0.6 0.7 0.0 0.9 2.6 0.9 0.4 2.2 1.6 0.2 2.0 4.4 0.0 1.6 1.3 4.4 4.6 0.7 0.2 0.2 No ve TV 0.1 0.1 0.0 0.0 0.0 0.0 0.0 0.0 0.0 0.0 0.0 0.0 0.0 0.0 0.0 0.0 0.0 0.0 0.0 0.0 0.0 ACCION QUE REALIZA CUANDO APARECEN LOS COMERCIALES EN LA TELEVISIÓN O EN LA RADIO TOTAL CIUDAD TOTAL NACIONAL POR CIUDADES
- 42. Total : 100% Base: Total de entrevistados 9814 1240 452 450 450 462 452 450 451 451 450 450 450 452 450 452 450 452 450 450 450 C - 49 LIMA AQP AYAC CAJ CHYO CHIMB CUSC HYO HCO HRAZ ICA IQTS PIUR PCPA PUNO TCNA TRUJ TBES TPTO CHYAS % % % % % % % % % % % % % % % % % % % % % Sí, lo compré 17.4 16.2 17.3 6.9 6.0 26.0 30.5 11.1 44.1 20.6 30.9 19.8 16.9 28.8 13.8 10.2 6.4 29.9 18.7 4.7 2.9 Lo compraré en algún momento 15.5 16.0 18.4 9.3 16.4 12.1 14.2 10.9 4.2 8.2 17.3 18.2 6.2 17.3 6.0 6.9 18.0 16.8 26.2 21.8 27.6 Si, lo desee 20.6 19.0 28.8 4.0 46.4 27.1 35.2 15.8 13.1 37.5 6.7 24.7 23.6 8.2 33.6 28.1 48.0 29.0 10.2 43.3 44.4 No, no me interesó 46.6 48.8 35.6 79.8 31.1 34.8 20.1 62.2 38.6 33.7 45.1 37.3 53.3 45.8 46.7 54.9 27.6 24.3 44.9 30.2 25.1 Total : 100% Base: Entrevistados que respondieron 9814 1240 452 450 450 462 452 450 451 451 450 450 450 452 450 452 450 452 450 450 450 C - 50 TOTAL NACIONAL POR CIUDADES CIUDAD COMPRA O DESEA COMPRAR ALGO AL VER LOS COMERCIALES EN LA TELEVISIÓN / RADIO TOTAL NACIONAL POR CIUDADES TOTAL
- 43. LIMA AQP AYAC CAJ CHYO CHIMB CUSC HYO HCO HRAZ ICA IQTS PIUR PCPA PUNO TCNA TRUJ TBES TPTO CHYAS % % % % % % % % % % % % % % % % % % % % % Si han puesto reglas o condiciones 71.6 70.1 85.8 81.6 76.2 66.5 69.9 77.3 75.2 78.9 88.9 82.4 67.8 80.5 75.8 82.1 85.6 74.3 65.8 68.4 71.8 No han puesto reglas o condiciones 28.4 29.9 14.2 18.4 23.8 33.5 30.1 22.7 24.8 21.1 11.1 17.6 32.2 19.5 24.2 17.9 14.4 25.7 34.2 31.6 28.2 Total : 100% Base: Entrevistados que ven televisión 9814 1240 452 450 450 462 452 450 451 451 450 450 450 452 450 452 450 452 450 450 450 C - 51 LIMA AQP AYAC CAJ CHYO CHIMB CUSC HYO HCO HRAZ ICA IQTS PIUR PCPA PUNO TCNA TRUJ TBES TPTO CHYAS % % % % % % % % % % % % % % % % % % % % % Ver TV luego de terminar las tareas 80.3 82.2 84.3 82.6 82.2 71.7 79.1 64.1 68.7 50.0 88.5 86.0 73.1 89.3 52.5 68.2 91.4 59.2 87.5 77.6 78.9 TOTAL NACIONAL POR CIUDADES PRESENCIA DE REGLAS O CONDICIONES PARA VER TELEVISIÓN EN CASA TIPOS DE REGLAS O CONTROLES PARA VER TELEVISIÓN EN CASA TOTAL CIUDAD TOTAL CIUDAD
- 44. Ver TV hasta cierta hora 24.0 25.2 29.1 6.8 37.9 14.7 7.9 19.5 24.8 34.3 3.5 35.0 14.4 7.1 24.0 45.0 19.5 14.0 8.4 28.6 39.3 Ver TV cierta cantidad de horas 19.6 18.6 22.4 12.5 15.2 28.0 17.1 26.4 22.7 48.0 13.8 13.2 12.5 16.5 35.8 42.0 19.7 24.4 15.2 13.3 12.4 Ver solo ciertos programas 15.8 17.7 16.8 1.6 6.1 14.7 6.0 5.2 10.0 10.4 3.0 9.2 4.3 3.3 11.4 13.2 14.3 16.1 4.4 6.2 10.5 Ver solo ciertos canales 2.7 2.6 2.6 0.3 0.0 4.6 1.3 1.4 3.2 9.0 0.0 2.4 1.3 0.5 8.2 4.0 5.2 5.4 1.0 0.0 1.5 Tener buenas notas / buen rendimiento 0.1 0.0 0.0 0.0 0.0 0.3 0.0 0.6 0.0 0.0 0.3 0.3 0.0 0.3 0.6 0.0 1.0 0.3 0.0 0.0 0.0 Total Múltiple Base: Entrevistados que tiene reglas o condiciones para ver TV 7433 869 388 367 343 307 316 348 339 356 400 371 305 364 341 371 385 336 296 308 323 C - 52 LIMA AQP AYAC CAJ CHYO CHIMB CUSC HYO HCO HRAZ ICA IQTS PIUR PCPA PUNO TCNA TRUJ TBES TPTO CHYAS % % % % % % % % % % % % % % % % % % % % % 11:00:00 a. m. 0.1 0.1 0.0 0.0 0.2 0.0 0.0 0.0 0.0 0.0 0.0 0.0 0.0 0.0 0.0 0.0 0.0 0.0 0.0 0.0 0.0 04:00:00 p. m. 0.2 0.2 0.0 0.0 0.2 0.0 0.2 1.6 0.2 0.2 0.0 0.4 0.0 0.0 0.0 0.2 0.0 0.2 0.4 0.4 0.9 05:00:00 p. m. 0.3 0.2 0.2 0.4 0.2 0.4 0.4 0.9 0.0 0.0 0.2 0.0 0.2 0.2 0.4 0.7 0.2 0.0 0.7 0.2 0.7 06:00:00 p. m. 0.8 0.7 1.1 0.2 0.7 1.5 0.0 3.8 1.8 0.4 1.3 0.9 2.7 0.7 0.9 1.1 1.3 0.2 0.7 0.7 1.1 06:30:00 p. m. 0.1 0.1 0.4 0.0 0.0 0.2 0.0 0.0 0.0 0.2 0.2 0.0 0.0 0.0 0.0 0.2 0.4 0.0 0.0 0.0 0.0 07:00:00 p. m. 2.5 2.4 2.7 3.3 6.0 0.9 0.4 6.9 2.4 1.8 7.6 1.3 3.1 2.2 4.7 4.2 10.0 0.0 1.3 2.0 5.6 07:30:00 p. m. 0.1 0.1 0.0 0.4 0.4 0.0 0.0 0.2 0.4 0.2 0.7 0.7 0.0 0.2 0.0 1.1 3.3 0.0 0.0 0.0 0.4 08:00:00 p. m. 13.8 12.7 18.6 30.4 28.9 10.0 6.2 23.6 17.5 13.1 28.4 6.7 32.4 18.4 19.3 21.0 24.7 5.5 16.9 21.6 24.9 08:30:00 p. m. 1.2 1.0 2.4 1.6 3.1 1.5 1.3 0.7 4.4 4.0 2.7 1.8 0.2 1.1 2.2 0.4 4.9 1.1 3.1 1.3 5.3 CIUDAD TOTAL NACIONAL POR CIUDADES TOTAL HORA LIMITE PERMITIDA PARA VER TELEVISIÓN
- 45. 09:00:00 p. m. 32.4 33.1 29.4 34.9 29.8 21.9 25.2 25.8 34.6 39.9 27.8 32.4 37.1 31.6 36.4 34.5 27.8 26.1 34.7 29.1 34.9 09:30:00 p. m. 1.3 1.1 5.1 0.7 0.0 2.4 0.2 0.7 1.8 2.2 0.0 1.3 0.2 1.8 1.6 1.3 2.4 1.1 0.4 0.4 0.9 10:00:00 p. m. 30.3 29.8 29.9 26.0 26.9 41.1 35.2 27.1 30.2 31.7 26.0 38.2 16.2 35.4 27.1 25.7 16.0 44.2 31.1 34.4 18.7 10:30:00 p. m. 0.8 0.7 3.8 0.0 0.2 0.4 0.2 0.0 0.9 0.4 0.7 1.8 0.4 0.4 0.0 0.0 0.7 0.7 0.0 0.4 0.2 11:00:00 p. m. 9.4 10.2 4.2 1.8 1.8 8.0 15.7 4.4 4.2 4.4 4.2 8.7 3.8 6.2 4.2 5.5 4.9 13.5 7.1 7.6 2.7 11:30:00 p. m. 0.3 0.3 0.2 0.0 0.0 0.4 0.0 0.0 0.0 0.2 0.0 0.0 0.0 0.0 0.2 0.0 0.0 0.2 0.2 0.0 0.0 12:00:00 a. m. 4.5 5.0 1.1 0.0 0.7 5.6 10.2 1.3 1.1 0.9 0.0 4.0 3.1 1.8 1.8 2.9 2.2 4.6 2.2 1.6 2.9 01:00:00 a. m. 1.3 1.5 0.4 0.0 0.4 2.2 3.5 0.2 0.0 0.2 0.2 1.3 0.2 0.0 1.1 0.7 0.7 2.2 0.4 0.0 0.2 02:00:00 a. m. 0.4 0.5 0.2 0.0 0.0 2.2 0.4 0.0 0.0 0.0 0.0 0.0 0.0 0.0 0.0 0.0 0.2 0.0 0.0 0.0 0.2 03:00:00 a. m. 0.2 0.2 0.0 0.0 0.0 0.9 0.2 0.0 0.0 0.0 0.0 0.0 0.0 0.0 0.0 0.0 0.0 0.0 0.0 0.0 0.0 Total : 100% Base: Entrevistados que ven televisión 9814 1240 452 450 450 462 452 450 451 451 450 450 450 452 450 452 450 452 450 450 450 C - 53 LIMA AQP AYAC CAJ CHYO CHIMB CUSC HYO HCO HRAZ ICA IQTS PIUR PCPA PUNO TCNA TRUJ TBES TPTO CHYAS % % % % % % % % % % % % % % % % % % % % % Sí, siempre 45.4 44.6 62.6 58.0 53.8 39.8 33.6 58.4 39.9 45.0 41.1 56.9 71.3 42.0 47.6 66.2 53.8 25.7 40.4 49.1 53.3 A veces 36.2 36.3 31.9 27.6 34.4 34.4 52.7 27.6 39.7 37.9 28.7 34.4 14.0 32.7 39.3 26.8 38.7 56.6 25.3 41.8 38.0 No, nunca 18.4 19.1 5.5 14.4 11.8 25.8 13.7 14.0 20.4 17.1 30.2 8.7 14.7 25.2 13.1 7.1 7.6 17.7 34.2 9.1 8.7 Total : 100% LOS PADRES O EL ADULTO A CARGO INDICAN LOS PROGRAMAS DE TELEVISIÓN QUE SE PUEDEN VER O QUE NO SE PUEDEN VER CIUDAD TOTAL TOTAL NACIONAL POR CIUDADES
- 46. Base: Total de entrevistados 9814 1240 452 450 450 462 452 450 451 451 450 450 450 452 450 452 450 452 450 450 450 C - 54 LIMA AQP AYAC CAJ CHYO CHIMB CUSC HYO HCO HRAZ ICA IQTS PIUR PCPA PUNO TCNA TRUJ TBES TPTO CHYAS % % % % % % % % % % % % % % % % % % % % % Sí, siempre 44.5 44.4 63.5 26.0 52.7 34.6 18.6 59.8 42.6 41.0 27.3 57.3 73.3 39.8 46.0 65.7 60.7 23.9 39.1 33.8 46.0 A veces 41.3 42.2 34.3 53.6 35.8 34.4 62.6 32.4 38.1 45.2 36.2 33.3 14.4 35.0 43.1 27.2 34.7 53.1 30.2 57.1 45.8 No, nunca 14.2 13.5 2.2 20.4 11.6 31.0 18.8 7.8 19.3 13.7 36.4 9.3 12.2 25.2 10.9 7.1 4.7 23.0 30.7 9.1 8.2 Total : 100% Base: Total de entrevistados 9814 1240 452 450 450 462 452 450 451 451 450 450 450 452 450 452 450 452 450 450 450 C - 55 CIUDAD TOTAL NACIONAL POR CIUDADES TOTAL TOTAL NACIONAL POR CIUDADES TUS PADRES O EL ADULTO A CARGO ESTAN ATENTOS PARA QUE NO VEAS ALGUNOS PROGRAMAS DE TELEVISIÓN
- 47. LIMA AQP AYAC CAJ CHYO CHIMB CUSC HYO HCO HRAZ ICA IQTS PIUR PCPA PUNO TCNA TRUJ TBES TPTO CHYAS % % % % % % % % % % % % % % % % % % % % % Sí, siempre 58.8 58.5 75.2 79.8 61.1 48.3 53.5 71.3 62.5 55.4 61.6 65.8 73.1 54.4 47.3 69.5 68.2 34.1 49.1 73.6 80.2 A veces 31.3 31.6 23.2 16.2 31.3 28.6 35.4 22.0 22.8 34.8 24.9 25.6 16.0 35.2 43.6 26.1 28.4 52.2 41.8 22.9 17.1 No, nunca 9.9 9.8 1.5 4.0 7.6 23.2 11.1 6.7 14.6 9.8 13.6 8.7 10.9 10.4 9.1 4.4 3.3 13.7 9.1 3.6 2.7 Total : 100% Base: Total de entrevistados 9814 1240 452 450 450 462 452 450 451 451 450 450 450 452 450 452 450 452 450 450 450 C - 56 LIMA AQP AYAC CAJ CHYO CHIMB CUSC HYO HCO HRAZ ICA IQTS PIUR PCPA PUNO TCNA TRUJ TBES TPTO CHYAS % % % % % % % % % % % % % % % % % % % % % Me dicen cuántas horas puedo ver 78.7 78.3 85.4 92.2 85.3 70.6 69.7 88.2 76.5 91.4 76.0 84.2 86.0 69.2 85.1 84.5 88.7 72.8 72.9 82.9 91.8 TOTAL TU DEJAS DE VER LOS PROGRAMAS DE TELEVISIÓN QUE TE DICEN QUE NO PUEDES VER CIUDAD CIUDAD TOTAL NACIONAL POR CIUDADES TUS PADRES O EL ADULTO A CARGO TE DICEN CUÁNTAS HORAS DEBES VER TELEVISIÓN DURANTE EL DÍA O PUEDES VER TODAS LAS HORAS QUE QUIERAS TOTAL
- 48. Puedo ver todas las horas que quiero 21.3 21.7 14.6 7.8 14.7 29.4 30.3 11.8 23.5 8.6 24.0 15.8 14.0 30.8 14.9 15.5 11.3 27.2 27.1 17.1 8.2 Total : 100% Base: Total de entrevistados 9814 1240 452 450 450 462 452 450 451 451 450 450 450 452 450 452 450 452 450 450 450 C - 57 LIMA AQP AYAC CAJ CHYO CHIMB CUSC HYO HCO HRAZ ICA IQTS PIUR PCPA PUNO TCNA TRUJ TBES TPTO CHYAS % % % % % % % % % % % % % % % % % % % % % Ve la cantidad de horas permitida 79.3 79.7 73.8 94.2 83.1 77.6 71.1 86.6 64.3 78.4 93.3 75.5 82.7 83.4 78.9 88.0 60.4 70.8 79.3 89.3 92.3 Ve más tiempo del permitido 20.7 20.3 26.2 5.8 16.9 22.4 28.9 13.4 35.7 21.6 6.7 24.5 17.3 16.6 21.1 12.0 39.6 29.2 20.7 10.7 7.7 Total : 100% Base: Entrevistados que ven una cantidad de horas permitida 7979 971 386 415 384 326 315 397 345 412 342 379 387 313 383 382 399 329 328 373 413 C - 58 TOTAL NACIONAL POR CIUDADES TU VES LA CANTIDAD DE HORAS QUE TE PERMITEN O VES MÁS TIEMPO TOTAL CIUDAD
- 49. LIMA AQP AYAC CAJ CHYO CHIMB CUSC HYO HCO HRAZ ICA IQTS PIUR PCPA PUNO TCNA TRUJ TBES TPTO CHYAS % % % % % % % % % % % % % % % % % % % % % Sí, siempre 31.1 29.9 41.4 36.4 11.8 41.6 53.3 48.7 25.9 24.6 29.6 32.4 42.0 19.9 23.3 51.8 11.6 45.1 35.8 16.2 13.8 A veces 43.2 45.2 51.1 44.9 38.7 39.8 30.1 23.3 22.6 14.0 46.0 56.4 12.2 44.5 17.3 27.2 65.1 42.0 31.6 40.4 35.6 No, nunca 25.7 24.9 7.5 18.7 49.6 18.6 16.6 28.0 51.4 61.4 24.4 11.1 45.8 35.6 59.3 21.0 23.3 12.8 32.7 43.3 50.7 Total : 100% Base: Total de entrevistados 9814 1240 452 450 450 462 452 450 451 451 450 450 450 452 450 452 450 452 450 450 450 C - 59 LIMA AQP AYAC CAJ CHYO CHIMB CUSC HYO HCO HRAZ ICA IQTS PIUR PCPA PUNO TCNA TRUJ TBES TPTO CHYAS TOTAL CIUDAD TOTAL NACIONAL POR CIUDADES TUS PADRES O EL ADULTO A CARGO TE DICEN QUE PUEDES VER TELEVISIÓN HASTA LAS 10 DE LA NOCHE SOLAMENTE TOTAL CIUDAD TOTAL NACIONAL POR CIUDADES TU VES TELEVISIÓN DESPUÉS DE LAS 10 DE LA NOCHE
- 50. % % % % % % % % % % % % % % % % % % % % % Sí, siempre 11.1 11.4 5.3 1.1 4.4 10.6 10.3 33.3 10.0 16.1 0.0 15.8 6.1 4.1 23.0 21.6 4.1 9.6 11.6 6.3 6.3 A veces 43.2 43.4 51.7 8.5 67.8 47.6 44.6 22.2 37.0 40.8 7.4 66.3 11.1 20.3 36.6 27.5 63.5 59.1 23.8 55.3 52.3 No, nunca 45.8 45.2 43.1 90.4 27.8 41.8 45.1 44.4 53.0 43.1 92.6 18.0 82.8 75.6 40.4 51.0 32.5 31.2 64.7 38.4 41.4 Total : 100% Base: Entrevistados que tienen permitido ver televisión hasta las 10 de la noche 6746 931 418 366 227 376 377 324 219 174 340 400 244 291 183 357 345 394 303 255 222 C - 60 LIMA AQP AYAC CAJ CHYO CHIMB CUSC HYO HCO HRAZ ICA IQTS PIUR PCPA PUNO TCNA TRUJ TBES TPTO CHYAS % % % % % % % % % % % % % % % % % % % % % Saben todo lo que veo 52.6 53.7 53.3 76.4 56.4 46.8 29.0 68.9 51.9 45.5 47.3 64.0 63.6 40.9 57.6 72.3 44.9 21.9 35.3 49.3 53.8 Saben casi todo lo que veo 28.9 28.7 19.9 17.3 22.9 29.7 51.1 12.2 29.3 33.5 42.9 19.6 12.2 43.6 21.8 15.9 31.8 47.3 42.2 26.4 22.7 Saben poco de lo que veo 17.0 16.6 25.7 6.2 20.0 14.3 14.2 16.9 16.4 16.2 9.6 15.8 19.1 15.3 17.3 10.6 22.2 25.4 21.8 24.2 22.9 No saben nada de lo que veo 1.5 1.0 1.1 0.0 0.7 9.3 5.8 2.0 2.4 4.9 0.2 0.7 5.1 0.2 3.3 1.1 1.1 5.3 0.7 0.0 0.7 TOTAL NACIONAL POR CIUDADES CUÁNTO SABEN TUS PADRES O EL ADULTO A CARGO DE LO QUE VES EN TELEVISIÓN TOTAL CIUDAD
- 51. Total : 100% Base: Total de entrevistados 9814 1240 452 450 450 462 452 450 451 451 450 450 450 452 450 452 450 452 450 450 450 C - 61 LIMA AQP AYAC CAJ CHYO CHIMB CUSC HYO HCO HRAZ ICA IQTS PIUR PCPA PUNO TCNA TRUJ TBES TPTO CHYAS % % % % % % % % % % % % % % % % % % % % % No lo veo 72.3 74.7 73.2 79.1 60.9 54.8 54.0 85.3 77.8 78.3 74.9 62.7 79.8 56.6 71.6 81.9 76.4 33.0 44.0 75.1 80.9 Lo veo en el televisor sin que se den cuenta 22.1 20.2 26.5 17.6 28.4 37.7 39.8 8.2 11.5 16.4 22.0 35.8 12.7 38.5 22.0 14.4 19.1 46.2 48.7 18.0 15.1 Lo veo en algún portal de internet 5.0 4.8 0.9 3.1 10.0 4.5 6.4 4.9 8.2 4.7 3.1 1.6 4.9 4.6 5.3 2.4 5.6 15.9 6.7 6.9 4.0 Lo veo en mi celular 0.8 0.6 0.2 0.4 0.4 2.4 0.7 1.1 2.4 0.9 0.0 0.2 1.3 0.9 0.4 1.3 0.0 4.9 0.7 0.0 0.0 Lo veo en otra casa 0.2 0.2 0.0 0.0 0.4 1.3 0.0 0.4 0.2 0.0 0.0 0.2 1.3 0.0 0.7 0.0 0.2 0.0 0.0 0.0 0.0 Total : Múltiple Base: Total de entrevistados 9814 1240 452 450 450 462 452 450 451 451 450 450 450 452 450 452 450 452 450 450 450 C - 62 CIUDAD TOTAL NACIONAL POR CIUDADES QUÉ HACES CUANDO QUIERES VER ALGÚN PROGRAMA DE TELEVISIÓN QUE NO ESTÁ PERMITIDO QUE LO VEAS TOTAL
- 52. LIMA AQP AYAC CAJ CHYO CHIMB CUSC HYO HCO HRAZ ICA IQTS PIUR PCPA PUNO TCNA TRUJ TBES TPTO CHYAS % % % % % % % % % % % % % % % % % % % % % Música 97.8 98.2 99.0 100.0 98.0 98.5 99.3 94.9 94.7 95.4 99.7 98.8 92.1 99.6 89.5 99.2 97.2 92.6 99.6 98.3 96.1 Programas donde conversan y hacen chistes 20.0 21.1 2.5 24.3 6.5 19.5 24.4 4.6 8.5 22.8 45.2 7.6 10.2 50.7 27.8 5.3 18.5 23.3 26.3 7.9 4.2 Deportes 8.1 8.6 3.8 0.0 5.4 8.2 7.0 3.3 6.5 1.2 5.1 10.7 10.0 5.7 2.9 3.4 7.7 13.8 6.0 2.5 4.7 Noticiero 6.7 5.5 16.7 14.0 4.5 5.8 6.3 5.6 10.4 3.7 27.2 8.0 22.3 2.1 4.2 10.0 22.2 5.8 10.2 10.4 21.4 Programas concurso 5.4 6.0 1.0 0.3 1.1 10.0 3.7 1.0 2.7 3.4 0.7 6.1 4.5 1.1 12.1 0.5 2.5 5.8 1.1 0.6 1.8 Entrevistas 3.9 4.3 0.8 0.0 0.3 5.8 5.9 0.0 2.4 3.4 0.0 1.5 4.5 0.7 3.3 0.8 0.9 7.1 1.1 0.8 0.3 Relatos de cuento 2.7 2.8 0.5 0.0 0.3 2.7 2.2 1.5 2.2 4.6 0.0 0.3 5.8 1.1 3.9 1.1 2.2 7.4 1.8 0.6 0.3 Total : Múltiple Base: Entrevistados que respondieron 7202 836 396 292 353 329 270 391 413 324 294 327 381 282 306 380 324 326 285 356 337 C - 63 TOTAL NACIONAL POR CIUDADES TOTAL NACIONAL POR CIUDADES TOTAL TIPO DE PROGRAMAS PREFERIDOS PARA ESCUCHAR EN LA RADIO CIUDAD FRECUENCIA CON LA QUE ACOSTUMBRA COMENTAR / CONVERSAR LO QUE ESCUCHA EN RADIO
- 53. LIMA AQP AYAC CAJ CHYO CHIMB CUSC HYO HCO HRAZ ICA IQTS PIUR PCPA PUNO TCNA TRUJ TBES TPTO CHYAS % % % % % % % % % % % % % % % % % % % % % Nunca 38.9 38.3 47.5 93.5 26.9 45.9 38.4 29.3 28.6 34.9 92.9 27.9 21.3 71.2 39.5 53.5 41.0 25.2 57.5 22.4 18.4 A veces 53.7 55.0 42.2 6.5 68.3 47.7 50.2 60.2 63.8 57.4 7.1 52.9 51.3 27.8 51.6 43.3 51.2 61.0 37.9 71.7 80.1 Varias veces 5.1 4.5 10.1 0.0 3.1 3.9 10.0 4.1 4.4 4.6 0.0 17.6 13.2 1.1 7.2 2.4 6.8 9.2 4.2 3.1 1.5 Siempre 2.4 2.1 0.3 0.0 1.7 2.4 1.5 6.4 3.2 3.1 0.0 1.5 14.2 0.0 1.6 0.8 0.9 4.6 0.4 2.8 0.0 Total : 100% Base: Entrevistados que respondieron 7203 838 396 292 353 331 271 392 412 324 294 323 380 281 306 381 324 326 285 357 337 C - 64 LIMA AQP AYAC CAJ CHYO CHIMB CUSC HYO HCO HRAZ ICA IQTS PIUR PCPA PUNO TCNA TRUJ TBES TPTO CHYAS % % % % % % % % % % % % % % % % % % % % % Los concursos 29.5 30.1 27.9 28.7 44.7 22.7 19.2 11.8 40.1 32.6 14.0 40.0 27.6 27.0 32.0 31.2 30.0 18.1 34.4 39.6 42.2 Los dibujos animados 21.8 20.6 26.1 33.8 16.2 19.9 19.7 27.6 28.8 24.4 40.4 18.9 52.9 31.6 14.9 25.0 30.4 14.2 20.0 19.6 28.0 Las miniseries 17.0 17.5 23.2 4.2 15.3 23.6 7.3 10.4 15.1 15.3 4.4 26.7 30.4 8.6 4.4 14.8 7.8 10.4 10.9 16.2 11.3 Programas de entretenimiento 12.2 11.4 1.5 8.7 18.2 20.6 9.5 29.6 8.6 12.4 18.7 9.6 38.0 8.4 23.3 16.6 3.3 15.9 3.3 26.4 20.9 Las competencias 12.2 12.9 0.2 0.7 2.7 21.6 22.1 0.9 4.7 17.3 2.0 2.4 17.1 4.6 20.2 10.2 3.6 17.7 10.7 0.9 0.7 Las novelas 8.1 6.8 11.9 11.1 19.3 12.3 9.7 10.4 14.6 11.1 7.8 12.9 18.9 9.1 6.2 15.0 9.1 10.2 10.0 23.8 21.6 Noticieros 5.1 4.6 14.2 4.4 3.3 6.3 3.1 4.9 5.1 4.0 2.9 2.0 20.4 1.3 1.3 8.6 2.7 5.5 3.8 16.9 15.1 TOTAL TOTAL NACIONAL POR CIUDADES CIUDAD CIUDAD QUÉ ES LO QUE MÁS PREFIERES DE LO QUE VES EN LOS PROGRAMAS DE LA TELEVISIÓN NACIONAL TOTAL