Download to read offline

![Massachusetts Innovation Ecosystem
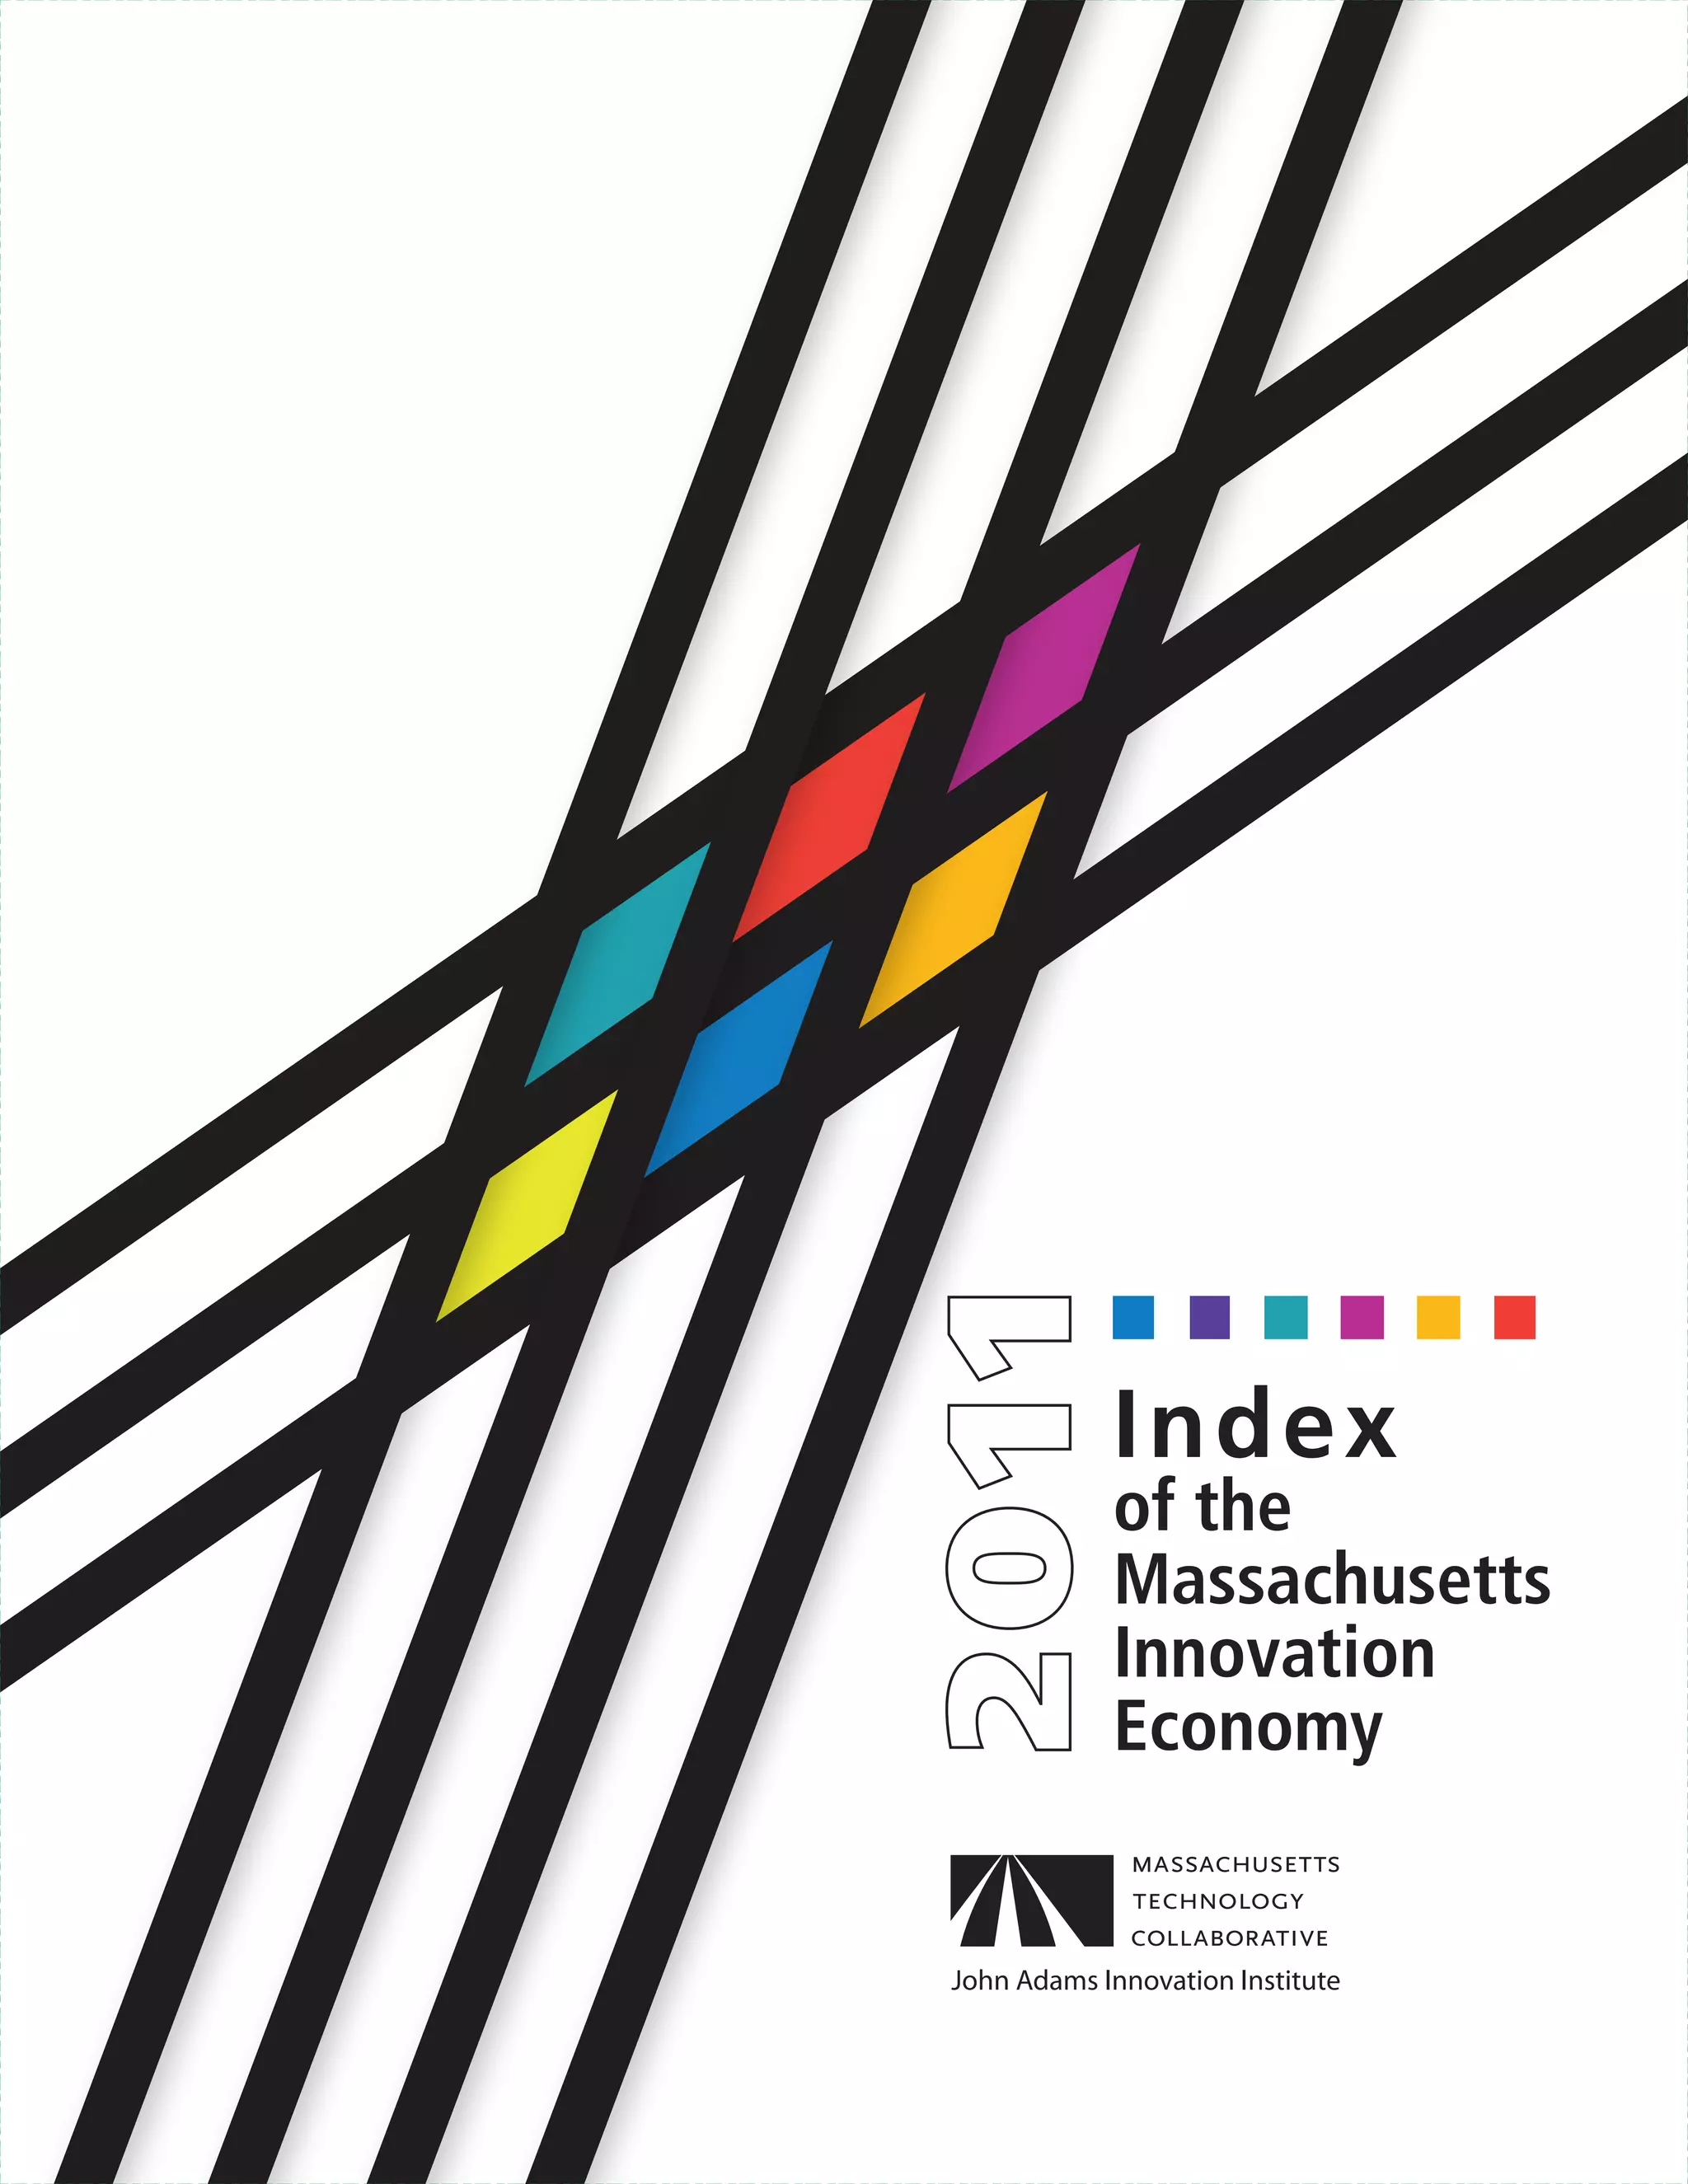
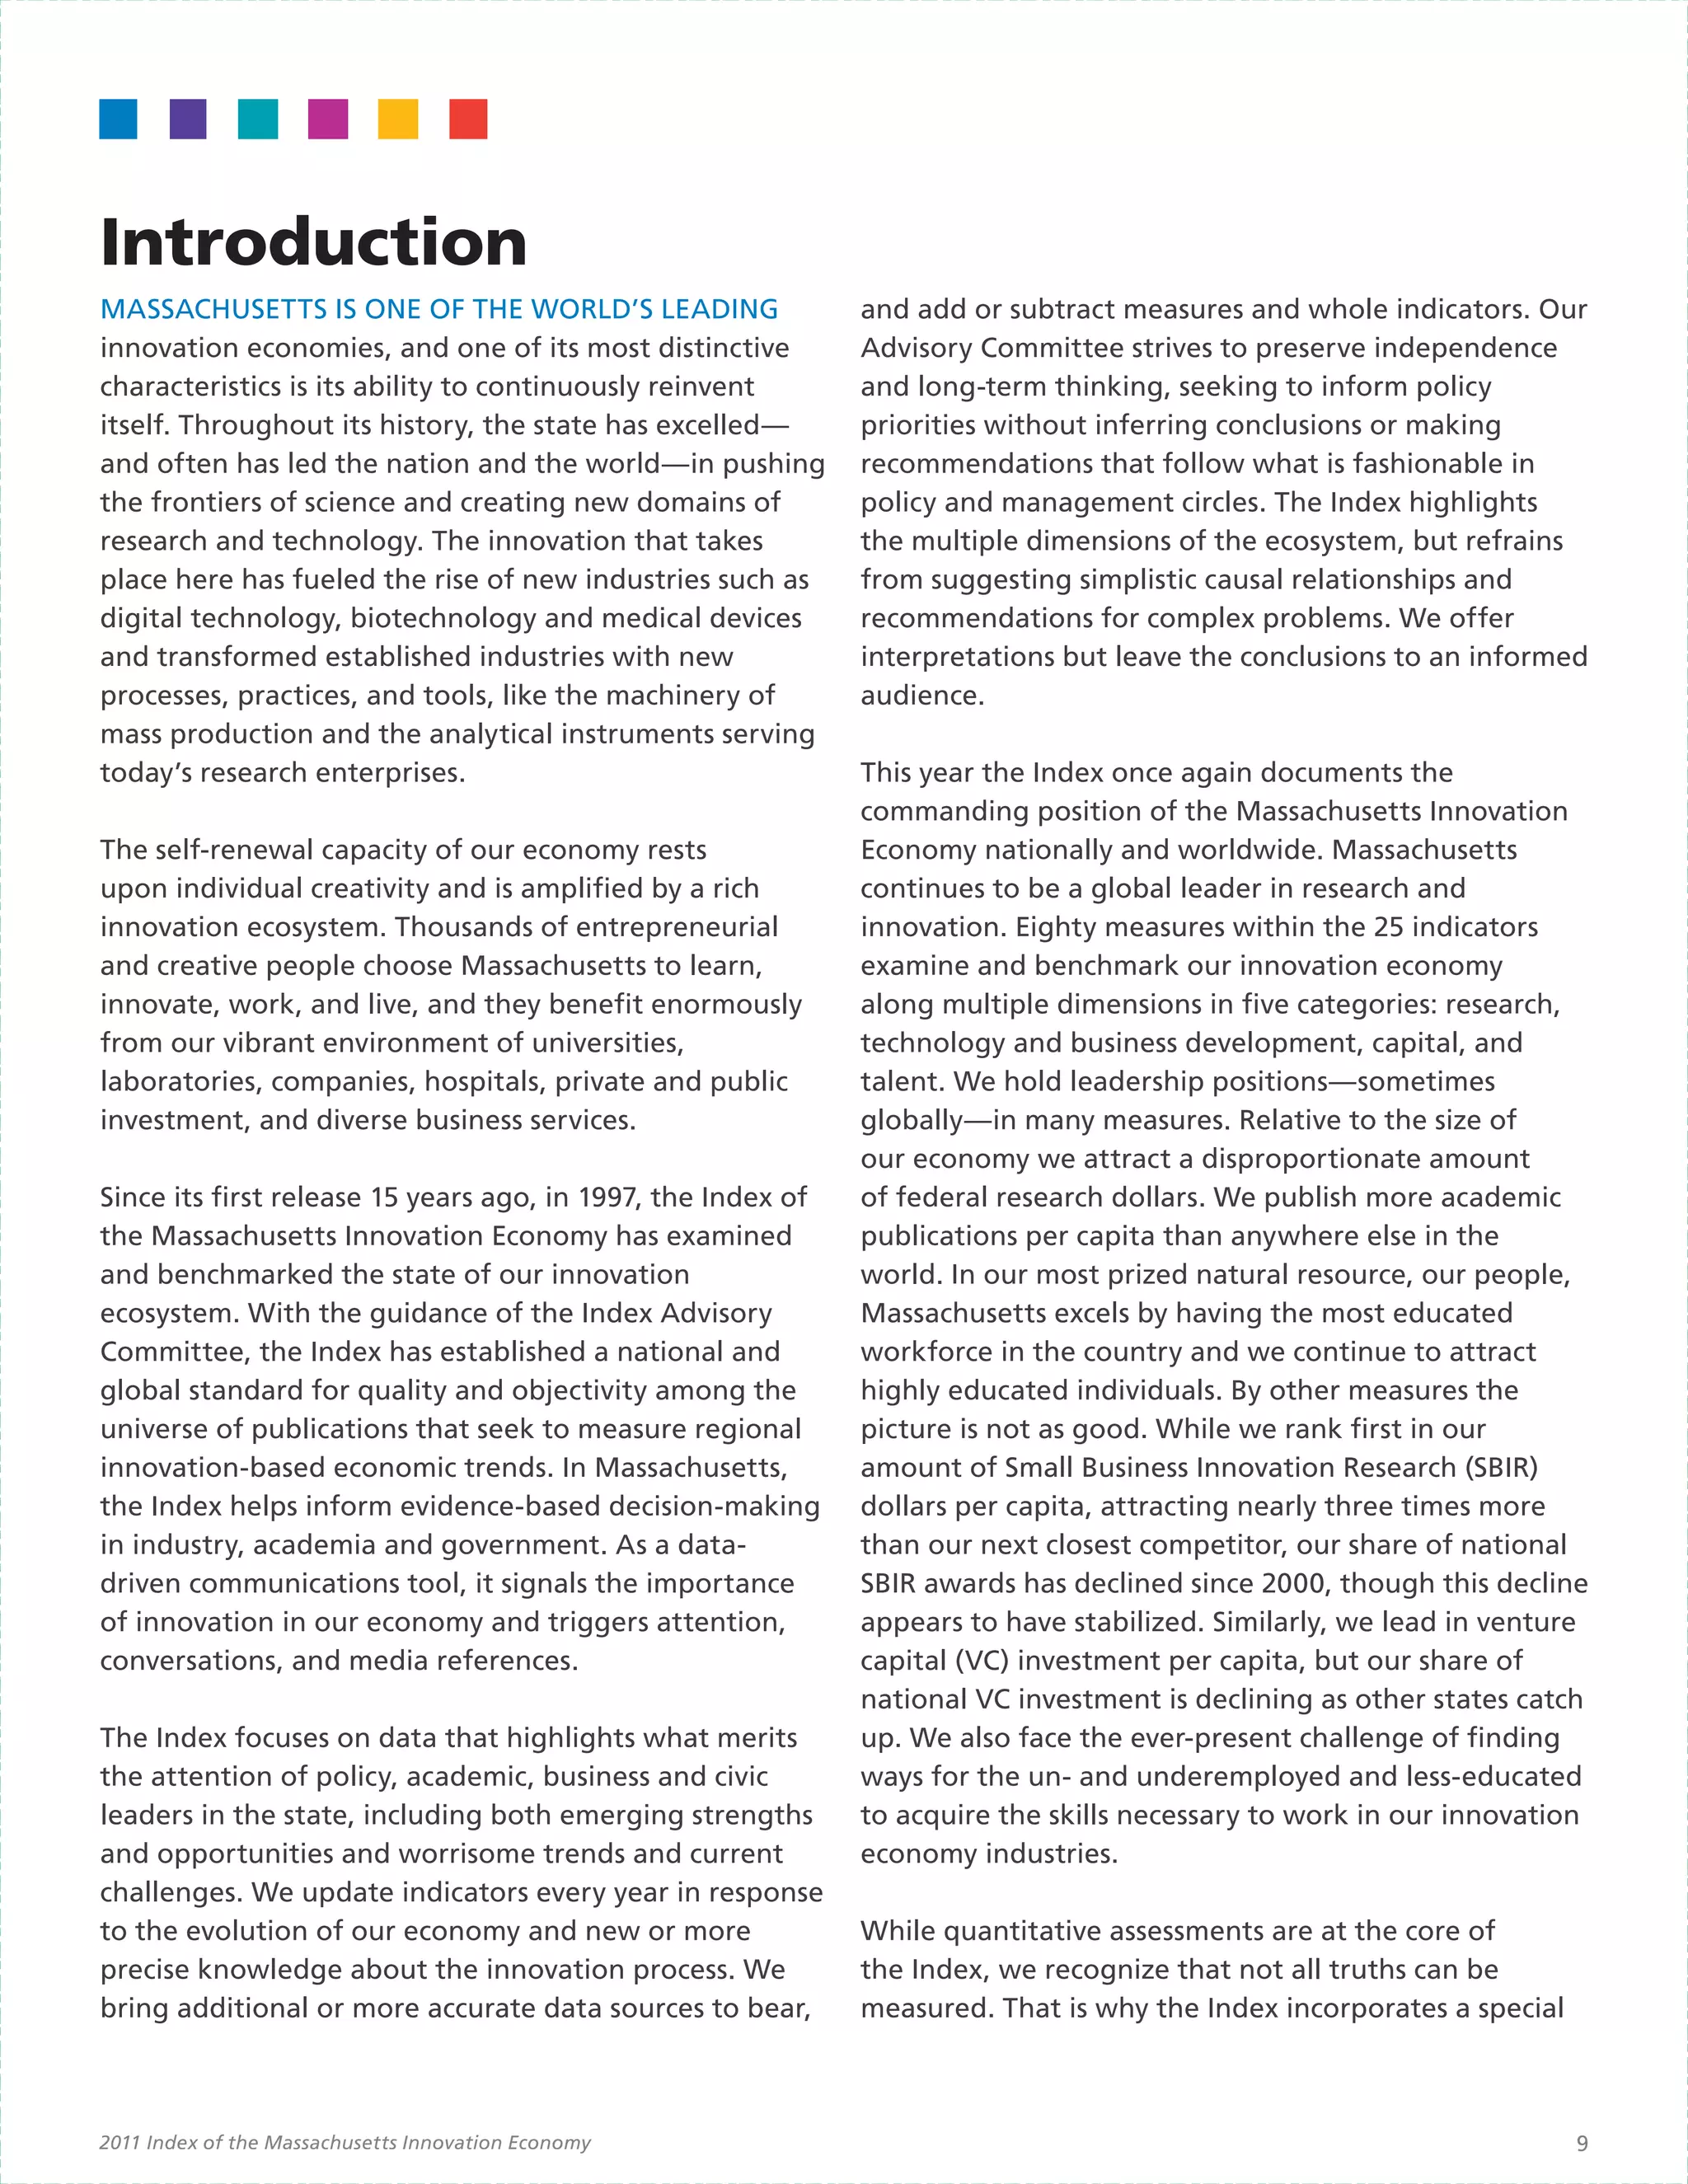
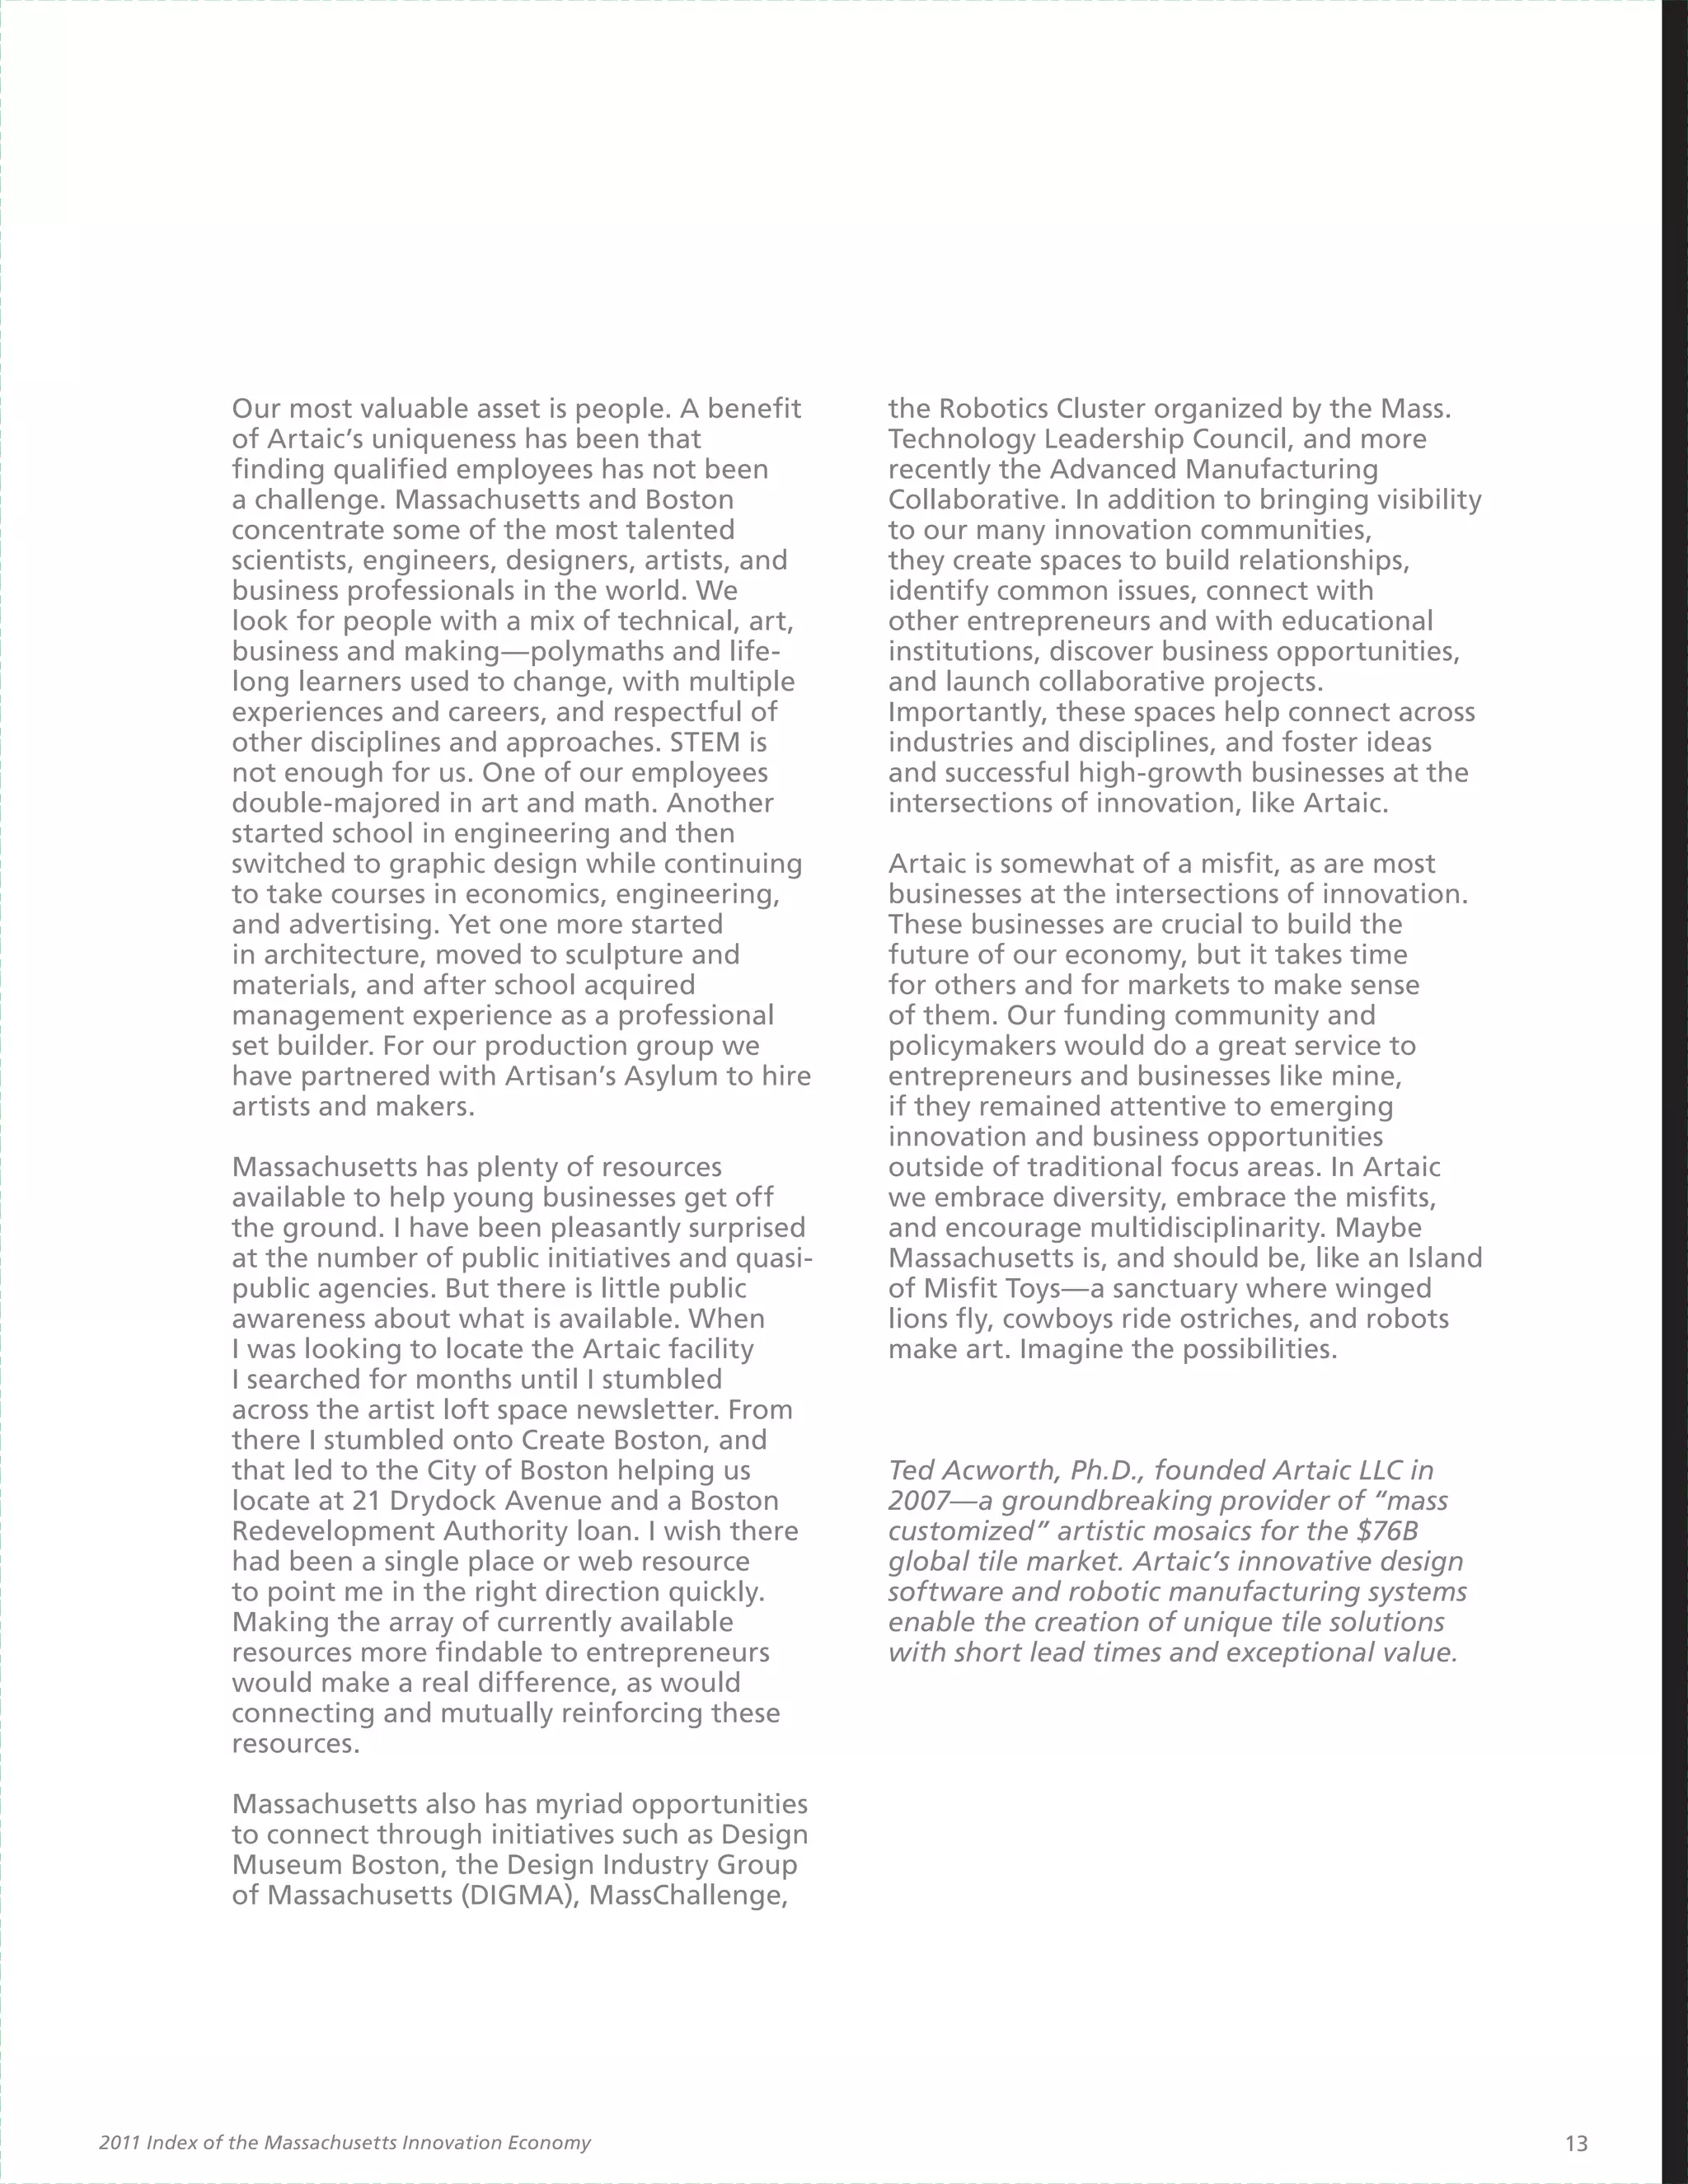
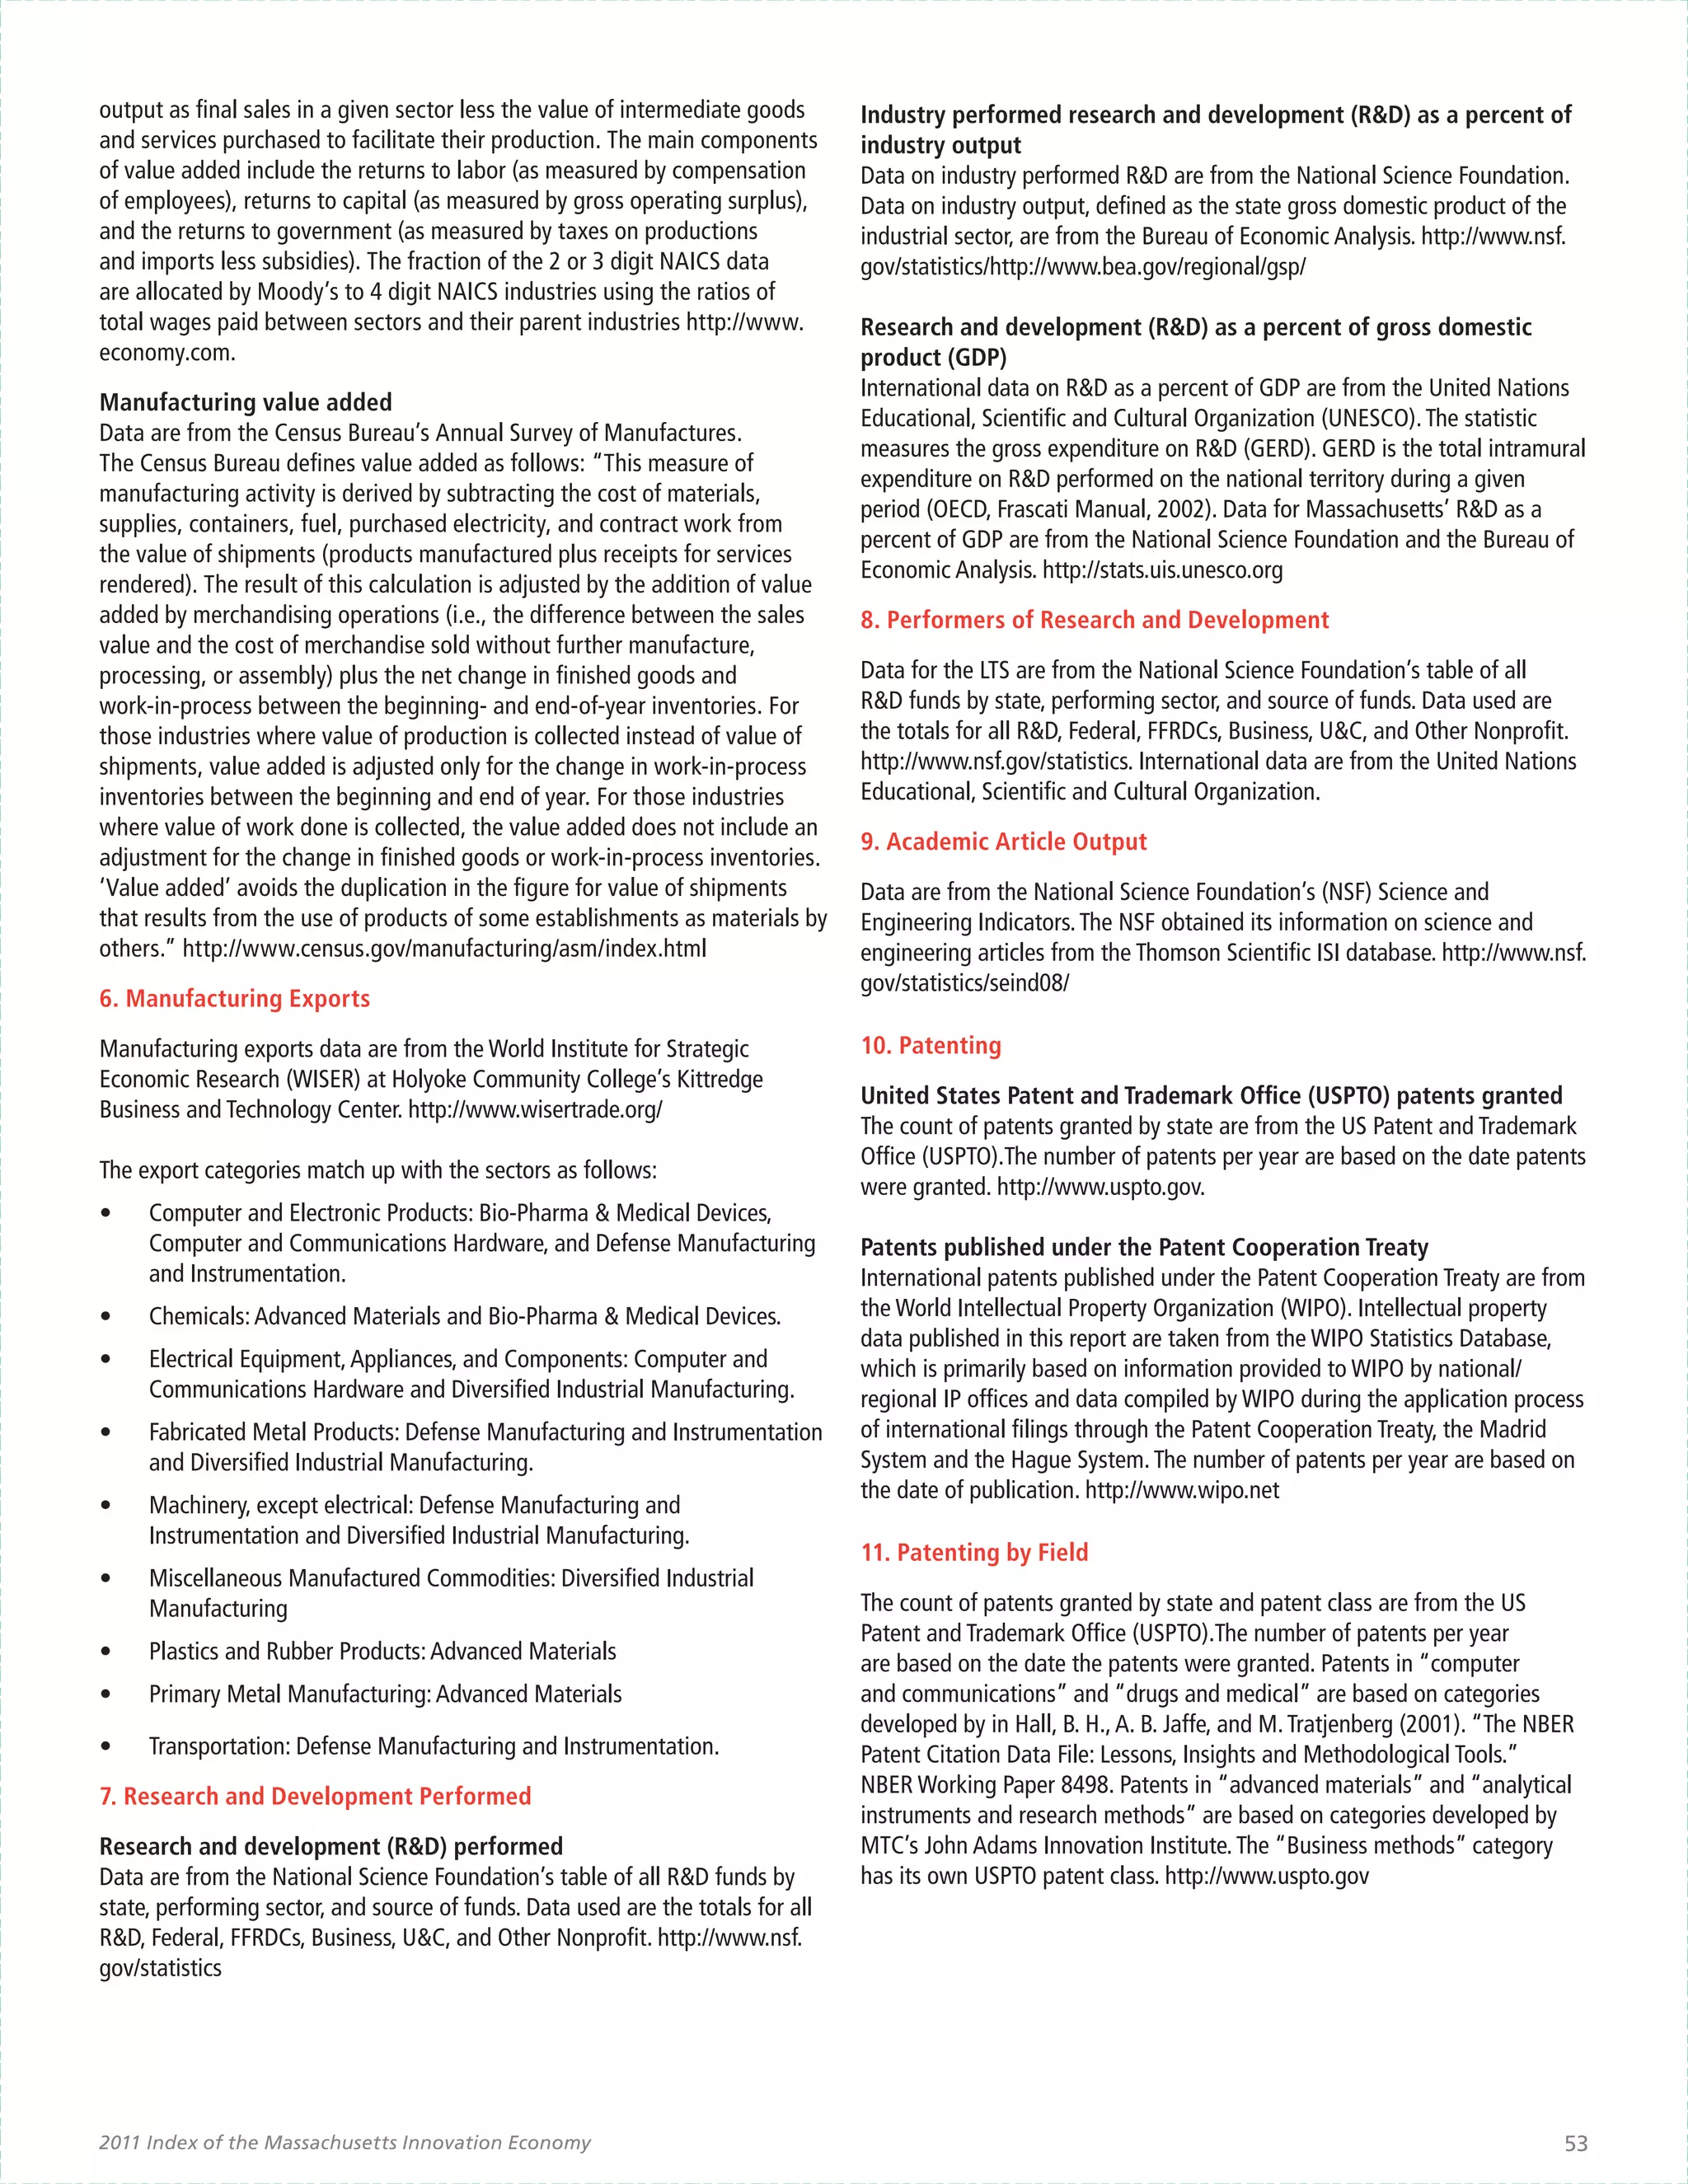
Taken together, the 25 indicators in the Index examine Research
the performance of the Commonwealth’s innovation
ecosystem through several lenses. To help organize and The massive and diversified research enterprise
navigate these indicators, the Index classifies them in concentrated in Massachusetts’ universities, teaching
three categories: economic impact, innovation activities, hospitals, and government and industry laboratories
and innovation capacity. The sequencing and logic of [Indicators #7 and #8] is a major source of the new
indicators suggest how performance in one arena may ideas that fuel the innovation process. Research activity
affect performance in others, as well as overall results. occurs within a spectrum that ranges from curiosity-
driven fundamental science, whose application often
Economic Impact becomes evident once the research has started, to
application-inspired research which starts with better
A key goal of the Index is to convey how innovation defined problems or commercial goals in mind.
impacts the state’s economy. One way innovation Academic publications [Indicator #9] and patenting
contributes to economic prosperity in Massachusetts activity [Indicators #10 and #11] reflect both the
is through employment and wages in the key industry intensity of new knowledge creation and the capacity
clusters [Indicator #1]. Jobs created in the innovation of the Massachusetts economy to make these ideas
economy are often high paying [Indicator #2], which available for dissemination and commercialization.
directly and indirectly sustains a high standard of
living throughout the Commonwealth [Indicator #3]. Technology Development
This capacity hinges on the ability of individual firms
to utilize innovative technologies and processes that In close interaction with research activities, but with
improve productivity [Indicator #4] and support the a clearer application as a goal, product development
creation and commercialization of innovative products begins with research outcomes and translates them
and services. Industry output is a measure of economic into models, prototypes, tests, and artifacts that
activity [Indicator #5]. An export-orientation is help evaluate and refine the plausibility, feasibility,
becoming an increasingly important driver of business performance, and market potential of a research
and overall economic growth [Indicator #6]. Success outcome. One way in which universities, hospitals, and
in the national and global marketplaces brings in the other research institutions make new ideas available for
revenue that enables businesses to survive, prosper, and product development by businesses and entrepreneurs
create and sustain high-paying jobs. is through technology licensing [Indicator #12].
Small Business Innovation Research (SBIR) grants
Innovation Activities enable small companies to test, evaluate, and refine
new technologies and products [Indicator #13]. In
In the Index, innovation is defined as the capacity the medical device and biopharma industries, both
to continuously translate ideas into novel products, significant contributors to the Massachusetts Innovation
processes and services that create, improve, or expand Economy, regulatory approval of new products is an
business opportunities. The Index assesses innovation important milestone in the product development
by examining three categories of activities that underlie process [Indicator #14].
this complex and interactive process. Business Development
22 John Adams INNOVATION Institute](https://image.slidesharecdn.com/2011innovationindex-121025160440-phpapp02/75/MassTech-s-2011-Annual-Index-of-the-Innovation-Economy-23-2048.jpg)
![Massachusetts Innovation Ecosystem
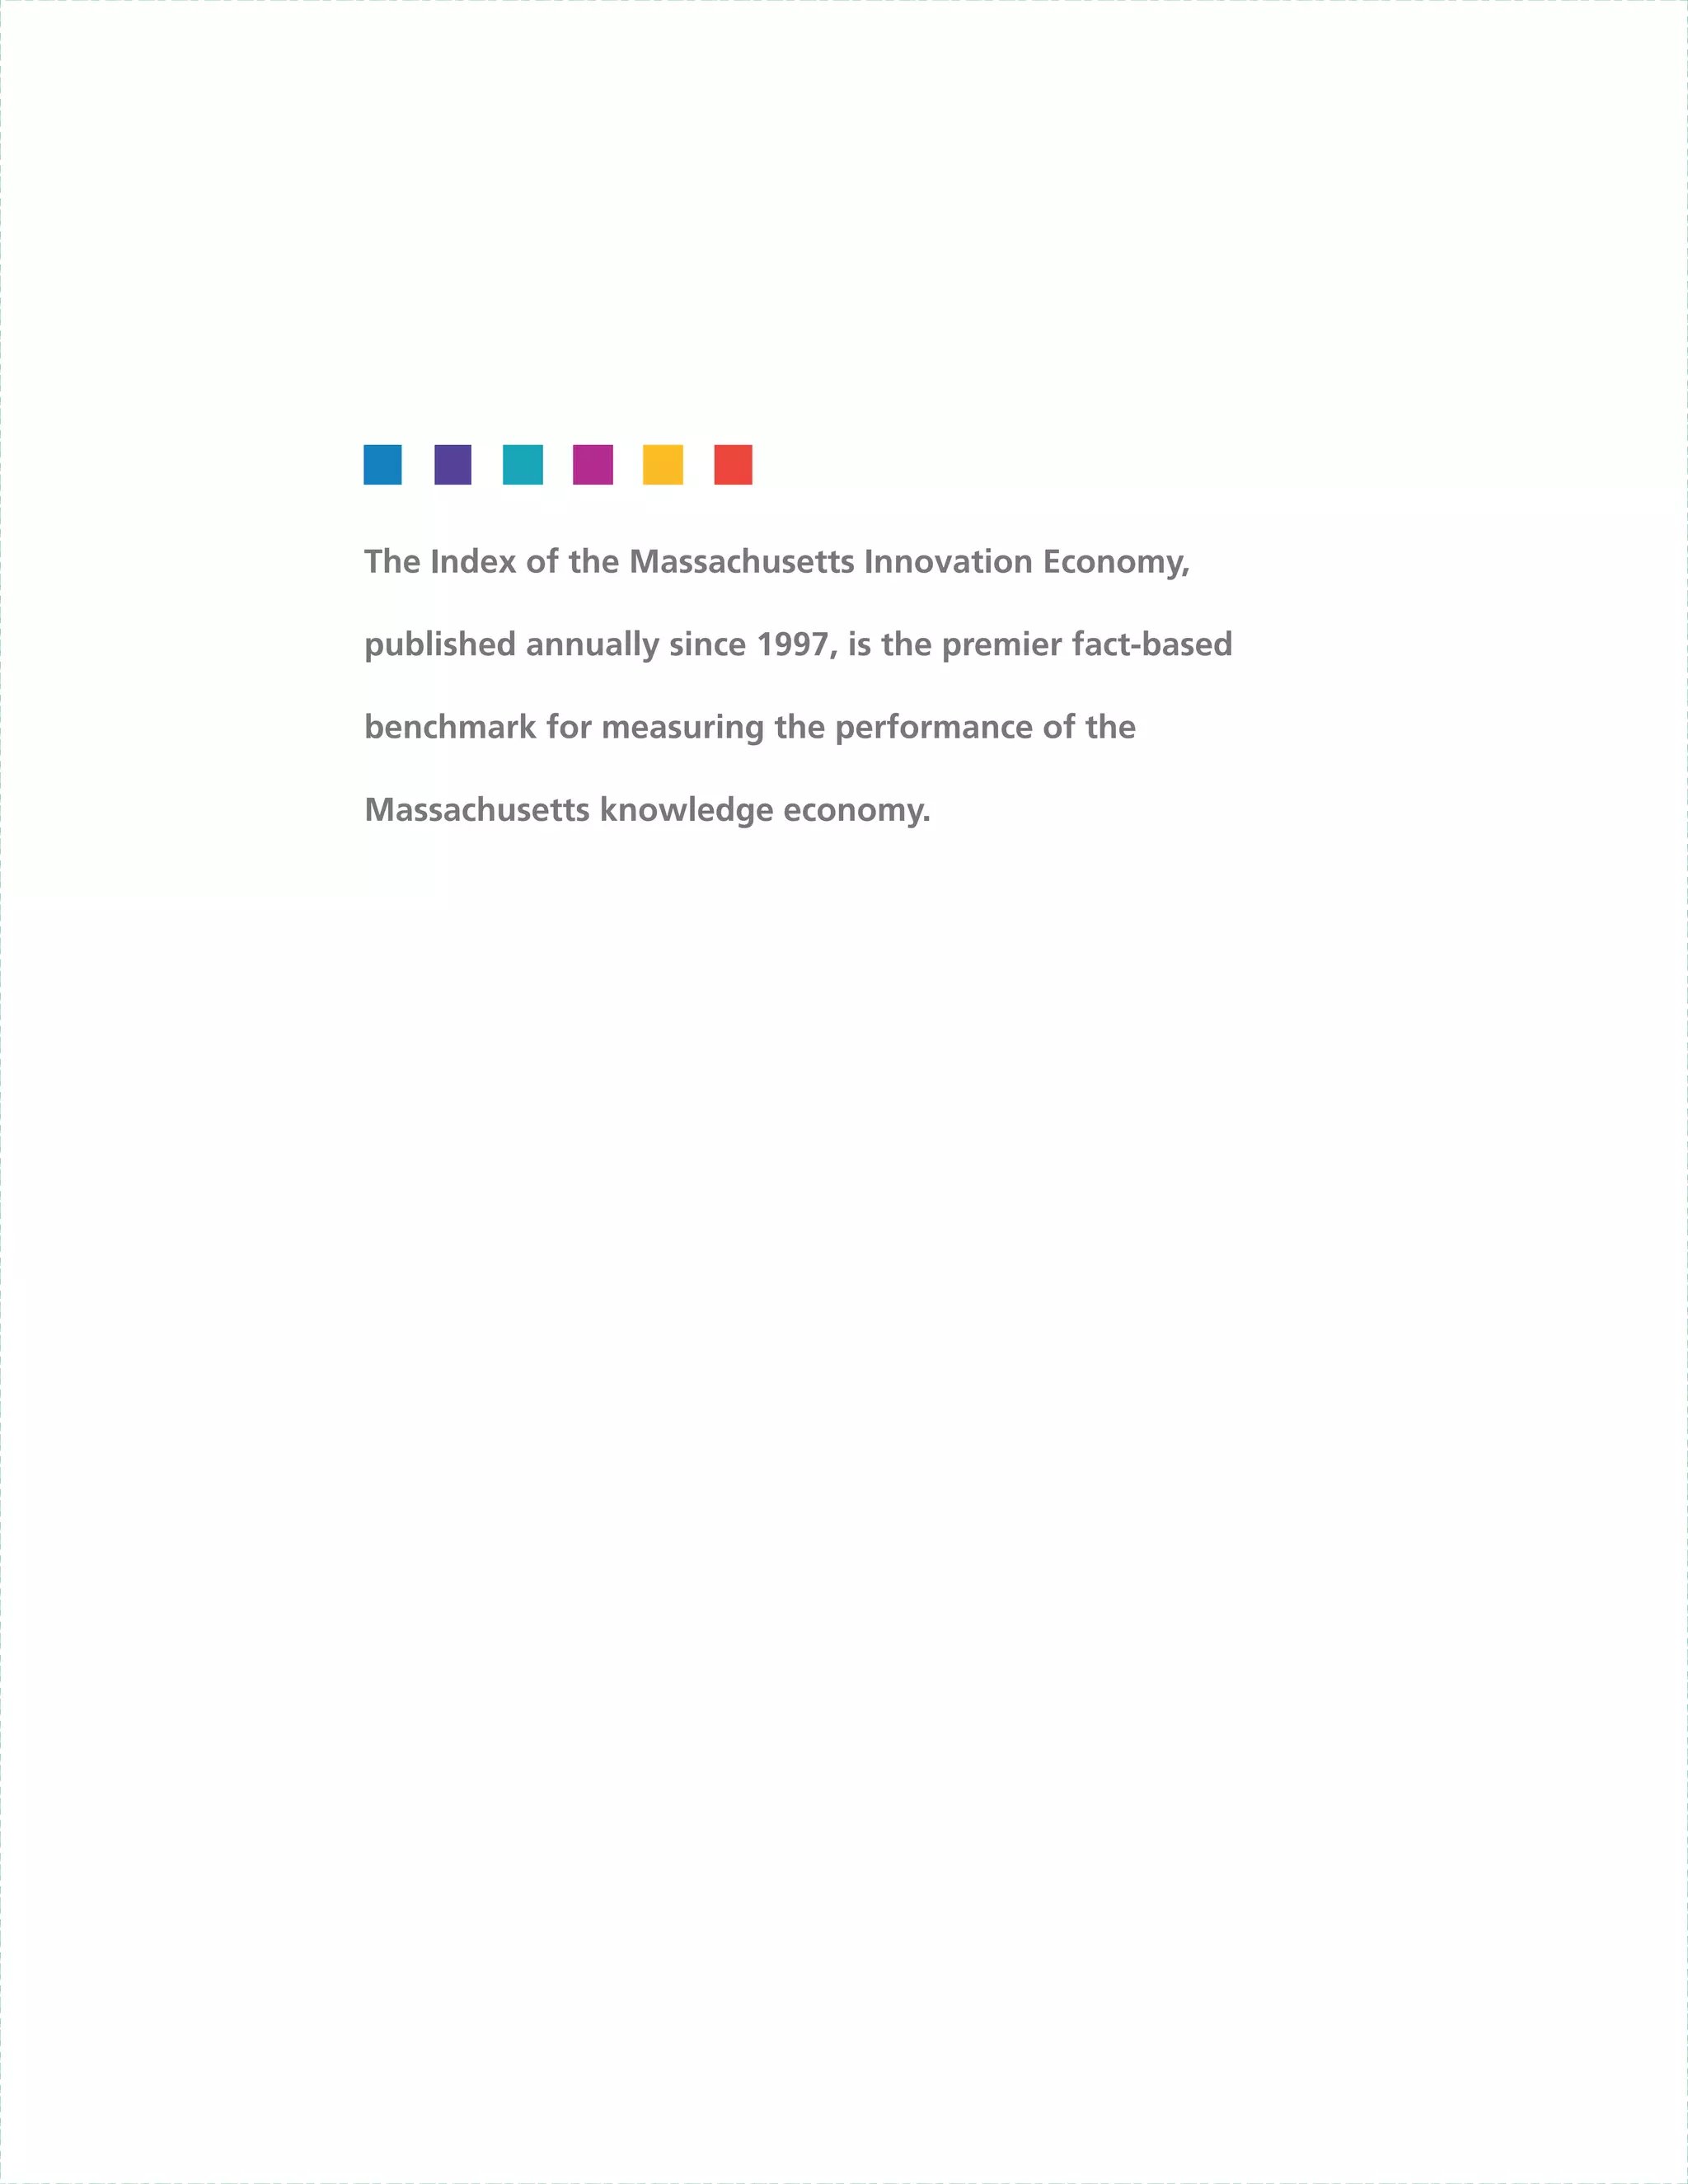
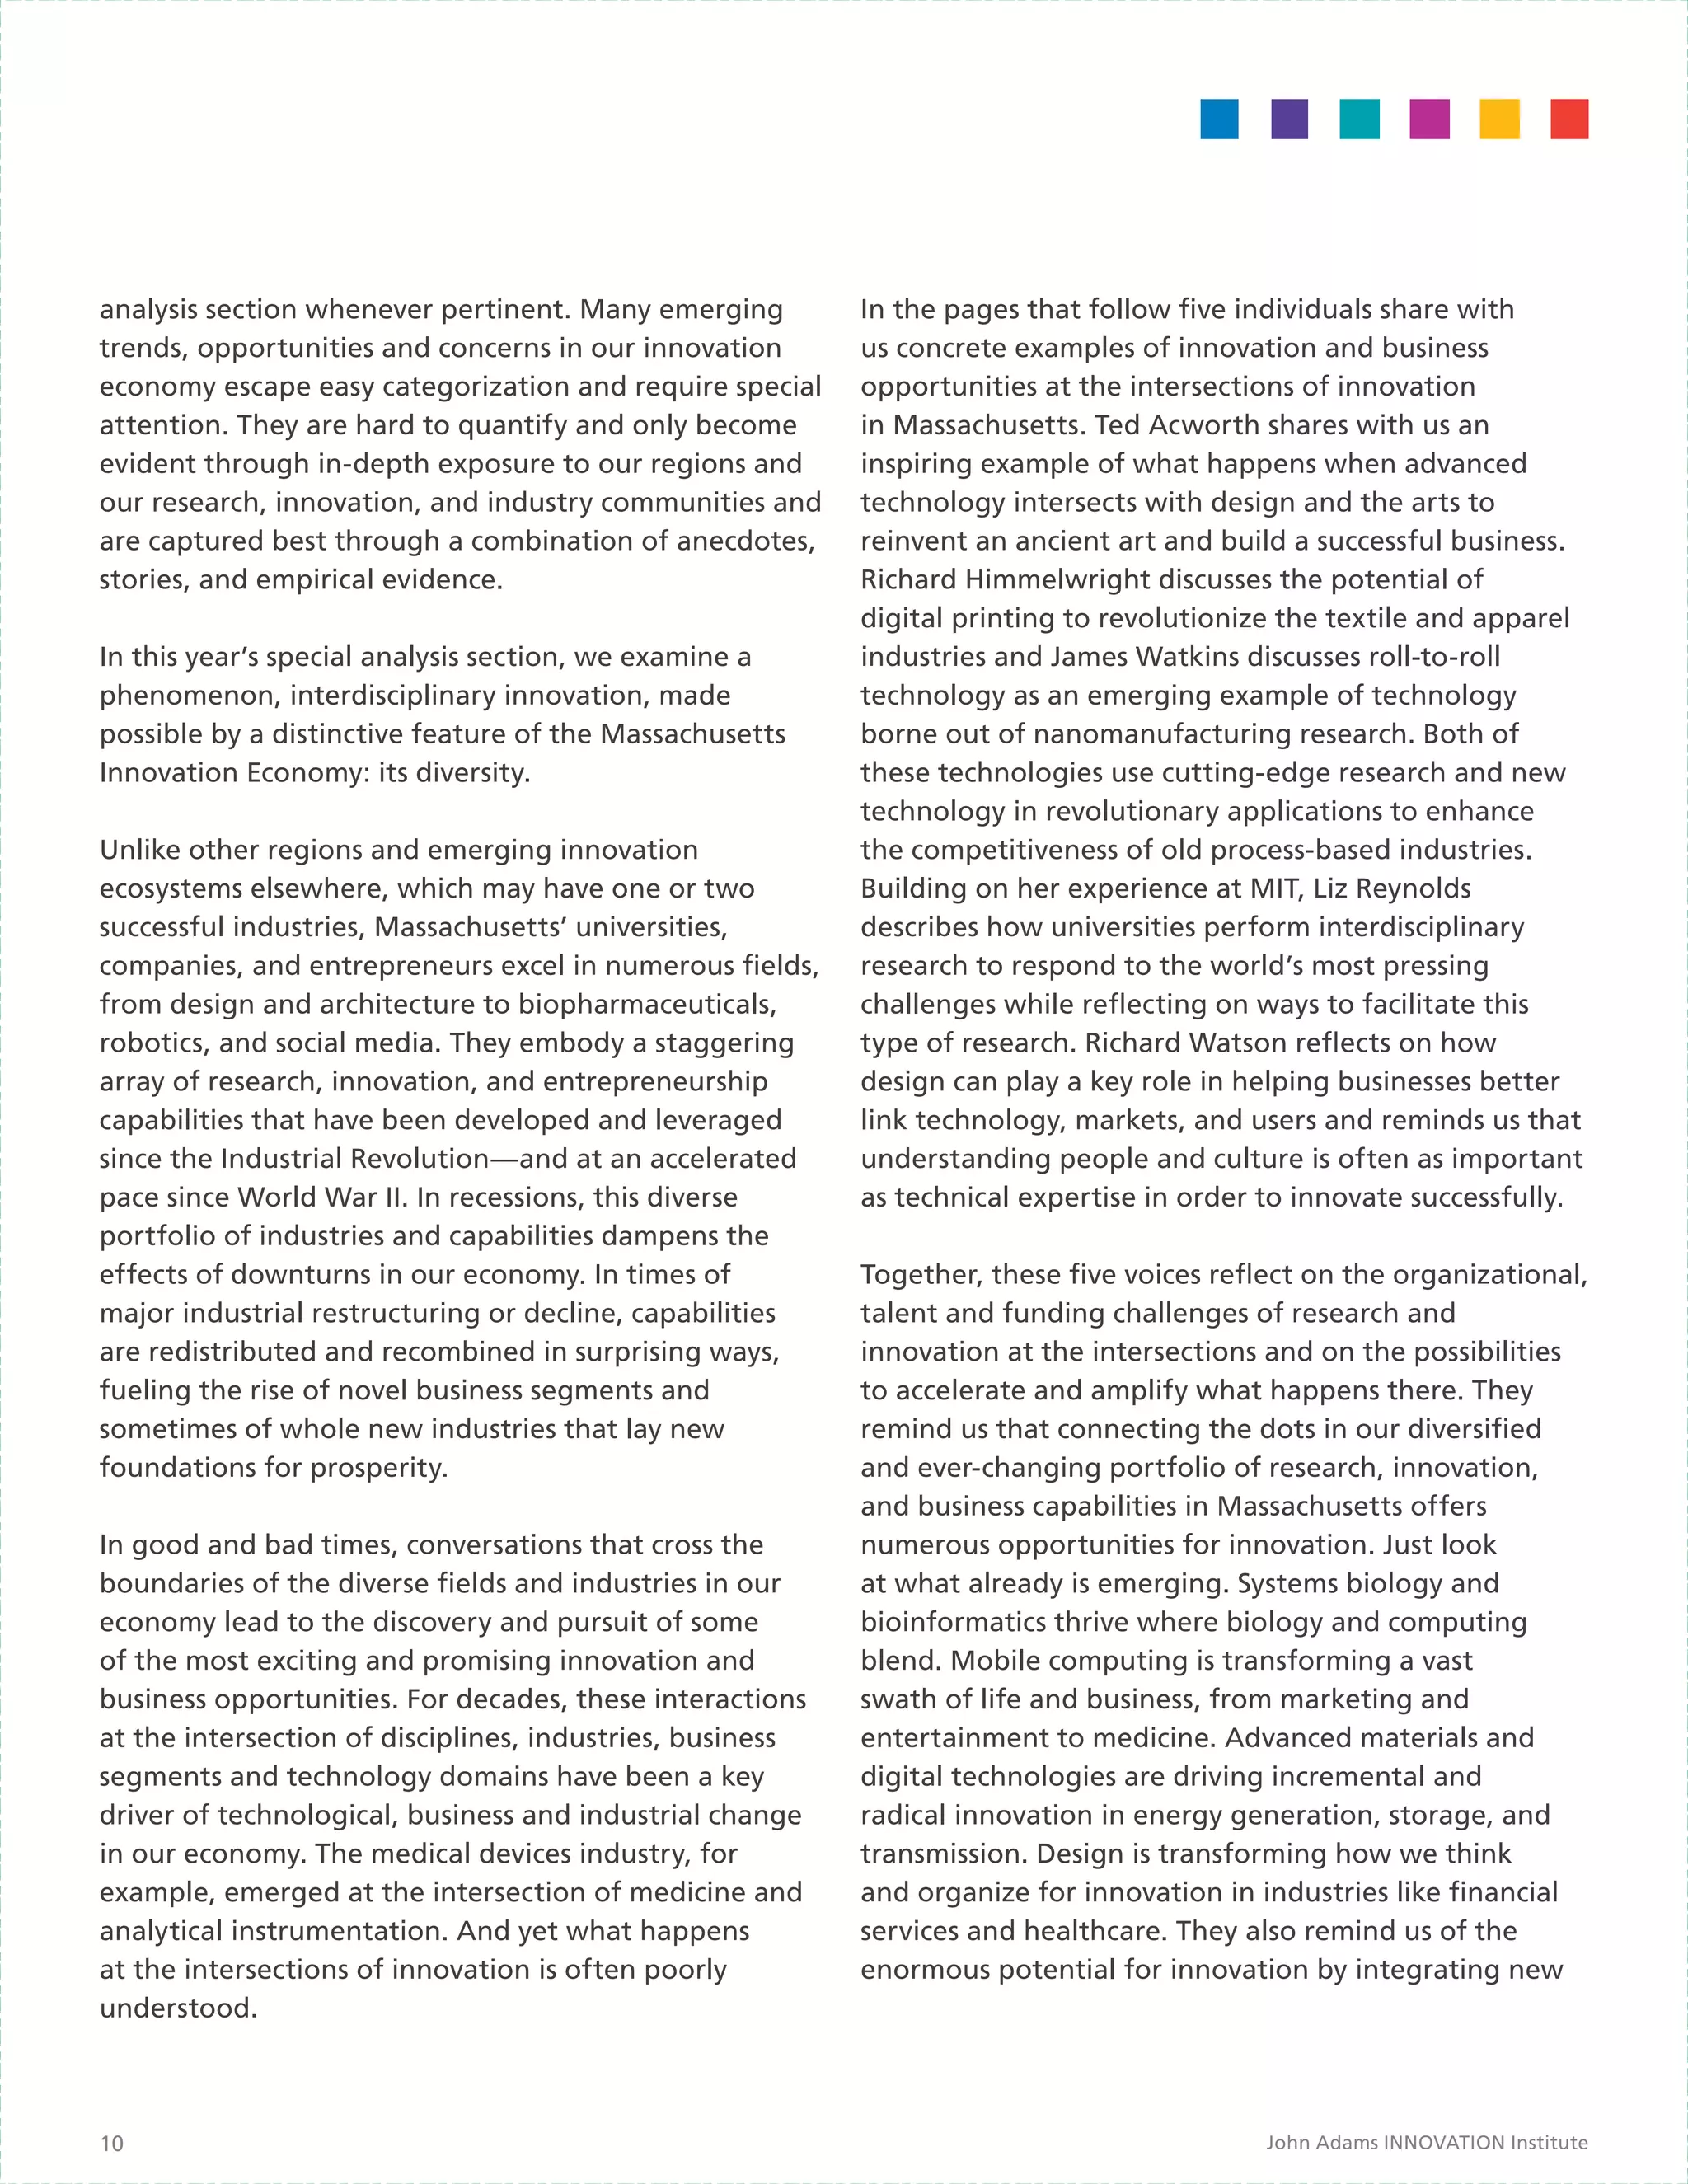
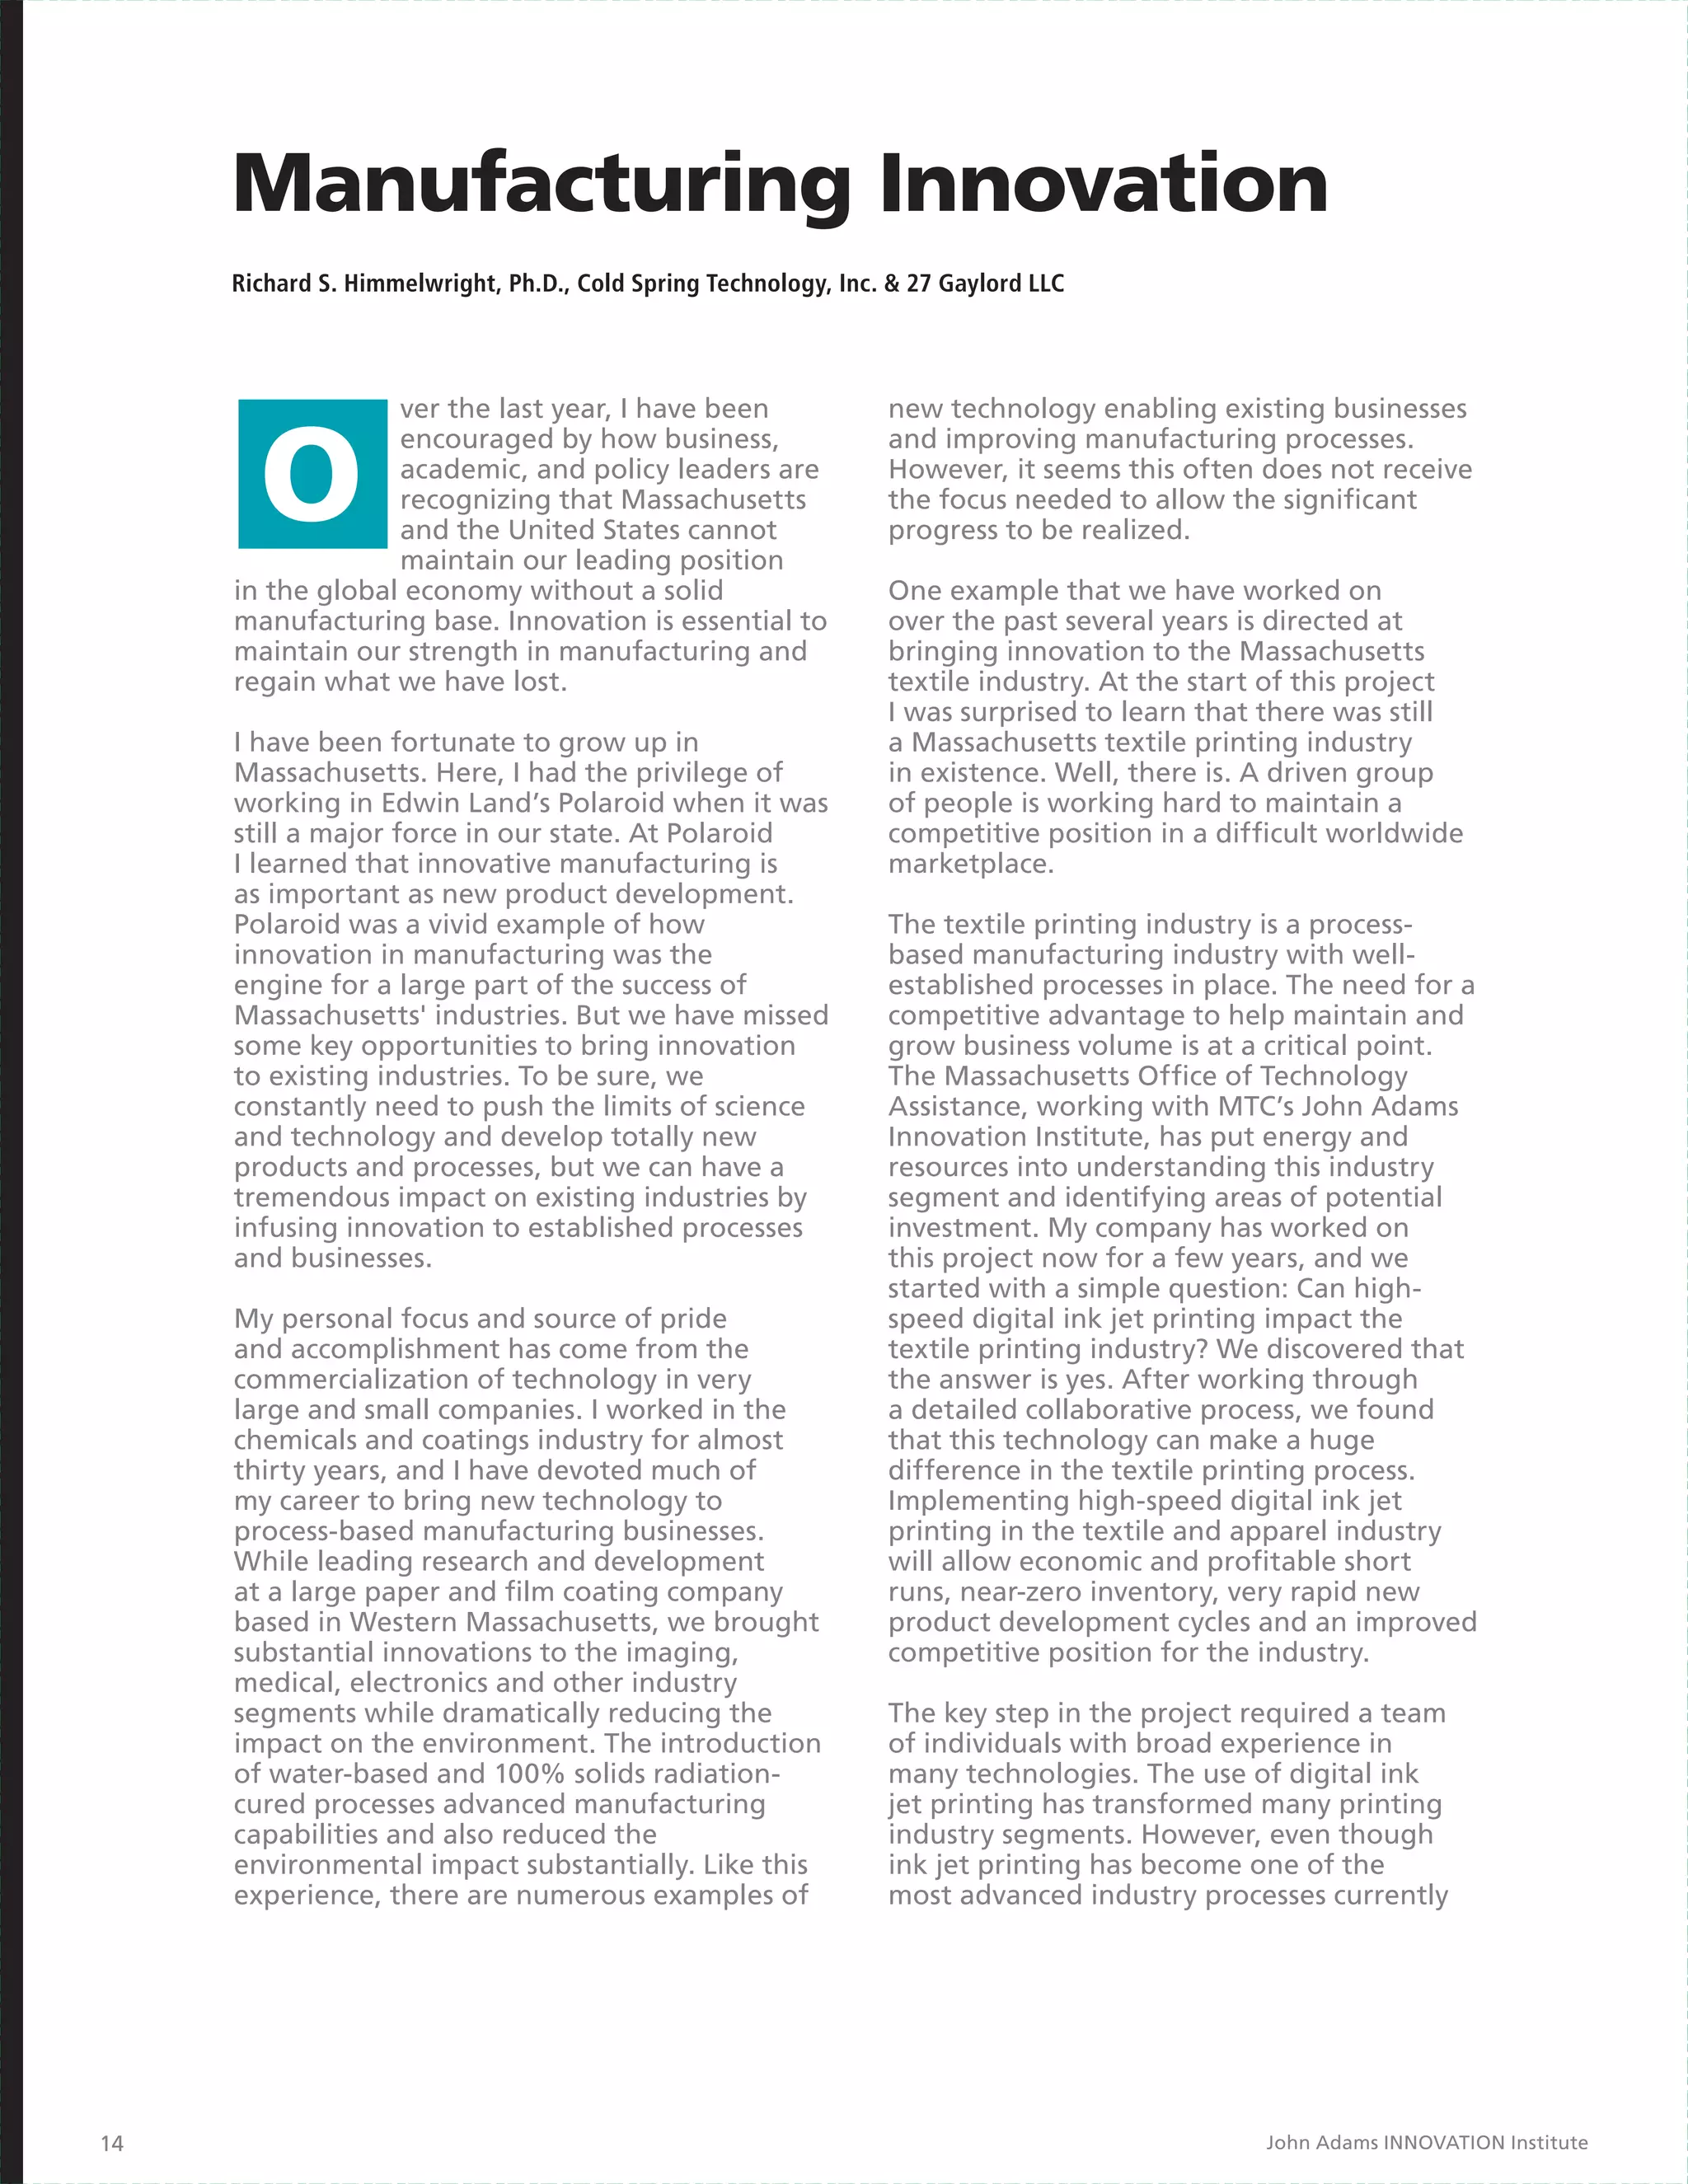
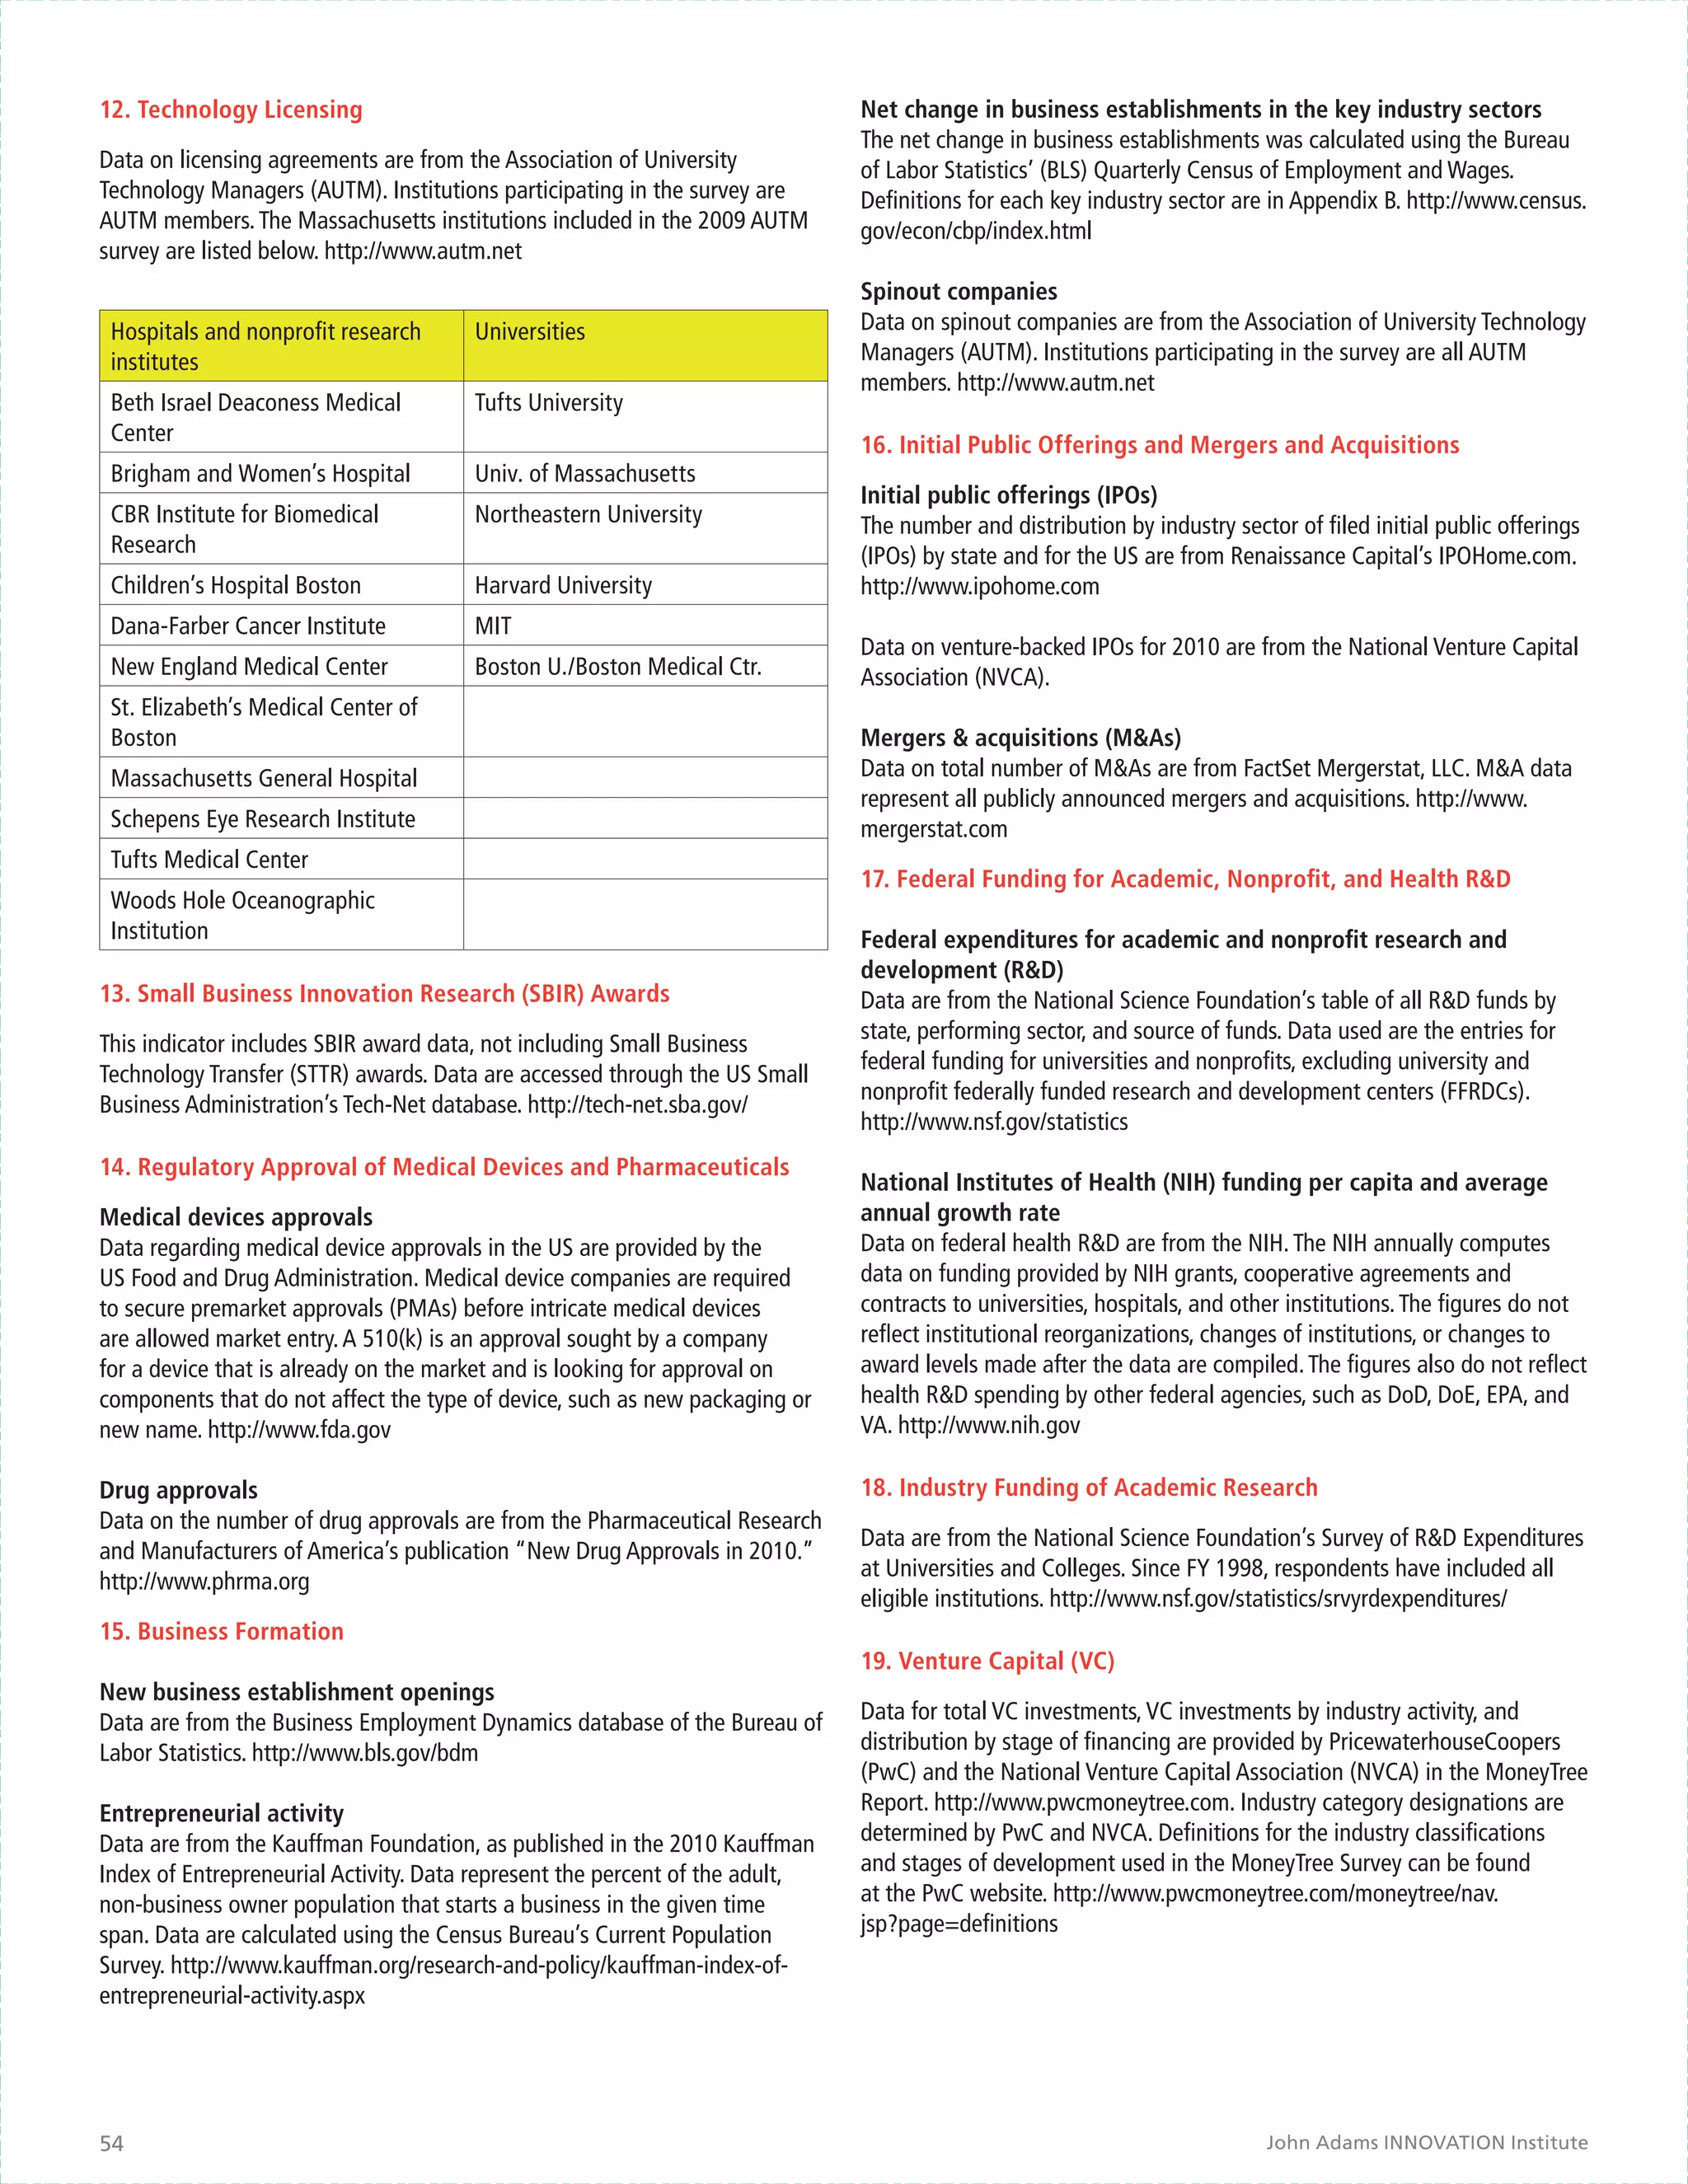
Business Development Investors in these areas, capable of assessing both the
risk and opportunities associated of new technologies
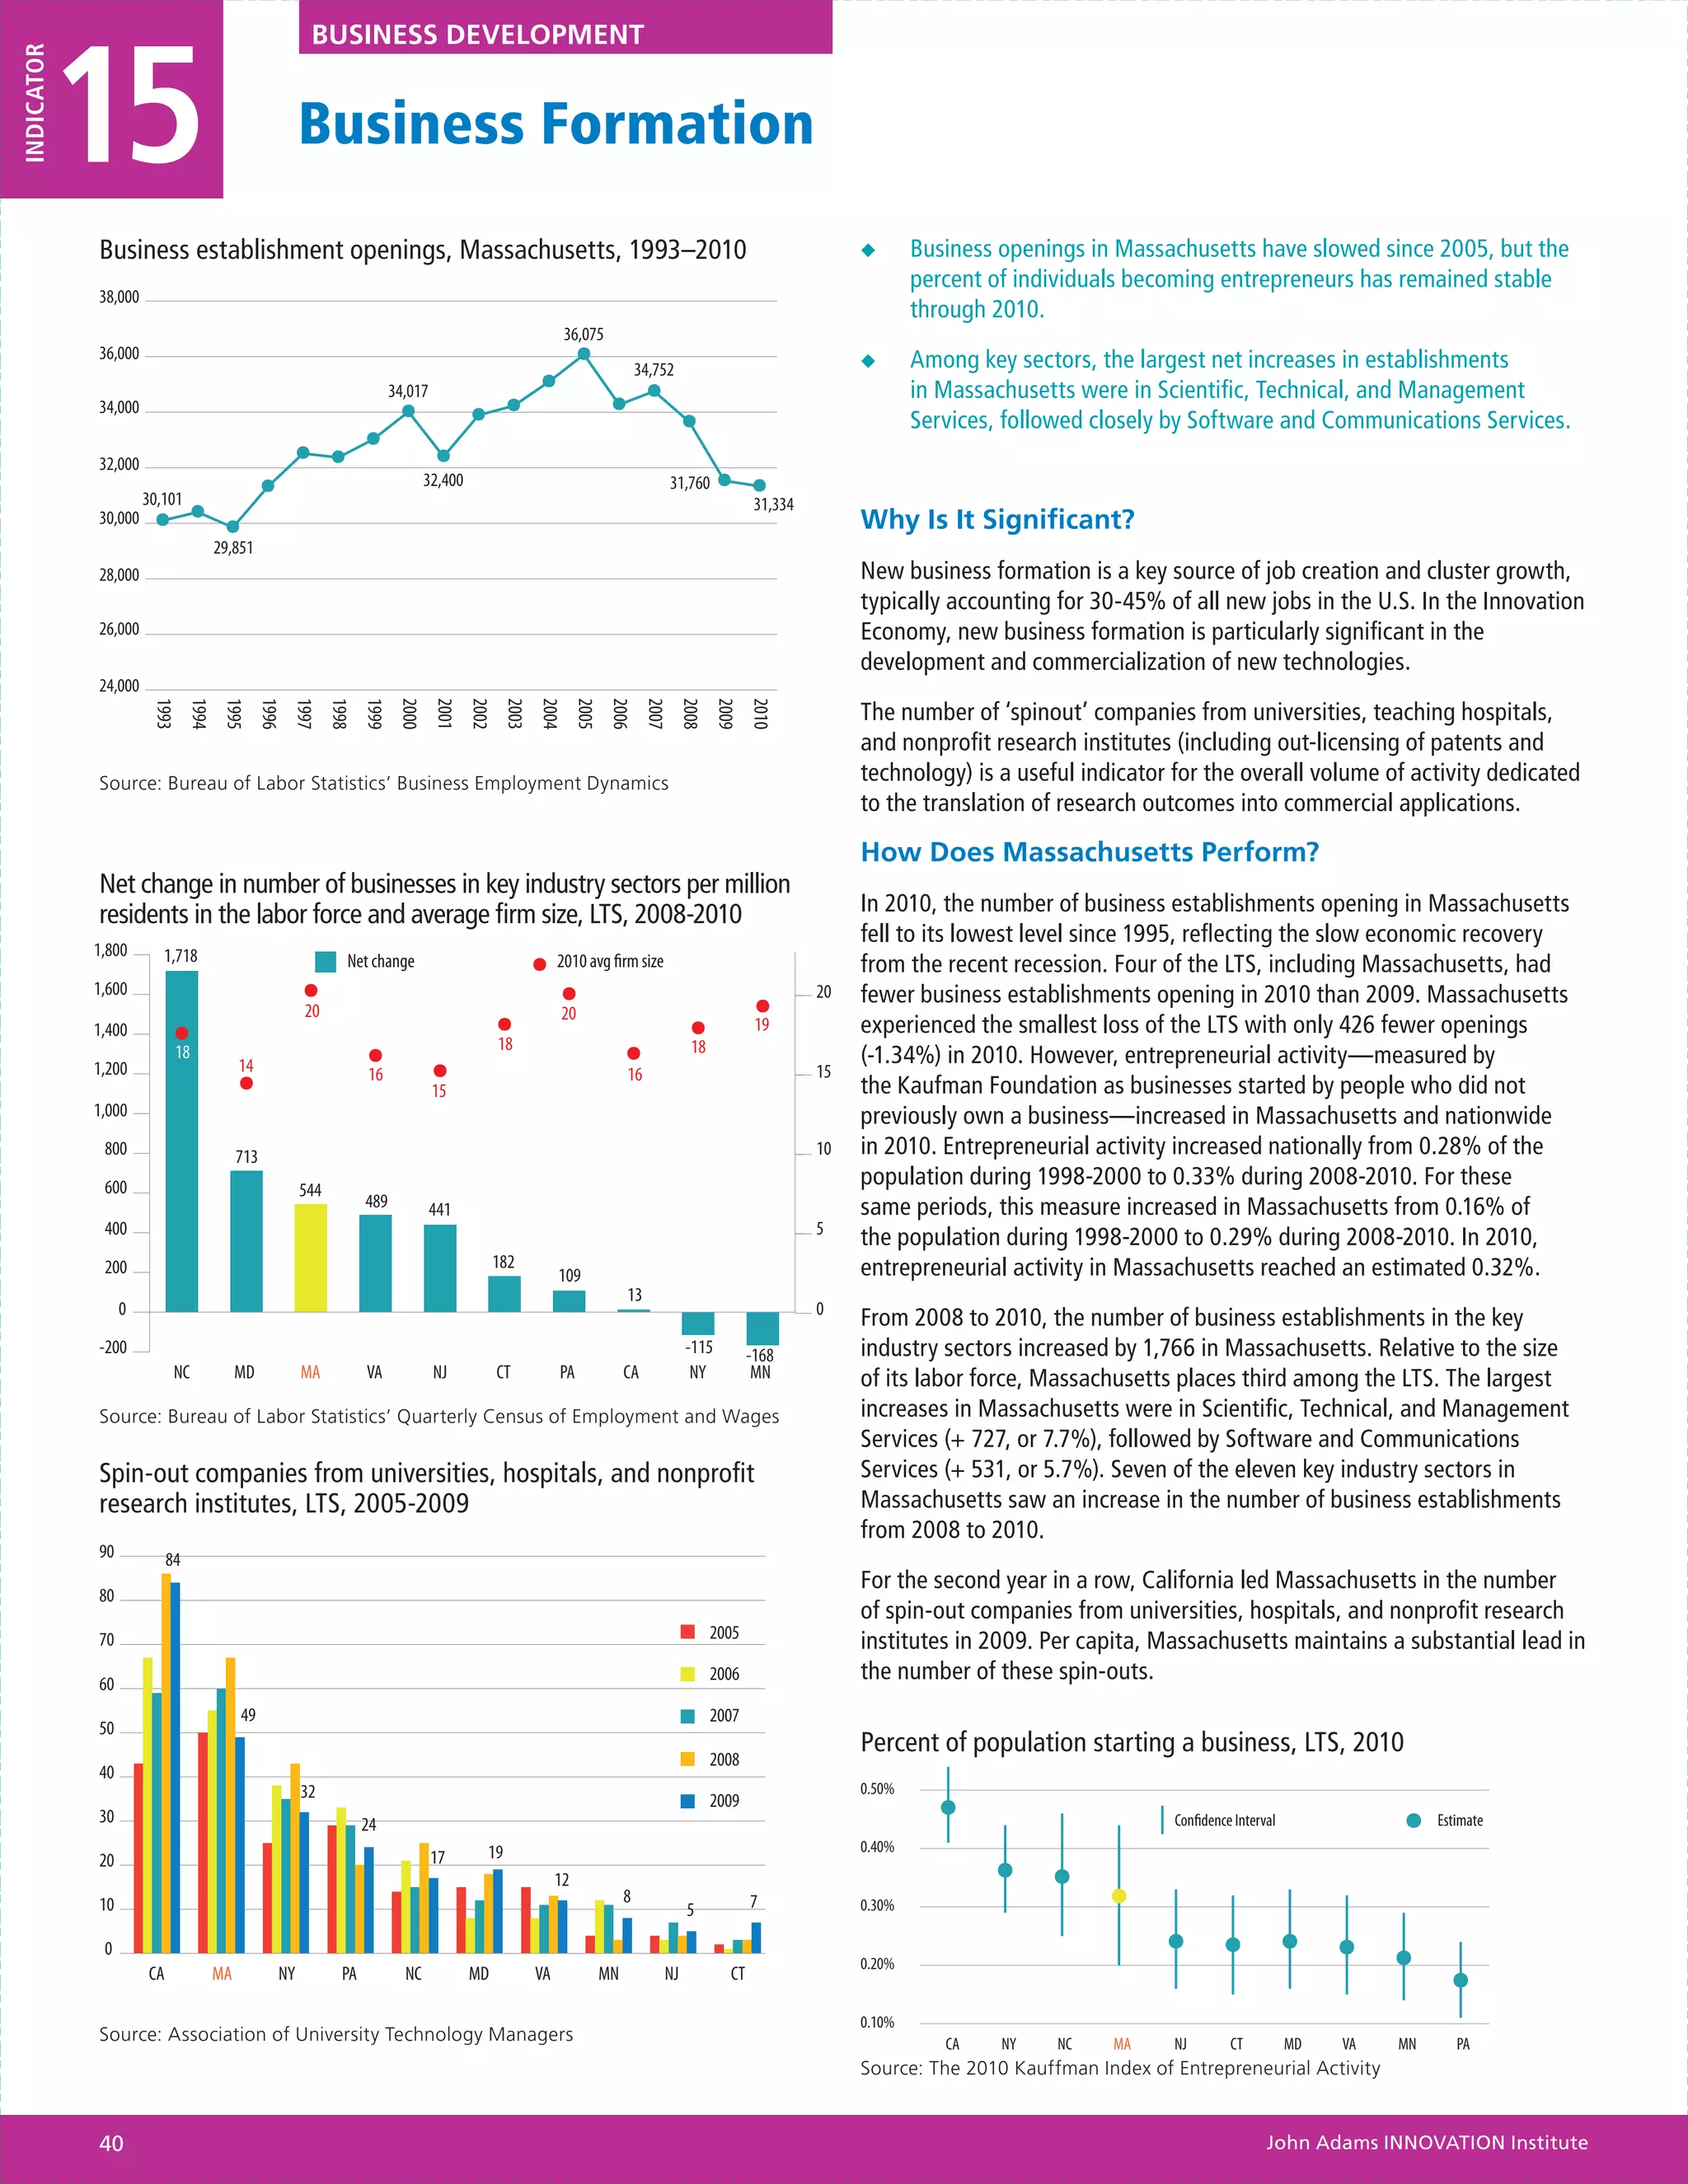
Business development involves commercialization, and entrepreneurial ventures, are partners in the
new business formation [Indicator #15], and business innovation process and vital to its success.
expansion. For existing businesses, growing to scale and
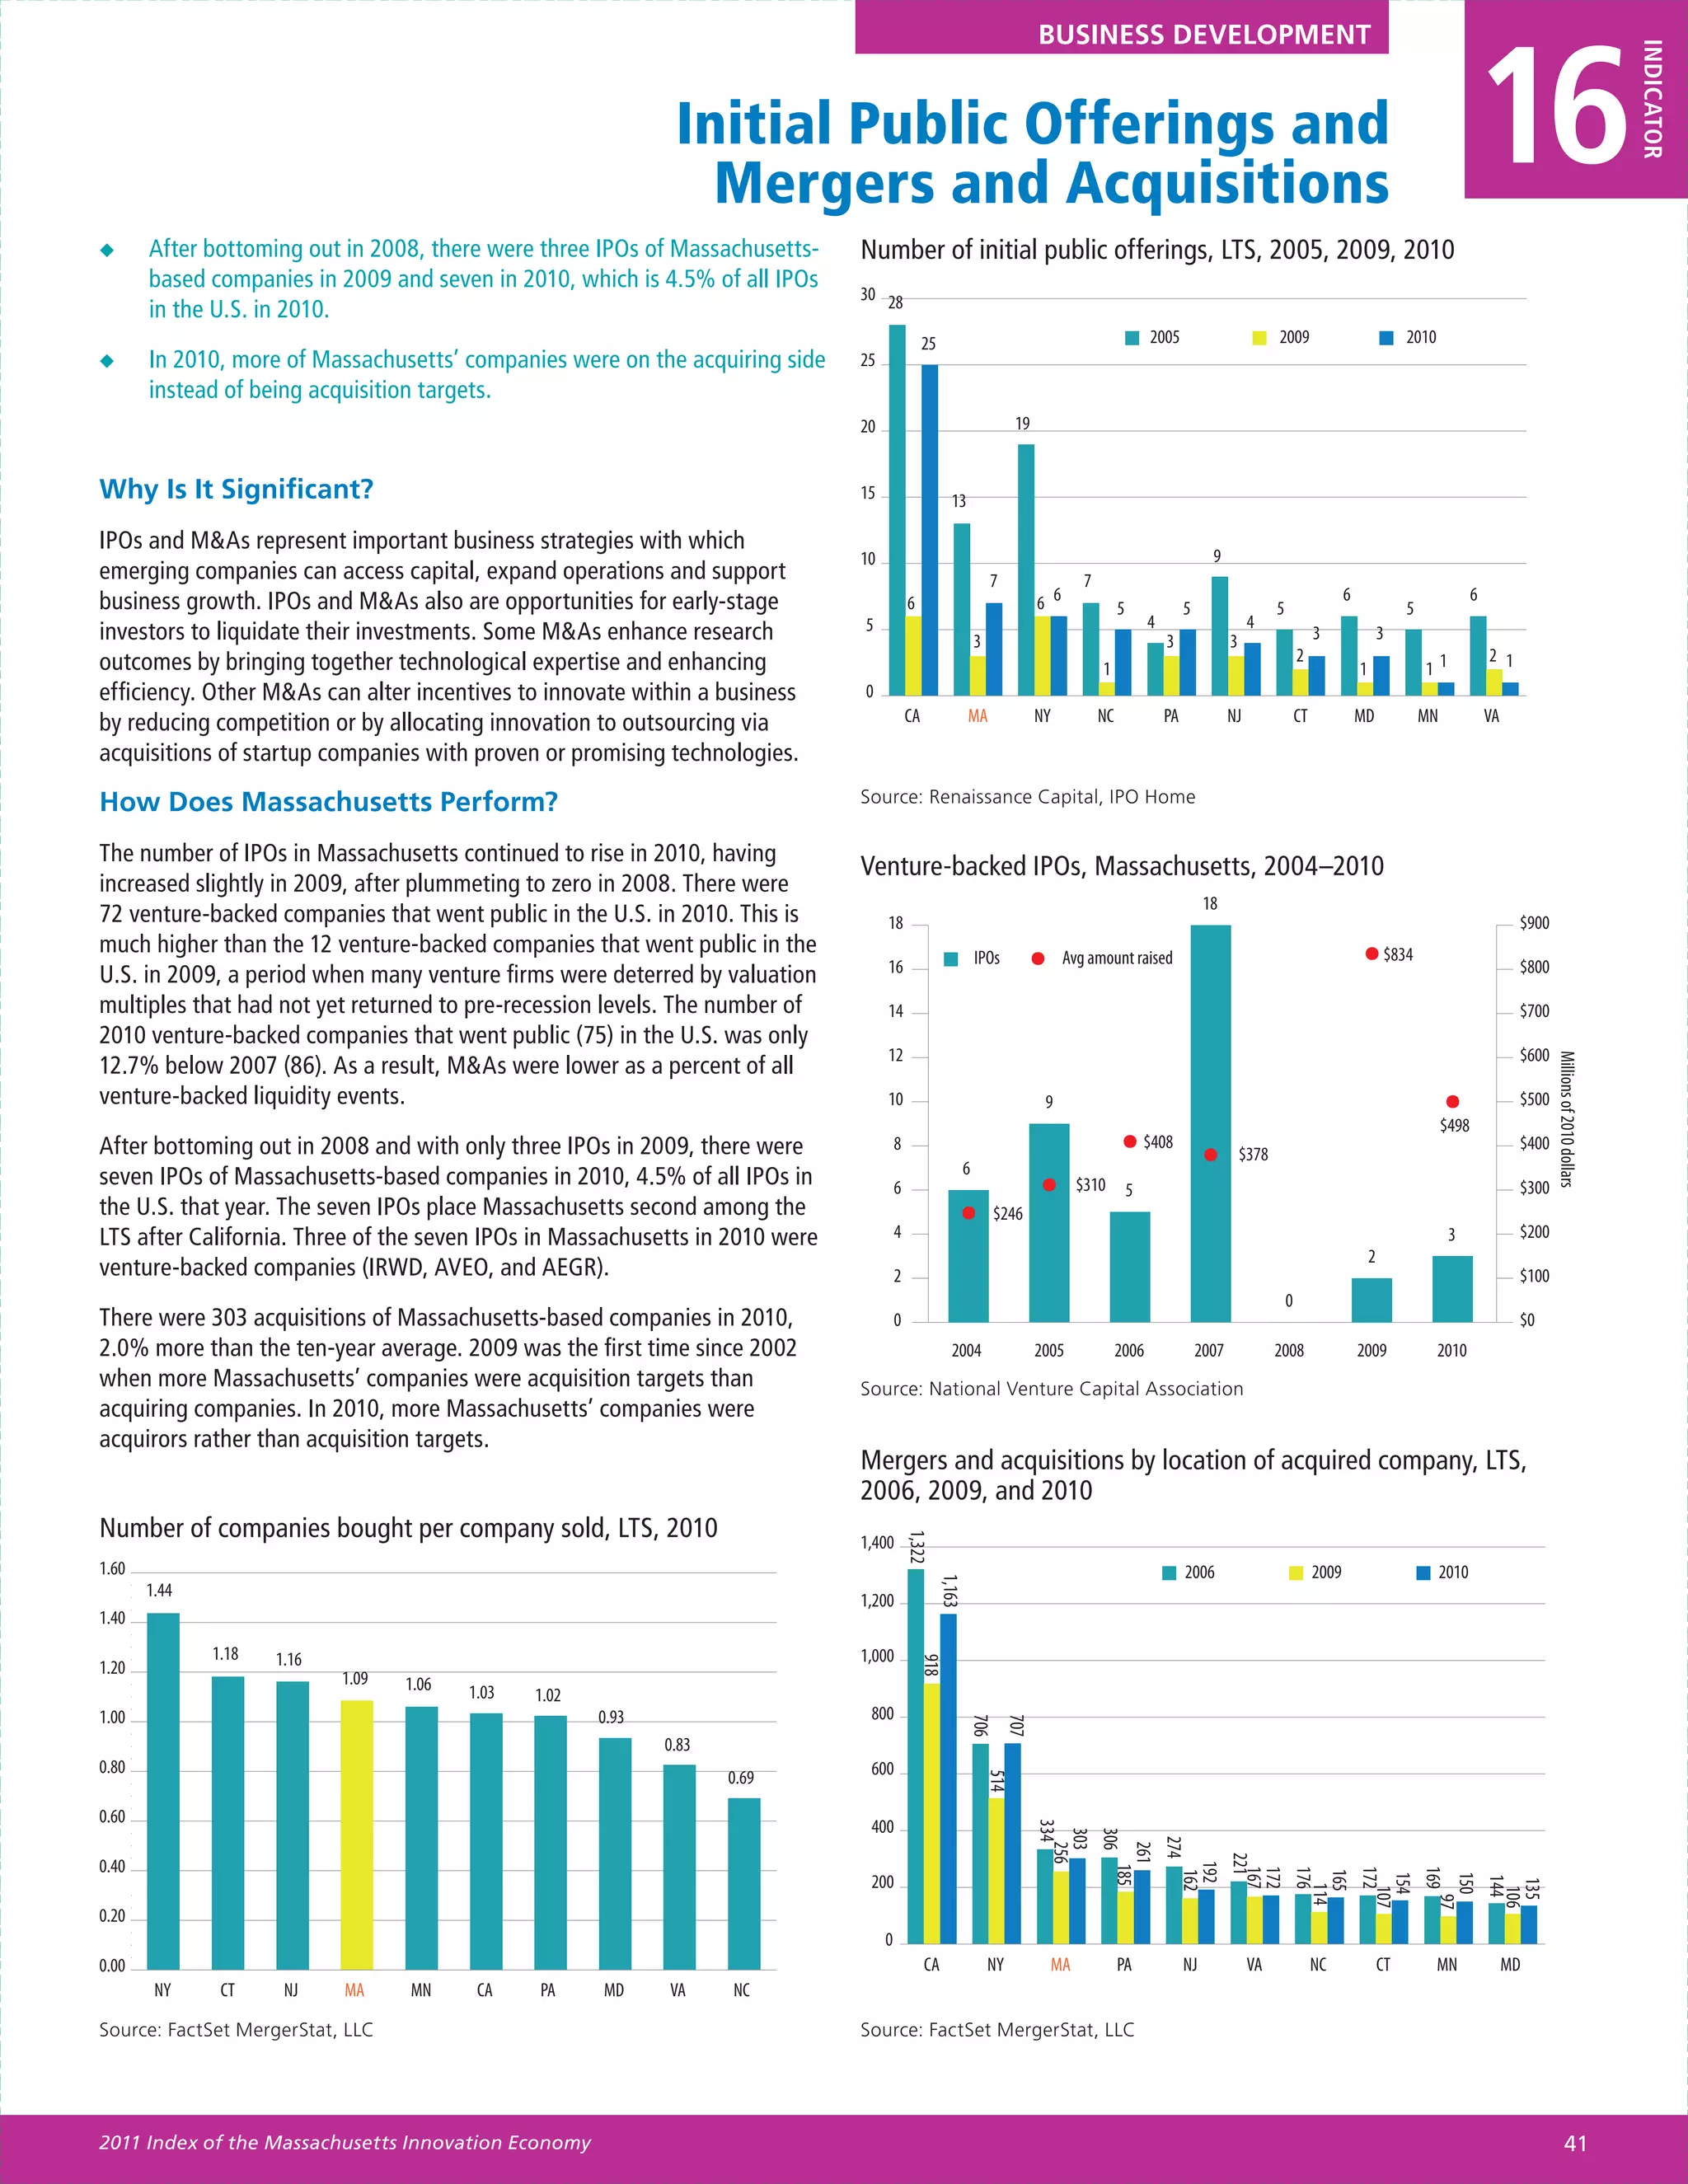
sustainability often involves an initial public offering Talent
(IPOs), a merger or an acquisition (M&A) [Indicator
#16]. Technical, business, and financial expertise all Innovation may be about technology and business
play a role in the process of analyzing and realizing outcomes, but it is a social process. As such, innovation
business opportunities, which result after research and is driven by the individuals who are actively involved
development are translated into processes, products, in science, technology, design, and business
or services. Business model innovation also creates development. The concentration of men and women
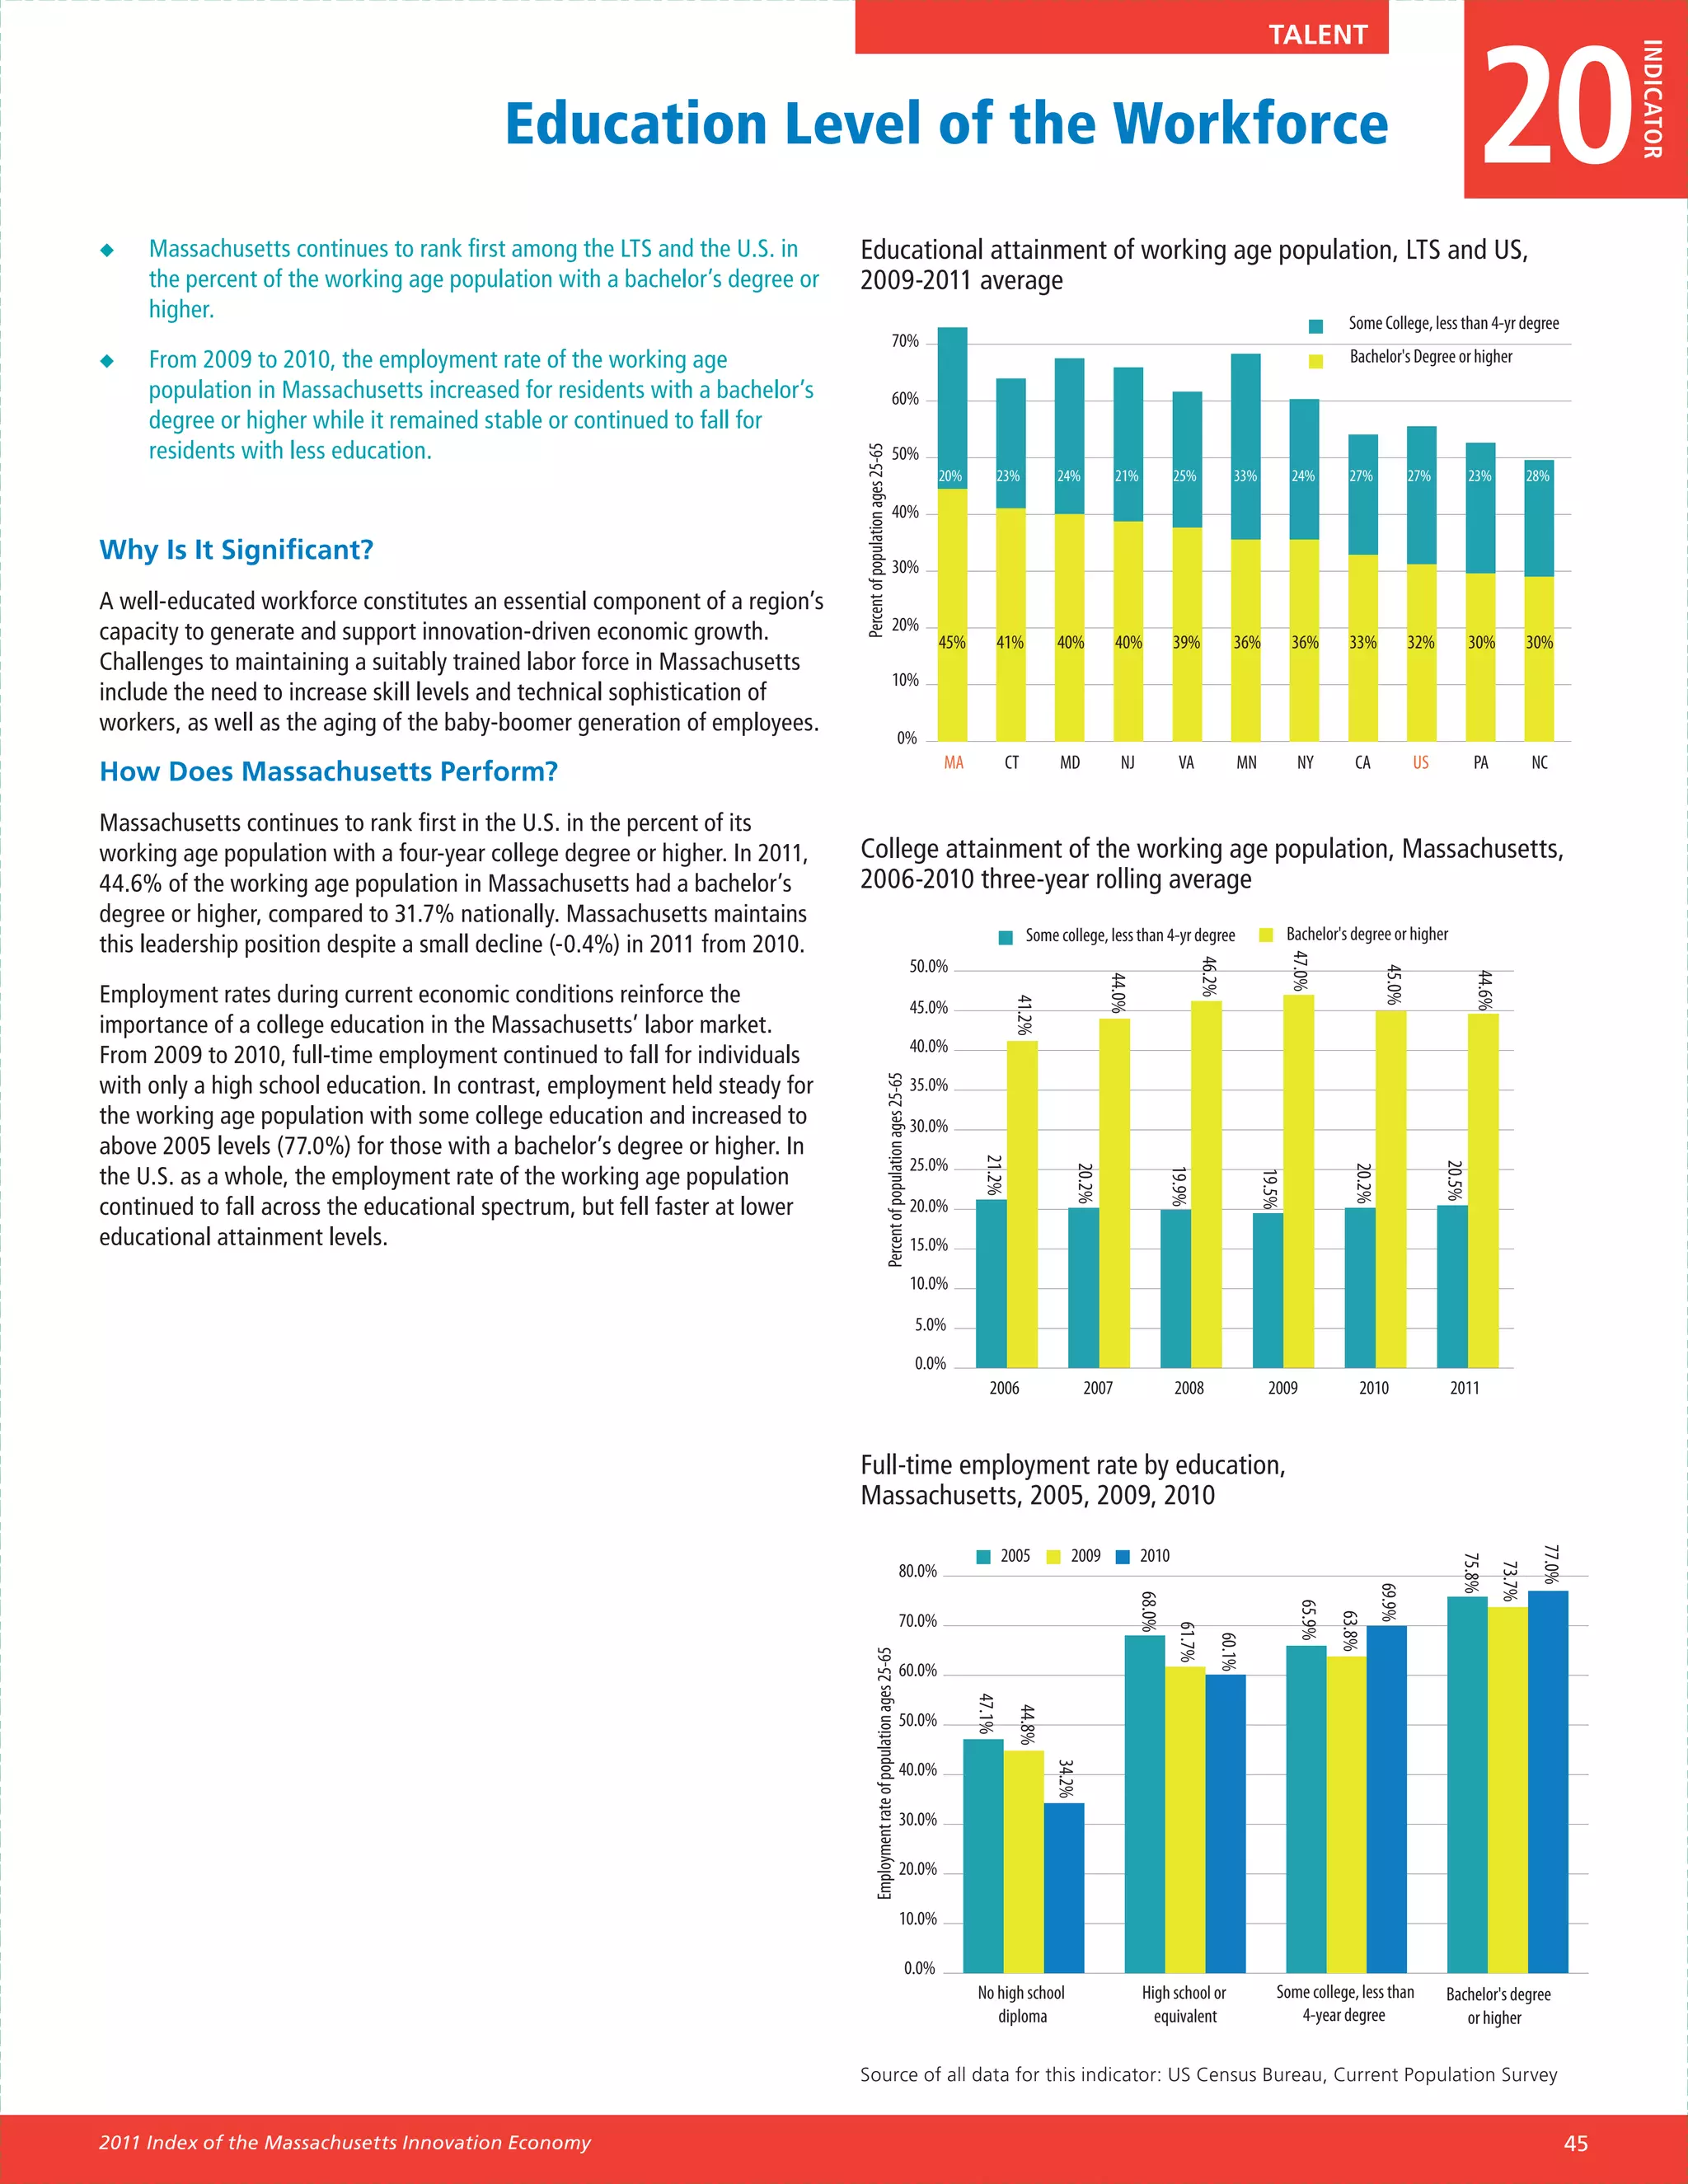
value but is not measured by the Index due to difficult with postsecondary and graduate education [Indicator
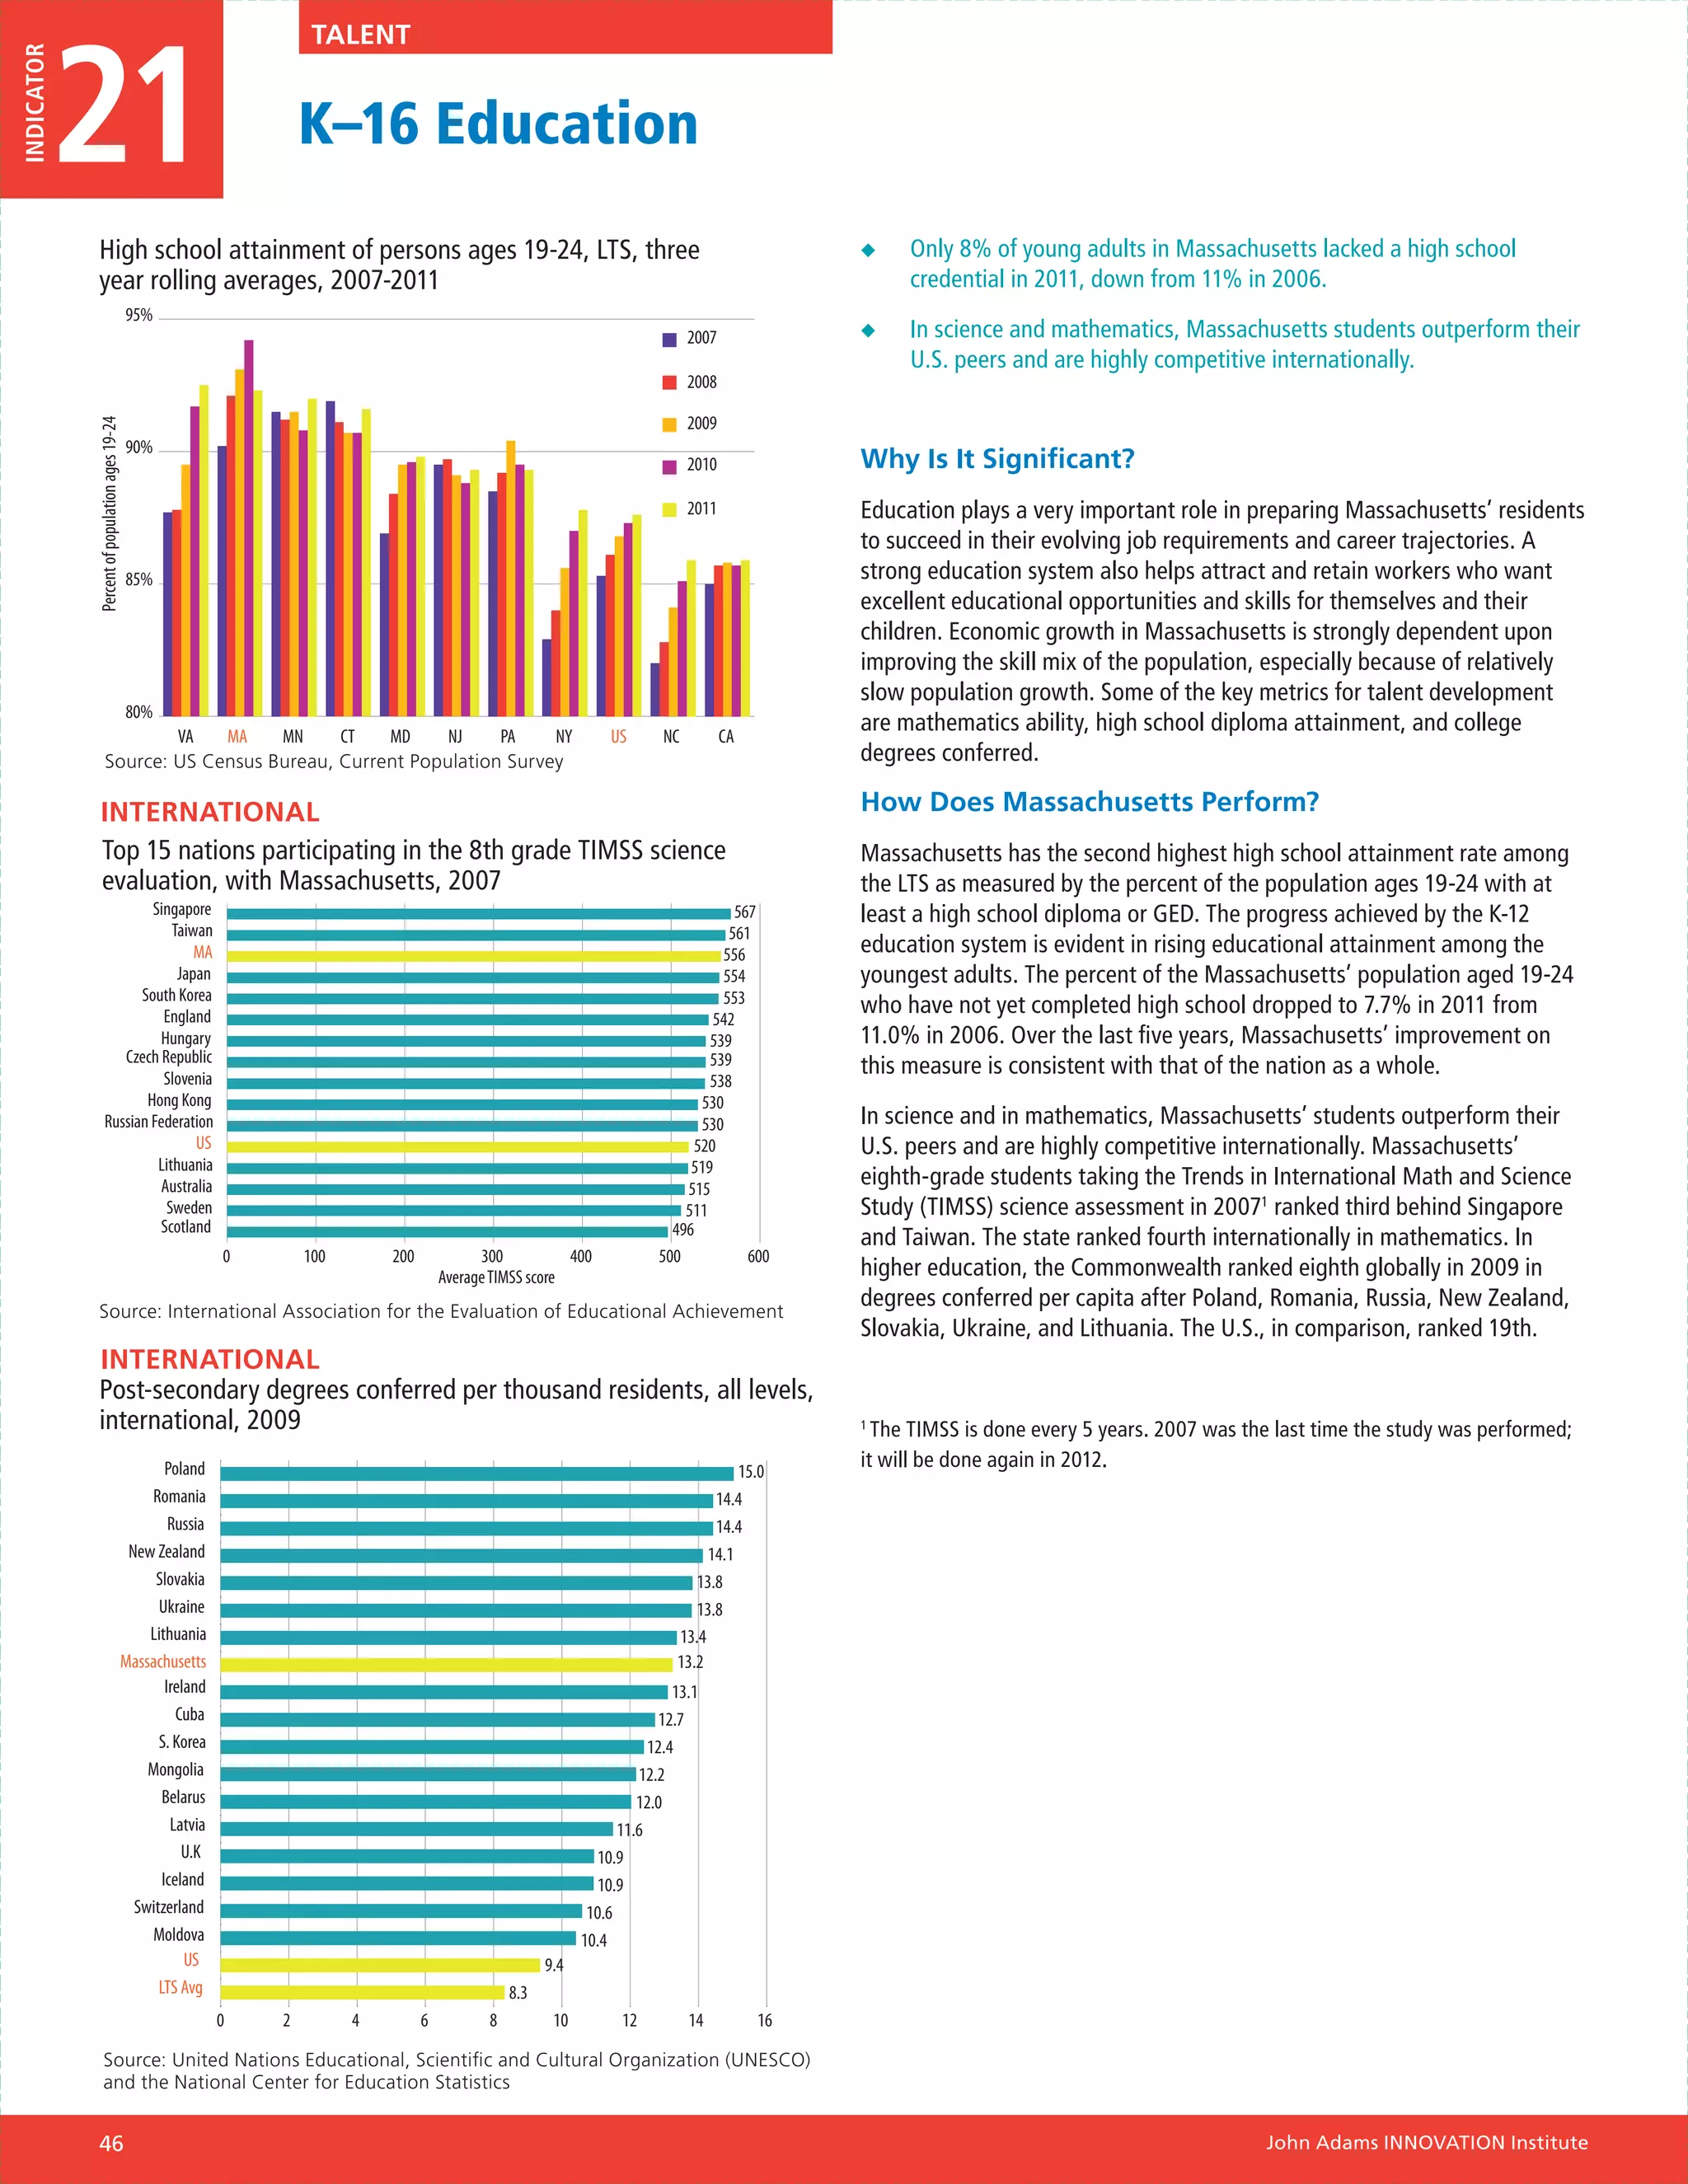
quantification. #20], complemented by the strength of the education
system [Indicator #21] provides the Commonwealth
Innovation Capacity with competitive advantages in the global economy.
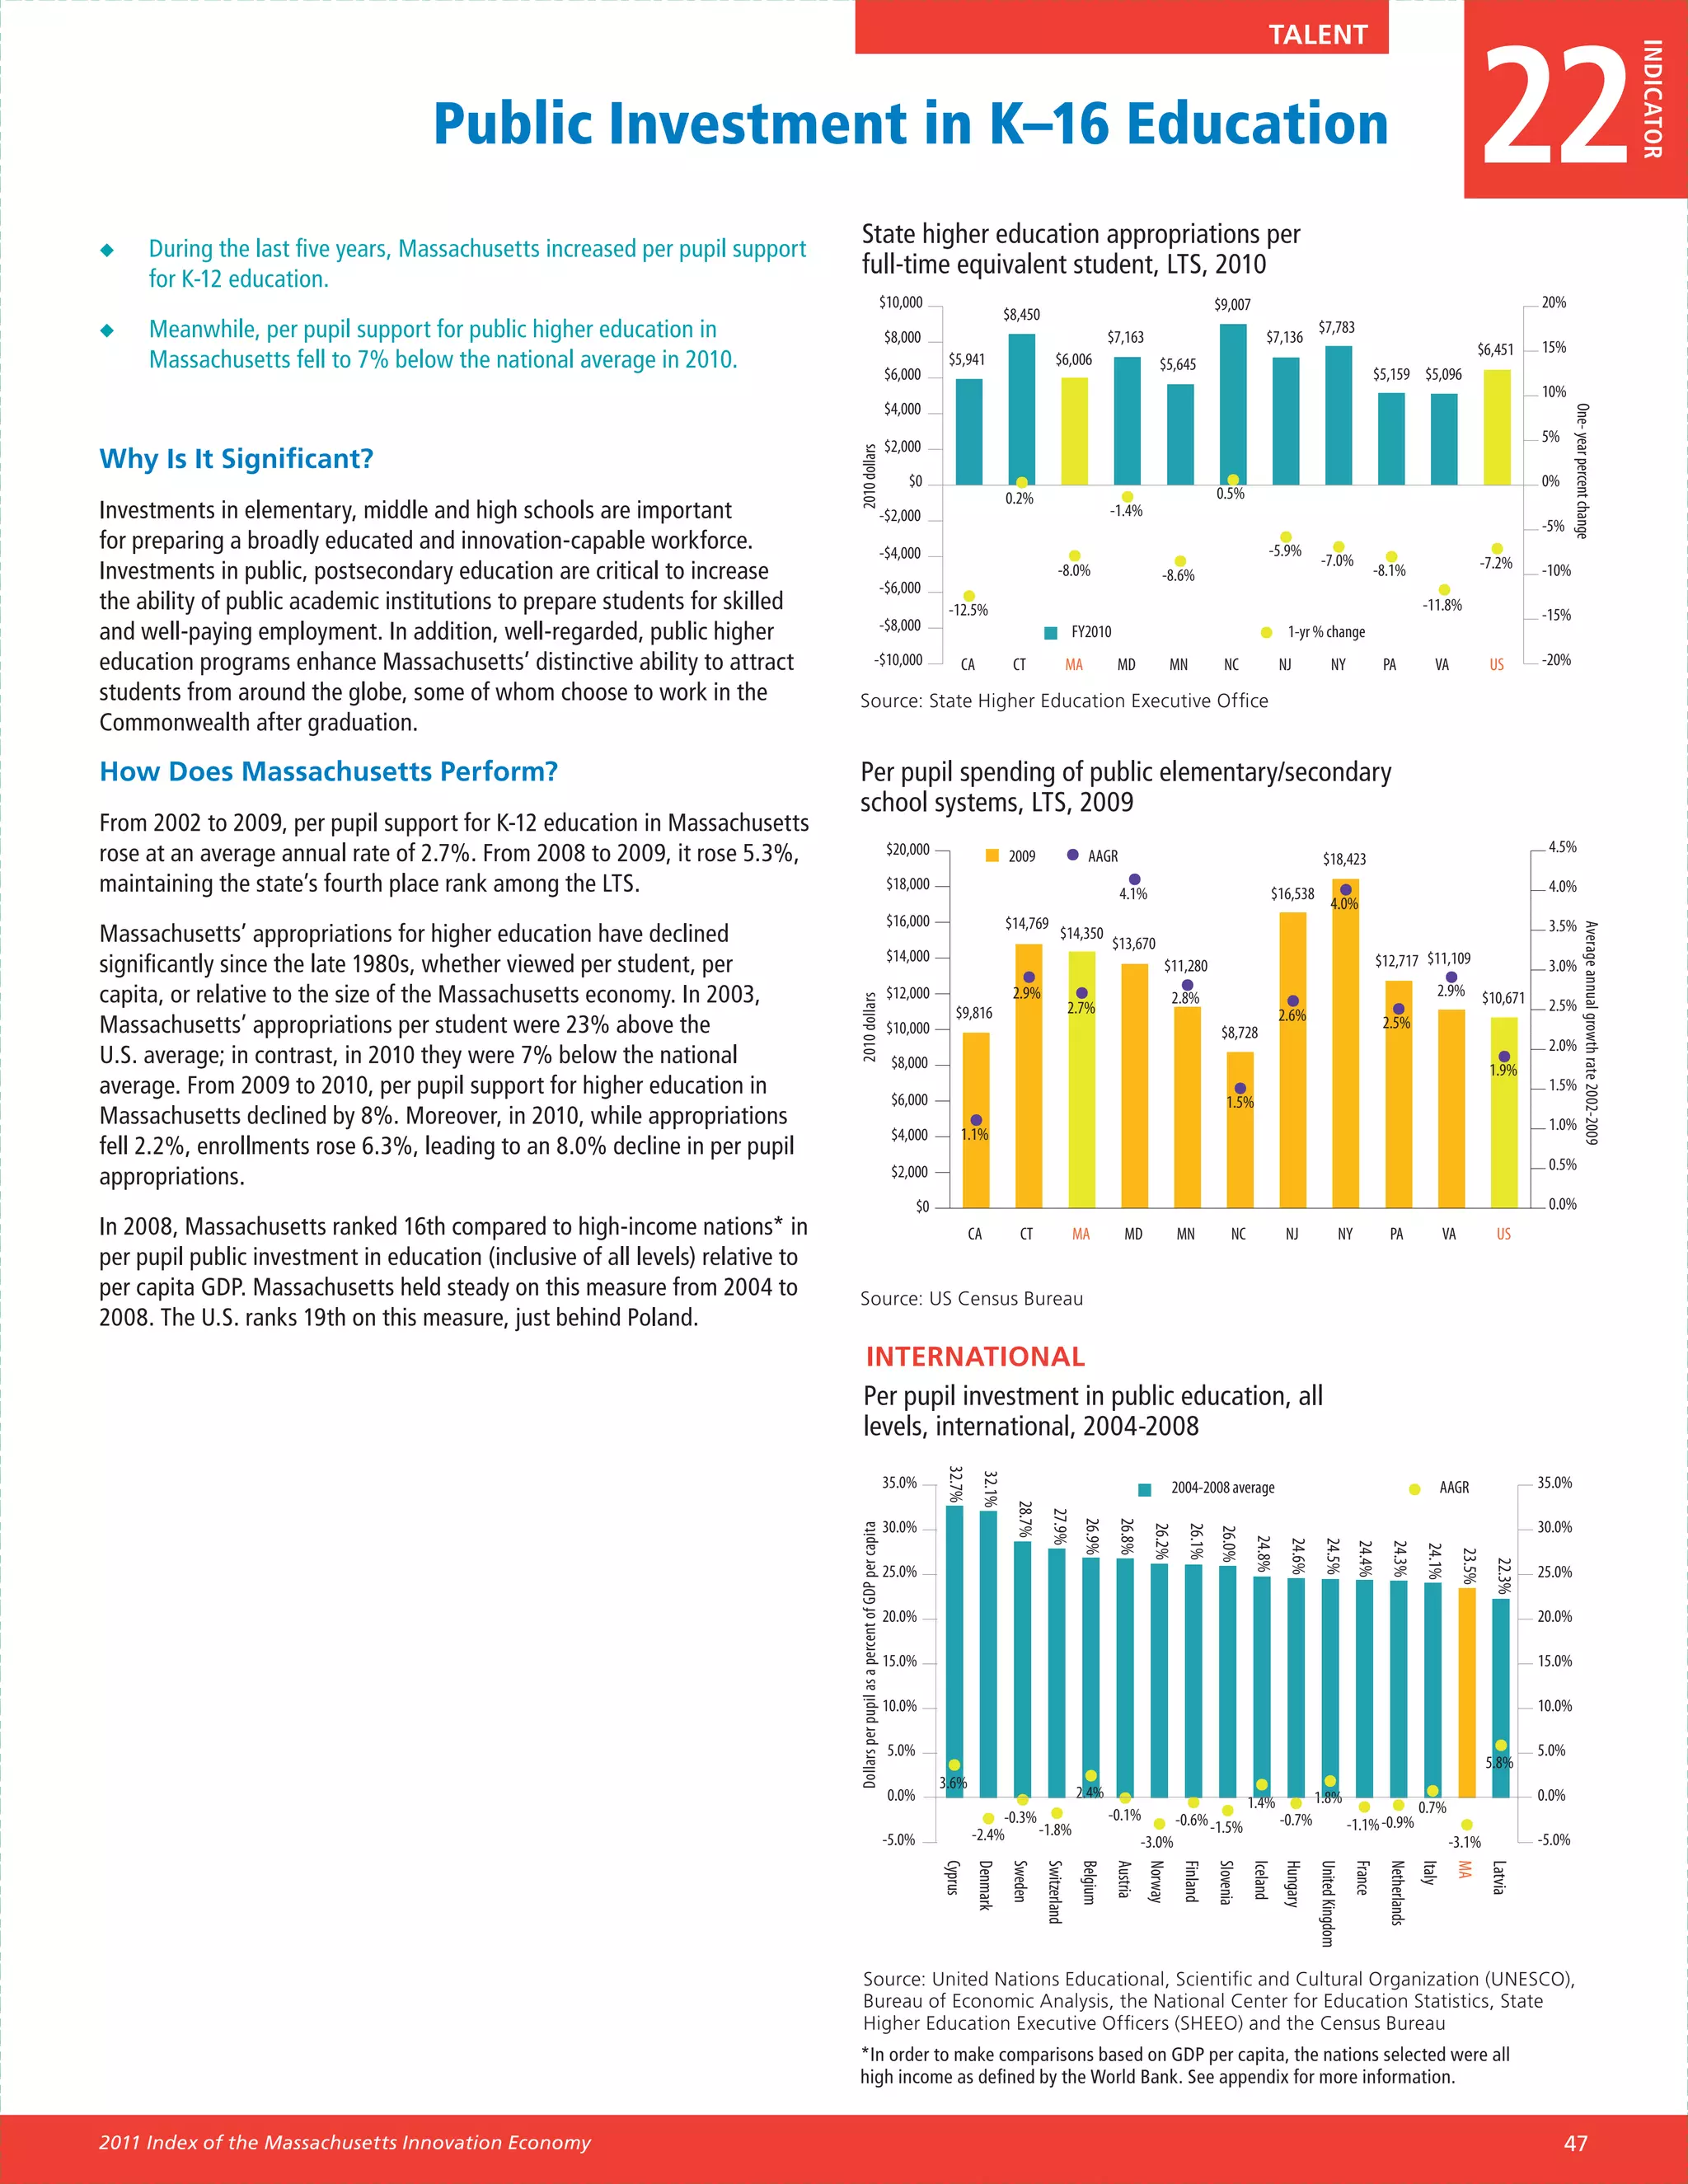
Investment in public education helps sustain quality
The performance of the Massachusetts innovation and enhance opportunities for individuals of diverse
ecosystem is greatly enhanced by a number of backgrounds to pursue a high school or college
factors that increase the capacity for innovation by degree [Indicator #22]. Students and individuals with
scientists, engineers, entrepreneurs, and firms in the an interest or background in science, technology,
Commonwealth. engineering, and math [Indicator #23] are particularly
important. Massachusetts also benefits from an
Capital ongoing movement of people across its boundaries,
including some of the brightest people from the nation
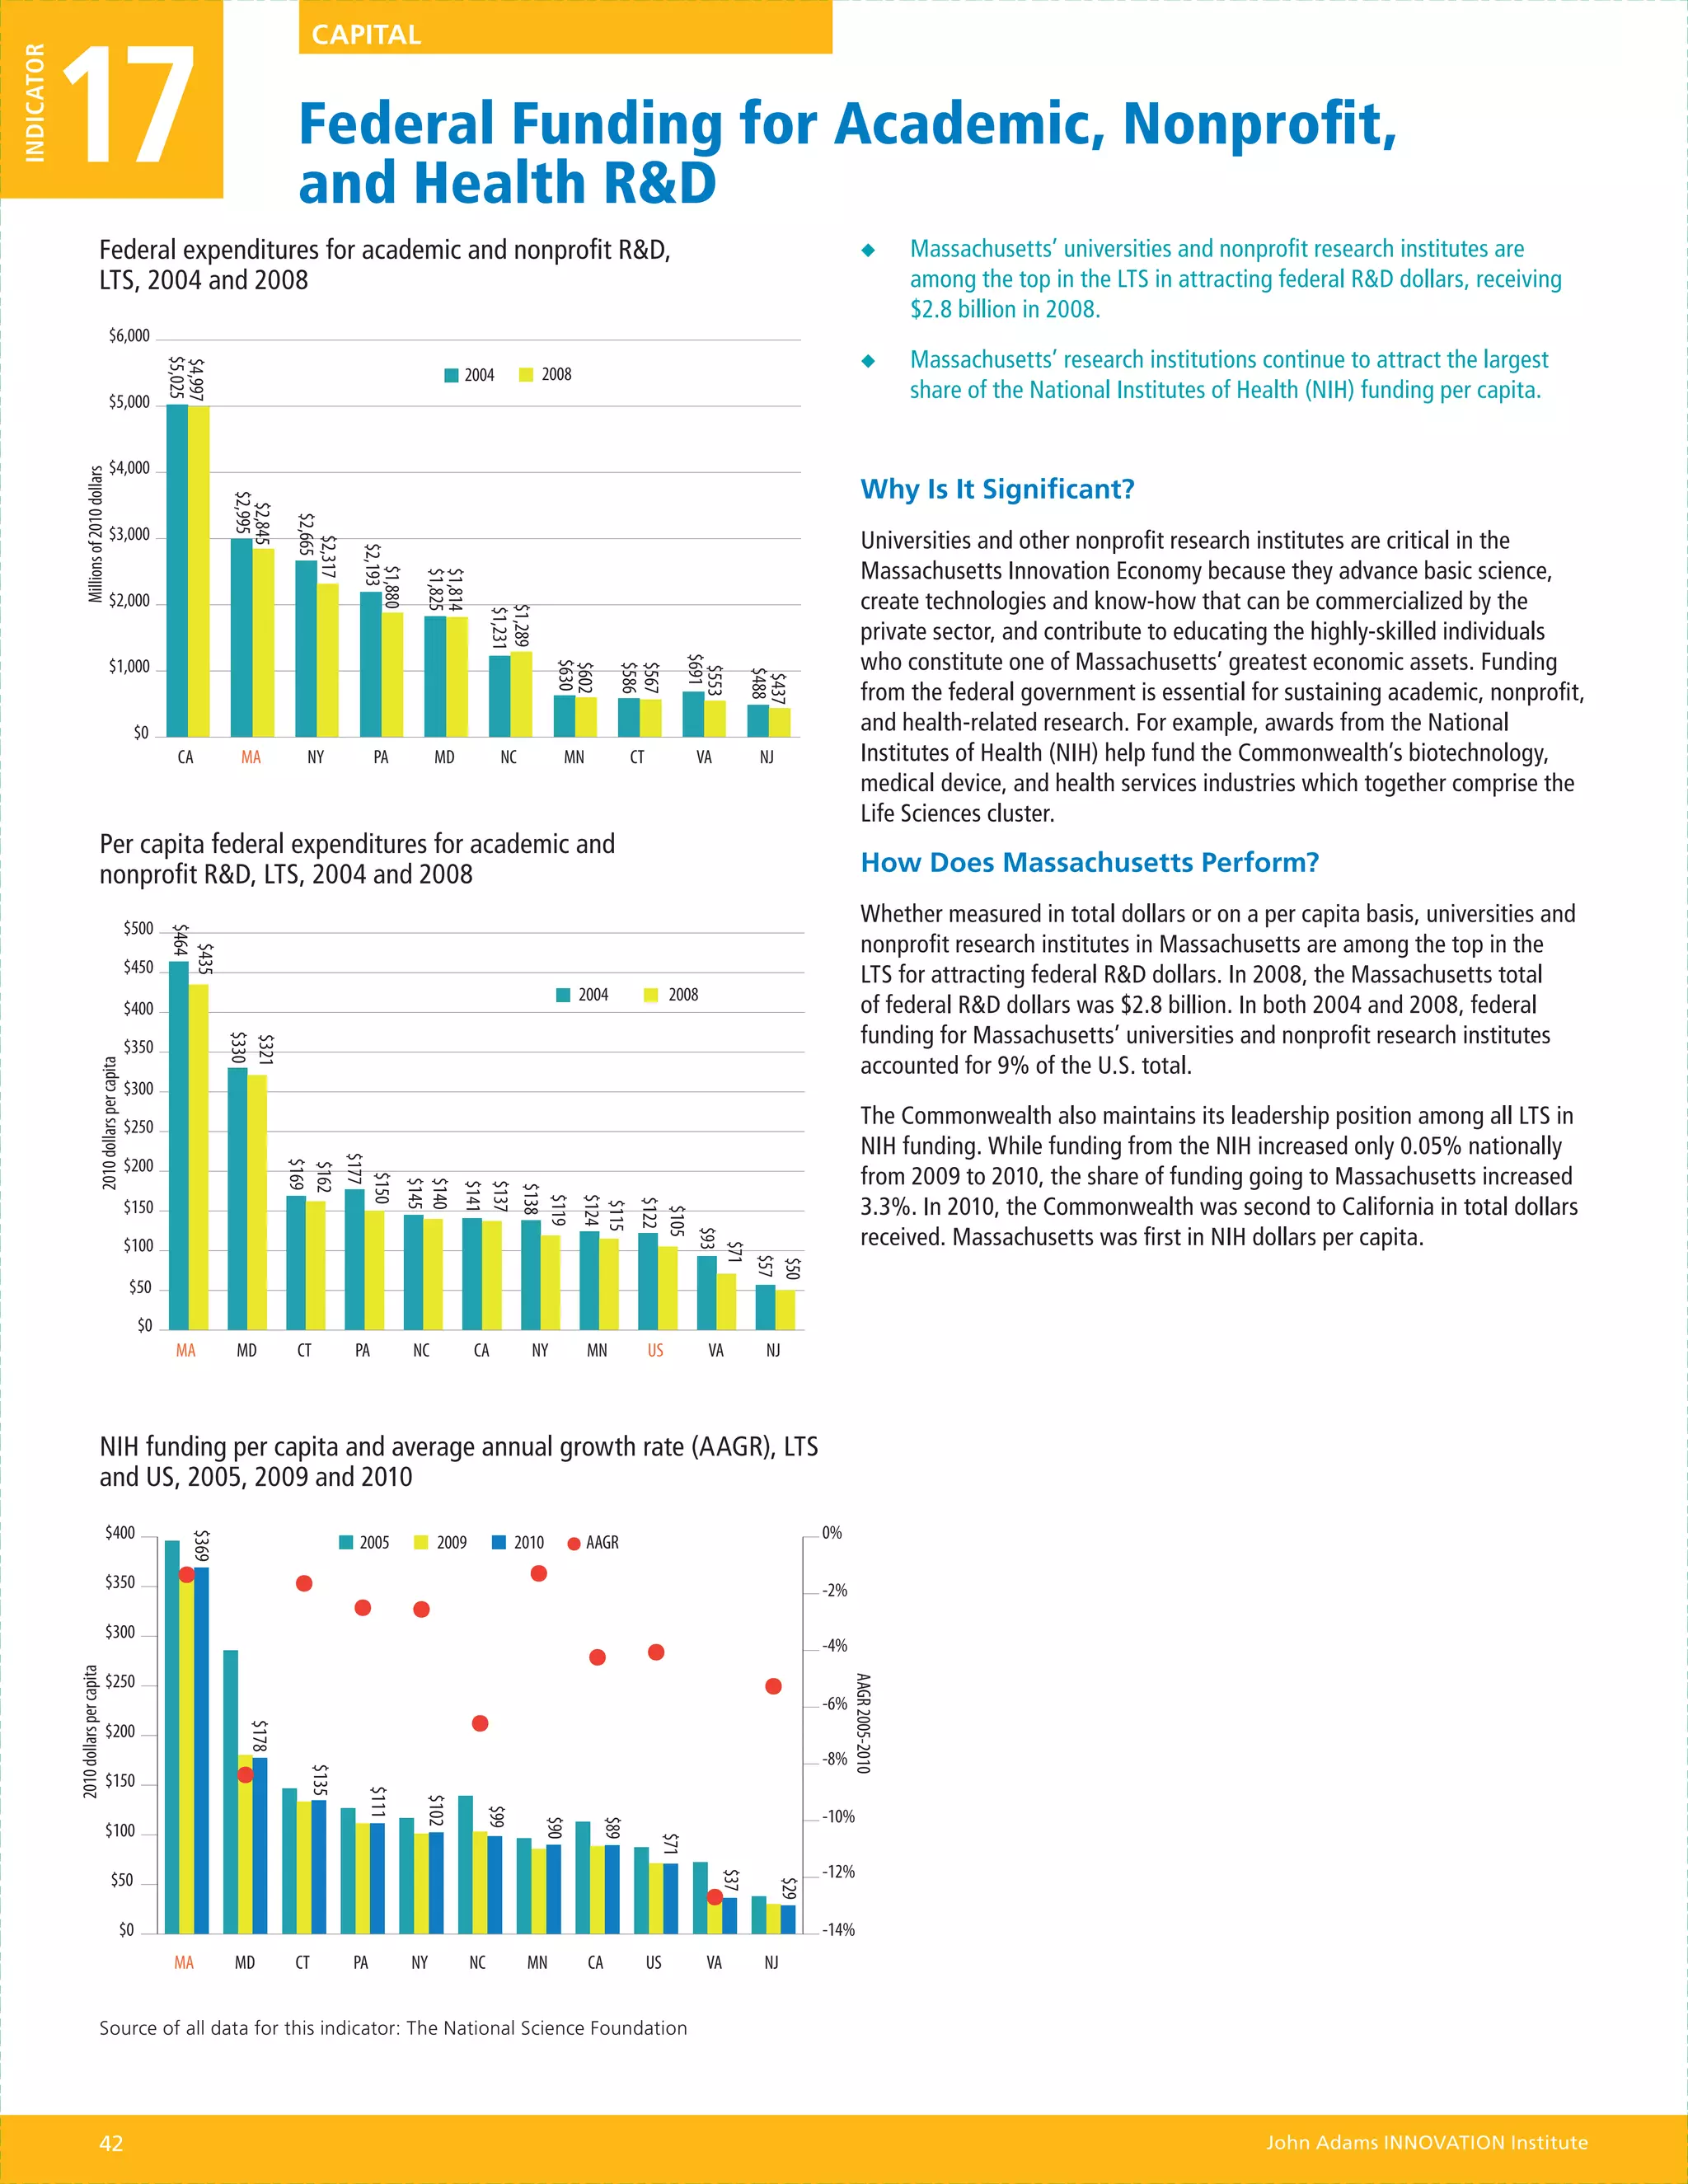
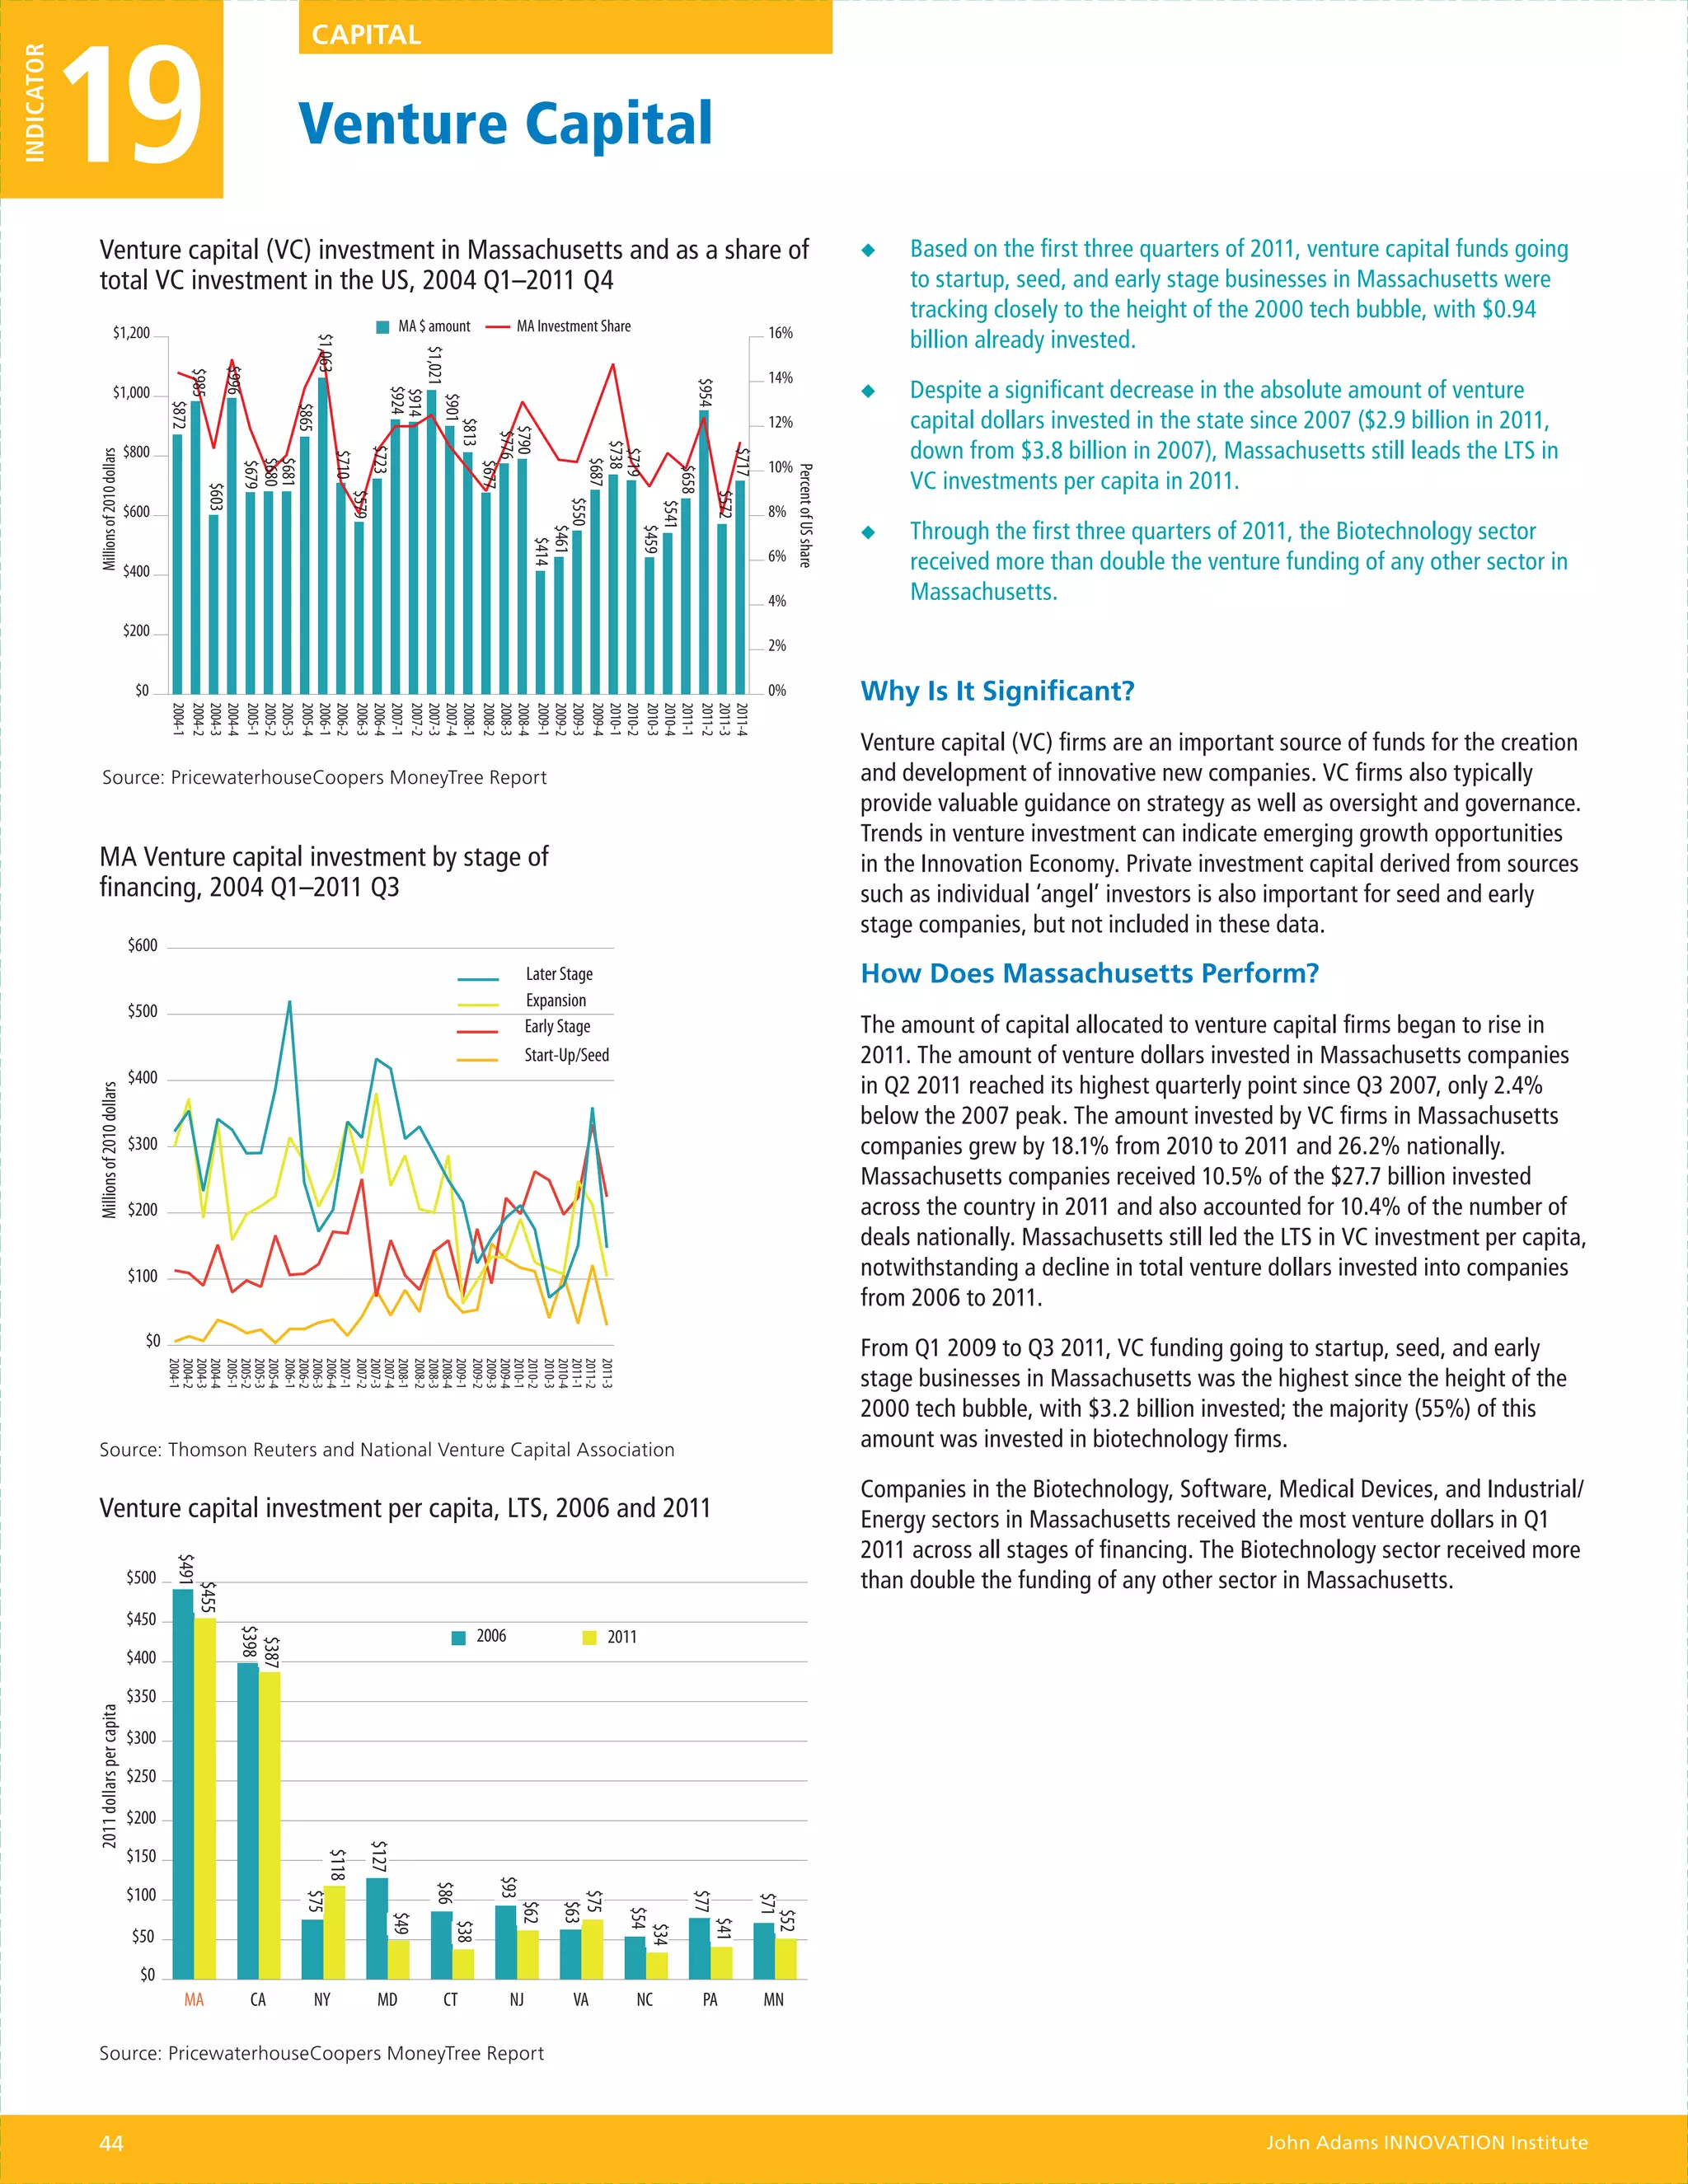
Massachusetts attracts billions of dollars of funding and world who chose to live, study, and work in the
every year for research, development, new business Commonwealth [Indicator #24]. Housing affordability
formation, and business expansion. The ability to influences Massachusetts’ ability to attract and retain
attract public funds sustains the unparalleled capacity talented individuals [Indicator #25].
of individuals and organizations in the state to engage
in the most cutting-edge and forward-looking research
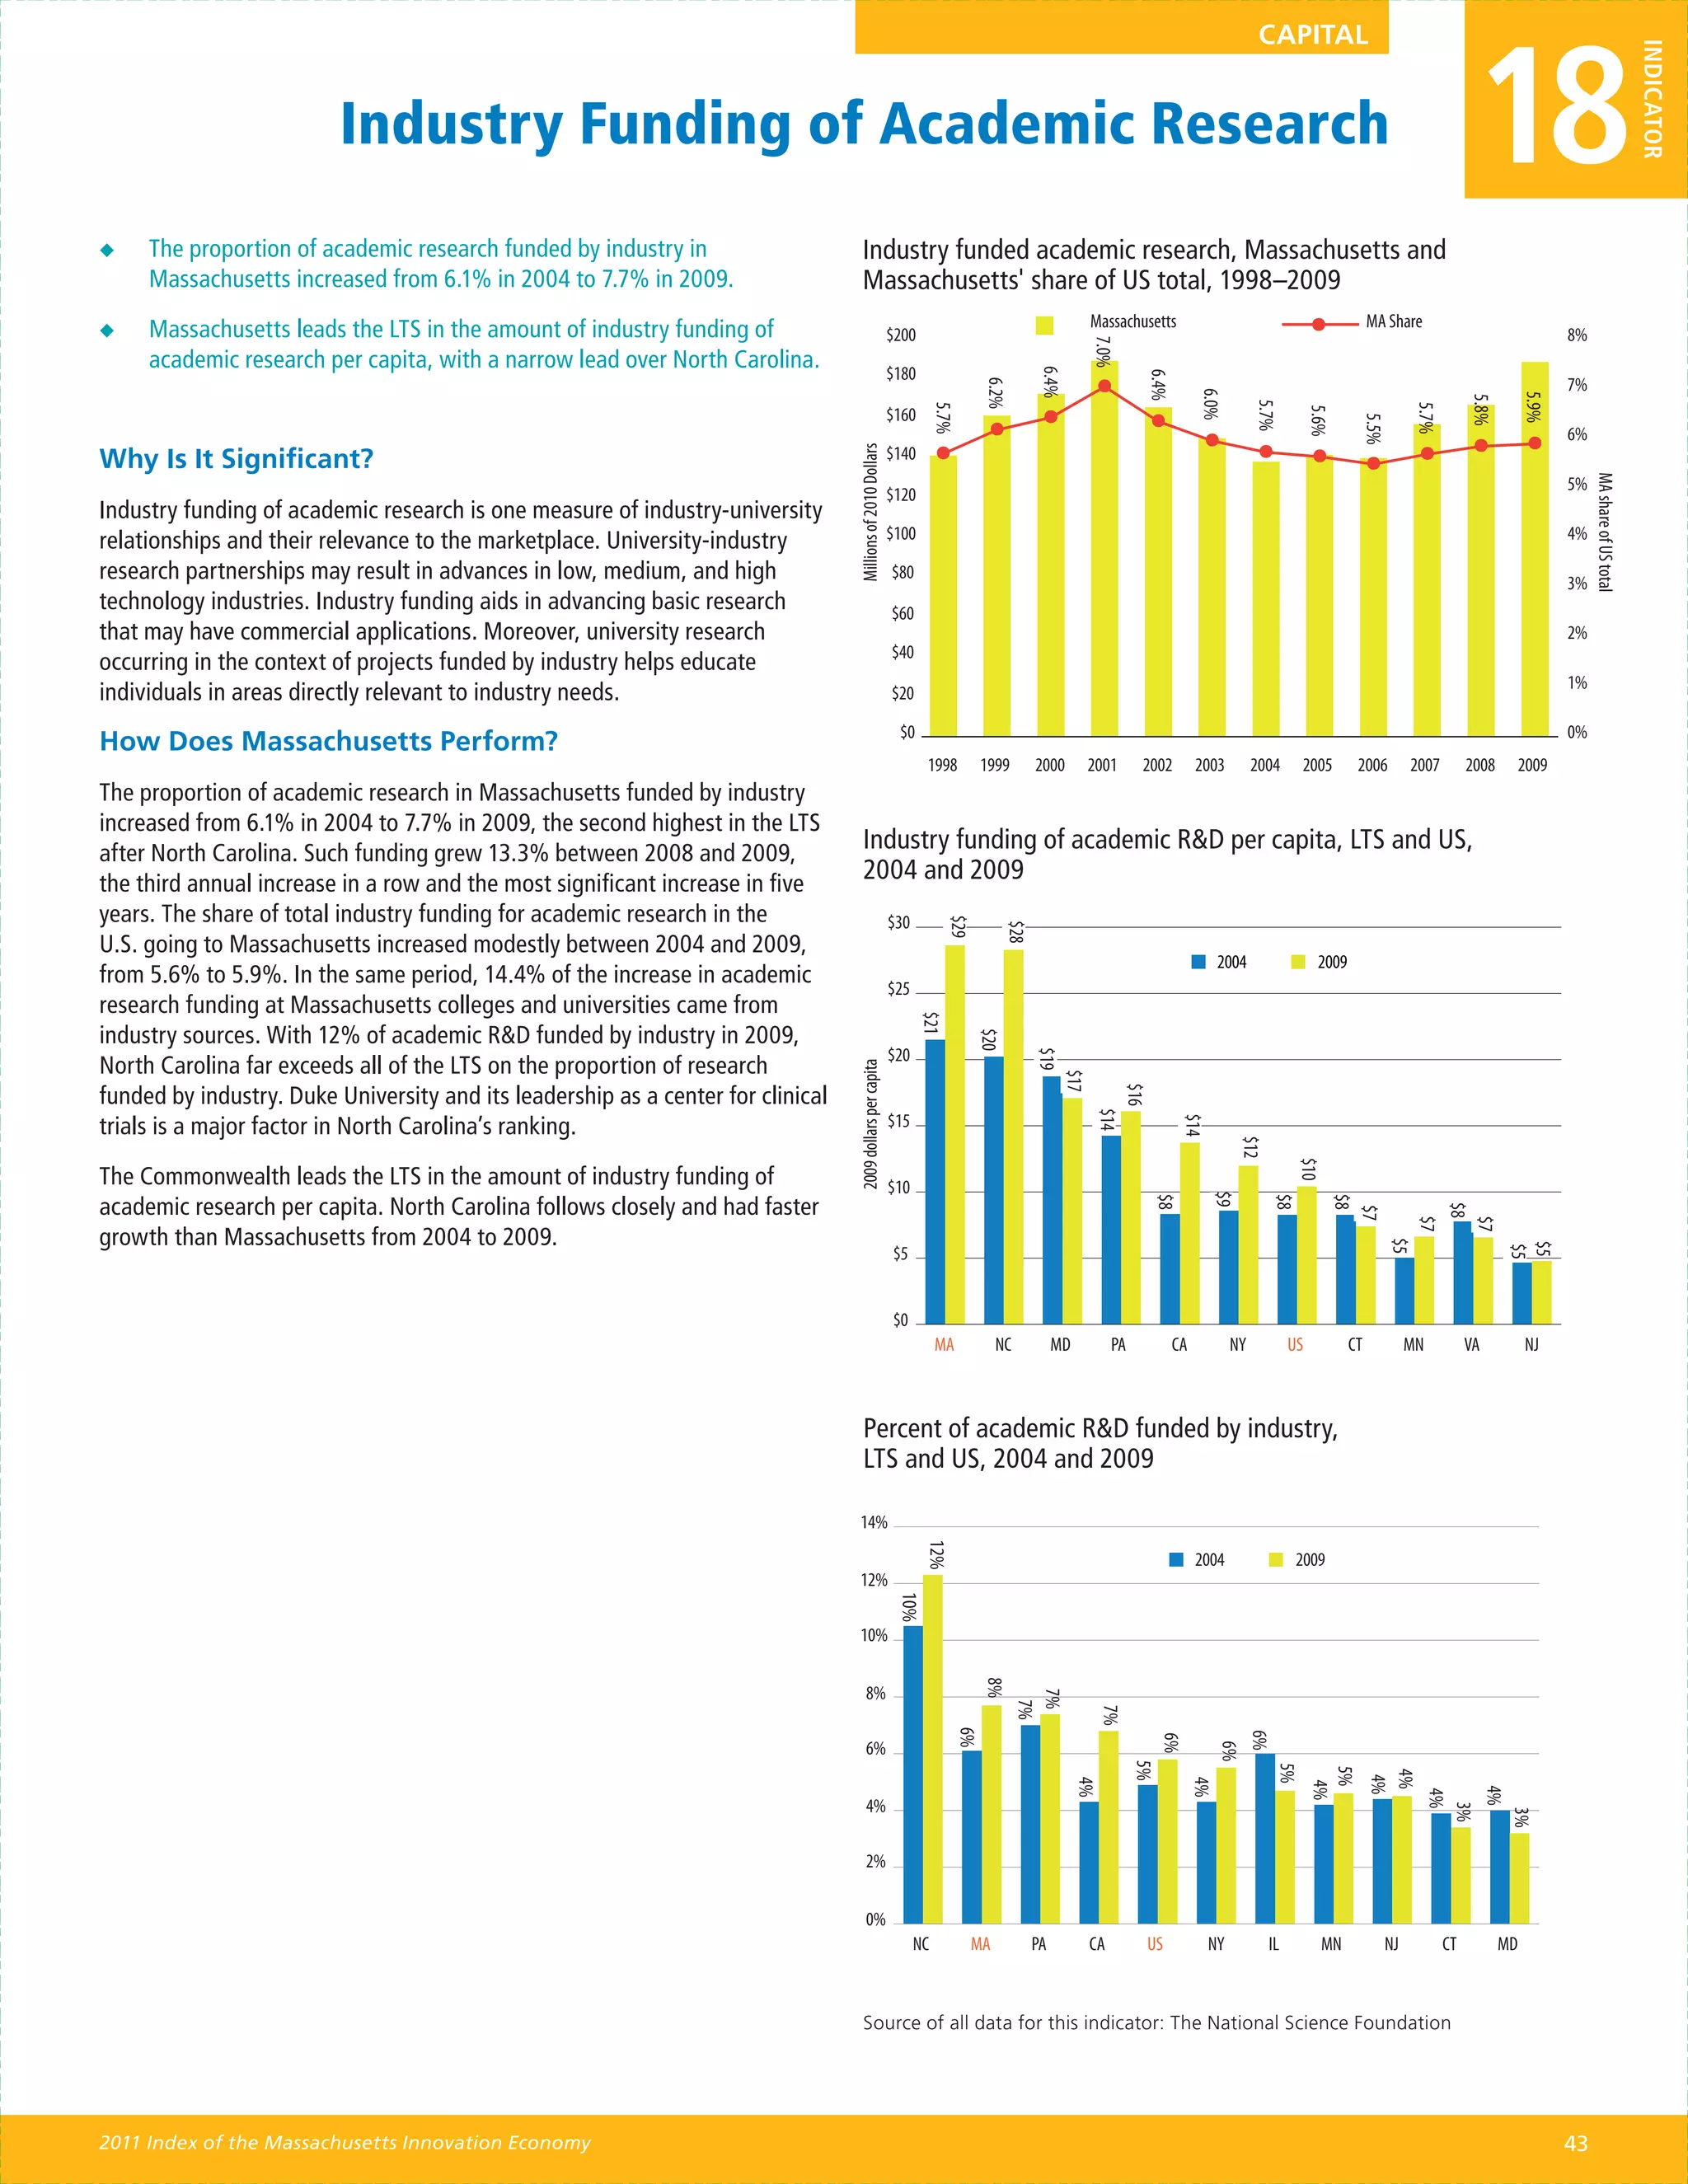
and development efforts [Indicator #17]. Universities
in Massachusetts benefit from industry’s desire to
remain at the cutting edge of research and product
development through university-industry interactions
[Indicator #18]. For new business formation and
expansion, Massachusetts’ concentration of venture
capitalists and angel investors is critical [Indicator #19].
2011 Index of the Massachusetts Innovation Economy 23](https://image.slidesharecdn.com/2011innovationindex-121025160440-phpapp02/75/MassTech-s-2011-Annual-Index-of-the-Innovation-Economy-24-2048.jpg)

![25
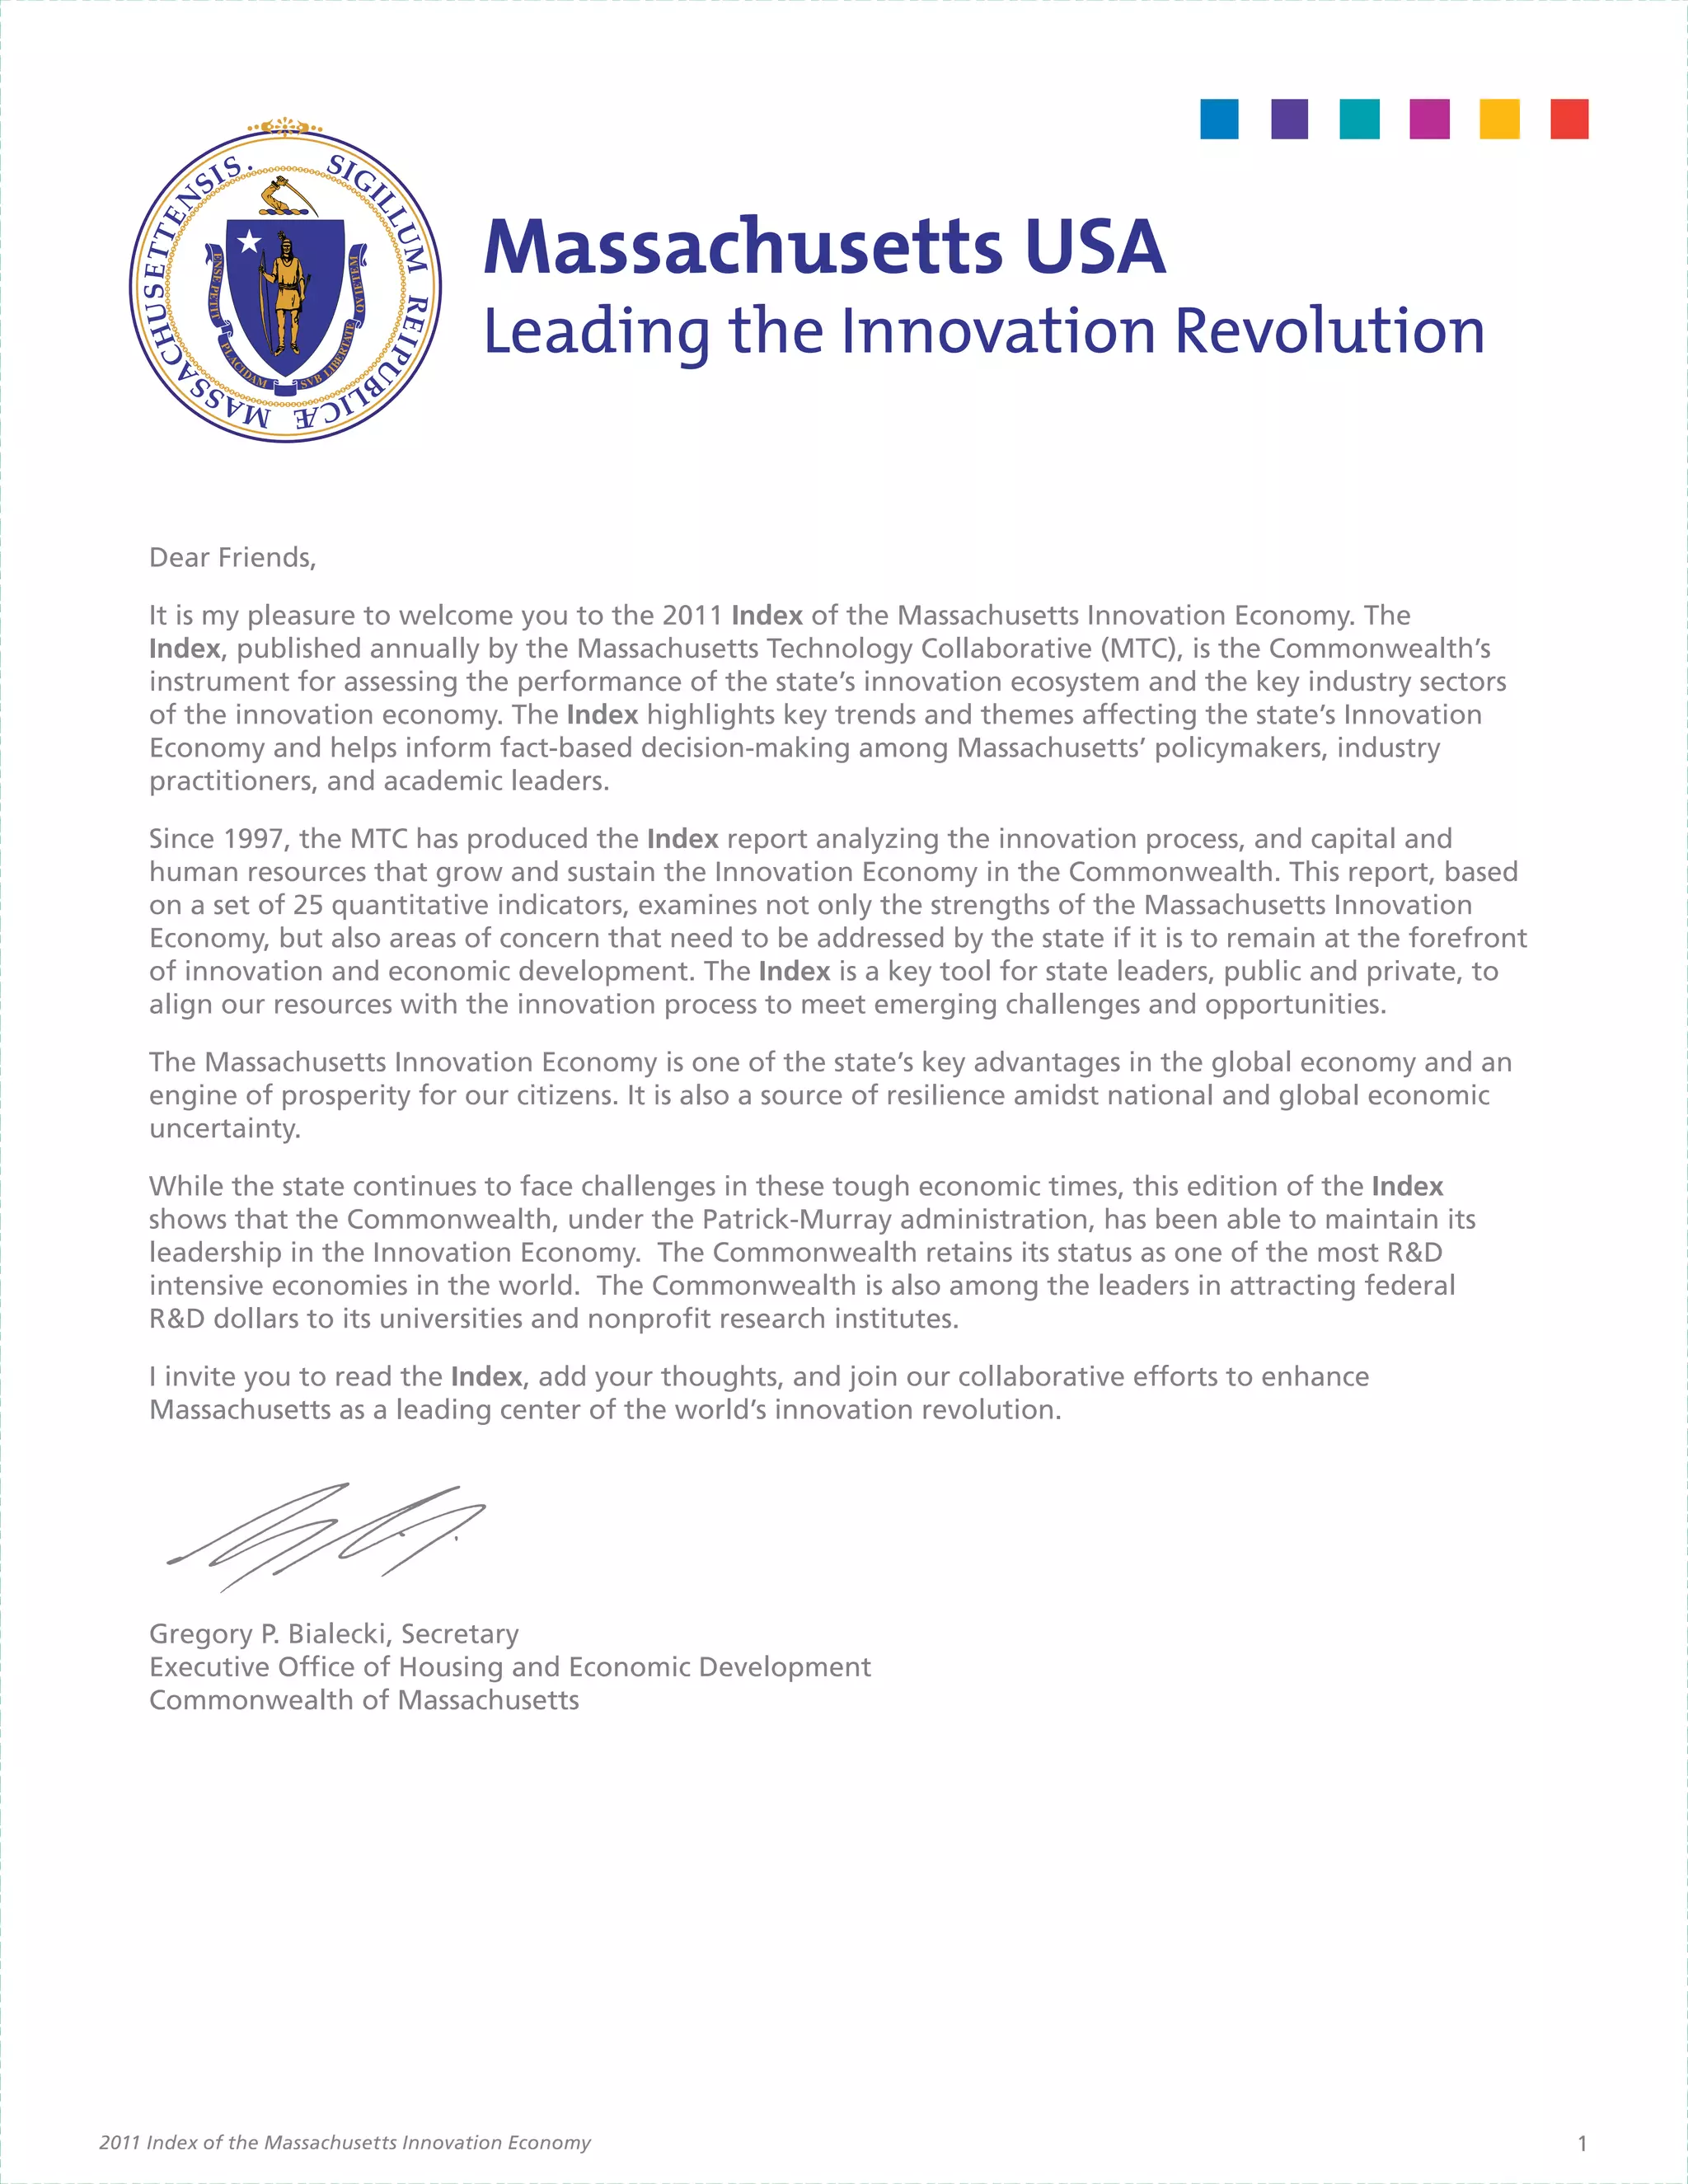
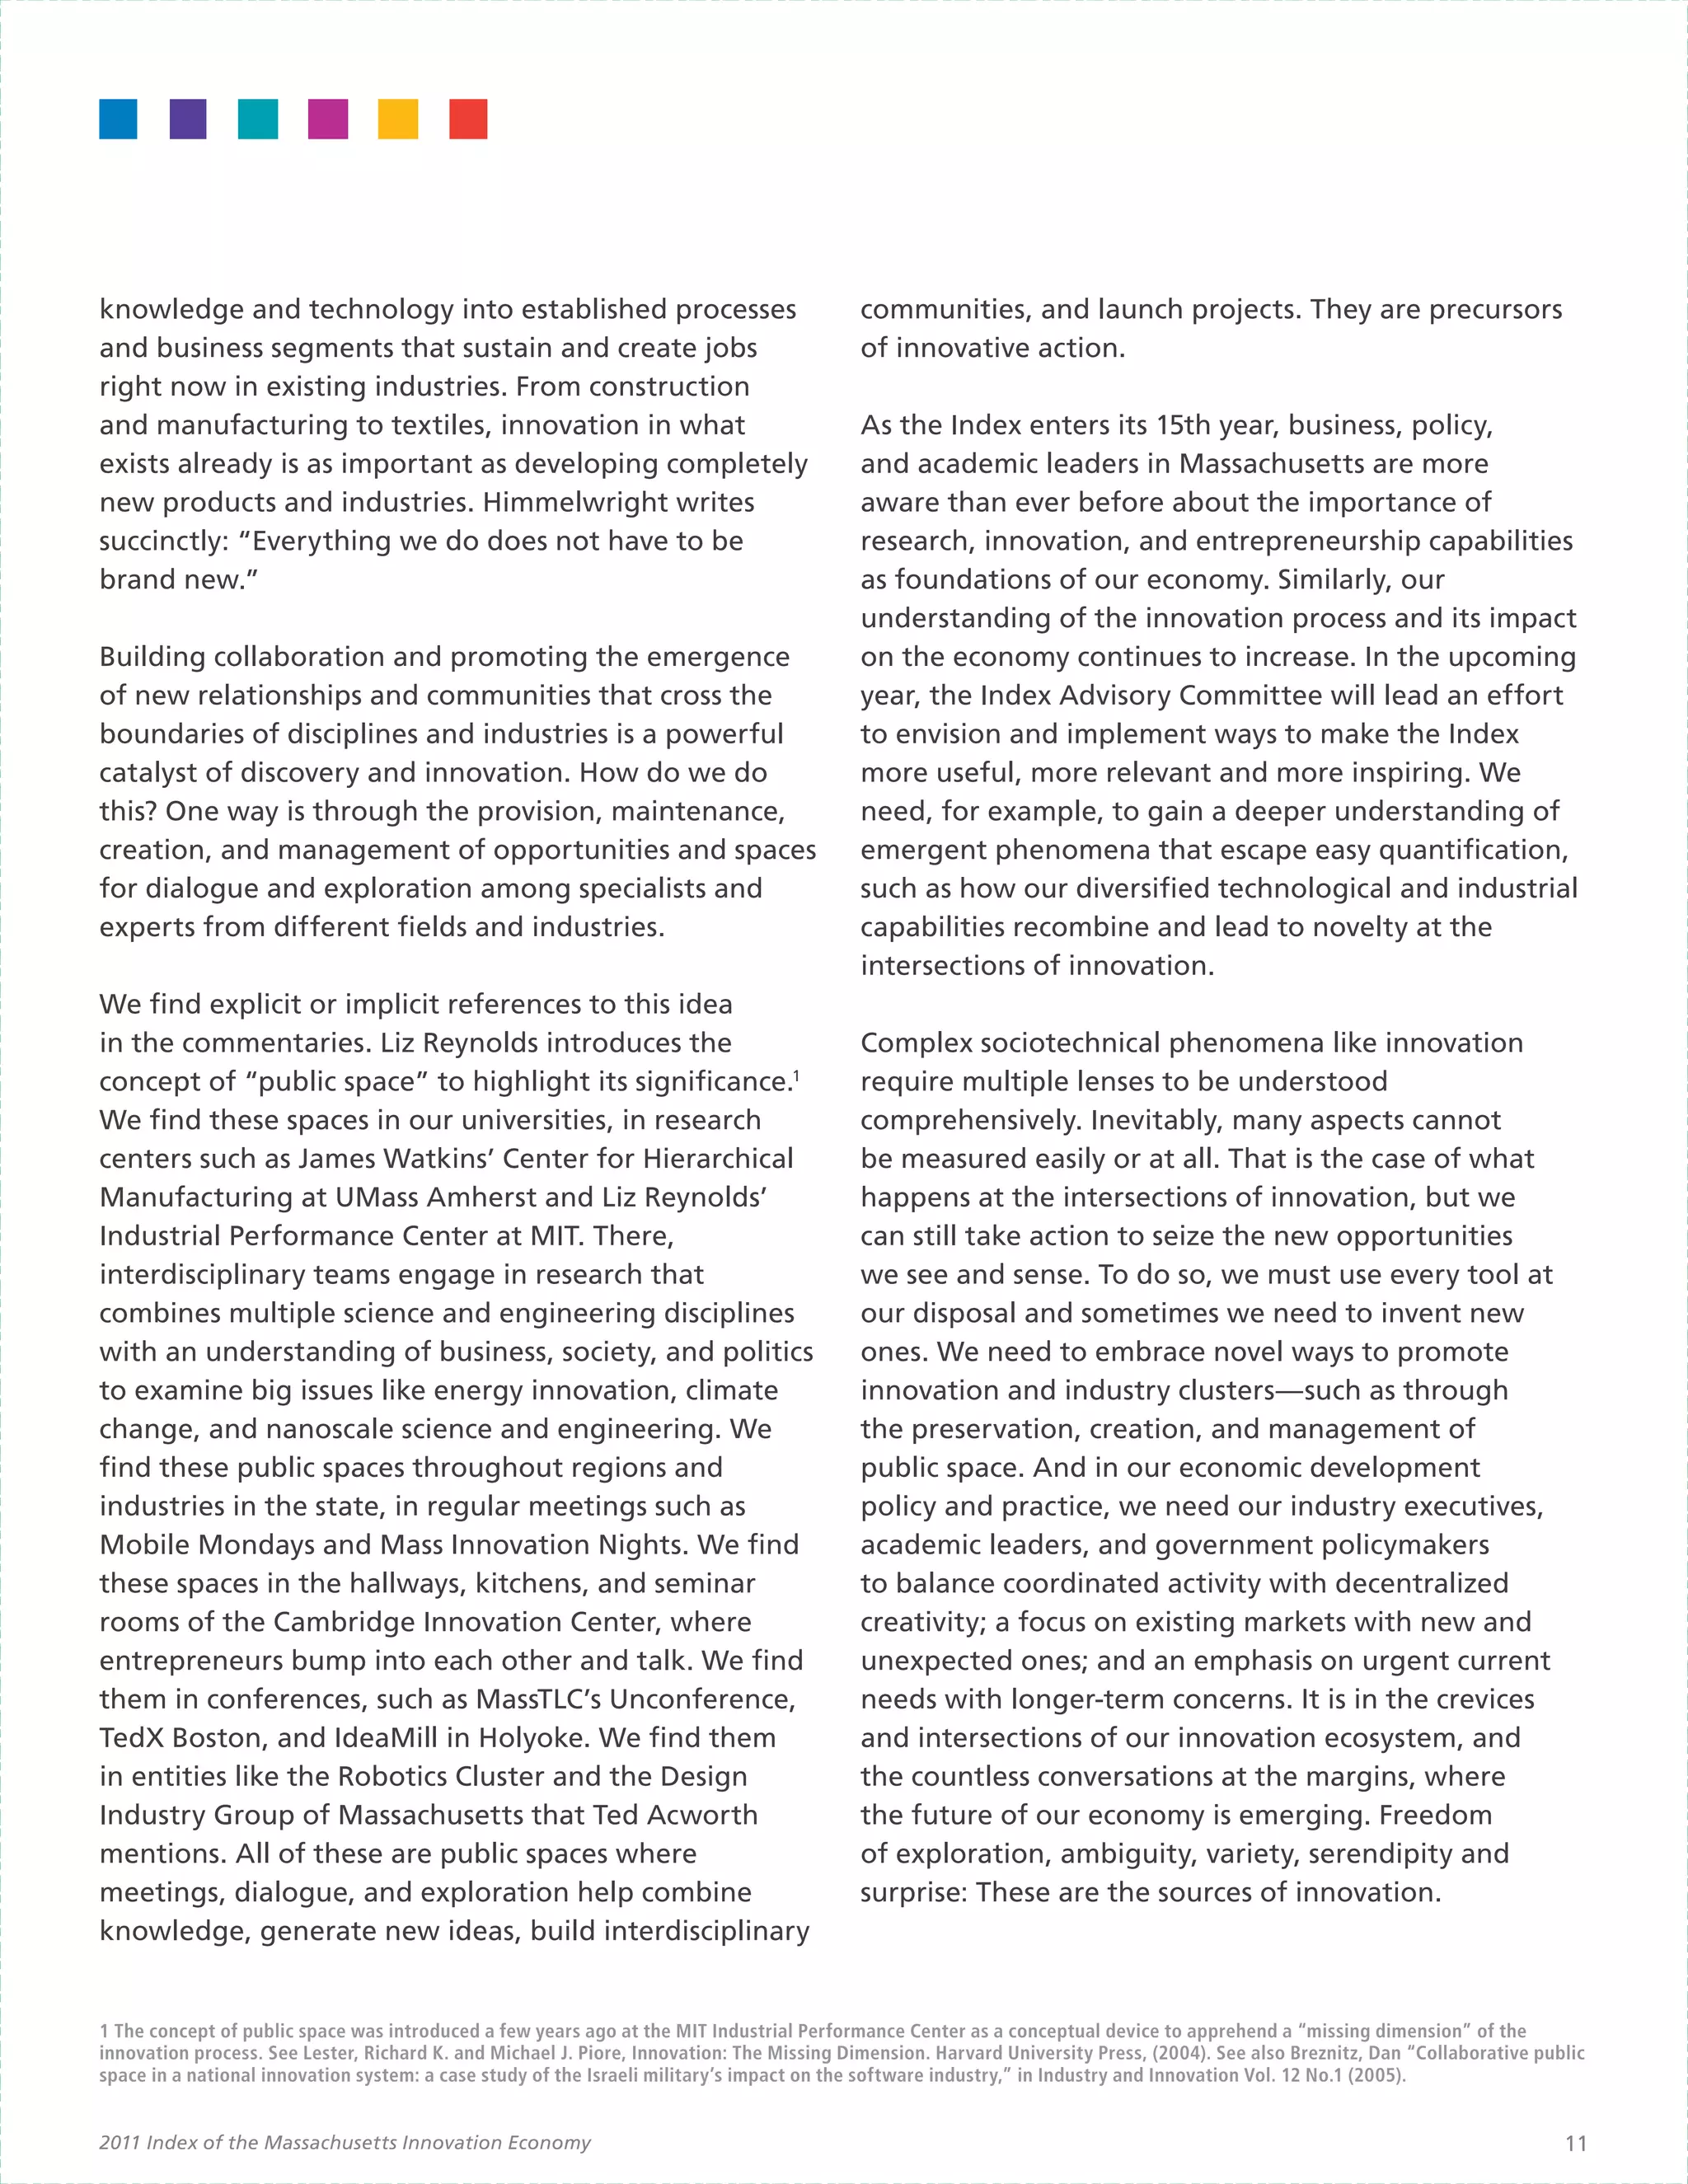
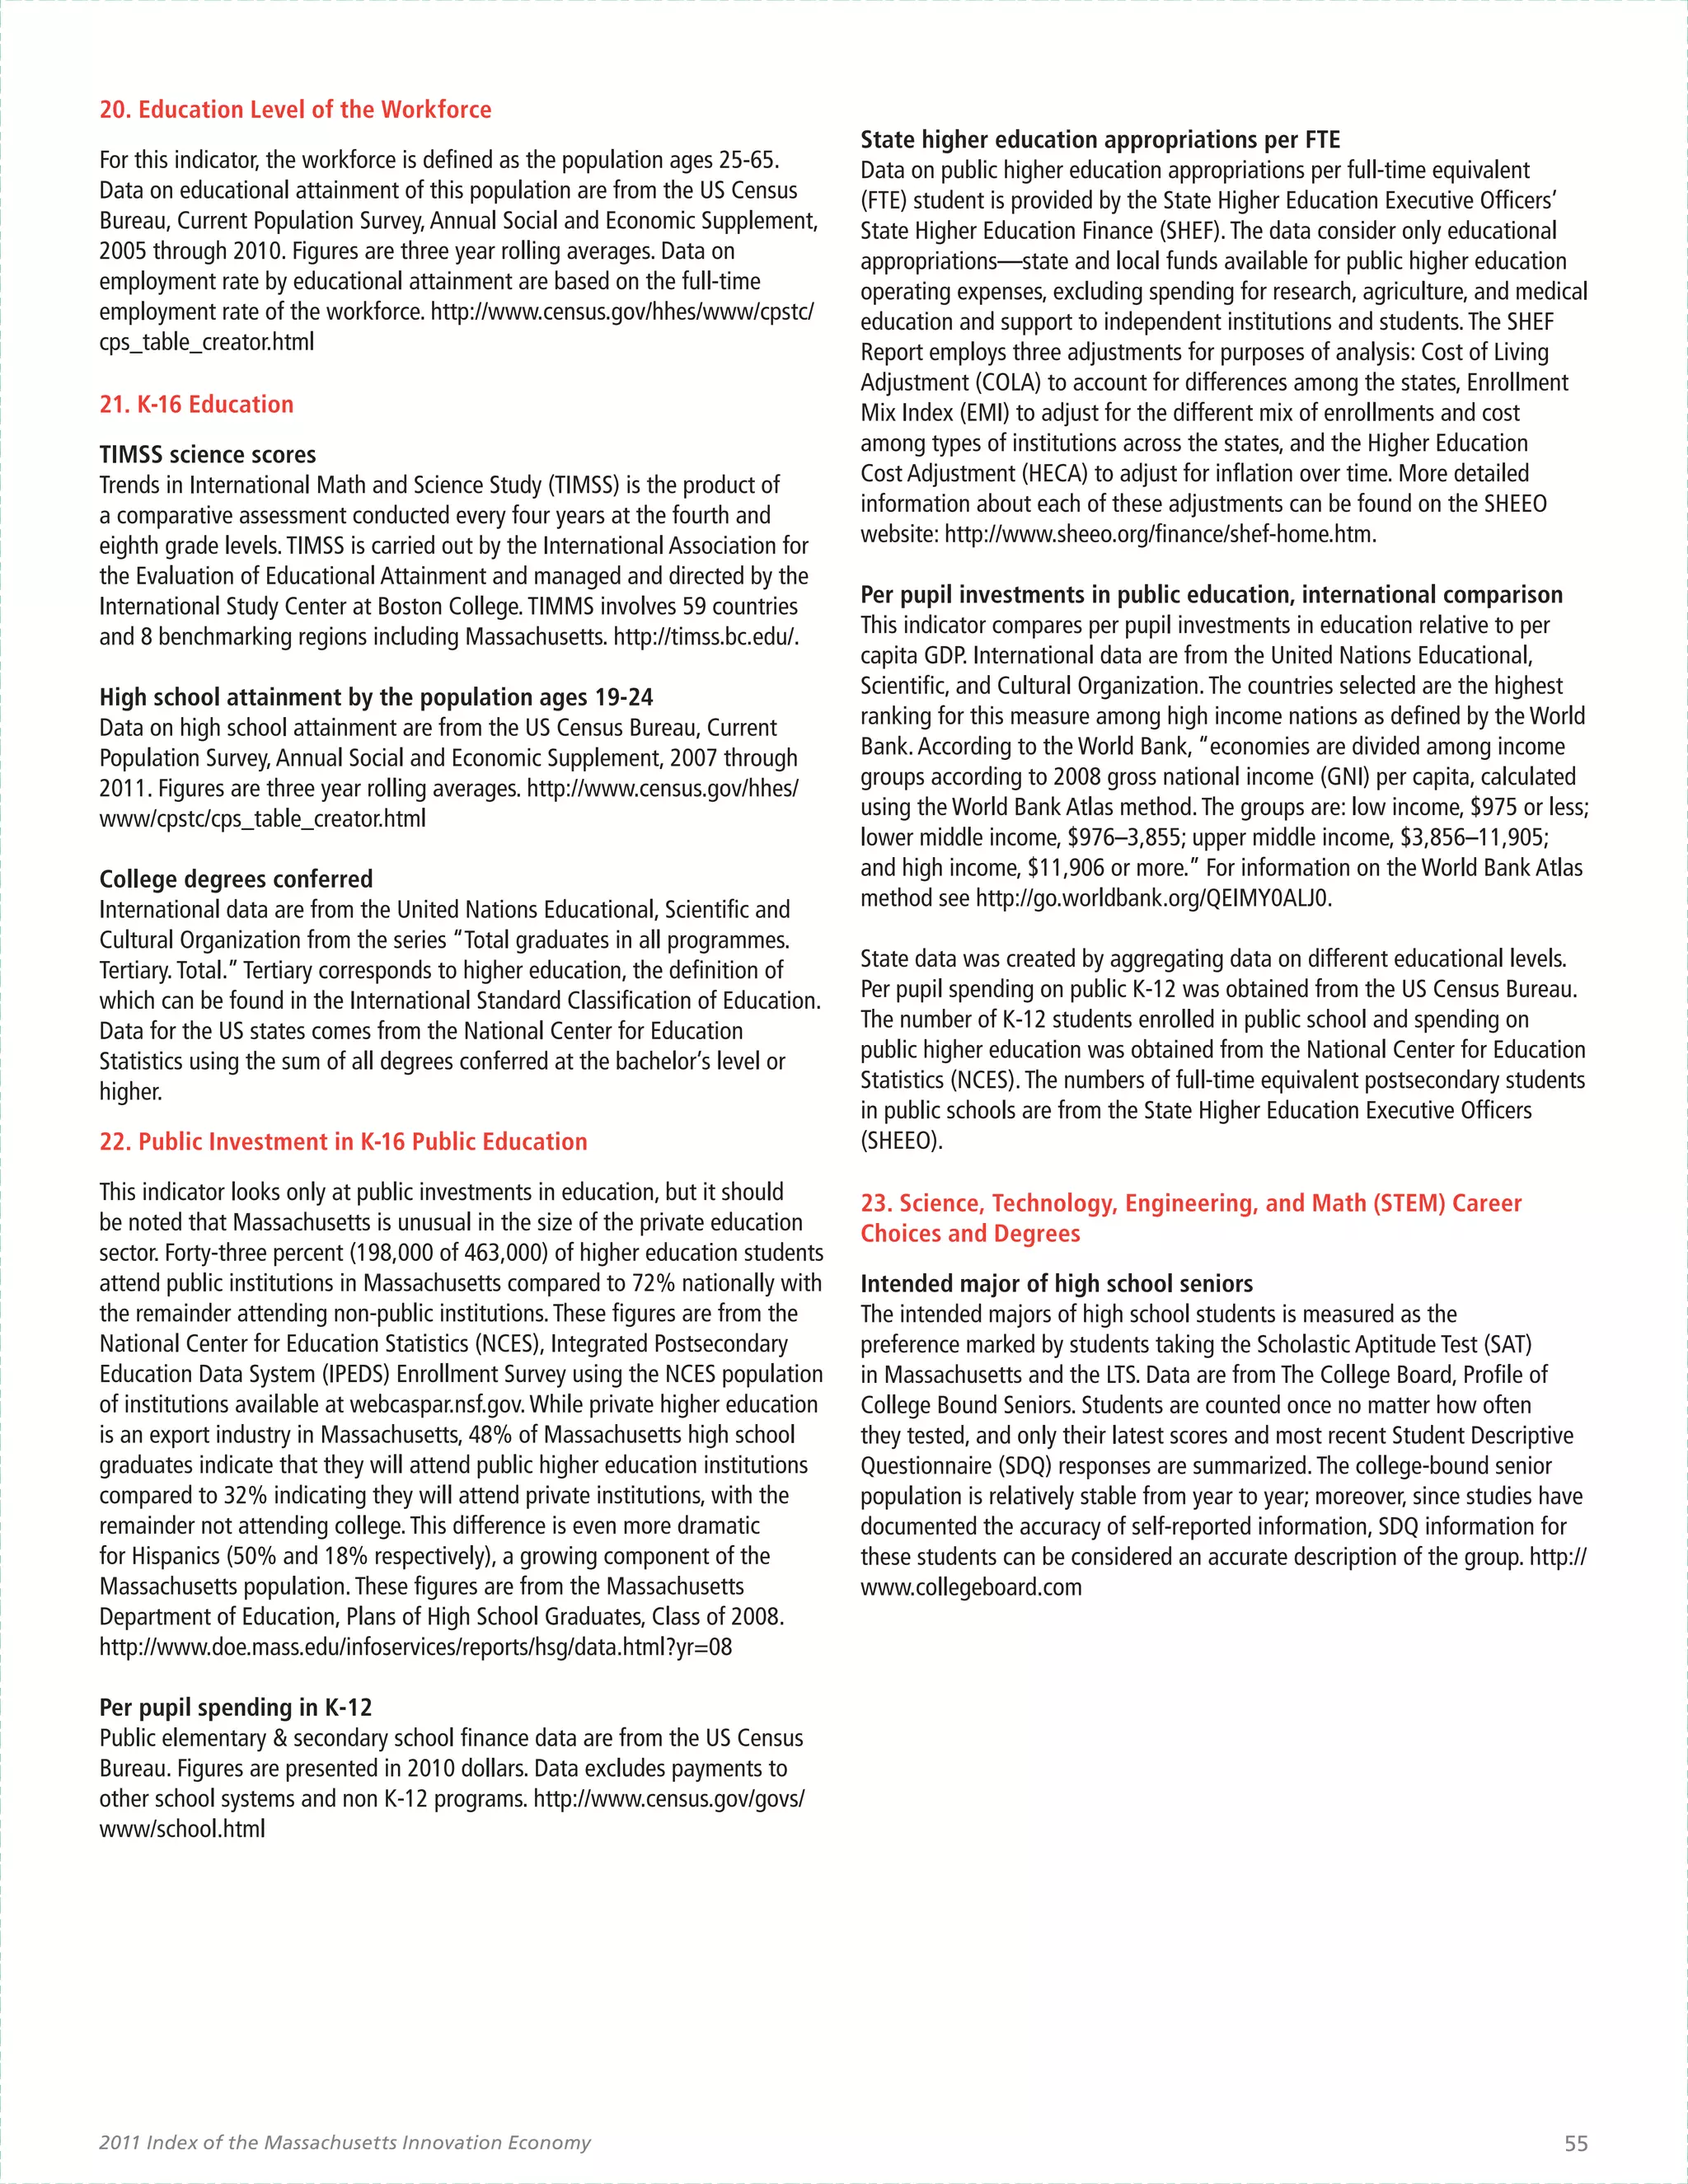
INDICATOR Talent
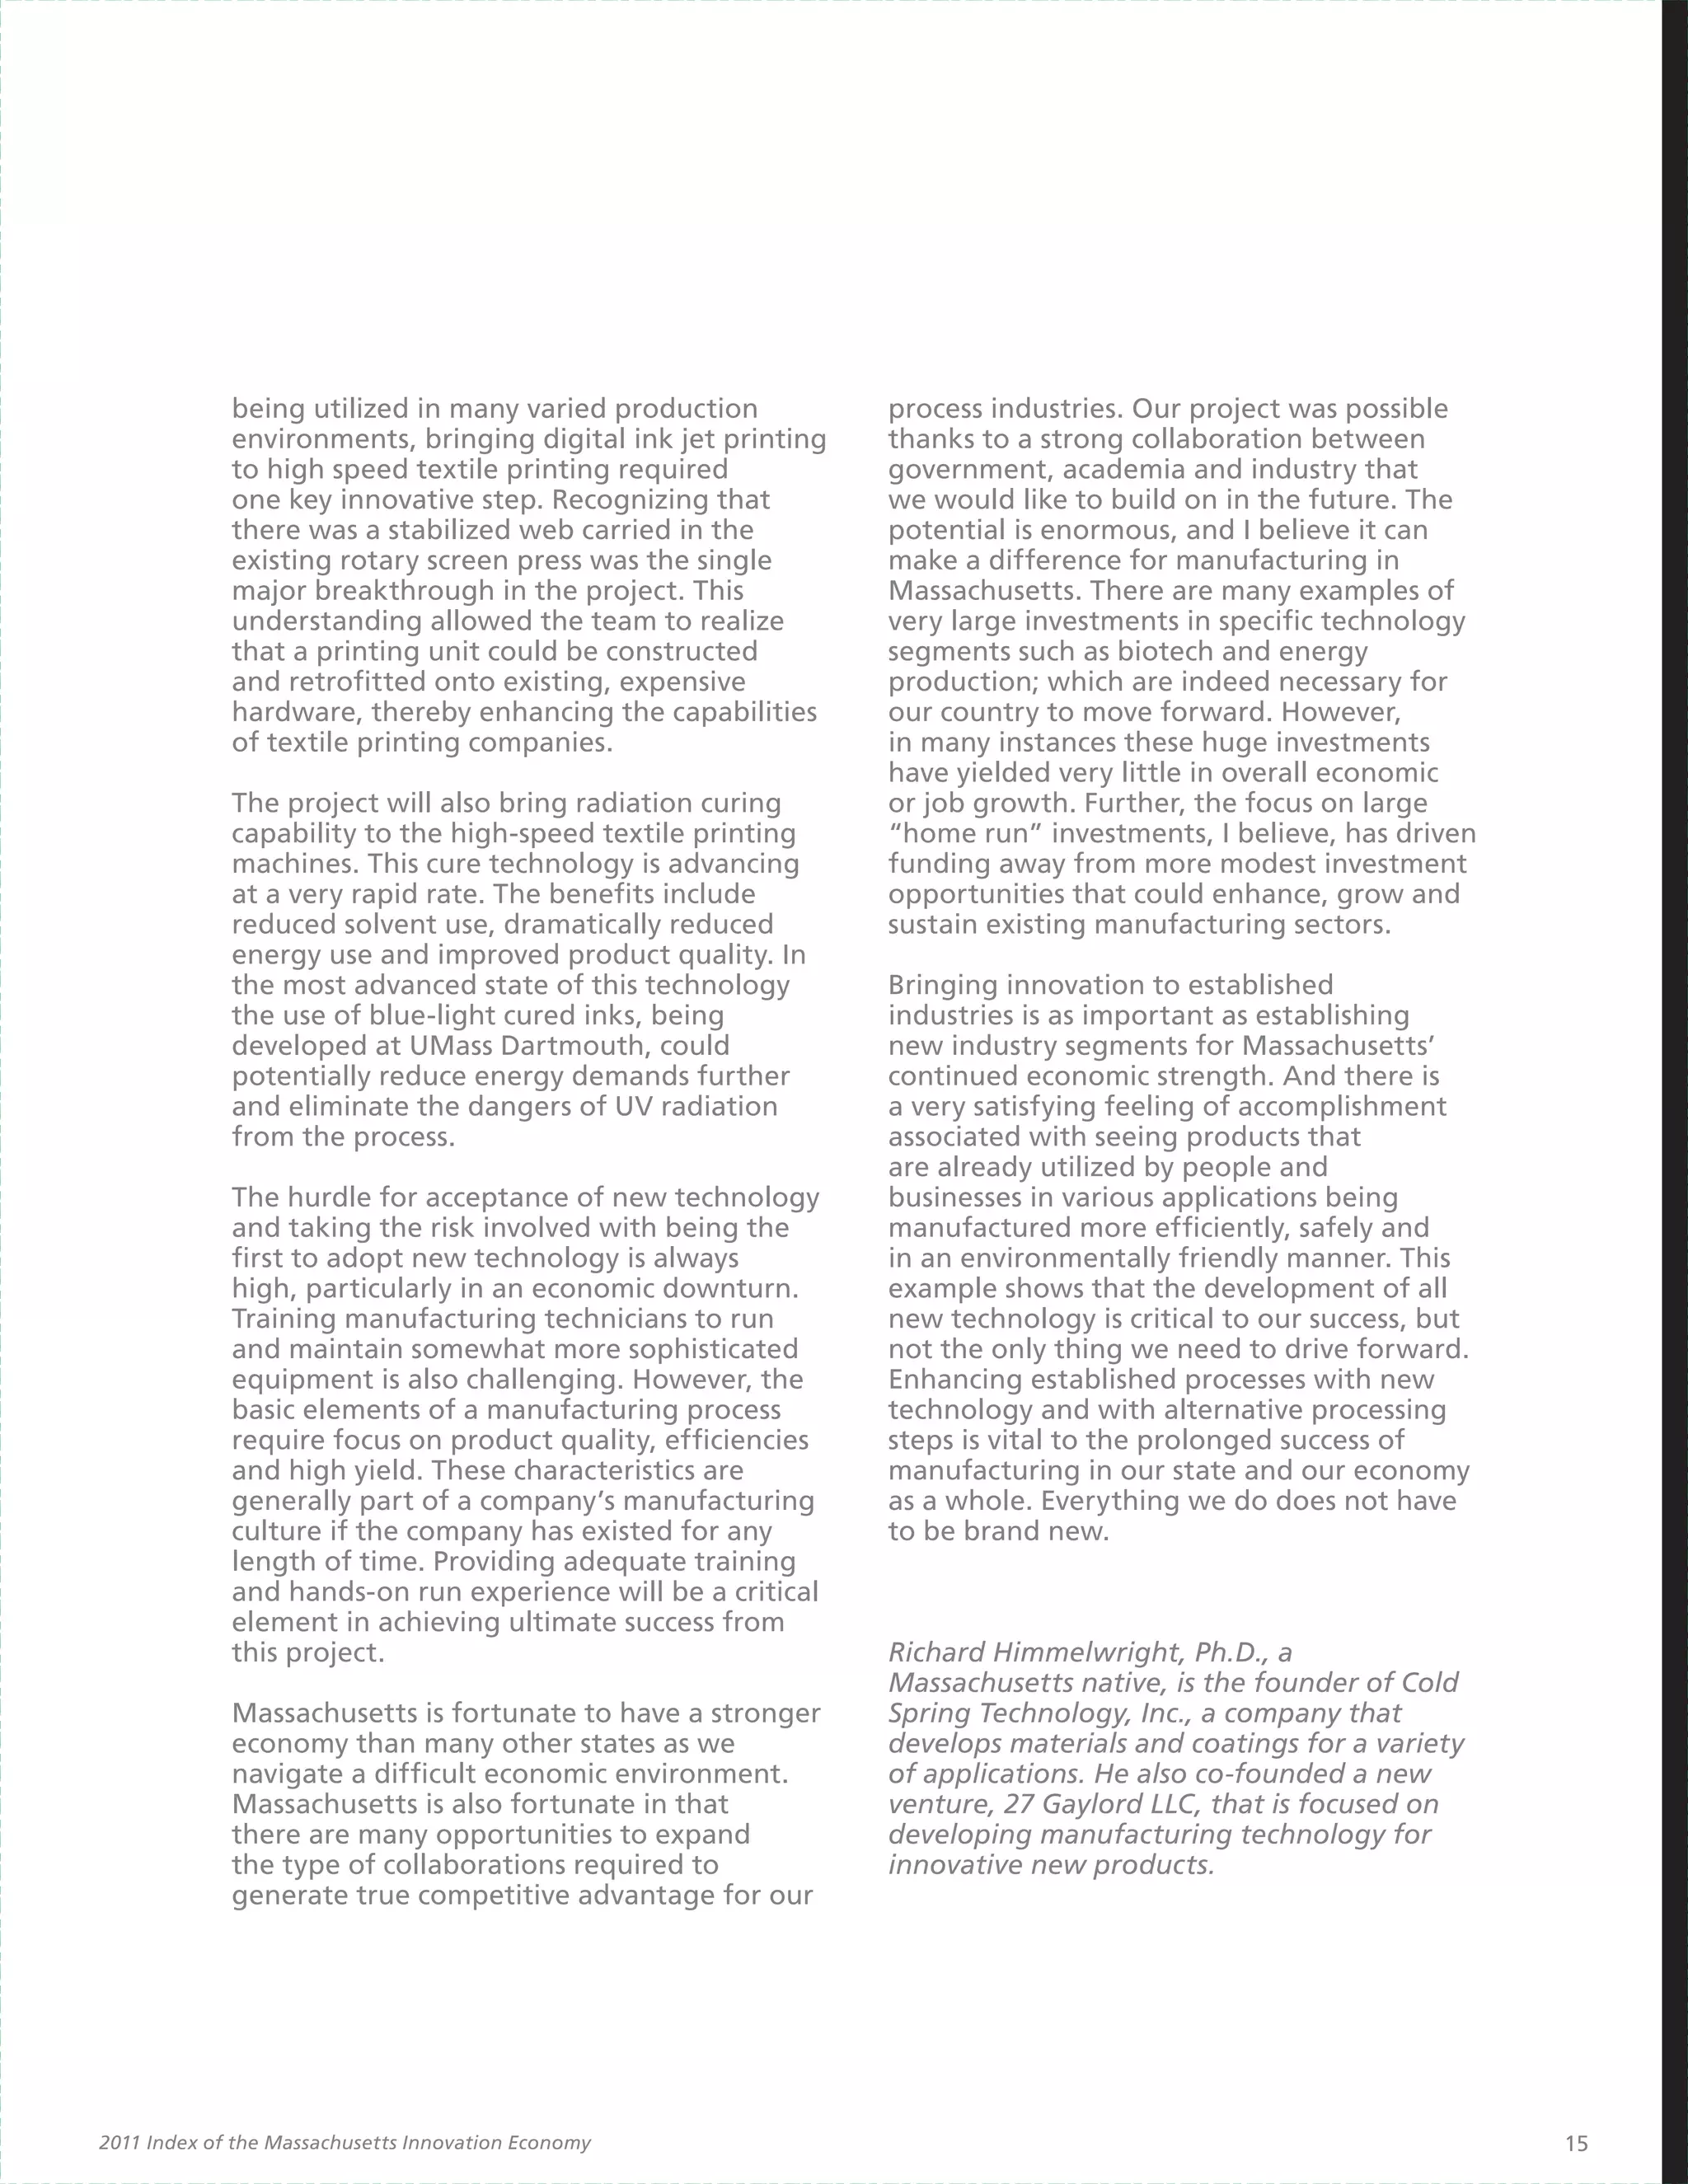
Housing Affordability
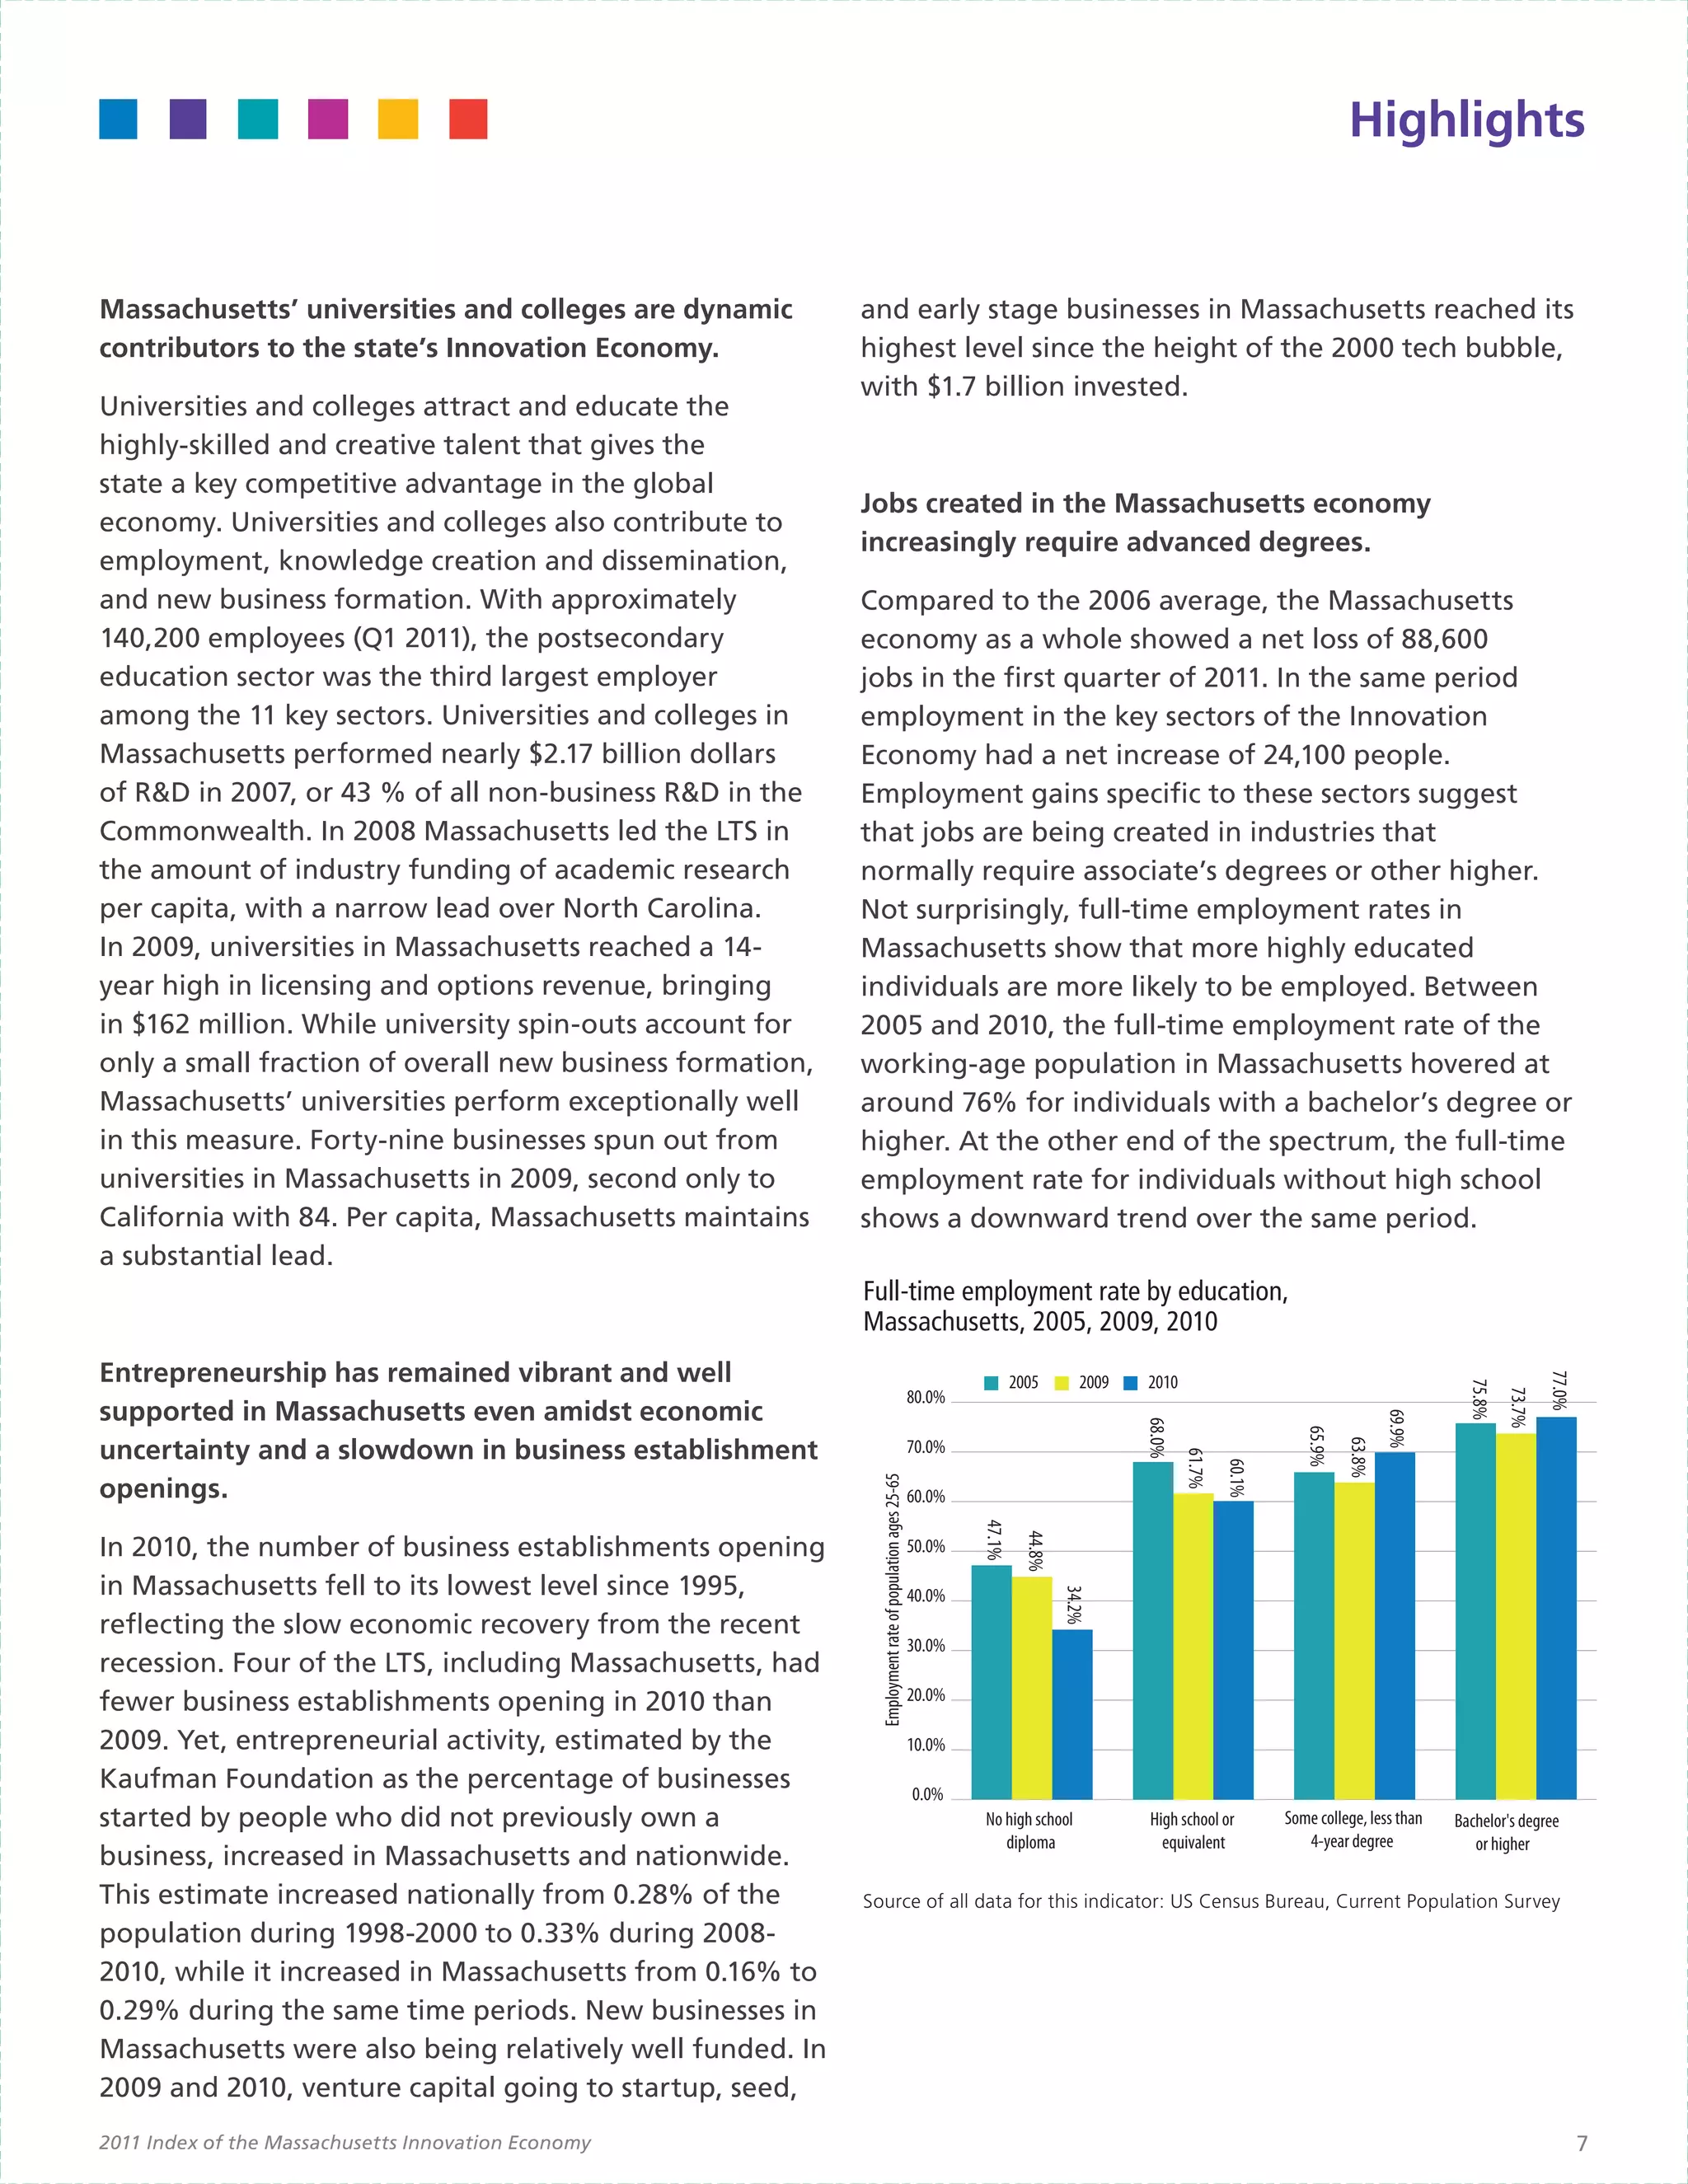
Households spending 30 percent or more of income on housing ◆◆ The number of renters and homeowners with mortgages spending
costs, LTS and US, 2010 more than 30% of income on housing costs in Massachusetts declined
slightly in 2010.
60% $80,000
Mortgage Renters Median Household Income, 2010
55% 54% $75,000 ◆◆ California and Massachusetts continue to have the highest median
51% 52% 51%
50% $70,000 home prices of the LTS, both of which were above $300,000 in Q2
49% 49%
50%
47% 47%
48%
47%
48% 2010.
46% $65,000
45%
$60,000
41% 41%
40% 39% $55,000
38% 38%
Why Is It Significant?
34% 35% $50,000
35% 33% 33%
$45,000 Assessments of ‘quality of life’, of which housing affordability is a major
30% component, influence Massachusetts’ ability to attract and retain talented
$40,000
25% people. Also, a lack of affordable housing for essential service providers
$35,000
and entry-level workers can deter individuals from moving to the area, thus
20% $30,000 slowing business’ ability to fill open positions and fuel expansion in the
US CA NJ CT NY NC MA MD VA MN PA
region. Spending 30% or more of income on housing costs is a common
Source: US Census Bureau, American Community Survey threshold for measuring housing affordability.
How does Massachusetts Perform?
Massachusetts, like the rest of the nation, has experienced housing price
deflation over the last five years, reversing a trend, beginning in 2000,
Housing price index, Massachusetts and low to high in which housing cost increases drastically outpaced income growth. In
range for LTS, 1992 - 2011 2011, median prices in Massachusetts are hovering around $300,000 after
peaking at over $350,000 in 2005. While this represents more than a 15%
30% decline, median home prices decreased nationally by more than 23% from
over $223,000 in 2006 to around $180,000 in 2010. [The data series used
Percent change from same quarter of prior year
20% for this analysis was produced in connection with an ad hoc publication.
10% While the Federal Housing Finance Agency (FHFA) may produce such a
series in the future, there are no specific plans at the moment.]
0%
-10% Coupled with housing price declines, more homeowners with mortgages
MA Low to high range for LTS in Massachusetts have housing costs that are considered affordable than
-20%
in 2009. The number of homeowners with mortgages requiring more than
-30% 30% of income declined slightly for a second year in a row 2009 to 2010
2011
1992
1994
1996
1998
2000
2002
2004
2006
2008
2010
from 40% to 39%. This contrasts with the rest of the nation as national
mortgage affordability has remained static for four years beginning in
2007. For renters, conditions across the nation also failed to improve for the
Source: Federal Housing Finance Agency
third continuous year as the percent of renters spending more than 30% of
their income on housing increased from 48% in 2009 to 49% in 2010. This
measure increased in Massachusetts from 46% in 2009 to 48% in 2010.
Housing affordability trends for renters and home owners with California continues to maintain its status as the least affordable of the
mortgages, Massachusetts and US, 2006-2010 LTS, with the highest percent of both renters and mortgaged homeowners
spending more than 30% of monthly income on housing (54% and 51%
50% respectively). California also has the highest median house price as of Q2
Households spending 30 percent or more of income on housing costs
2010 at just over $330,000.
45% MA Renters
40%
US Renters
35%
30% MA Mortgaged Home Owners
25%
US Mortgaged Home Owners
20%
15%
10%
2006 2007 2008 2009 2010
Source: US Census Bureau, American Community Survey
50 John Adams INNOVATION Institute](https://image.slidesharecdn.com/2011innovationindex-121025160440-phpapp02/75/MassTech-s-2011-Annual-Index-of-the-Innovation-Economy-51-2048.jpg)
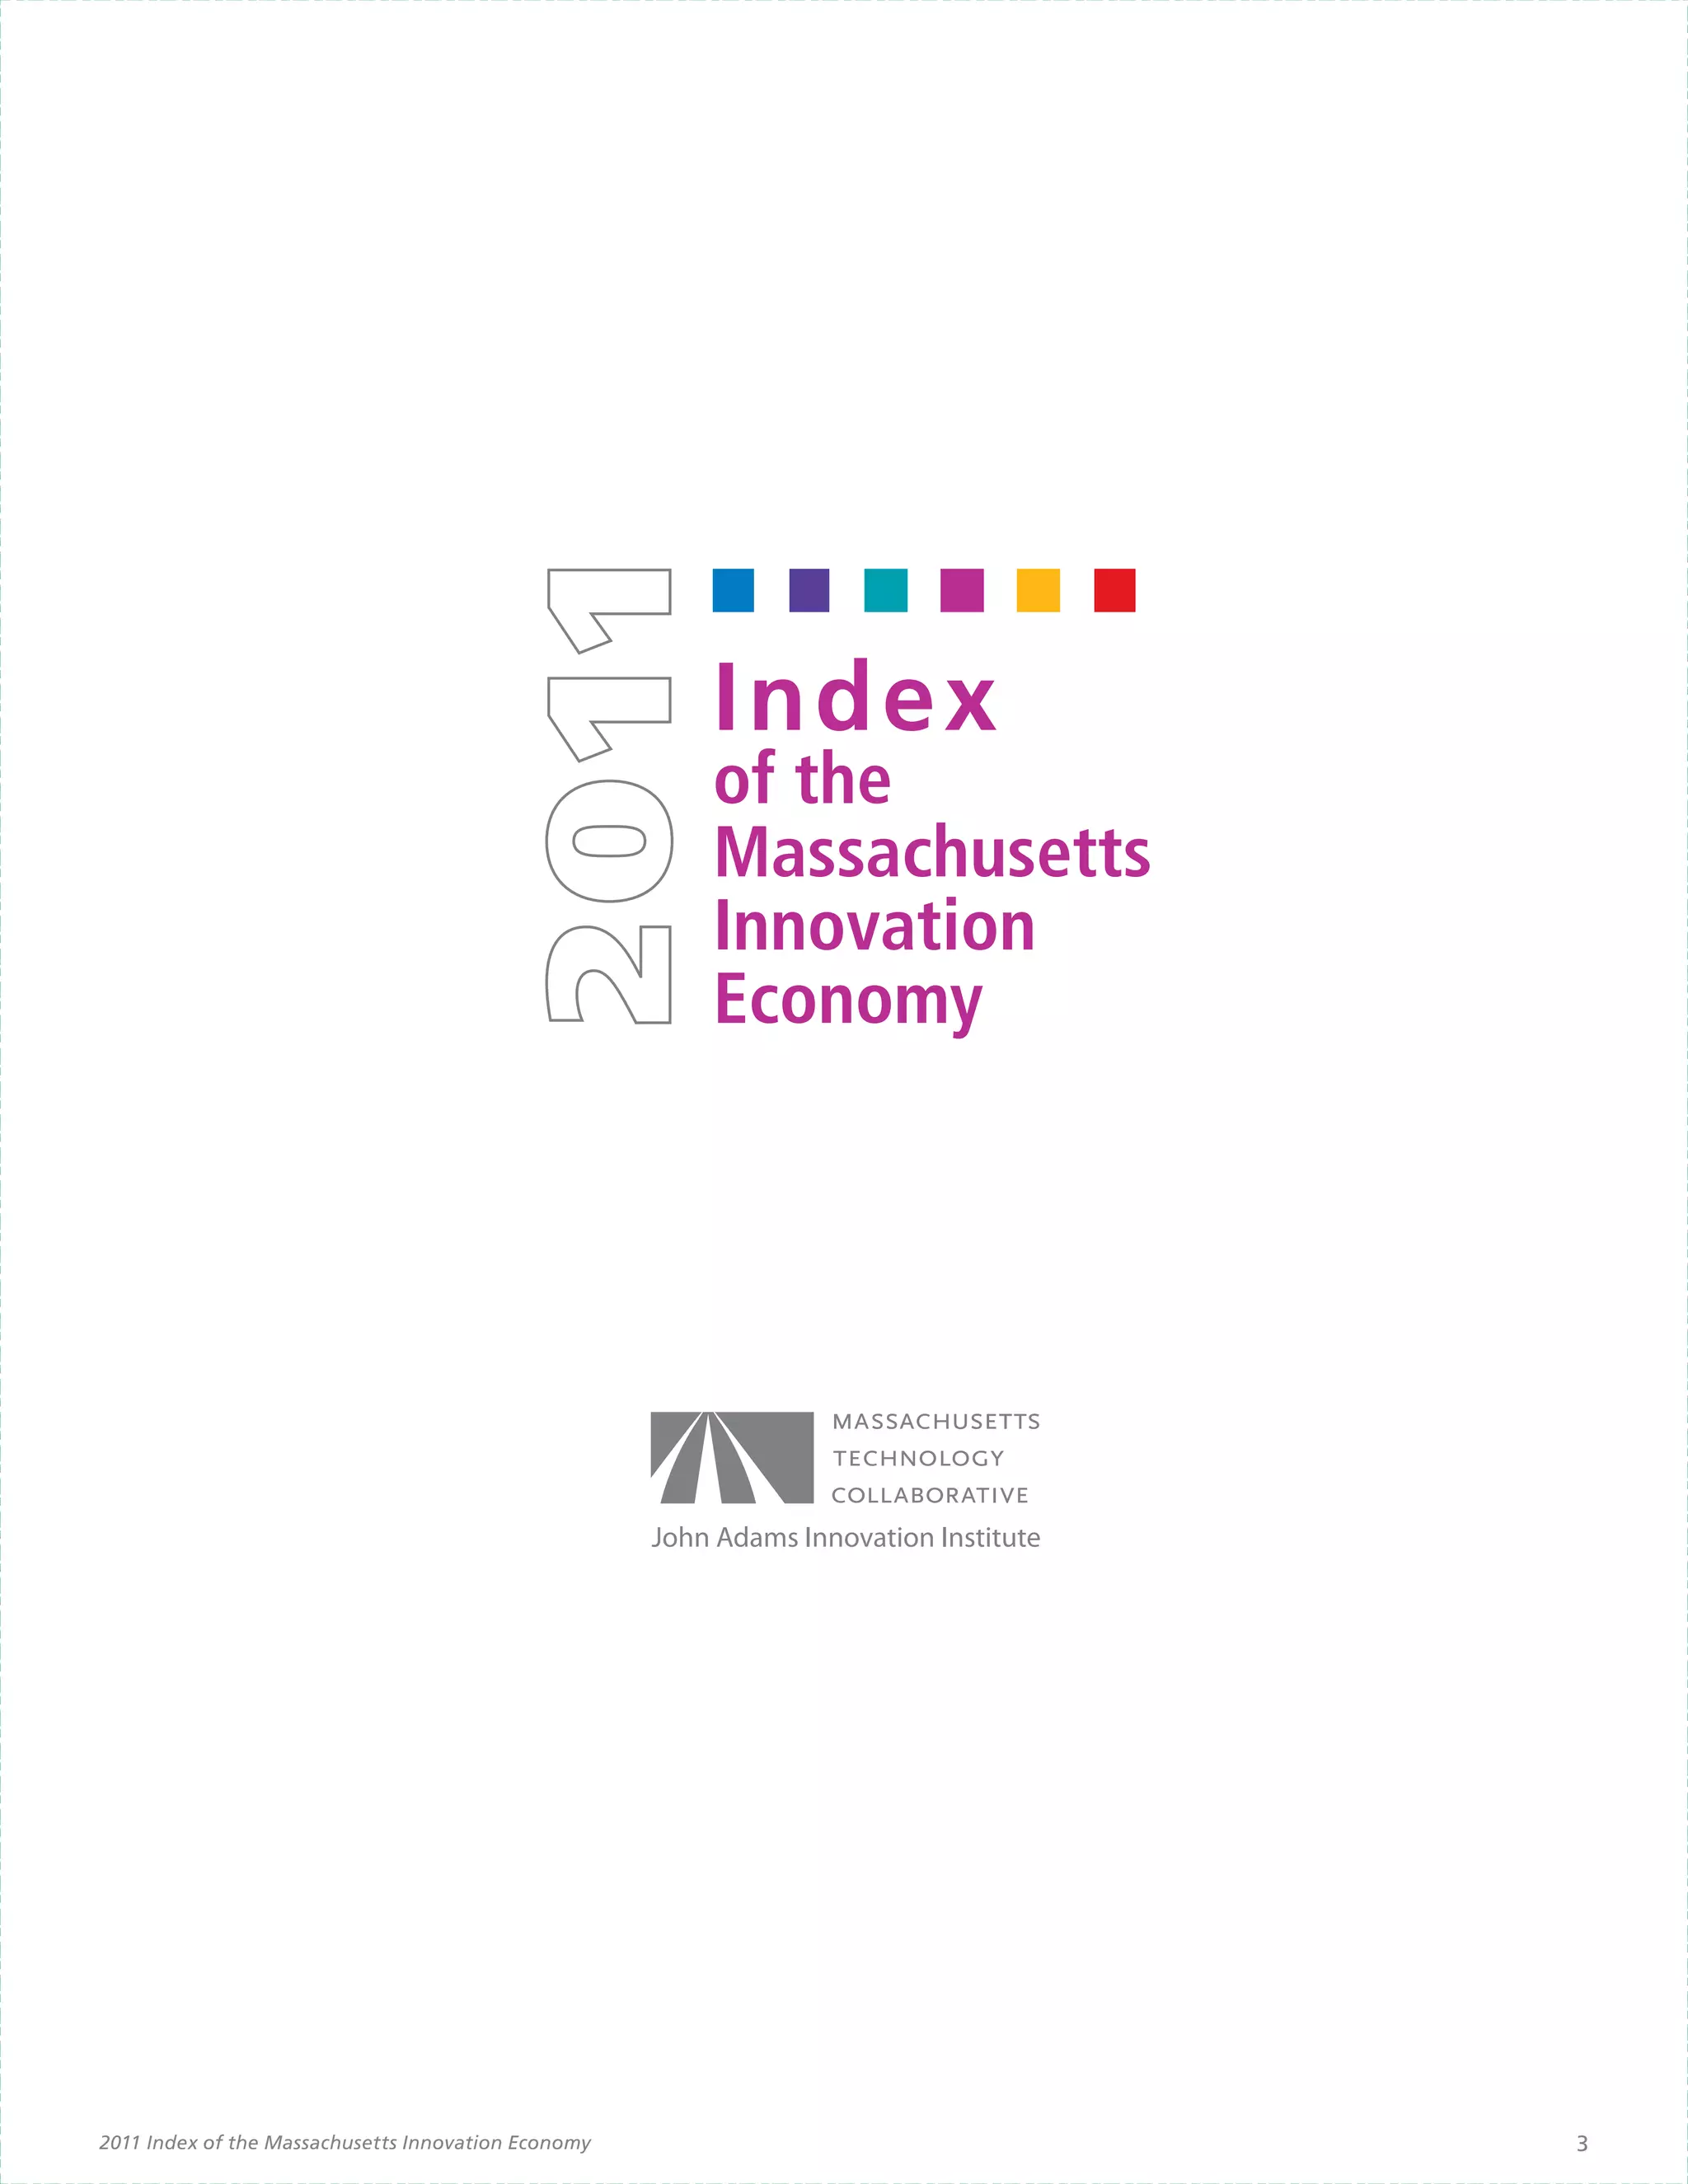
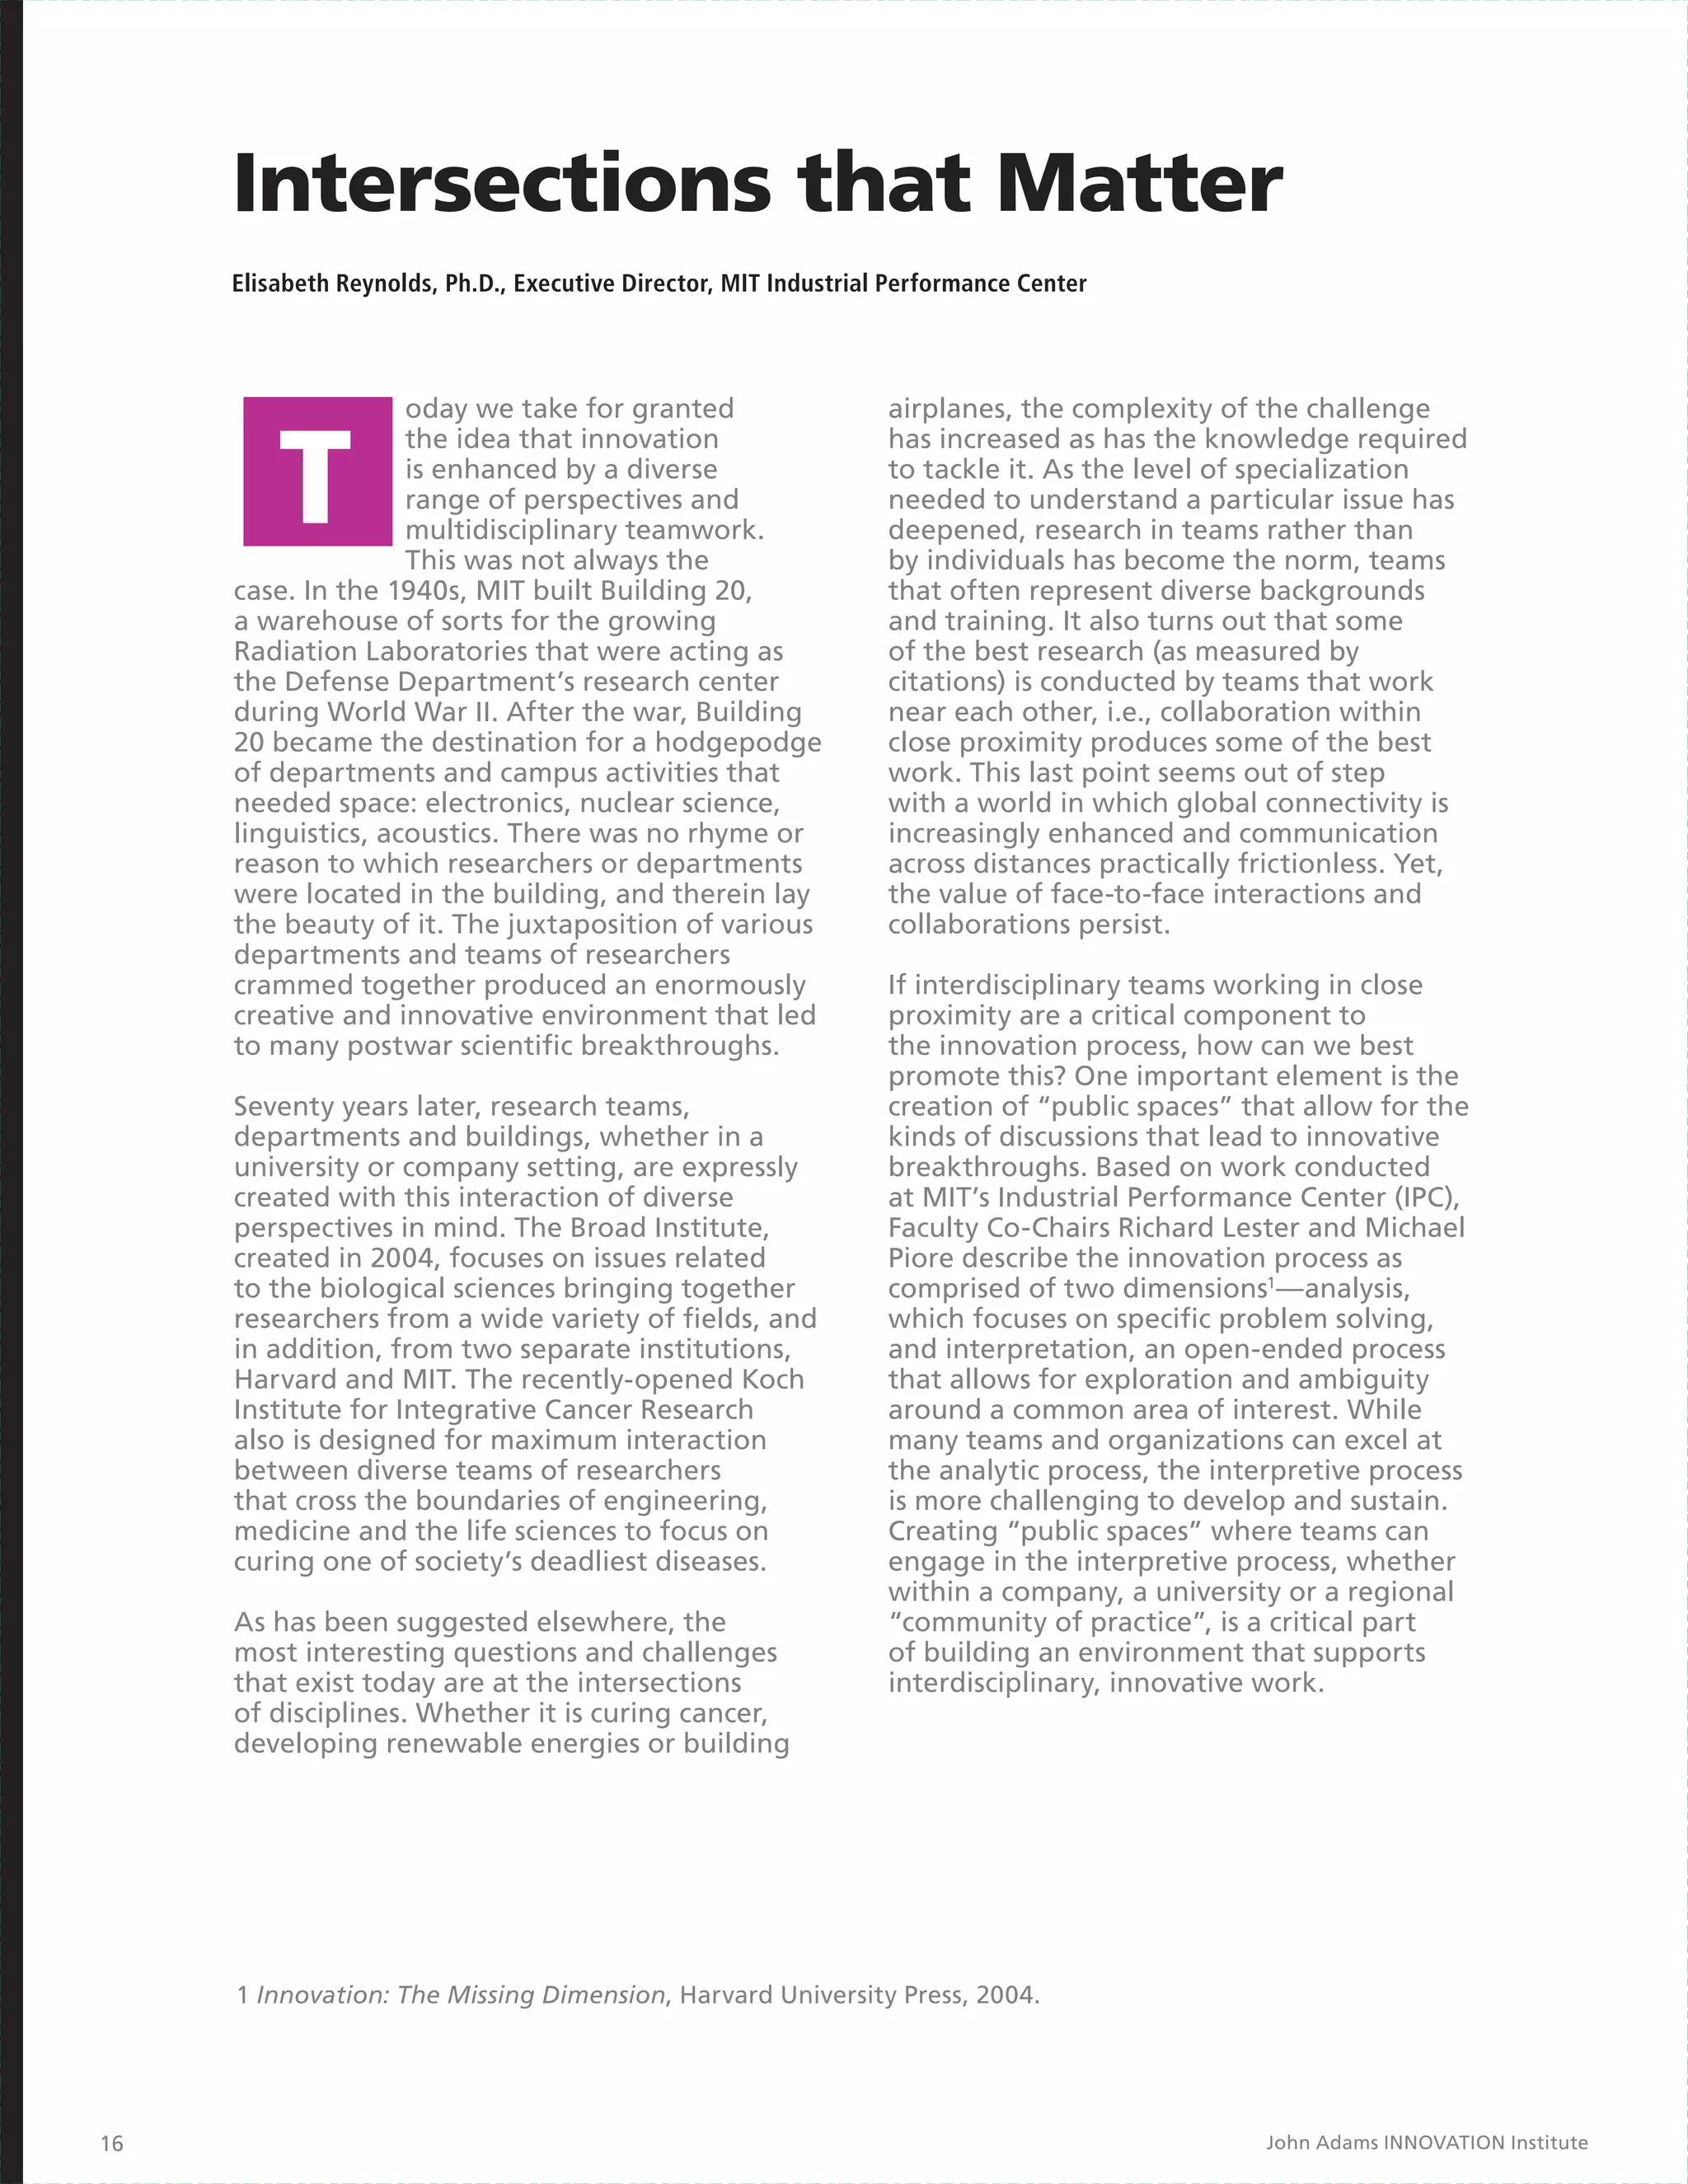
![STEM degrees ages 25 and older.” This is the number of people moving in and includes no
Data about degrees conferred by field of study are from the National Center information about the number moving out. It can be used as a measure of
for Education Statistics, Integrated Postsecondary Education Data System the ability to attract talent. http://factfinder.census.gov
(IPEDS) Completions Survey using the National Science Foundation (NSF)
population of institutions. Data were accessed through the NSF WebCASPAR 25. Housing Affordability
website. http://caspar.nsf.gov. Fields are defined by 2-digit Classification of Housing Price Index
Instructional Program (CIP), listed below. Housing price data are from the Federal Housing Finance Agency’s Housing
Price Index (HPI). Figures are four-quarter percent changes in the seasonally
• Science: 26-Biological & Biomedical Sciences and 40-Physical Sciences adjusted index. The HPI is a broad measure of the movement of single-family
house prices. The HPI is a weighted, repeat-sales index that is based on
• Technology: 11-Computer & Information Science & Support Services
repeat mortgage transactions on single-family properties whose mortgages
• Engineering: 14-Engineering have been purchased or securitized by Fannie Mae or Freddie Mac since
January 1975 [technical description paper available at: http://www.fhfa.gov/
• Math: 27-Mathematics & Statistics webfiles/896/hpi_tech.pdf].
24. Talent Flow and Attraction Housing affordability
Net population change Housing affordability figures are from the US Census Bureau, American
Data on population growth rate by state and the US, as well as total foreign Community Survey. The Index includes data from table R2515: “Percent of
and domestic migration data, are from the US Census Bureau’s Population Renter-Occupied Units Spending 30 Percent or More of Household Income on
Estimates Program. This dataset is an annual release that uses estimates Rent and Utilities,” and R2513: “Percent of Mortgaged Owners Spending 30
of the total population as of July 1 for the respective calendar year. http:// Percent or More of Household Income on Selected Monthly Owner Costs.”
www.census.gov/popest/datasets.html http://www.census.gov/popest/ http://factfinder.census.gov
archives/1980s/80s_st_totals.html
Relocations to LTS by college educated adults
Data on population mobility come from the American Community Survey
table BO7009: “Residence one year ago by educational attainment, persons
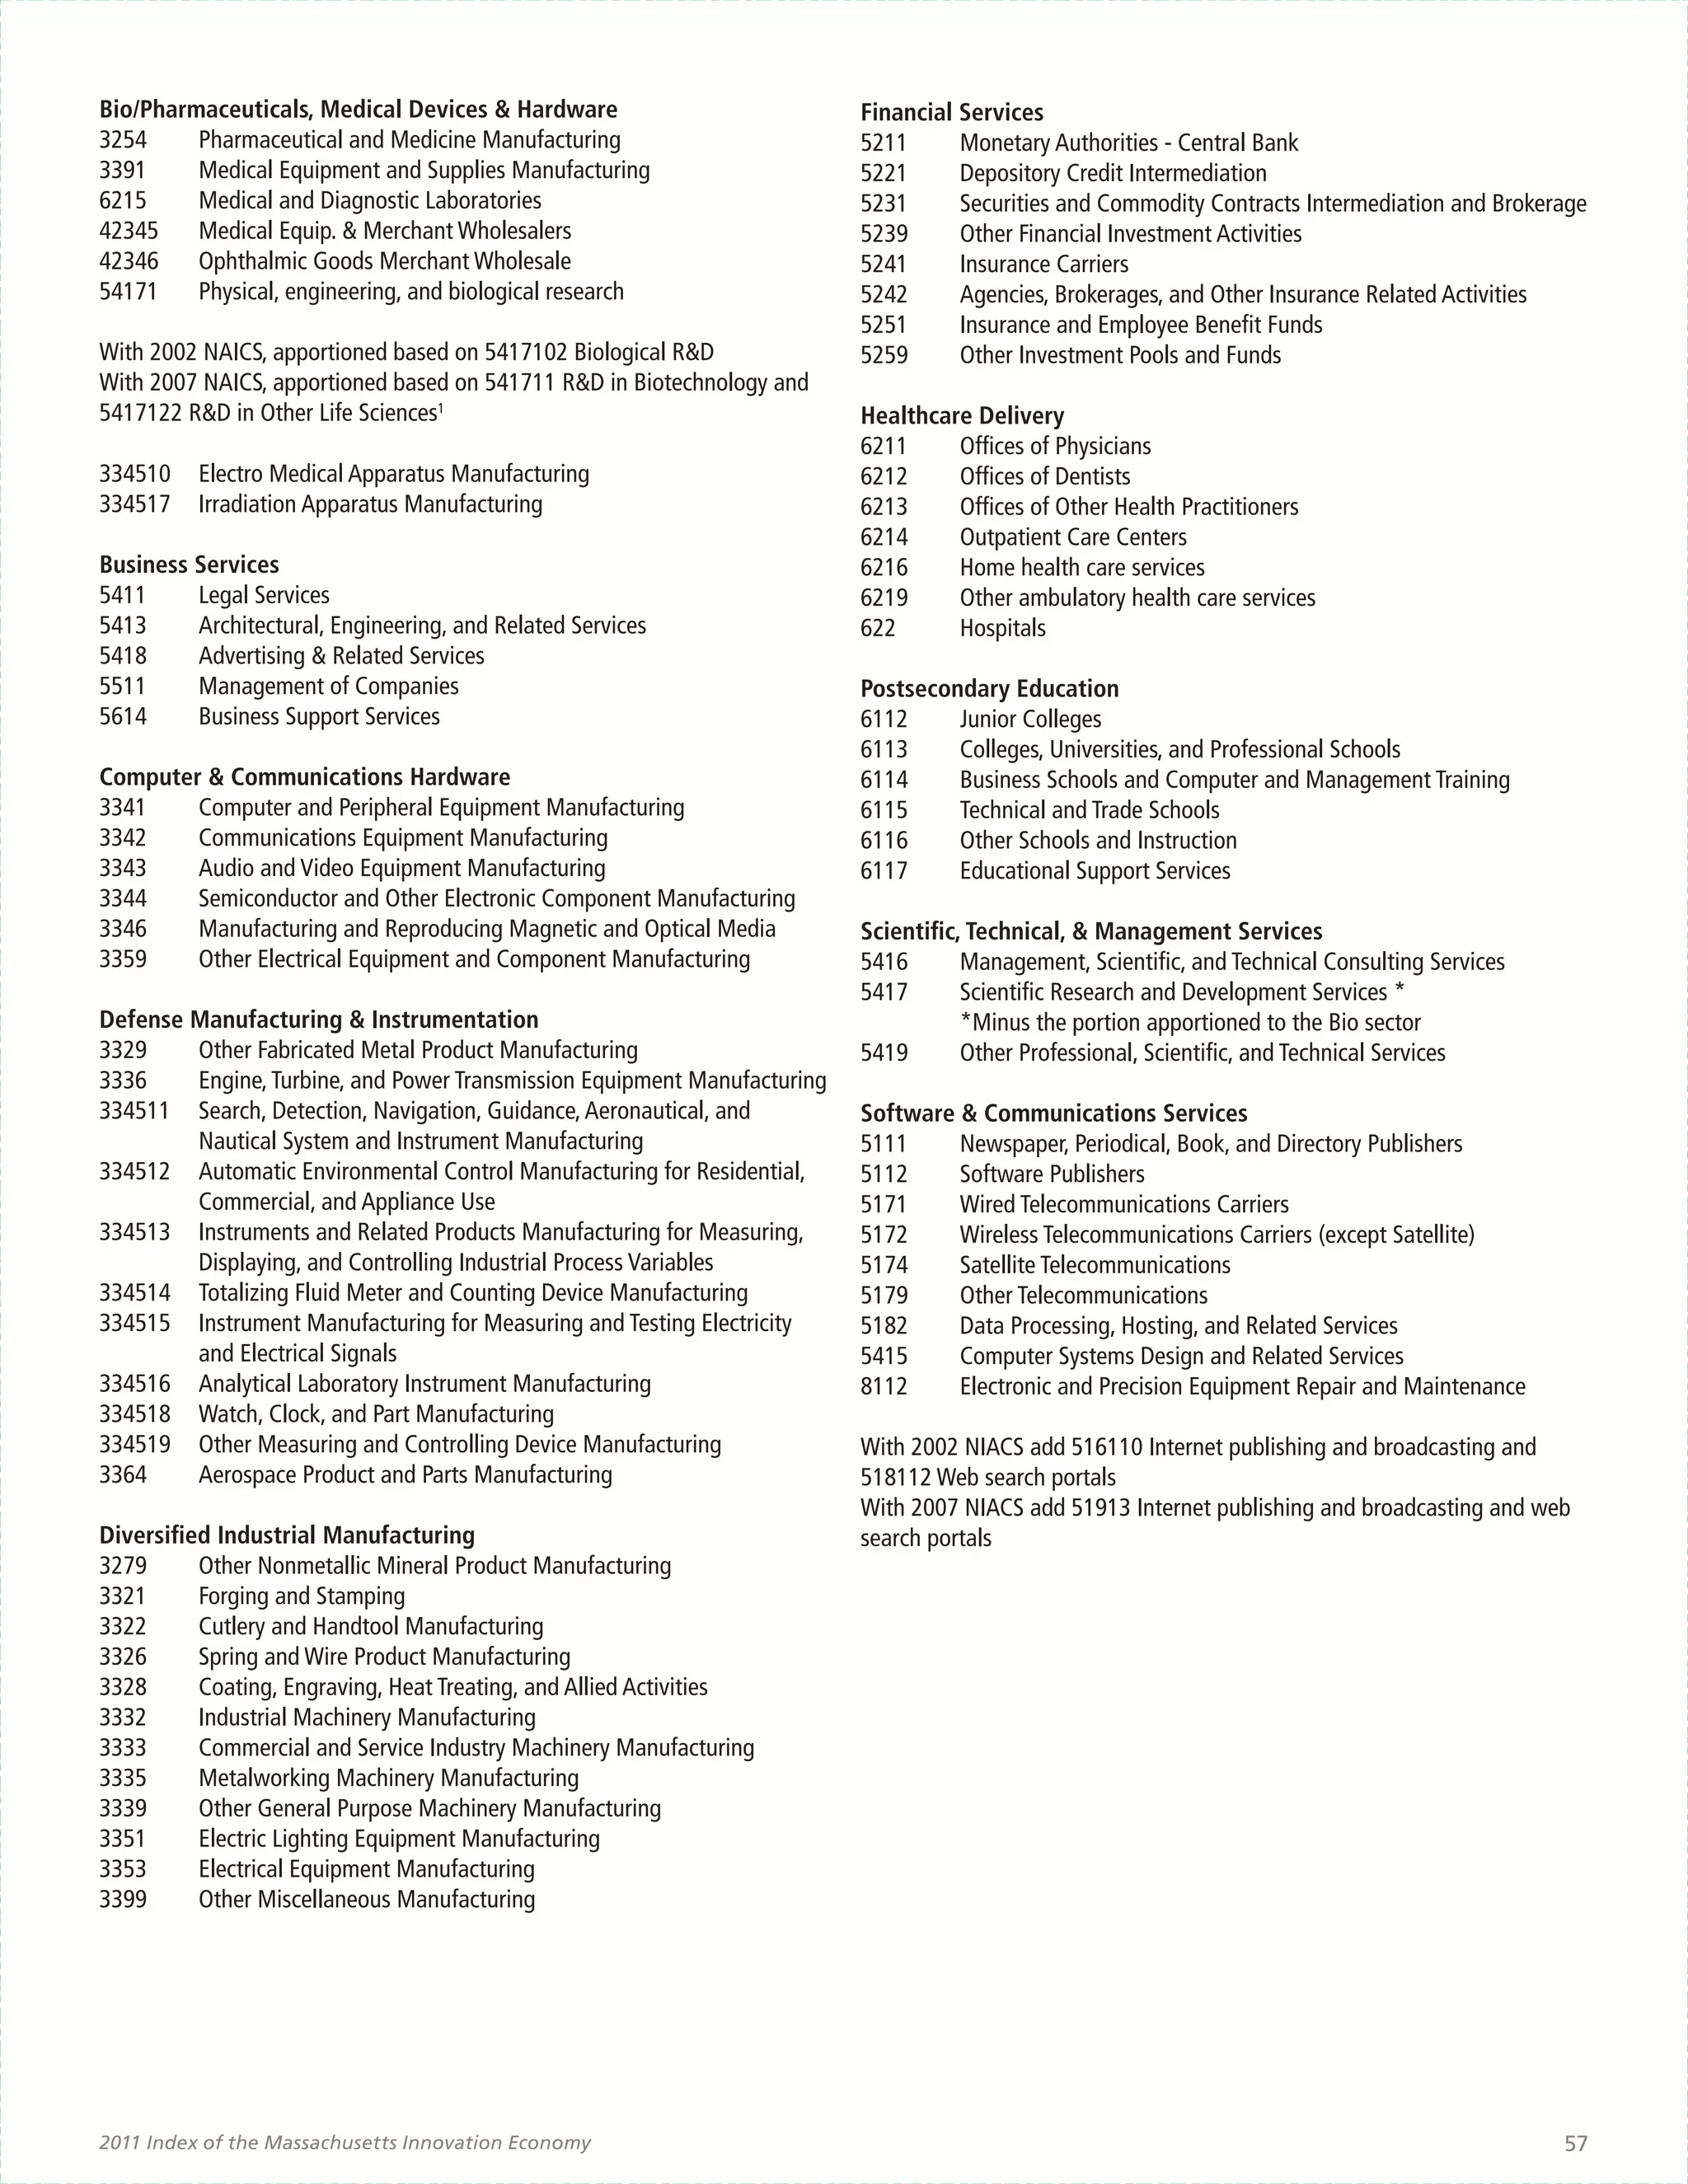
APPENDIX B With the exception of Advanced Materials, sectors are assembled from
those interrelated NAICS code industries that have shown to be individually
INDUSTRY SECTOR DEFINITIONS
significant according to the above measures. In the instance of the Business
The Index makes use of four- , five- and six-digit North American Industry Services sector, it is included because it represents activity that supplies
Classification System (NAICS) codes to define key industry sectors of critical support to other key sectors. In the 2009 Index, the definition of
the Massachusetts Innovation Economy. The Index’s key industry sector Business Services was expanded to include 5511-Management of companies
definitions capture traded-sectors that are known to be individually and enterprises. According to analysis by the Bureau of Labor Statistics, this
significant in the Massachusetts economy. Consistent with the innovation category has at least twice the all-industry average intensity of technology-
ecosystem framework, these sector definitions are broader than ‘high-tech’. oriented workers. All time-series comparisons use the current sector
Strictly speaking, clusters are overlapping networks of firms and institutions definition for all years, and, as such, may differ from figures printed in prior
which would include portions of many sectors, such as Postsecondary editions of the Index. The slight name change in 2009 of the Bio-pharma and
Education and Business Services. For data analysis purposes the Index has Medical Devices sector does not reflect any changes in the components that
developed NAICS-based sector definitions that are mutually exclusive. define the sector.
Advanced Materials
Modification to Sector Definitions
3133 Textile and Fabric Finishing and Fabric Coating Mills
The eleven key industry sectors as defined by the Index reflect the changes 3222 Converted Paper Product Manufacturing
in employment concentration in the Massachusetts Innovation Economy 3251 Basic Chemical Manufacturing
over time. For the purposes of accuracy, several sector definitions were 3252 Resin, Synthetic Rubber, and Artificial and Synthetic Fibers and
modified for the 2007 edition. The former “Healthcare Technology” sector Filaments Manufacturing
was reorganized into two new sectors: “Bio-pharmaceuticals, Medical 3255 Paint, Coating, and Adhesive Manufacturing
Devices and Hardware” and “Healthcare Delivery.” The former “Textiles & 3259 Other Chemical Product and Preparation Manufacturing
Apparel” sector was removed and replaced with the “Advanced Materials” 3261 Plastics Product Manufacturing
sector. While “Advanced Materials” does not conform to established criteria, 3262 Rubber Product Manufacturing
it is included to in an attempt to quantify and assess innovative and high- 3312 Steel Product Manufacturing from Purchased steel
growing business activities from the former “Textiles & Apparel” sector. 3313 Alumina and Aluminum Production and Processing
3314 Nonferrous Metal (except Aluminum) Production and Processing
1. Seven-digit NAICS are apportioned to this sector based on more detailed industry data from one of two US
Census Bureau sources: County Business Patterns or the Economic Census.
56 John Adams INNOVATION Institute](https://image.slidesharecdn.com/2011innovationindex-121025160440-phpapp02/75/MassTech-s-2011-Annual-Index-of-the-Innovation-Economy-57-2048.jpg)


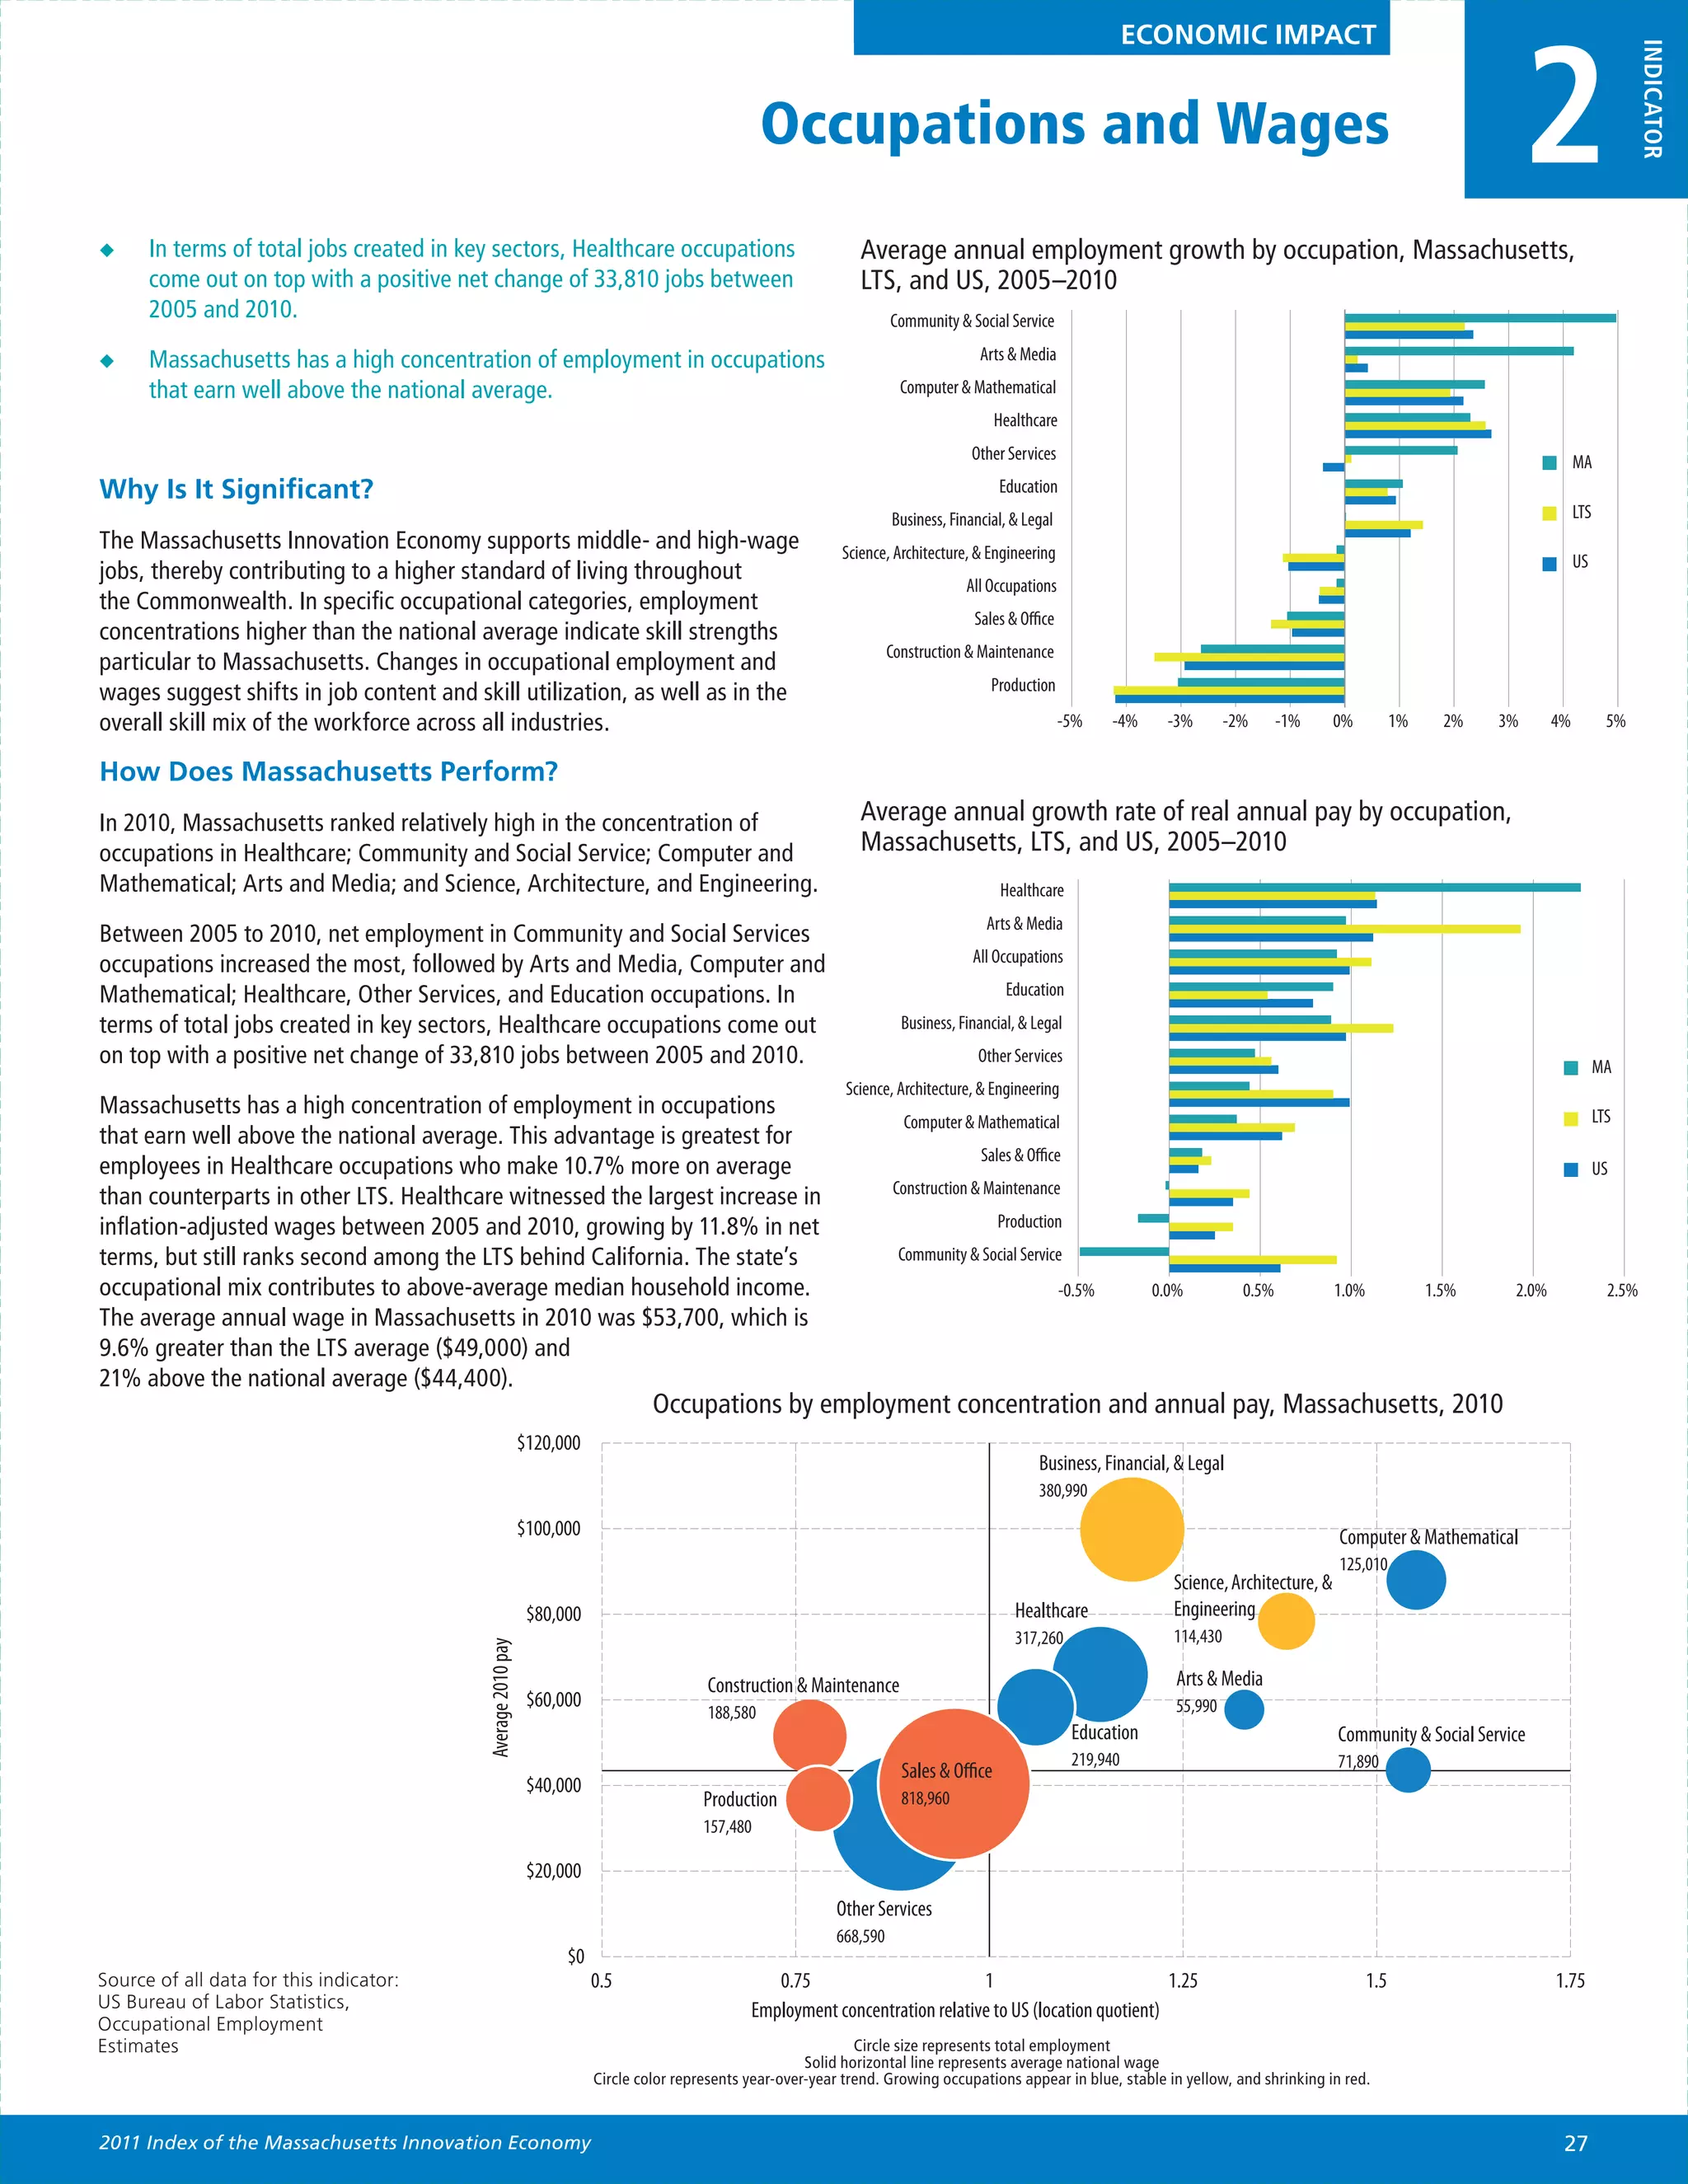
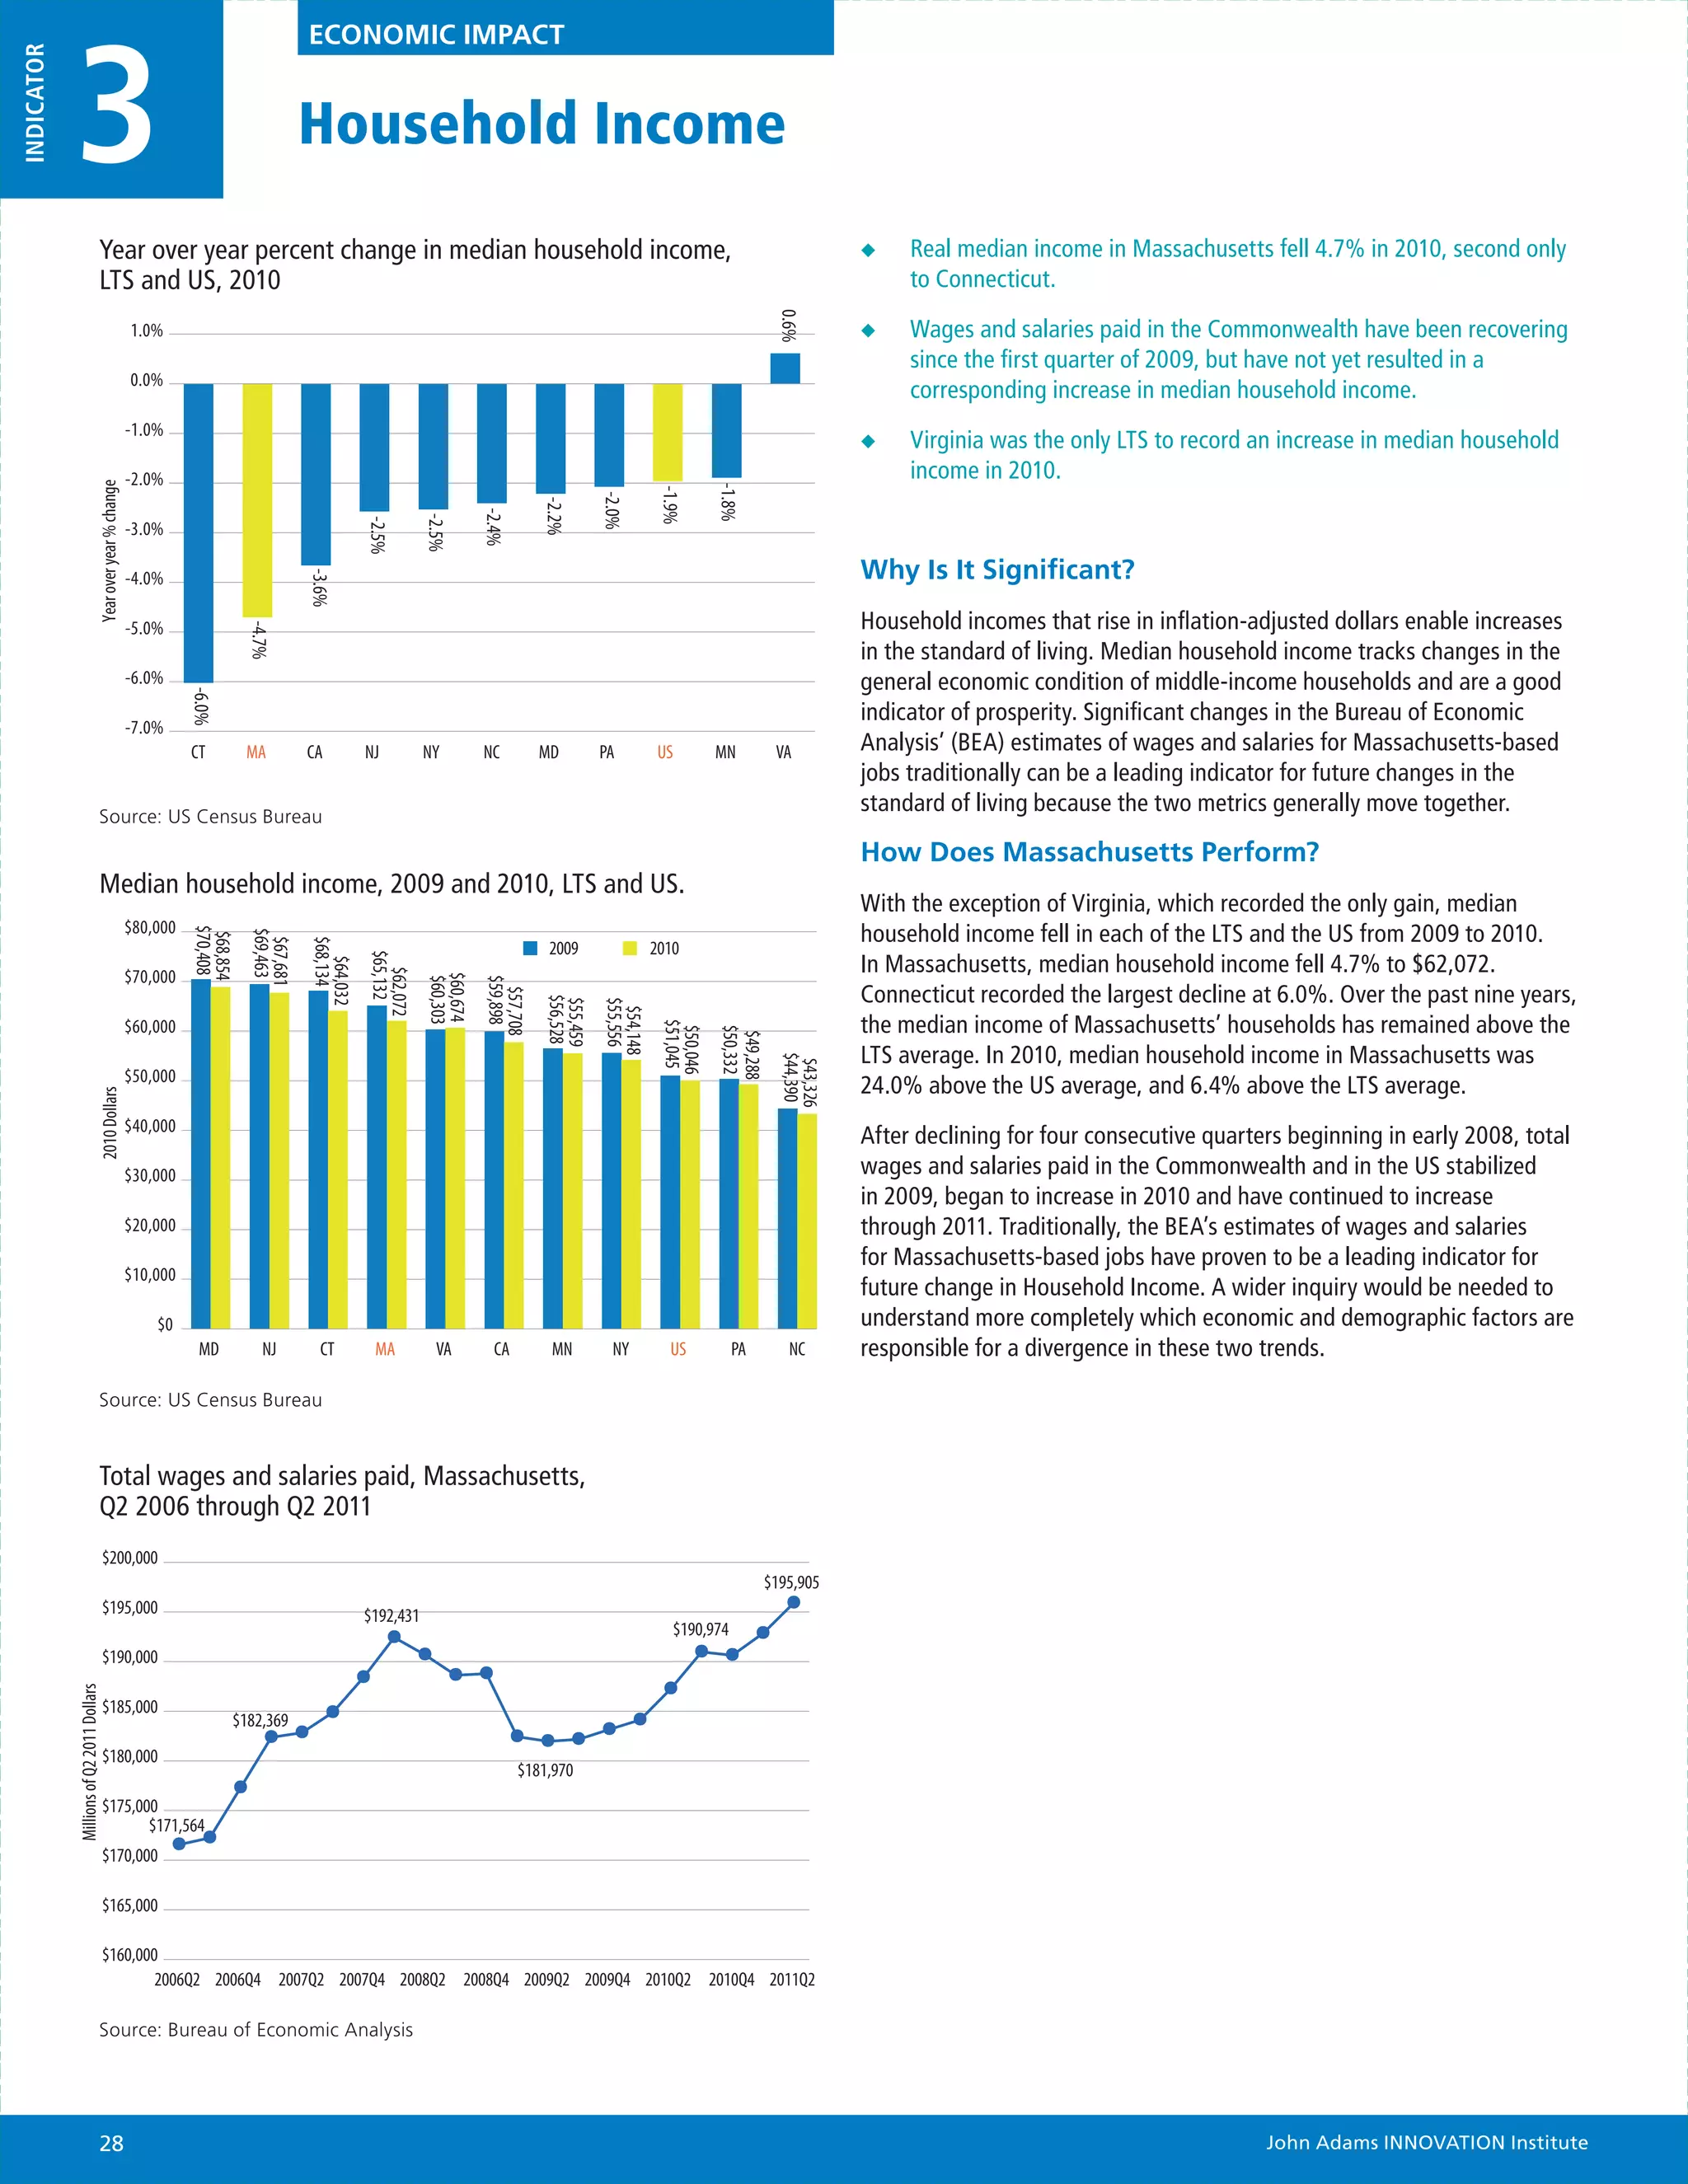
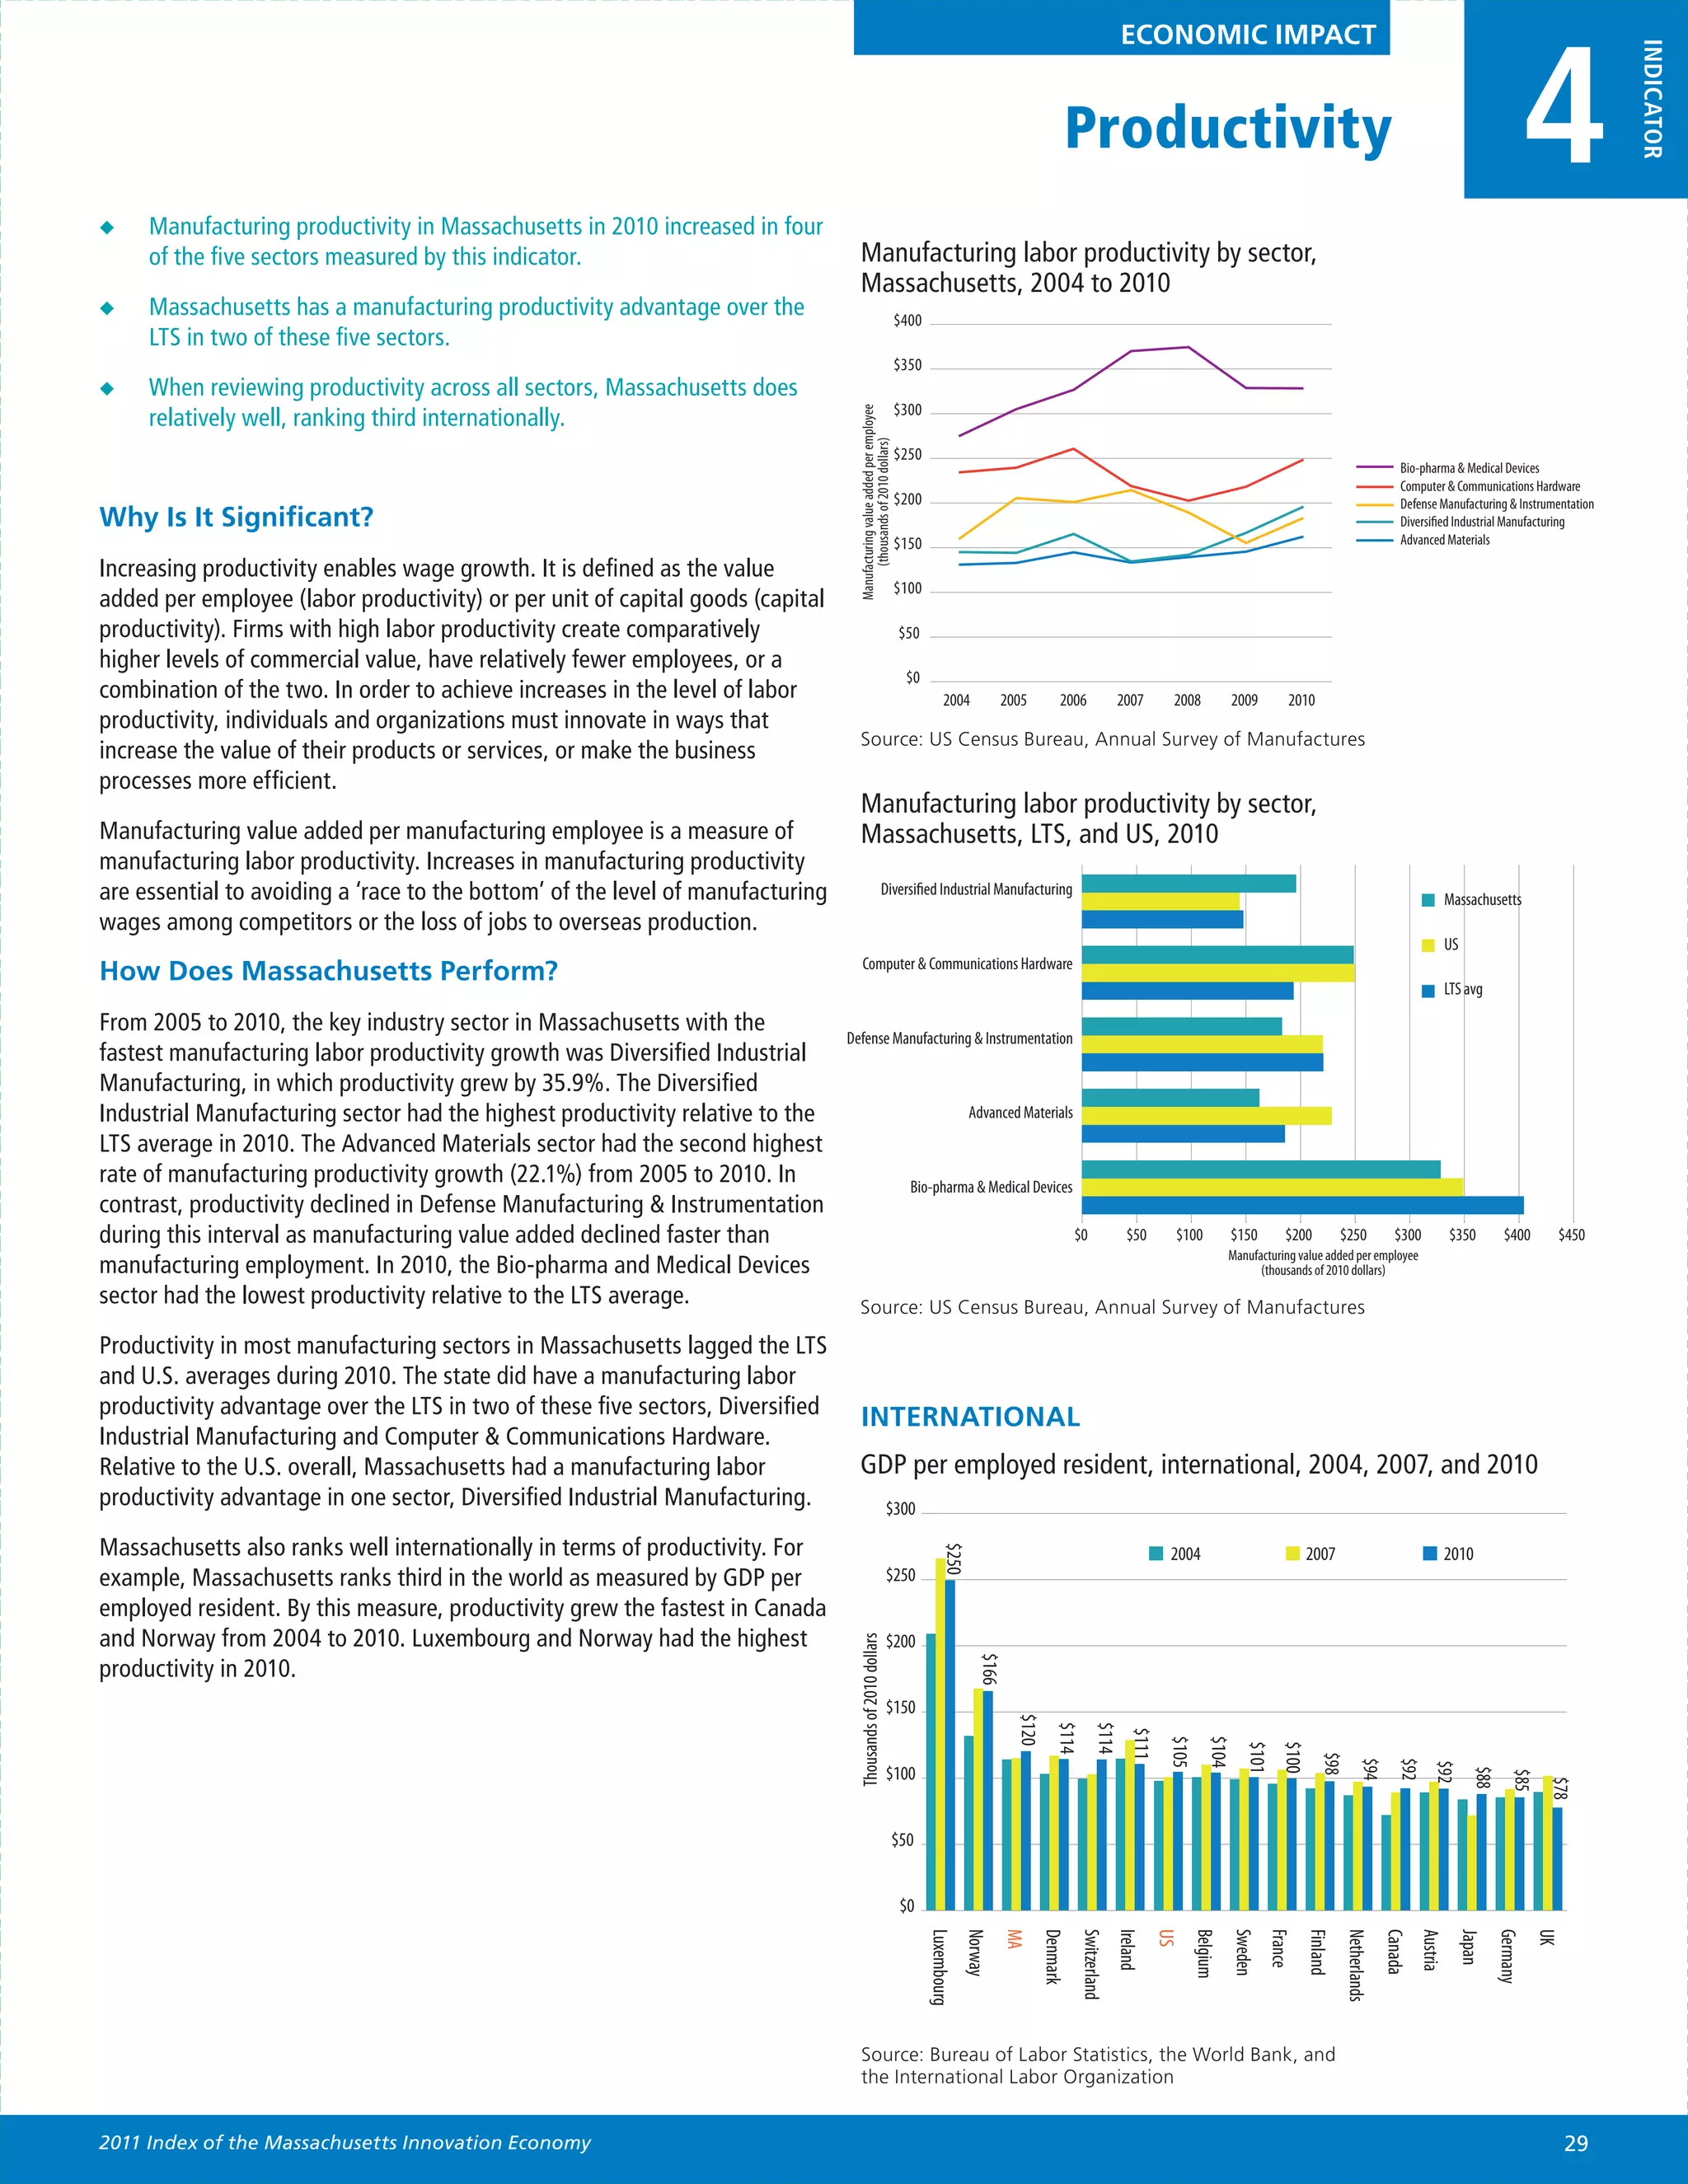
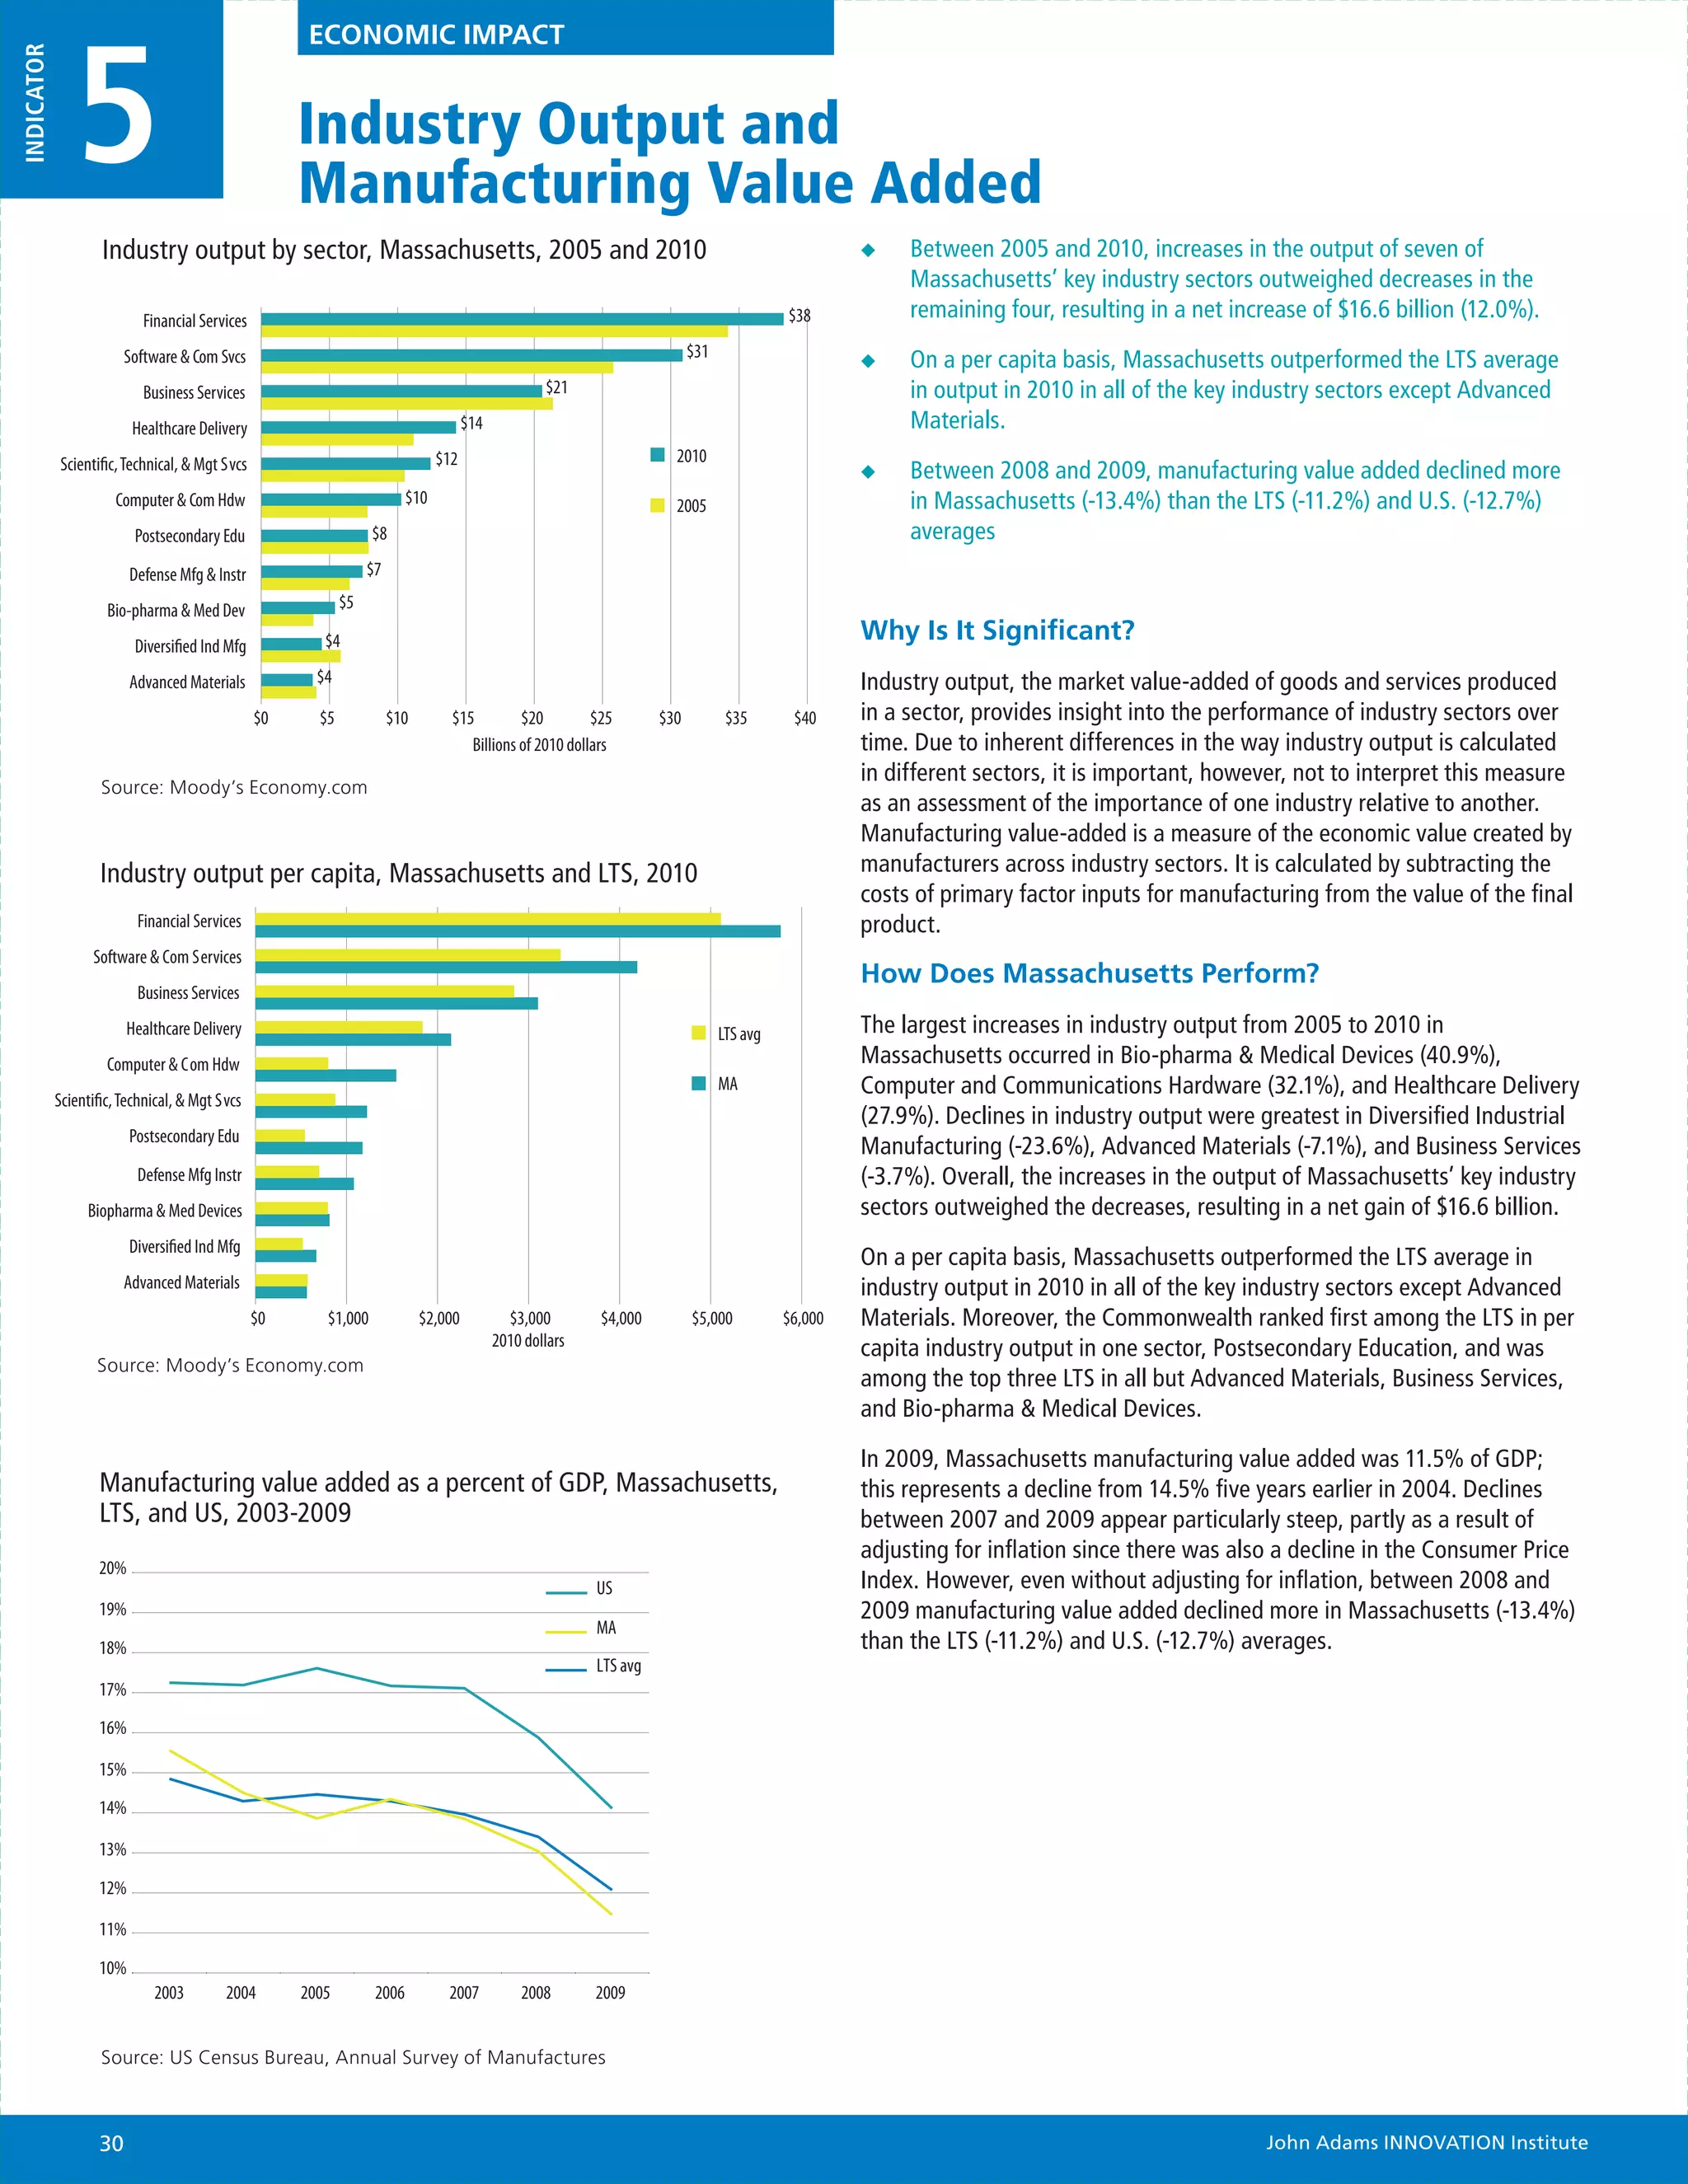
The 2011 Index of the Massachusetts Innovation Economy evaluates the performance of the state's knowledge economy, providing insights into trends, challenges, and opportunities for innovation. It highlights Massachusetts as a global leader in R&D and innovation, showcasing the essential role of its universities and collaborative efforts among industry, government, and academia. The report also identifies areas for improvement to maintain the state's competitive edge in the innovation ecosystem amidst economic uncertainties.


