2011 austin real estate market stats
•
0 likes•393 views

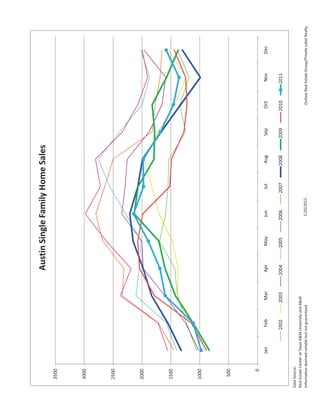
The document contains four charts showing statistics on the Austin single-family home market from 2002 to 2011. The first chart shows the number of monthly home sales. The second shows the number of monthly listings. The third shows the monthly inventory in months. The fourth shows the median home value over time. All charts show fluctuations from year to year.
Report
Share
Report
Share

Recommended
Design board for your biz ™ the operations manual
This document is an operations manual for a business. It contains 5 sections that outline legal, vendor, administrative, business, and account information for the company. The manual includes details on incorporation documents, emergency contacts, support teams, customer processes, products/services, marketing, and account login information. The purpose is to document important company information and procedures for reference or in case of emergency.
Building your brand
The document discusses branding and provides steps for developing a brand. It begins by defining a brand and noting that a brand represents a company's personality, promise, and most valuable asset. It then lists elements of an effective brand like positioning, awareness, reputation and image. The document outlines obvious and not-so-obvious aspects of a brand from business cards to social media presence. It provides questions to consider around brand position, promise, personality, story and associations. Finally, it discusses implementing the brand through a binder and consistent execution across all aspects of the business.
Applied Managerial Marketing
GGI will target generation Y consumers using VALS profiling to identify their psychological attributes and values. Marketing research through focus groups will assess values, self-image orientation, education, income, age, and purchase locations. GGI will differentiate itself through high quality, service, and unique styling reinforced by eco-friendly, functional packaging. A premium pricing strategy complements this approach given GGI's resources. Selective distribution through discount, specialty, and home improvement stores in regions like Texas and California will be used. Cooperative marketing and partnerships can help cut costs for GGI's promotional plan focusing on advertising, sales promotions, and public relations through internet, TV, and newspapers.
So you want to start a decorating or
This document provides an overview of what is required to become a home stager or interior decorator, including the various services they provide such as interior decorating, cleaning, decluttering, and furnishing vacant homes. It outlines the key aspects of starting this type of business, such as obtaining the proper insurance, permits, developing a business and marketing plan, and joining relevant industry associations to gain training and support.
Why stage your home for sale?
Staging a home increases its perceived value and helps it sell faster. According to a study, staged homes sold in half the time of non-staged homes and received 6.3% higher sale prices on average. Buyers today want move-in ready "turn-key" homes, so staging helps make a home more appealing to more buyers in a competitive market. The longer a home is on the market, the lower the price may need to be lowered, so staging upfront can help avoid price reductions later.
Design board for your biz ™ part 2
This document provides guidance on creating an effective business plan and operations manual for an interior decorating, home staging or design business. It discusses key elements to include such as a mission statement, vision statement, objectives, strategies, and action plans. The mission statement should clearly communicate the business's goals and philosophies. The vision statement describes the future aspirations. Objectives are specific, measurable goals that support the mission. Strategies outline the internal and external approaches for achieving objectives and the vision. Finally, action plans detail the specific work needed to execute the strategies. The overall purpose is to create focus, alignment and accountability for business success.
Design board for your biz ™ business model design
This document outlines the key elements of creating an effective business plan and operations manual for an interior decorating, home staging, or design business. It covers defining the business model by identifying customer segments, the value proposition, channels, customer relationships, revenue streams, key resources, activities, partnerships, and cost structure. The goal is to help plan, design, and execute a successful business strategy.
The Outcome Economy
1) The document discusses the opportunity for technology to improve organizational efficiency and transition economies into a "smart and clean world."
2) It argues that aggregate efficiency has stalled at around 22% for 30 years due to limitations of the Second Industrial Revolution, but that digitizing transport, energy, and communication through technologies like blockchain can help manage resources and increase efficiency.
3) Technologies like precision agriculture, cloud computing, robotics, and autonomous vehicles may allow for "dematerialization" and do more with fewer physical resources through effects like reduced waste and need for transportation/logistics infrastructure.
Office Building for Sale - 2810 City View Drive, Madison, WI
36,778 sq. ft. building; Zoning: SE (Suburban Employment): The (SE) District allows numerous commercial site uses; Passenger elevator; Private and common restrooms; Fully sprinkled; Data center with a grounded floor and a specialized HVAC system; 60 KVA back-up generator; Building/pylon signage; Potential to purchase adjacent parcels; Sale Price: $4,413,360
Why is Revit MEP Outsourcing considered an as good option for construction pr...
Outsourcing MEP modeling services require effective collaboration and coordination amongst multiple engineering trades. The engineers and the designers often change the details of the MEP projects, but the work of Revit MEP drafting services is having the master plan and model of the complete project. To have proper coordination and installation, there is a need to execute the project effectively. Hence, the work of Revit family creation facilitates the MEP engineers.
Listing Turkey - Piyalepasa Istanbul Catalog
We are working around the clock to transform a long-time dream into reality. As a result, Piyalepasa Istanbul will be the largest privately developed urban regeneration project in Turkey.
THE NEIGHBORHOOD WE HAVE BEEN LONGING FOR IS COMING TO LIFE
The good old days of the Piyalepasa neighborhood are being brought back to life with Piyalepasa Istanbul houses, residences, offices, hotels and a pedestrianized shopping avenue.
The wide streets of this 82.000 square meter development conveniently face the main boulevard in a prime Beyoglu location. “Piyalepaşa İstanbul” stands out as the only project designed to offer a neighborhood lifestyle, complete with its grocers, bagel sellers and greengrocer. Piyalepasa Istanbul has all the values to make it an authentic neighborhood, our very own community.
A NEIGHBORHOOD FULL OF LIFE, IN THE HEART OF THE CITY!
“Piyalepaşa İstanbul” is a “mixed-use” concept containing all the elements for a vibrant social life with houses, residences, offices, hotels and high street shopping.
“Piyalepaşa İstanbul” will take the liveliness of Istanbul into its heart. The elegant sparkle of Nisantasi, the young and colorful Besiktas, the variety and multicultural heritage of Istiklal Street will all be contained within the streets of this neighborhood.
“Piyalepaşa İstanbul” bears traces of the most beautiful examples of Turkish architecture from the Seljuks to the Ottomans and from Anatolia to Rumelia. With its graded facades, wide eaves, bay windows, pools, and interior courtyard systems, it offers a new living space without disrupting the city’s silhouette and neighborhood.
“Piyalepaşa İstanbul” is the new attraction of this splendid city.
TO BE AT THE CENTER OF ISTANBUL… THIS IS REAL LUXURY!
With its proximity to D-100 highway, connecting roads and tunnels, “Piyalepaşa İstanbul” is only minutes away from Kabatas, Besiktas, the Golden Horn and Karakoy.
“Piyalepaşa İstanbul” is close to the prestigious new Istanbul Court House, a major hospital, the Perpa trade center and the city’s most lively neighborhoods. With its shuttle service to Okmeydani Metrobus station, Sishane and the Court House subway stations, “Piyalepaşa İstanbul” will provide you with the most convenient transport connections.
https://listingturkey.com/property/piyalepasa-istanbul/
Future of andhra pradesh real estate.pdf
Andhra Pradesh, known for its strategic location on the southeastern coast of India, has emerged as a key player in India’s industrial landscape. Over the decades, the state has witnessed significant growth across various sectors,
Living in an UBER World - June '24 Sales Meeting
June 2024 Lancaster County Sales Meeting for Berkshire Hathaway HomeServices Homesale Realty covering the following topics: 1. VA Suspends Buyer Agent Payment Plan (article), 2. Frequently Used Terms in title, 3. Zillow Showcase Overview, 4. QuickBuy commission promotion, 5. Documenting Cooperative Compensation, 6. NAR's Code of Ethics - Mass Media Solicitations, 7. Is it really cheaper to rent? 8. Do's and Don't's when Terminating the Agreement of Sale, 9. Living in an UBER World
Anilesh Ahuja Pioneering a Paradigm Shift in Real Estate Success.pptx
Anilesh Ahuja journey is a testament to the power of vision, resilience, and unwavering determination. As a visionary leader, he continues to inspire and empower others to dream big and challenge the status quo. His legacy extends far beyond the realm of real estate, leaving an indelible mark on the industry and the world at large.
Sunrise Infra Properties Company Profile Pradeep.pdf
COmpany Profile of SunRise Infra Properties Pvt. Ltd.
SVN Live 6.17.24 Weekly Property Broadcast
The SVN® organization shares a portion of their new weekly listings via their SVN Live® Weekly Property Broadcast. Visit https://svn.com/svn-live/ if you would like to attend our weekly call, which we open up to the brokerage community.
Signature Global TITANIUM SPR | 3.5 & 4.5BHK High rise Apartments in Gurgaon
Signature Global TITANIUM SPR launched a high rise apartments in Gurgaon . In this project Signature Global offers 3.5 & 4.5 BHK high rise Apartment at sector 71 Gurgaon SPR Road. Signature Global Titanium SPR is IGBC Gold certified, a testament to our commitment to sustainability.
Stark Builders: Where Quality Meets Craftsmanship!
At Stark Builders our vision is to redefine the renovation experience by combining both stunning design and high quality construction skills. We believe that by delivering both these key aspects together we are able to achieve incredible results for our clients and ensure every project reflects their vision and enhances their lifestyle.
Although we are not all related by blood we have created a team of highly professional and hardworking individuals who share the common goal of delivering beautiful and functional renovated spaces. Our tight nit team are able to work together in a way where we pour our passion into each and every project as we have a love for what we do. Building is our life.
Floople Real Estate Market in the UK - Current Trends and Future Prospects
Housing prices, rental rates, market demand, and investment trends
2024 State of Marketing Report – by Hubspot
https://www.hubspot.com/state-of-marketing
· Scaling relationships and proving ROI
· Social media is the place for search, sales, and service
· Authentic influencer partnerships fuel brand growth
· The strongest connections happen via call, click, chat, and camera.
· Time saved with AI leads to more creative work
· Seeking: A single source of truth
· TLDR; Get on social, try AI, and align your systems.
· More human marketing, powered by robots
Everything You Need To Know About ChatGPT
ChatGPT is a revolutionary addition to the world since its introduction in 2022. A big shift in the sector of information gathering and processing happened because of this chatbot. What is the story of ChatGPT? How is the bot responding to prompts and generating contents? Swipe through these slides prepared by Expeed Software, a web development company regarding the development and technical intricacies of ChatGPT!
Product Design Trends in 2024 | Teenage Engineerings
The realm of product design is a constantly changing environment where technology and style intersect. Every year introduces fresh challenges and exciting trends that mold the future of this captivating art form. In this piece, we delve into the significant trends set to influence the look and functionality of product design in the year 2024.
How Race, Age and Gender Shape Attitudes Towards Mental Health
Mental health has been in the news quite a bit lately. Dozens of U.S. states are currently suing Meta for contributing to the youth mental health crisis by inserting addictive features into their products, while the U.S. Surgeon General is touring the nation to bring awareness to the growing epidemic of loneliness and isolation. The country has endured periods of low national morale, such as in the 1970s when high inflation and the energy crisis worsened public sentiment following the Vietnam War. The current mood, however, feels different. Gallup recently reported that national mental health is at an all-time low, with few bright spots to lift spirits.
To better understand how Americans are feeling and their attitudes towards mental health in general, ThinkNow conducted a nationally representative quantitative survey of 1,500 respondents and found some interesting differences among ethnic, age and gender groups.
Technology
For example, 52% agree that technology and social media have a negative impact on mental health, but when broken out by race, 61% of Whites felt technology had a negative effect, and only 48% of Hispanics thought it did.
While technology has helped us keep in touch with friends and family in faraway places, it appears to have degraded our ability to connect in person. Staying connected online is a double-edged sword since the same news feed that brings us pictures of the grandkids and fluffy kittens also feeds us news about the wars in Israel and Ukraine, the dysfunction in Washington, the latest mass shooting and the climate crisis.
Hispanics may have a built-in defense against the isolation technology breeds, owing to their large, multigenerational households, strong social support systems, and tendency to use social media to stay connected with relatives abroad.
Age and Gender
When asked how individuals rate their mental health, men rate it higher than women by 11 percentage points, and Baby Boomers rank it highest at 83%, saying it’s good or excellent vs. 57% of Gen Z saying the same.
Gen Z spends the most amount of time on social media, so the notion that social media negatively affects mental health appears to be correlated. Unfortunately, Gen Z is also the generation that’s least comfortable discussing mental health concerns with healthcare professionals. Only 40% of them state they’re comfortable discussing their issues with a professional compared to 60% of Millennials and 65% of Boomers.
Race Affects Attitudes
As seen in previous research conducted by ThinkNow, Asian Americans lag other groups when it comes to awareness of mental health issues. Twenty-four percent of Asian Americans believe that having a mental health issue is a sign of weakness compared to the 16% average for all groups. Asians are also considerably less likely to be aware of mental health services in their communities (42% vs. 55%) and most likely to seek out information on social media (51% vs. 35%).
AI Trends in Creative Operations 2024 by Artwork Flow.pdf
Creative operations teams expect increased AI use in 2024. Currently, over half of tasks are not AI-enabled, but this is expected to decrease in the coming year. ChatGPT is the most popular AI tool currently. Business leaders are more actively exploring AI benefits than individual contributors. Most respondents do not believe AI will impact workforce size in 2024. However, some inhibitions still exist around AI accuracy and lack of understanding. Creatives primarily want to use AI to save time on mundane tasks and boost productivity.
Skeleton Culture Code
Organizational culture includes values, norms, systems, symbols, language, assumptions, beliefs, and habits that influence employee behaviors and how people interpret those behaviors. It is important because culture can help or hinder a company's success. Some key aspects of Netflix's culture that help it achieve results include hiring smartly so every position has stars, focusing on attitude over just aptitude, and having a strict policy against peacocks, whiners, and jerks.
PEPSICO Presentation to CAGNY Conference Feb 2024
PepsiCo provided a safe harbor statement noting that any forward-looking statements are based on currently available information and are subject to risks and uncertainties. It also provided information on non-GAAP measures and directing readers to its website for disclosure and reconciliation. The document then discussed PepsiCo's business overview, including that it is a global beverage and convenient food company with iconic brands, $91 billion in net revenue in 2023, and nearly $14 billion in core operating profit. It operates through a divisional structure with a focus on local consumers.
Content Methodology: A Best Practices Report (Webinar)
This document provides an overview of content methodology best practices. It defines content methodology as establishing objectives, KPIs, and a culture of continuous learning and iteration. An effective methodology focuses on connecting with audiences, creating optimal content, and optimizing processes. It also discusses why a methodology is needed due to the competitive landscape, proliferation of channels, and opportunities for improvement. Components of an effective methodology include defining objectives and KPIs, audience analysis, identifying opportunities, and evaluating resources. The document concludes with recommendations around creating a content plan, testing and optimizing content over 90 days.
How to Prepare For a Successful Job Search for 2024
The document provides guidance on preparing a job search for 2024. It discusses the state of the job market, focusing on growth in AI and healthcare but also continued layoffs. It recommends figuring out what you want to do by researching interests and skills, then conducting informational interviews. The job search should involve building a personal brand on LinkedIn, actively applying to jobs, tailoring resumes and interviews, maintaining job hunting as a habit, and continuing self-improvement. Once hired, the document advises setting new goals and keeping skills and networking active in case of future opportunities.
Social Media Marketing Trends 2024 // The Global Indie Insights
A report by thenetworkone and Kurio.
The contributing experts and agencies are (in an alphabetical order): Sylwia Rytel, Social Media Supervisor, 180heartbeats + JUNG v MATT (PL), Sharlene Jenner, Vice President - Director of Engagement Strategy, Abelson Taylor (USA), Alex Casanovas, Digital Director, Atrevia (ES), Dora Beilin, Senior Social Strategist, Barrett Hoffher (USA), Min Seo, Campaign Director, Brand New Agency (KR), Deshé M. Gully, Associate Strategist, Day One Agency (USA), Francesca Trevisan, Strategist, Different (IT), Trevor Crossman, CX and Digital Transformation Director; Olivia Hussey, Strategic Planner; Simi Srinarula, Social Media Manager, The Hallway (AUS), James Hebbert, Managing Director, Hylink (CN / UK), Mundy Álvarez, Planning Director; Pedro Rojas, Social Media Manager; Pancho González, CCO, Inbrax (CH), Oana Oprea, Head of Digital Planning, Jam Session Agency (RO), Amy Bottrill, Social Account Director, Launch (UK), Gaby Arriaga, Founder, Leonardo1452 (MX), Shantesh S Row, Creative Director, Liwa (UAE), Rajesh Mehta, Chief Strategy Officer; Dhruv Gaur, Digital Planning Lead; Leonie Mergulhao, Account Supervisor - Social Media & PR, Medulla (IN), Aurelija Plioplytė, Head of Digital & Social, Not Perfect (LI), Daiana Khaidargaliyeva, Account Manager, Osaka Labs (UK / USA), Stefanie Söhnchen, Vice President Digital, PIABO Communications (DE), Elisabeth Winiartati, Managing Consultant, Head of Global Integrated Communications; Lydia Aprina, Account Manager, Integrated Marketing and Communications; Nita Prabowo, Account Manager, Integrated Marketing and Communications; Okhi, Web Developer, PNTR Group (ID), Kei Obusan, Insights Director; Daffi Ranandi, Insights Manager, Radarr (SG), Gautam Reghunath, Co-founder & CEO, Talented (IN), Donagh Humphreys, Head of Social and Digital Innovation, THINKHOUSE (IRE), Sarah Yim, Strategy Director, Zulu Alpha Kilo (CA).
Trends In Paid Search: Navigating The Digital Landscape In 2024
The search marketing landscape is evolving rapidly with new technologies, and professionals, like you, rely on innovative paid search strategies to meet changing demands.
It’s important that you’re ready to implement new strategies in 2024.
Check this out and learn the top trends in paid search advertising that are expected to gain traction, so you can drive higher ROI more efficiently in 2024.
You’ll learn:
- The latest trends in AI and automation, and what this means for an evolving paid search ecosystem.
- New developments in privacy and data regulation.
- Emerging ad formats that are expected to make an impact next year.
Watch Sreekant Lanka from iQuanti and Irina Klein from OneMain Financial as they dive into the future of paid search and explore the trends, strategies, and technologies that will shape the search marketing landscape.
If you’re looking to assess your paid search strategy and design an industry-aligned plan for 2024, then this webinar is for you.
More Related Content
Recently uploaded
Office Building for Sale - 2810 City View Drive, Madison, WI
36,778 sq. ft. building; Zoning: SE (Suburban Employment): The (SE) District allows numerous commercial site uses; Passenger elevator; Private and common restrooms; Fully sprinkled; Data center with a grounded floor and a specialized HVAC system; 60 KVA back-up generator; Building/pylon signage; Potential to purchase adjacent parcels; Sale Price: $4,413,360
Why is Revit MEP Outsourcing considered an as good option for construction pr...
Outsourcing MEP modeling services require effective collaboration and coordination amongst multiple engineering trades. The engineers and the designers often change the details of the MEP projects, but the work of Revit MEP drafting services is having the master plan and model of the complete project. To have proper coordination and installation, there is a need to execute the project effectively. Hence, the work of Revit family creation facilitates the MEP engineers.
Listing Turkey - Piyalepasa Istanbul Catalog
We are working around the clock to transform a long-time dream into reality. As a result, Piyalepasa Istanbul will be the largest privately developed urban regeneration project in Turkey.
THE NEIGHBORHOOD WE HAVE BEEN LONGING FOR IS COMING TO LIFE
The good old days of the Piyalepasa neighborhood are being brought back to life with Piyalepasa Istanbul houses, residences, offices, hotels and a pedestrianized shopping avenue.
The wide streets of this 82.000 square meter development conveniently face the main boulevard in a prime Beyoglu location. “Piyalepaşa İstanbul” stands out as the only project designed to offer a neighborhood lifestyle, complete with its grocers, bagel sellers and greengrocer. Piyalepasa Istanbul has all the values to make it an authentic neighborhood, our very own community.
A NEIGHBORHOOD FULL OF LIFE, IN THE HEART OF THE CITY!
“Piyalepaşa İstanbul” is a “mixed-use” concept containing all the elements for a vibrant social life with houses, residences, offices, hotels and high street shopping.
“Piyalepaşa İstanbul” will take the liveliness of Istanbul into its heart. The elegant sparkle of Nisantasi, the young and colorful Besiktas, the variety and multicultural heritage of Istiklal Street will all be contained within the streets of this neighborhood.
“Piyalepaşa İstanbul” bears traces of the most beautiful examples of Turkish architecture from the Seljuks to the Ottomans and from Anatolia to Rumelia. With its graded facades, wide eaves, bay windows, pools, and interior courtyard systems, it offers a new living space without disrupting the city’s silhouette and neighborhood.
“Piyalepaşa İstanbul” is the new attraction of this splendid city.
TO BE AT THE CENTER OF ISTANBUL… THIS IS REAL LUXURY!
With its proximity to D-100 highway, connecting roads and tunnels, “Piyalepaşa İstanbul” is only minutes away from Kabatas, Besiktas, the Golden Horn and Karakoy.
“Piyalepaşa İstanbul” is close to the prestigious new Istanbul Court House, a major hospital, the Perpa trade center and the city’s most lively neighborhoods. With its shuttle service to Okmeydani Metrobus station, Sishane and the Court House subway stations, “Piyalepaşa İstanbul” will provide you with the most convenient transport connections.
https://listingturkey.com/property/piyalepasa-istanbul/
Future of andhra pradesh real estate.pdf
Andhra Pradesh, known for its strategic location on the southeastern coast of India, has emerged as a key player in India’s industrial landscape. Over the decades, the state has witnessed significant growth across various sectors,
Living in an UBER World - June '24 Sales Meeting
June 2024 Lancaster County Sales Meeting for Berkshire Hathaway HomeServices Homesale Realty covering the following topics: 1. VA Suspends Buyer Agent Payment Plan (article), 2. Frequently Used Terms in title, 3. Zillow Showcase Overview, 4. QuickBuy commission promotion, 5. Documenting Cooperative Compensation, 6. NAR's Code of Ethics - Mass Media Solicitations, 7. Is it really cheaper to rent? 8. Do's and Don't's when Terminating the Agreement of Sale, 9. Living in an UBER World
Anilesh Ahuja Pioneering a Paradigm Shift in Real Estate Success.pptx
Anilesh Ahuja journey is a testament to the power of vision, resilience, and unwavering determination. As a visionary leader, he continues to inspire and empower others to dream big and challenge the status quo. His legacy extends far beyond the realm of real estate, leaving an indelible mark on the industry and the world at large.
Sunrise Infra Properties Company Profile Pradeep.pdf
COmpany Profile of SunRise Infra Properties Pvt. Ltd.
SVN Live 6.17.24 Weekly Property Broadcast
The SVN® organization shares a portion of their new weekly listings via their SVN Live® Weekly Property Broadcast. Visit https://svn.com/svn-live/ if you would like to attend our weekly call, which we open up to the brokerage community.
Signature Global TITANIUM SPR | 3.5 & 4.5BHK High rise Apartments in Gurgaon
Signature Global TITANIUM SPR launched a high rise apartments in Gurgaon . In this project Signature Global offers 3.5 & 4.5 BHK high rise Apartment at sector 71 Gurgaon SPR Road. Signature Global Titanium SPR is IGBC Gold certified, a testament to our commitment to sustainability.
Stark Builders: Where Quality Meets Craftsmanship!
At Stark Builders our vision is to redefine the renovation experience by combining both stunning design and high quality construction skills. We believe that by delivering both these key aspects together we are able to achieve incredible results for our clients and ensure every project reflects their vision and enhances their lifestyle.
Although we are not all related by blood we have created a team of highly professional and hardworking individuals who share the common goal of delivering beautiful and functional renovated spaces. Our tight nit team are able to work together in a way where we pour our passion into each and every project as we have a love for what we do. Building is our life.
Floople Real Estate Market in the UK - Current Trends and Future Prospects
Housing prices, rental rates, market demand, and investment trends
Recently uploaded (11)
Office Building for Sale - 2810 City View Drive, Madison, WI
Office Building for Sale - 2810 City View Drive, Madison, WI
Why is Revit MEP Outsourcing considered an as good option for construction pr...
Why is Revit MEP Outsourcing considered an as good option for construction pr...
Anilesh Ahuja Pioneering a Paradigm Shift in Real Estate Success.pptx
Anilesh Ahuja Pioneering a Paradigm Shift in Real Estate Success.pptx
Sunrise Infra Properties Company Profile Pradeep.pdf
Sunrise Infra Properties Company Profile Pradeep.pdf
Signature Global TITANIUM SPR | 3.5 & 4.5BHK High rise Apartments in Gurgaon
Signature Global TITANIUM SPR | 3.5 & 4.5BHK High rise Apartments in Gurgaon
Stark Builders: Where Quality Meets Craftsmanship!
Stark Builders: Where Quality Meets Craftsmanship!
Floople Real Estate Market in the UK - Current Trends and Future Prospects
Floople Real Estate Market in the UK - Current Trends and Future Prospects
Featured
2024 State of Marketing Report – by Hubspot
https://www.hubspot.com/state-of-marketing
· Scaling relationships and proving ROI
· Social media is the place for search, sales, and service
· Authentic influencer partnerships fuel brand growth
· The strongest connections happen via call, click, chat, and camera.
· Time saved with AI leads to more creative work
· Seeking: A single source of truth
· TLDR; Get on social, try AI, and align your systems.
· More human marketing, powered by robots
Everything You Need To Know About ChatGPT
ChatGPT is a revolutionary addition to the world since its introduction in 2022. A big shift in the sector of information gathering and processing happened because of this chatbot. What is the story of ChatGPT? How is the bot responding to prompts and generating contents? Swipe through these slides prepared by Expeed Software, a web development company regarding the development and technical intricacies of ChatGPT!
Product Design Trends in 2024 | Teenage Engineerings
The realm of product design is a constantly changing environment where technology and style intersect. Every year introduces fresh challenges and exciting trends that mold the future of this captivating art form. In this piece, we delve into the significant trends set to influence the look and functionality of product design in the year 2024.
How Race, Age and Gender Shape Attitudes Towards Mental Health
Mental health has been in the news quite a bit lately. Dozens of U.S. states are currently suing Meta for contributing to the youth mental health crisis by inserting addictive features into their products, while the U.S. Surgeon General is touring the nation to bring awareness to the growing epidemic of loneliness and isolation. The country has endured periods of low national morale, such as in the 1970s when high inflation and the energy crisis worsened public sentiment following the Vietnam War. The current mood, however, feels different. Gallup recently reported that national mental health is at an all-time low, with few bright spots to lift spirits.
To better understand how Americans are feeling and their attitudes towards mental health in general, ThinkNow conducted a nationally representative quantitative survey of 1,500 respondents and found some interesting differences among ethnic, age and gender groups.
Technology
For example, 52% agree that technology and social media have a negative impact on mental health, but when broken out by race, 61% of Whites felt technology had a negative effect, and only 48% of Hispanics thought it did.
While technology has helped us keep in touch with friends and family in faraway places, it appears to have degraded our ability to connect in person. Staying connected online is a double-edged sword since the same news feed that brings us pictures of the grandkids and fluffy kittens also feeds us news about the wars in Israel and Ukraine, the dysfunction in Washington, the latest mass shooting and the climate crisis.
Hispanics may have a built-in defense against the isolation technology breeds, owing to their large, multigenerational households, strong social support systems, and tendency to use social media to stay connected with relatives abroad.
Age and Gender
When asked how individuals rate their mental health, men rate it higher than women by 11 percentage points, and Baby Boomers rank it highest at 83%, saying it’s good or excellent vs. 57% of Gen Z saying the same.
Gen Z spends the most amount of time on social media, so the notion that social media negatively affects mental health appears to be correlated. Unfortunately, Gen Z is also the generation that’s least comfortable discussing mental health concerns with healthcare professionals. Only 40% of them state they’re comfortable discussing their issues with a professional compared to 60% of Millennials and 65% of Boomers.
Race Affects Attitudes
As seen in previous research conducted by ThinkNow, Asian Americans lag other groups when it comes to awareness of mental health issues. Twenty-four percent of Asian Americans believe that having a mental health issue is a sign of weakness compared to the 16% average for all groups. Asians are also considerably less likely to be aware of mental health services in their communities (42% vs. 55%) and most likely to seek out information on social media (51% vs. 35%).
AI Trends in Creative Operations 2024 by Artwork Flow.pdf
Creative operations teams expect increased AI use in 2024. Currently, over half of tasks are not AI-enabled, but this is expected to decrease in the coming year. ChatGPT is the most popular AI tool currently. Business leaders are more actively exploring AI benefits than individual contributors. Most respondents do not believe AI will impact workforce size in 2024. However, some inhibitions still exist around AI accuracy and lack of understanding. Creatives primarily want to use AI to save time on mundane tasks and boost productivity.
Skeleton Culture Code
Organizational culture includes values, norms, systems, symbols, language, assumptions, beliefs, and habits that influence employee behaviors and how people interpret those behaviors. It is important because culture can help or hinder a company's success. Some key aspects of Netflix's culture that help it achieve results include hiring smartly so every position has stars, focusing on attitude over just aptitude, and having a strict policy against peacocks, whiners, and jerks.
PEPSICO Presentation to CAGNY Conference Feb 2024
PepsiCo provided a safe harbor statement noting that any forward-looking statements are based on currently available information and are subject to risks and uncertainties. It also provided information on non-GAAP measures and directing readers to its website for disclosure and reconciliation. The document then discussed PepsiCo's business overview, including that it is a global beverage and convenient food company with iconic brands, $91 billion in net revenue in 2023, and nearly $14 billion in core operating profit. It operates through a divisional structure with a focus on local consumers.
Content Methodology: A Best Practices Report (Webinar)
This document provides an overview of content methodology best practices. It defines content methodology as establishing objectives, KPIs, and a culture of continuous learning and iteration. An effective methodology focuses on connecting with audiences, creating optimal content, and optimizing processes. It also discusses why a methodology is needed due to the competitive landscape, proliferation of channels, and opportunities for improvement. Components of an effective methodology include defining objectives and KPIs, audience analysis, identifying opportunities, and evaluating resources. The document concludes with recommendations around creating a content plan, testing and optimizing content over 90 days.
How to Prepare For a Successful Job Search for 2024
The document provides guidance on preparing a job search for 2024. It discusses the state of the job market, focusing on growth in AI and healthcare but also continued layoffs. It recommends figuring out what you want to do by researching interests and skills, then conducting informational interviews. The job search should involve building a personal brand on LinkedIn, actively applying to jobs, tailoring resumes and interviews, maintaining job hunting as a habit, and continuing self-improvement. Once hired, the document advises setting new goals and keeping skills and networking active in case of future opportunities.
Social Media Marketing Trends 2024 // The Global Indie Insights
A report by thenetworkone and Kurio.
The contributing experts and agencies are (in an alphabetical order): Sylwia Rytel, Social Media Supervisor, 180heartbeats + JUNG v MATT (PL), Sharlene Jenner, Vice President - Director of Engagement Strategy, Abelson Taylor (USA), Alex Casanovas, Digital Director, Atrevia (ES), Dora Beilin, Senior Social Strategist, Barrett Hoffher (USA), Min Seo, Campaign Director, Brand New Agency (KR), Deshé M. Gully, Associate Strategist, Day One Agency (USA), Francesca Trevisan, Strategist, Different (IT), Trevor Crossman, CX and Digital Transformation Director; Olivia Hussey, Strategic Planner; Simi Srinarula, Social Media Manager, The Hallway (AUS), James Hebbert, Managing Director, Hylink (CN / UK), Mundy Álvarez, Planning Director; Pedro Rojas, Social Media Manager; Pancho González, CCO, Inbrax (CH), Oana Oprea, Head of Digital Planning, Jam Session Agency (RO), Amy Bottrill, Social Account Director, Launch (UK), Gaby Arriaga, Founder, Leonardo1452 (MX), Shantesh S Row, Creative Director, Liwa (UAE), Rajesh Mehta, Chief Strategy Officer; Dhruv Gaur, Digital Planning Lead; Leonie Mergulhao, Account Supervisor - Social Media & PR, Medulla (IN), Aurelija Plioplytė, Head of Digital & Social, Not Perfect (LI), Daiana Khaidargaliyeva, Account Manager, Osaka Labs (UK / USA), Stefanie Söhnchen, Vice President Digital, PIABO Communications (DE), Elisabeth Winiartati, Managing Consultant, Head of Global Integrated Communications; Lydia Aprina, Account Manager, Integrated Marketing and Communications; Nita Prabowo, Account Manager, Integrated Marketing and Communications; Okhi, Web Developer, PNTR Group (ID), Kei Obusan, Insights Director; Daffi Ranandi, Insights Manager, Radarr (SG), Gautam Reghunath, Co-founder & CEO, Talented (IN), Donagh Humphreys, Head of Social and Digital Innovation, THINKHOUSE (IRE), Sarah Yim, Strategy Director, Zulu Alpha Kilo (CA).
Trends In Paid Search: Navigating The Digital Landscape In 2024
The search marketing landscape is evolving rapidly with new technologies, and professionals, like you, rely on innovative paid search strategies to meet changing demands.
It’s important that you’re ready to implement new strategies in 2024.
Check this out and learn the top trends in paid search advertising that are expected to gain traction, so you can drive higher ROI more efficiently in 2024.
You’ll learn:
- The latest trends in AI and automation, and what this means for an evolving paid search ecosystem.
- New developments in privacy and data regulation.
- Emerging ad formats that are expected to make an impact next year.
Watch Sreekant Lanka from iQuanti and Irina Klein from OneMain Financial as they dive into the future of paid search and explore the trends, strategies, and technologies that will shape the search marketing landscape.
If you’re looking to assess your paid search strategy and design an industry-aligned plan for 2024, then this webinar is for you.
5 Public speaking tips from TED - Visualized summary
From their humble beginnings in 1984, TED has grown into the world’s most powerful amplifier for speakers and thought-leaders to share their ideas. They have over 2,400 filmed talks (not including the 30,000+ TEDx videos) freely available online, and have hosted over 17,500 events around the world.
With over one billion views in a year, it’s no wonder that so many speakers are looking to TED for ideas on how to share their message more effectively.
The article “5 Public-Speaking Tips TED Gives Its Speakers”, by Carmine Gallo for Forbes, gives speakers five practical ways to connect with their audience, and effectively share their ideas on stage.
Whether you are gearing up to get on a TED stage yourself, or just want to master the skills that so many of their speakers possess, these tips and quotes from Chris Anderson, the TED Talks Curator, will encourage you to make the most impactful impression on your audience.
See the full article and more summaries like this on SpeakerHub here: https://speakerhub.com/blog/5-presentation-tips-ted-gives-its-speakers
See the original article on Forbes here:
http://www.forbes.com/forbes/welcome/?toURL=http://www.forbes.com/sites/carminegallo/2016/05/06/5-public-speaking-tips-ted-gives-its-speakers/&refURL=&referrer=#5c07a8221d9b
ChatGPT and the Future of Work - Clark Boyd
Everyone is in agreement that ChatGPT (and other generative AI tools) will shape the future of work. Yet there is little consensus on exactly how, when, and to what extent this technology will change our world.
Businesses that extract maximum value from ChatGPT will use it as a collaborative tool for everything from brainstorming to technical maintenance.
For individuals, now is the time to pinpoint the skills the future professional will need to thrive in the AI age.
Check out this presentation to understand what ChatGPT is, how it will shape the future of work, and how you can prepare to take advantage.
Getting into the tech field. what next
The document provides career advice for getting into the tech field, including:
- Doing projects and internships in college to build a portfolio.
- Learning about different roles and technologies through industry research.
- Contributing to open source projects to build experience and network.
- Developing a personal brand through a website and social media presence.
- Networking through events, communities, and finding a mentor.
- Practicing interviews through mock interviews and whiteboarding coding questions.
Google's Just Not That Into You: Understanding Core Updates & Search Intent
1. Core updates from Google periodically change how its algorithms assess and rank websites and pages. This can impact rankings through shifts in user intent, site quality issues being caught up to, world events influencing queries, and overhauls to search like the E-A-T framework.
2. There are many possible user intents beyond just transactional, navigational and informational. Identifying intent shifts is important during core updates. Sites may need to optimize for new intents through different content types and sections.
3. Responding effectively to core updates requires analyzing "before and after" data to understand changes, identifying new intents or page types, and ensuring content matches appropriate intents across video, images, knowledge graphs and more.
How to have difficult conversations
Stop putting off having difficult conversations. Seven practical tips to ensure your next difficult conversation go smoothly.
Introduction to Data Science
A brief introduction to DataScience with explaining of the concepts, algorithms, machine learning, supervised and unsupervised learning, clustering, statistics, data preprocessing, real-world applications etc.
It's part of a Data Science Corner Campaign where I will be discussing the fundamentals of DataScience, AIML, Statistics etc.
Time Management & Productivity - Best Practices
Here's my presentation on by proven best practices how to manage your work time effectively and how to improve your productivity. It includes practical tips and how to use tools such as Slack, Google Apps, Hubspot, Google Calendar, Gmail and others.
The six step guide to practical project management
The six step guide to practical project management
If you think managing projects is too difficult, think again.
We’ve stripped back project management processes to the
basics – to make it quicker and easier, without sacrificing
the vital ingredients for success.
“If you’re looking for some real-world guidance, then The Six Step Guide to Practical Project Management will help.”
Dr Andrew Makar, Tactical Project Management
Beginners Guide to TikTok for Search - Rachel Pearson - We are Tilt __ Bright...
A presentation for absolute beginners who have never touched TikTok and may be a bit scared of it!
Featured (20)
Product Design Trends in 2024 | Teenage Engineerings
Product Design Trends in 2024 | Teenage Engineerings
How Race, Age and Gender Shape Attitudes Towards Mental Health
How Race, Age and Gender Shape Attitudes Towards Mental Health
AI Trends in Creative Operations 2024 by Artwork Flow.pdf
AI Trends in Creative Operations 2024 by Artwork Flow.pdf
Content Methodology: A Best Practices Report (Webinar)
Content Methodology: A Best Practices Report (Webinar)
How to Prepare For a Successful Job Search for 2024
How to Prepare For a Successful Job Search for 2024
Social Media Marketing Trends 2024 // The Global Indie Insights
Social Media Marketing Trends 2024 // The Global Indie Insights
Trends In Paid Search: Navigating The Digital Landscape In 2024
Trends In Paid Search: Navigating The Digital Landscape In 2024
5 Public speaking tips from TED - Visualized summary
5 Public speaking tips from TED - Visualized summary
Google's Just Not That Into You: Understanding Core Updates & Search Intent
Google's Just Not That Into You: Understanding Core Updates & Search Intent
The six step guide to practical project management
The six step guide to practical project management
Beginners Guide to TikTok for Search - Rachel Pearson - We are Tilt __ Bright...
Beginners Guide to TikTok for Search - Rachel Pearson - We are Tilt __ Bright...
2011 austin real estate market stats
- 1. Austin Single Family Home Sales 3500 3000 2500 2000 1500 1000 500 0 Jan Feb Mar Apr May Jun Jul Aug Sep Oct Nov Dec 2002 2003 2004 2005 2006 2007 2008 2009 2010 2011 Data Source: Real Estate Center at Texas A&M University and ABoR Information deemed reliable but not guaranteed 1/20/2012 Outlaw Real Estate Group/Private Label Realty
- 2. Austin Single Family Listings 12000 10000 8000 6000 4000 Jan Feb Mar Apr May Jun Jul Aug Sep Oct Nov Dec 2002 2003 2004 2005 2006 2007 2008 2009 2010 2011 Data Source: Real Estate Center at Texas A&M University and ABoR Information deemed reliable but not guaranteed 1/20/2012 Outlaw Real Estate Group/Private Label Realty
- 3. Austin Single Family Months of Inventory 12 10 8 6 4 2 0 Jan Feb Mar Apr May Jun Jul Aug Sep Oct Nov Dec 2002 2003 2004 2005 2006 2007 2008 2009 2010 2011 Data Source: Real Estate Center at Texas A&M University and ABoR Information deemed reliable but not guaranteed 1/20/2012 Outlaw Real Estate Group/Private Label Realty
- 4. Austin Single Family Median Home Values 250000 225000 200000 175000 150000 125000 100000 Jan Feb Mar Apr May Jun Jul Aug Sep Oct Nov Dec 2002 2003 2004 2005 2006 2007 2008 2009 2010 2011 Data Source: Real Estate Center at Texas A&M University and ABoR Information deemed reliable but not guaranteed 1/20/2012 Outlaw Real Estate Group/Private Label Realty