Bad App - Killer App: How to Create a Compelling Mobile ExperienceAchillesMedia
Mobile applications are becoming more and more popular as a way to engage and entertain an ever-growing smartphone population on the go. How can you tap into this market and deploy a mobile strategy for your multiple customers? Join Plastic Mobile's VP of Creative, Chris May, as he guides marketers, designers and developers through the core concepts you should consider to make your next app a success.
These are the slides for my Public Sphere #2 presentation on 22nd June, 2009. You can also watch a video recoding of this presentation here http://vimeo.com/5330548
Consumer behavior has changed. The way people search and discover products and services are fundamentally different than what they used to be. How have your acquisition strategies changes? Joanna will be covering some effective tactics for customer acquisition in today’s social connection-driven landscape. Listen in to hear of new channels, new triggers, and new opportunities for you to gain traffic, leads and loyalty.
Dear Students
We can help you to write total dissertation/project report.
Our 9 step method of project writing:-
Step 1) Helping you in Selection of topic.
Step 2) Group discussion / conference call with in team of professors.
Step 3) Helping you in Preparation of Synopsis/ proposal & sent to project guide
QNBFS Daily Market Report December 24, 2023QNB Group
The QE Index rose 0.8% to close at 10,285.3. Gains were led by the Transportation and Banks & Financial Services indices, gaining 1.4% and 1.2%, respectively.
QNBFS Daily Market Report October 04, 2023QNB Group
The QE Index rose 0.2% to close at 10,273.3. Gains were led by the Transportation and Consumer Goods & Services indices, gaining 1.7% and 0.1%, respectively.
QNBFS Daily Technical Trader Qatar - October 04, 2023 التحليل الفني اليومي لب...QNB Group
The General Index failed to sustain its breakout above the double-bottom formation’s neckline and continued with its decline into the formation’s territory.
QNBFS Daily Technical Trader Qatar - September 28, 2023 التحليل الفني اليومي ...QNB Group
The General Index failed to sustain its breakout above the double-bottom formation’s neckline and continued with its decline into the formation’s territory.
QNBFS Daily Market Report September 24, 2023QNB Group
The QE Index rose 0.3% to close at 10,323.0. Gains were led by the Transportation and Industrials indices, gaining 0.8% each. Top gainers were Qatar Navigation and Al Khaleej Takaful Insurance Co., rising 3.3% and 2.0%, respectively.
QNBFS Daily Technical Trader Qatar - September 24, 2023 التحليل الفني اليومي ...QNB Group
The General Index failed to sustain its breakout above the double-bottom formation’s neckline and continued with its decline into the formation’s territory.
QNBFS Daily Technical Trader Qatar - September 19, 2023 التحليل الفني اليومي ...QNB Group
The General Index failed to sustain its breakout above the double-bottom formation’s neckline and continued with its decline into the formation’s territory.
QNBFS Daily Market Report September 17, 2023QNB Group
The QE Index declined 0.5% to close at 10,319.3. Losses were led by the Industrials and Consumer Goods & Services indices, falling 1.4% and 1.1%, respectively.
QNBFS Daily Technical Trader Qatar - September 07, 2023 التحليل الفني اليومي ...QNB Group
The General Index failed to
sustain its breakout above the
double-bottom formation’s
neckline and continued with
its decline into the
formation’s territory.
USDA Loans in California: A Comprehensive Overview.pptxmarketing367770
USDA Loans in California: A Comprehensive Overview
If you're dreaming of owning a home in California's rural or suburban areas, a USDA loan might be the perfect solution. The U.S. Department of Agriculture (USDA) offers these loans to help low-to-moderate-income individuals and families achieve homeownership.
Key Features of USDA Loans:
Zero Down Payment: USDA loans require no down payment, making homeownership more accessible.
Competitive Interest Rates: These loans often come with lower interest rates compared to conventional loans.
Flexible Credit Requirements: USDA loans have more lenient credit score requirements, helping those with less-than-perfect credit.
Guaranteed Loan Program: The USDA guarantees a portion of the loan, reducing risk for lenders and expanding borrowing options.
Eligibility Criteria:
Location: The property must be located in a USDA-designated rural or suburban area. Many areas in California qualify.
Income Limits: Applicants must meet income guidelines, which vary by region and household size.
Primary Residence: The home must be used as the borrower's primary residence.
Application Process:
Find a USDA-Approved Lender: Not all lenders offer USDA loans, so it's essential to choose one approved by the USDA.
Pre-Qualification: Determine your eligibility and the amount you can borrow.
Property Search: Look for properties in eligible rural or suburban areas.
Loan Application: Submit your application, including financial and personal information.
Processing and Approval: The lender and USDA will review your application. If approved, you can proceed to closing.
USDA loans are an excellent option for those looking to buy a home in California's rural and suburban areas. With no down payment and flexible requirements, these loans make homeownership more attainable for many families. Explore your eligibility today and take the first step toward owning your dream home.
how to sell pi coins on Bitmart crypto exchangeDOT TECH
Yes. Pi network coins can be exchanged but not on bitmart exchange. Because pi network is still in the enclosed mainnet. The only way pioneers are able to trade pi coins is by reselling the pi coins to pi verified merchants.
A verified merchant is someone who buys pi network coins and resell it to exchanges looking forward to hold till mainnet launch.
I will leave the telegram contact of my personal pi merchant to trade with.
@Pi_vendor_247
how to swap pi coins to foreign currency withdrawable.DOT TECH
As of my last update, Pi is still in the testing phase and is not tradable on any exchanges.
However, Pi Network has announced plans to launch its Testnet and Mainnet in the future, which may include listing Pi on exchanges.
The current method for selling pi coins involves exchanging them with a pi vendor who purchases pi coins for investment reasons.
If you want to sell your pi coins, reach out to a pi vendor and sell them to anyone looking to sell pi coins from any country around the globe.
Below is the contact information for my personal pi vendor.
Telegram: @Pi_vendor_247
Even tho Pi network is not listed on any exchange yet.
Buying/Selling or investing in pi network coins is highly possible through the help of vendors. You can buy from vendors[ buy directly from the pi network miners and resell it]. I will leave the telegram contact of my personal vendor.
@Pi_vendor_247
how to sell pi coins effectively (from 50 - 100k pi)DOT TECH
Anywhere in the world, including Africa, America, and Europe, you can sell Pi Network Coins online and receive cash through online payment options.
Pi has not yet been launched on any exchange because we are currently using the confined Mainnet. The planned launch date for Pi is June 28, 2026.
Reselling to investors who want to hold until the mainnet launch in 2026 is currently the sole way to sell.
Consequently, right now. All you need to do is select the right pi network provider.
Who is a pi merchant?
An individual who buys coins from miners on the pi network and resells them to investors hoping to hang onto them until the mainnet is launched is known as a pi merchant.
debuts.
I'll provide you the Telegram username
@Pi_vendor_247
How to get verified on Coinbase Account?_.docxBuy bitget
t's important to note that buying verified Coinbase accounts is not recommended and may violate Coinbase's terms of service. Instead of searching to "buy verified Coinbase accounts," follow the proper steps to verify your own account to ensure compliance and security.
Turin Startup Ecosystem 2024 - Ricerca sulle Startup e il Sistema dell'Innov...Quotidiano Piemontese
Turin Startup Ecosystem 2024
Una ricerca de il Club degli Investitori, in collaborazione con ToTeM Torino Tech Map e con il supporto della ESCP Business School e di Growth Capital
Introduction to Indian Financial System ()Avanish Goel
The financial system of a country is an important tool for economic development of the country, as it helps in creation of wealth by linking savings with investments.
It facilitates the flow of funds form the households (savers) to business firms (investors) to aid in wealth creation and development of both the parties
The European Unemployment Puzzle: implications from population agingGRAPE
We study the link between the evolving age structure of the working population and unemployment. We build a large new Keynesian OLG model with a realistic age structure, labor market frictions, sticky prices, and aggregate shocks. Once calibrated to the European economy, we quantify the extent to which demographic changes over the last three decades have contributed to the decline of the unemployment rate. Our findings yield important implications for the future evolution of unemployment given the anticipated further aging of the working population in Europe. We also quantify the implications for optimal monetary policy: lowering inflation volatility becomes less costly in terms of GDP and unemployment volatility, which hints that optimal monetary policy may be more hawkish in an aging society. Finally, our results also propose a partial reversal of the European-US unemployment puzzle due to the fact that the share of young workers is expected to remain robust in the US.
Financial Assets: Debit vs Equity Securities.pptxWrito-Finance
financial assets represent claim for future benefit or cash. Financial assets are formed by establishing contracts between participants. These financial assets are used for collection of huge amounts of money for business purposes.
Two major Types: Debt Securities and Equity Securities.
Debt Securities are Also known as fixed-income securities or instruments. The type of assets is formed by establishing contracts between investor and issuer of the asset.
• The first type of Debit securities is BONDS. Bonds are issued by corporations and government (both local and national government).
• The second important type of Debit security is NOTES. Apart from similarities associated with notes and bonds, notes have shorter term maturity.
• The 3rd important type of Debit security is TRESURY BILLS. These securities have short-term ranging from three months, six months, and one year. Issuer of such securities are governments.
• Above discussed debit securities are mostly issued by governments and corporations. CERTIFICATE OF DEPOSITS CDs are issued by Banks and Financial Institutions. Risk factor associated with CDs gets reduced when issued by reputable institutions or Banks.
Following are the risk attached with debt securities: Credit risk, interest rate risk and currency risk
There are no fixed maturity dates in such securities, and asset’s value is determined by company’s performance. There are two major types of equity securities: common stock and preferred stock.
Common Stock: These are simple equity securities and bear no complexities which the preferred stock bears. Holders of such securities or instrument have the voting rights when it comes to select the company’s board of director or the business decisions to be made.
Preferred Stock: Preferred stocks are sometime referred to as hybrid securities, because it contains elements of both debit security and equity security. Preferred stock confers ownership rights to security holder that is why it is equity instrument
<a href="https://www.writofinance.com/equity-securities-features-types-risk/" >Equity securities </a> as a whole is used for capital funding for companies. Companies have multiple expenses to cover. Potential growth of company is required in competitive market. So, these securities are used for capital generation, and then uses it for company’s growth.
Concluding remarks
Both are employed in business. Businesses are often established through debit securities, then what is the need for equity securities. Companies have to cover multiple expenses and expansion of business. They can also use equity instruments for repayment of debits. So, there are multiple uses for securities. As an investor, you need tools for analysis. Investment decisions are made by carefully analyzing the market. For better analysis of the stock market, investors often employ financial analysis of companies.
how to sell pi coins in all Africa Countries.DOT TECH
Yes. You can sell your pi network for other cryptocurrencies like Bitcoin, usdt , Ethereum and other currencies And this is done easily with the help from a pi merchant.
What is a pi merchant ?
Since pi is not launched yet in any exchange. The only way you can sell right now is through merchants.
A verified Pi merchant is someone who buys pi network coins from miners and resell them to investors looking forward to hold massive quantities of pi coins before mainnet launch in 2026.
I will leave the telegram contact of my personal pi merchant to trade with.
@Pi_vendor_247
how to sell pi coins in South Korea profitably.DOT TECH
Yes. You can sell your pi network coins in South Korea or any other country, by finding a verified pi merchant
What is a verified pi merchant?
Since pi network is not launched yet on any exchange, the only way you can sell pi coins is by selling to a verified pi merchant, and this is because pi network is not launched yet on any exchange and no pre-sale or ico offerings Is done on pi.
Since there is no pre-sale, the only way exchanges can get pi is by buying from miners. So a pi merchant facilitates these transactions by acting as a bridge for both transactions.
How can i find a pi vendor/merchant?
Well for those who haven't traded with a pi merchant or who don't already have one. I will leave the telegram id of my personal pi merchant who i trade pi with.
Tele gram: @Pi_vendor_247
#pi #sell #nigeria #pinetwork #picoins #sellpi #Nigerian #tradepi #pinetworkcoins #sellmypi
Currently pi network is not tradable on binance or any other exchange because we are still in the enclosed mainnet.
Right now the only way to sell pi coins is by trading with a verified merchant.
What is a pi merchant?
A pi merchant is someone verified by pi network team and allowed to barter pi coins for goods and services.
Since pi network is not doing any pre-sale The only way exchanges like binance/huobi or crypto whales can get pi is by buying from miners. And a merchant stands in between the exchanges and the miners.
I will leave the telegram contact of my personal pi merchant. I and my friends has traded more than 6000pi coins successfully
Tele-gram
@Pi_vendor_247
Falcon stands out as a top-tier P2P Invoice Discounting platform in India, bridging esteemed blue-chip companies and eager investors. Our goal is to transform the investment landscape in India by establishing a comprehensive destination for borrowers and investors with diverse profiles and needs, all while minimizing risk. What sets Falcon apart is the elimination of intermediaries such as commercial banks and depository institutions, allowing investors to enjoy higher yields.
1. Page 1 of 2
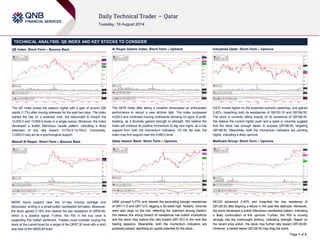
TECHNICAL ANALYSIS: QE INDEX AND KEY STOCKS TO CONSIDER
QE Index: Short-Term – Bounce Back
The QE Index ended the session higher with a gain of around 228
points (1.7%) after moving sideways for the past two days. The index
started the day on a subdued note, but rebounded to breach the
13,500.0 and 13,600.0 levels in a single swoop. Moreover, the index
developed a bullish Marubozu candle pattern, indicating a likely
extension of this rally toward 13,700.0-13,750.0. Conversely,
13,600.0 may act as a psychological support.
Masraf Al Rayan: Short-Term – Bounce Back
MARK found support near the 21-day moving average and
rebounded, ending in a small bullish candlestick formation. Moreover,
the stock gained 2.19% and cleared the key resistance of QR55.80,
which is a positive signal. Further, the RSI in the buy zone is
supporting this bullish sentiment. Traders could consider buying the
stock at the current level for a target of the QR57.30 level with a strict
stop loss of the QR55.80 level.
Al Rayan Islamic Index: Short-Term – Uptrend
The QERI Index after taking a breather showcased an enthusiastic
performance to record a new all-time high. The index surpassed
4,639.0 and continued moving northwards showing no signs of profit-
booking, as it fervently gained strength to strength. We believe the
index will continue its positive momentum to tag new highs, as it has
support from both the momentum indicators. On the flip side, the
index may find support near the 4,685.0 level.
Qatar Islamic Bank: Short-Term – Upmove
QIBK jumped 4.07% and cleared the ascending triangle resistances
of QR111.0 and QR112.5, tagging a 52-week high. Notably, volumes
were also large on the rise, reflecting the optimism among traders.
We believe this strong breach of resistances has bullish implications
and the stock may extend this rally toward QR118.0 in the next few
trading sessions. Meanwhile, both the momentum indicators are
positively poised, signifying an upside potential for the stock.
Industries Qatar: Short-Term – Upmove
IQCD moved higher on the expected scenario yesterday, and gained
2.42%, breaching both its resistances of QR183.10 and QR184.50.
The stock is currently sitting exactly on its resistance of QR186.40.
We believe the current higher push and a spike in volumes suggest
that the stock has enough steam to surpass QR186.40, targeting
QR188.50. Meanwhile, both the momentum indicators are pointing
higher, indicating a likely upmove.
Medicare Group: Short-Term – Upmove
MCGS advanced 2.40% and breached the key resistance of
QR126.50 after feigning a failure in the past few attempts. Moreover,
the stock developed a bullish Marubozu candlestick pattern, indicating
a likely continuation of this upmove. Further, the RSI is moving
strongly into the overbought territory, indicating strength. Based on
the recent price action, the stock may further rally toward QR128.80.
However, a retreat below QR126.50 may drag the stock.
2. Contacts
Saugata Sarkar Abdullah Amin, CFA Shahan Keushgerian Sahbi Kasraoui Ahmed Al-Khoudary QNB Financial Services SPC
Head of Research Senior Research Analyst Senior Research Analyst Manager - HNWI Head of Sales Trading – Institutional Contact Center: (+974) 4476 6666
Tel: (+974) 4476 6534 Tel: (+974) 4476 6569 Tel: (+974) 4476 6509 Tel: (+974) 4476 6544 Tel: (+974) 4476 6548 PO Box 24025
saugata.sarkar@qnbfs.com.qa abdullah.amin@qnbfs.com.qa shahan.keushgerian@qnbfs.com.qa sahbi.alkasraoui@qnbfs.com.qa ahmed.alkhoudary@qnbfs.com.qa Doha, Qatar
DISCLAIMER: This publication has been prepared by QNB Financial Services SPC (“QNBFS”) a wholly-owned subsidiary of Qatar National Bank (“QNB”). QNBFS is regulated by the Qatar Financial Markets Authority and the Qatar Exchange; QNB is
regulated by the Qatar Central Bank. This publication expresses the views and opinions of QNBFS at a given time only. It is not an offer, promotion or recommendation to buy or sell securities or other investments, nor is it intended to constitute legal,
tax, accounting, or financial advice. We therefore strongly advise potential investors to seek independent professional advice before making any investment decision. Although the information in this report has been obtained from sources that QNBFS
believes to be reliable, we have not independently verified such information and it may not be accurate or complete. While this publication has been prepared with the utmost degree of care by our analysts, QNBFS does not make any representations or
warranties as to the accuracy and completeness of the information it may contain, and declines any liability in that respect. QNBFS reserves the right to amend the views and opinions expressed in this publication at any time. It may also express
viewpoints or make investment decisions that differ significantly from, or even contradict, the views and opinions included in this report.
COPYRIGHT: No part of this document may be reproduced without the explicit written permission of QNBFS.
Page 2 of 2
*These stocks are today’s suggested ideas
Overall Methodology: The charts and descriptions on Page 1 provide an indicative view of the future direction of the equities mentioned. The table on page 2 has been provided to denote historical movements in certain stocks. The historical trend analysis uses 21- and 55-
day SMAs for indicating short-term and long-term trends, respectively. Based on these SMAs, the historical direction of the trend is denoted as UP, DOWN or FLAT.
Selection of Key Stocks of the Day: Key stocks’ selection is based on our analysis of 19 members of the QE Index (excludes QNBK QD). Analysis includes identifying trends (short-term as well as long-term), patterns and support/resistance levels.
Trend Direction: The methods used to determine trend direction are subjective in nature. We use 21-day SMA and 55-day SMA, absolute price movements, price movements relative to SMAs and accurately drawn trend lines and chart patterns to determine the short- and
long-term trends.
Investment Horizon: The definition of short term and long term depends upon investors’ preferences and their investment objectives. As a rule of thumb, the time horizon for traders/short-term trend is 1-3 weeks while it is 1-3 months for investors/long-term trend.
Combining Technical and Fundamental Analysis: Investors can combine technical analysis (TA) with fundamental analysis (FA) to maximize their investment returns. While the “True Value” of stocks could be estimated by FA, the entry and exit timings could be fine
tuned using technical analysis to benefit from short-term movements in stock prices.
Trading Tactics: The trend direction should be analyzed based on the time-horizon of your investments. In general, investors attempt selling close to resistance levels during a downtrend and attempt buying close to support levels during uptrend.
Definitions:
1> Simple Moving Average (SMA): A SMA is the average of the closing price of a security for a given period.
2> RSI (Relative Strength Index): A technical momentum indicator that ranges from 0 to 100 and compares the stock’s recent price movements by evaluating recent gains and losses. Stocks with RSI above 70 could be considered overbought and below 30 could be
considered oversold. If the RSI falls below 70, it is a bearish signal. On the other hand, if the RSI rises above 30 it is considered bullish. We use a RSI of 14 days.
3> MACD (Moving Average Convergence Divergence): MACD denotes the relationship between two moving averages, which is used to spot changes in strength, direction, momentum and duration of a stock price trend. The MACD is calculated by subtracting the 26-day
exponential moving average (EMA) from the 12-day EMA. A nine-day EMA of the MACD, called the signal line, is also plotted on top of the MACD, functioning as a trigger for buy/sell signals. The MACD line above the signal line provides a positive signal and vice versa.
Name (Ticker) Last Close Trend Support Resistance
Short Term Long Term First Second First Second
Qatar Exchange Index (QE Index) 13,644.64 UP UP 13,584.34 13,447.24 13,770.09 13,847.11
Al Rayan Islamic Index (QERI Index) 4,707.59 UP UP 4,685.20 4,638.81 4,750.00 4,800.00
Banks and Financial Services Banks and
Masraf Al Rayan (MARK QD)* 56.00 UP UP 55.80 54.00 57.30 59.90
Commercial Bank of Qatar (CBQK QD) 68.00 FLAT UP 67.30 66.50 68.30 69.50
Doha Bank (DHBK QD) 60.60 UP UP 60.00 58.00 61.00 62.00
Qatar Islamic Bank (QIBK QD)* 115.00 UP UP 112.50 111.00 115.00 118.00
Qatar International Islamic Bank (QIIK QD) 84.50 DOWN UP 83.50 82.80 85.00 85.90
Qatar Insurance (QATI QD) 96.50 UP UP 96.00 94.60 97.00 97.50
Al Khalij Commercial Bank (KCBK QD) 22.00 FLAT FLAT 21.99 21.49 22.35 22.49
Consumer Goods and Services Consumer G
Medicare Group (MCGS QD)* 127.90 UP UP 126.50 124.00 128.80 130.00
Al Meera Consumer Goods Co. (MERS QD) 195.00 UP UP 194.80 192.00 197.50 198.80
Industrials Industrials
Industries Qatar (IQCD QD)* 186.40 UP UP 184.50 183.10 186.40 188.50
Qatar Electricity & Water Co. (QEWS QD) 188.00 UP UP 186.00 184.00 188.00 190.00
Gulf International Services (GISS QD) 120.20 UP UP 118.10 115.00 121.00 122.50
Qatari Investors Group (QIGD QD) 61.00 UP UP 60.60 57.70 61.30 62.40
Real Estate Real Estate
Barwa Real Estate Co. (BRES QD) 42.00 UP UP 41.80 41.00 42.50 43.20
United Development Co. (UDCD QD) 30.10 UP UP 29.90 29.30 30.45 30.61
Telecom Telecom
Ooredoo (ORDS QD) 125.30 DOWN DOWN 123.70 122.90 126.00 128.50
Vodafone Qatar (VFQS QD) 21.55 UP UP 20.78 20.00 21.99 22.30
Transportation Transportat
Nakilat (QGTS QD) 24.35 UP UP 24.12 24.00 24.45 25.30
Milaha (QNNS QD) 96.50 UP UP 95.10 93.00 96.50 97.80