SlideShare a Scribd company logo
1 of 1
This graph displays the average direction change response times for
Stauroneis phoenicenteron (circles) and Craticula cuspidata cells
(squares) irradiated at their leading end with high irradiance blue light (470
nm; ca. 105
µmol/m2
/s), as a function of the ratio of Stauroneis:Craticula
present in the sample assemblage in which the cells were incubated. The
responses show that the Stauroneis have a dose-dependent increase in
response times as the amount of Craticula in the sample was increased.
The Craticula cells showed no cell-dependent change in response times.
For comparison, un-irradiated Stauroneis and Craticula cells had
response times of 178 ± 10 s and 65 ± 4 s. Error bars represent ± 1 SE.
Analysis of Multiple Species Presence
on Diatom Motility
ABSTRACT #1375
Diatoms, like other algae, ordinarily live within complex multi-species algal communities. Diatoms are crucial
components in these aquatic communities, providing one of the most abundant primary food sources. In order
to help manage the development of healthy aquatic ecosystems it is important to understand the ecological
stimuli that regulate the ability of motile diatoms to successfully migrate through their local assemblages in
order to successfully exploit resources such as light and nutrients. Our lab has shown how several large
single-celled diatom species display characteristic responses to local conditions such as temperature and light.
We have also showed how several of these conditions such as adhesion and directional responses can often
be modified in the presence of other diatom species. We have investigated this further to show that this effect
can be dependent on the relative abundance of diatom species present. For example, when exposed to high
blue light irradiations at their leading tip, Stauroneis cells (S. phoenicenteron) will reverse direction in about
43±4 s. However, in the presence of Craticula cells (C. cuspidata) the direction change increases in a
concentration dependent manner, increasing to 172±39 s when the Craticula:Stauroneis ratio is 10:1 (same
approximate cell density for all experiments). This type of effect can be generated quickly, and appears to be
rapidly reversible. In a separate experiment, Stauroneis cells alone reversed direction upon blue light
irradiation in 34±3 s, but when these cells were exposed to a large number of Craticula cells this response time
increased to 42±2 sec within just a few minutes of exposure. Upon removal from the Craticula cells and rinsing
in fresh medium, the cells returned to their initial response time of 35±3 sec. In both cases the direction change
response of the Craticula cells seems unaffected by the presence of Stauroneis. We are investigating such
species-dependent modulations of motile characteristics to better understand the ways in which species can
affect each other's motility and might be able to undertake resource partitioning within a complex algal
assemblage to gain even more ecological advantage. This work was supported by grants through the DePaul
College of Science and Health, the DePaul University Research Council, and equipment purchased previously
through NSF Grant IBN-9982897.
S.A. Cohn, K. Patterson, A. Wolske
Department of Biological Sciences, DePaul University, Chicago, IL 60614
CONCLUSIONS
Our results show that the effect of irradiations at the ends
of diatoms can be modulated by the presence of other
species. Specifically, our data indicate:
 When Craticula and Stauroneis cells are placed
together in the same culture, the leading end response
time for Craticula cells is unchanged, while the response
time for Stauroneis is increased. (Figure 1)
 Cell-dependent modulation can also be demonstrated
by the addition (and removal) of Craticula cells to a slide
chamber containing Stauroneis. Addition of Craticula
causes an increase in Stauroneis response time, and
removal and rinsing of the Stauroneis restores the
response time. (Figure 2)
 This modulation is also generated by the presence of
Craticula-treated medium. Histogram analysis suggests
that some cells become selectively less responsive.
(Figure 3)
Neither a coverslip pre-treated with Craticula cells, nor
the addition of Craticula cell walls from dead cells causes
the observed increase in cellular response time of
Stauroneis. (Figure 4, 5)
Figure 1. The effect of high irradiance leading end blue
exposures on Craticula and Stauroneis cells as a
function of Stauroneis:Craticula Ratio.
Double Rear
End Irradiation
0
25
50
75
100
125
150
175
200
225
1:0 9:1 4:1 1:1 1:4 1:9 0:1
ResponseTime(s)
Stauroneis:Cra cula Ra o
Stauroneis
Cra cula
Control
Un-Irradiated
0
5
10
15
20
25
30
35
40
45
Stauroneis
(ini al)
w/ Cra cula Add Stauroneis
(washed)
ResponseTime(sec)
Effect of Cra cula Addi on and
Removal
0
20
40
60
80
100
Control Cra cula Solu on
ResponseTime(s)
Effect of Cra cula Treated Medium
0
2
4
6
8
10
12
14
0-20
21-40
41-60
61-80
81-100
101-120
121-140
141-160
161-180
181-200
NumberofCells
Response Time Range
Distribu on of Cell Responses
Diatom Medium
Crat Treated Medium
Figure 2. The effect of the addition of Craticula on
the response time of Stauroneis.
A) Stauroneis phoenicenteron cells were cleaned 2 times
in distilled water, and then allowed to incubate in either
standard diatom medium, or diatom medium taken from
cultures in which Craticula cells have been growing.
Stauroneis cells were then sealed on a glass slide
chamber, and the tips of cells were illuminated on their
leading or trailing end with 1 sec of high energy light
irradiance (ca. 105
µmol/m2
/s) using epi-illumination and
narrow band filters for blue (470 nm) light. Cells were
allowed to change direction and the time between the
irradiation and the direction change was determined.
Error bars represent ± 1 SE.
B) Histogram analysis of the cell responses seen in A.
Response times o Stauroneis cells in normal medium
showed fewer cells at high response times than
Stauroneis cells incubated in Craticula-treated cultures.
Figure 3. The effect of Craticula-treated medium on Stauroneis
response times.
Stauroneis phoenicenteron cells were cleaned and sealed on a glass
slide chamber. The tips of cells were illuminated on their leading or
trailing end with 1 sec of high energy light irradiance (ca. 105
µmol/m2
/s) using epi-illumination and narrow band filters for blue (470
nm) light. Cells were allowed to change direction and the time between
the irradiation and the direction change was determined. Response
times of single species cultures were compared with that of the
samples after the addition of ca. 10:1 ratios of Craticula:Stauroneis
cells. After measuring response times of Stauroneis in the mixed cell
assemblages, the Stauroneis cells were removed from the mixed
culture, and rinsed, and then placed on a new slide chamber and the
sample tested for response time again. Error bars represent ± 1 SE.
A B
Figure 5. The effect of a Craticula
pre-treated coverslip on Stauroneis
response times.
Cleaned glass coverslips were allowed to incubate in
cultures containing actively moving Craticula cells on
them for 3-5 days. Stauroneis phoenicenteron cells
were cleaned and sealed on a glass slide chamber
containing either a cleaned glass coverslip, or the
Craticula pre-treated coverslip. The tips of cells were
illuminated on their leading or trailing end with 1 sec of
high energy light irradiance (ca. 105
µmol/m2
/s) using
epi-illumination and narrow band filters for blue (470
nm) light. Cells were allowed to change direction and
the time between the irradiation and the direction
change was determined. Error bars represent ± 1
SE.
Figure 4. The effect of a cell walls from dead Craticula
on Stauroneis response times.
Samples of Craticula cells were
killed by inoculating cells into
95% ethanol and allowing cells to
incubate for 10 min. Cell walls
from these cells were then
obtained by placing the cells into
a microcentrifuge, sedimenting
the cell walls, then rinsing them in
distilled water, repeating the
sedimentation/rinse three times.
0
10
20
30
40
50
Stauroneis Alone w/ Dead Cells
ResponseTime(s)
Effect of Dead Cra cula Addi on
Stauroneis phoenicenteron cells were cleaned and sealed on a glass slide chamber.
The tips of cells were illuminated on their leading or trailing end with 1 sec of high
energy irradiance (ca. 105
µmol/m2
/s) blue (470 nm) light, and the response time
measured. Stauroneis were then layered with Craticula cell walls from dead cells, and
response times measured again. Error bars represent ± 1 SE.

More Related Content

Similar to 15ASCB

Research Report- p53
Research Report- p53Research Report- p53
Research Report- p53
Ankur Gupta
 
Plasma Membrane Bound Cell Lab Report
Plasma Membrane Bound Cell Lab ReportPlasma Membrane Bound Cell Lab Report
Plasma Membrane Bound Cell Lab Report
Lisa Brown
 
Dose-Response Relationships for Model Normal Tissues
Dose-Response Relationships for Model Normal TissuesDose-Response Relationships for Model Normal Tissues
Dose-Response Relationships for Model Normal Tissues
Dr.Rashmi Yadav
 
2011 Mayo Clinic Drosophila CIPN poster
2011 Mayo Clinic Drosophila CIPN poster2011 Mayo Clinic Drosophila CIPN poster
2011 Mayo Clinic Drosophila CIPN poster
Steven Forsythe
 
Thebactericidaleffectofultravioletandvisiblelighto
ThebactericidaleffectofultravioletandvisiblelightoThebactericidaleffectofultravioletandvisiblelighto
Thebactericidaleffectofultravioletandvisiblelighto
Werden Keeler
 
Phragmites Poster 2014 (Final)
Phragmites Poster 2014 (Final)Phragmites Poster 2014 (Final)
Phragmites Poster 2014 (Final)
Anjelle Martinez
 
Development and motility of Dicty actin mutants
Development and motility of Dicty actin mutantsDevelopment and motility of Dicty actin mutants
Development and motility of Dicty actin mutants
Andrey Dementyev
 

Similar to 15ASCB (20)

2. Radio sensitivity and cell age in the mitotic cycle.pptx
2. Radio sensitivity and cell age in the mitotic cycle.pptx2. Radio sensitivity and cell age in the mitotic cycle.pptx
2. Radio sensitivity and cell age in the mitotic cycle.pptx
 
Research Report- p53
Research Report- p53Research Report- p53
Research Report- p53
 
The Effects of Octanol on Gap Junctions and Actin of Neoblasts during Smed Pl...
The Effects of Octanol on Gap Junctions and Actin of Neoblasts during Smed Pl...The Effects of Octanol on Gap Junctions and Actin of Neoblasts during Smed Pl...
The Effects of Octanol on Gap Junctions and Actin of Neoblasts during Smed Pl...
 
Heraud F E M S Lett
Heraud  F E M S  LettHeraud  F E M S  Lett
Heraud F E M S Lett
 
PONE2013_VecslerM
PONE2013_VecslerMPONE2013_VecslerM
PONE2013_VecslerM
 
NUCLEOCYTOPLASMIC-INTERACTIONS.pdf cell biology
NUCLEOCYTOPLASMIC-INTERACTIONS.pdf cell biologyNUCLEOCYTOPLASMIC-INTERACTIONS.pdf cell biology
NUCLEOCYTOPLASMIC-INTERACTIONS.pdf cell biology
 
Plasma Membrane Bound Cell Lab Report
Plasma Membrane Bound Cell Lab ReportPlasma Membrane Bound Cell Lab Report
Plasma Membrane Bound Cell Lab Report
 
Dose-Response Relationships for Model Normal Tissues
Dose-Response Relationships for Model Normal TissuesDose-Response Relationships for Model Normal Tissues
Dose-Response Relationships for Model Normal Tissues
 
2011 Mayo Clinic Drosophila CIPN poster
2011 Mayo Clinic Drosophila CIPN poster2011 Mayo Clinic Drosophila CIPN poster
2011 Mayo Clinic Drosophila CIPN poster
 
Radiosensitivity and cell age in mitotic cycle .pptx
Radiosensitivity and cell age in mitotic cycle .pptxRadiosensitivity and cell age in mitotic cycle .pptx
Radiosensitivity and cell age in mitotic cycle .pptx
 
4 rs of radiobiology
4 rs of radiobiology4 rs of radiobiology
4 rs of radiobiology
 
Thebactericidaleffectofultravioletandvisiblelighto
ThebactericidaleffectofultravioletandvisiblelightoThebactericidaleffectofultravioletandvisiblelighto
Thebactericidaleffectofultravioletandvisiblelighto
 
4 r's of radiobiology and dose rate effects
4 r's of radiobiology and dose rate effects4 r's of radiobiology and dose rate effects
4 r's of radiobiology and dose rate effects
 
Algal Culture Study
Algal Culture StudyAlgal Culture Study
Algal Culture Study
 
Phragmites Poster 2014 (Final)
Phragmites Poster 2014 (Final)Phragmites Poster 2014 (Final)
Phragmites Poster 2014 (Final)
 
Micronuclei in 24 mev
Micronuclei in 24 mevMicronuclei in 24 mev
Micronuclei in 24 mev
 
Cell survival curve
Cell survival curveCell survival curve
Cell survival curve
 
Effects of Losartan on Ischemia/Reperfusion–Induced Testicular Injury in a Ra...
Effects of Losartan on Ischemia/Reperfusion–Induced Testicular Injury in a Ra...Effects of Losartan on Ischemia/Reperfusion–Induced Testicular Injury in a Ra...
Effects of Losartan on Ischemia/Reperfusion–Induced Testicular Injury in a Ra...
 
Development and motility of Dicty actin mutants
Development and motility of Dicty actin mutantsDevelopment and motility of Dicty actin mutants
Development and motility of Dicty actin mutants
 
L 7 Plant protoplasts .ppt
L 7 Plant  protoplasts .pptL 7 Plant  protoplasts .ppt
L 7 Plant protoplasts .ppt
 

15ASCB

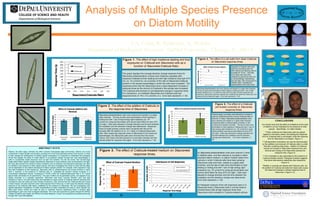
  • 1. This graph displays the average direction change response times for Stauroneis phoenicenteron (circles) and Craticula cuspidata cells (squares) irradiated at their leading end with high irradiance blue light (470 nm; ca. 105 µmol/m2 /s), as a function of the ratio of Stauroneis:Craticula present in the sample assemblage in which the cells were incubated. The responses show that the Stauroneis have a dose-dependent increase in response times as the amount of Craticula in the sample was increased. The Craticula cells showed no cell-dependent change in response times. For comparison, un-irradiated Stauroneis and Craticula cells had response times of 178 ± 10 s and 65 ± 4 s. Error bars represent ± 1 SE. Analysis of Multiple Species Presence on Diatom Motility ABSTRACT #1375 Diatoms, like other algae, ordinarily live within complex multi-species algal communities. Diatoms are crucial components in these aquatic communities, providing one of the most abundant primary food sources. In order to help manage the development of healthy aquatic ecosystems it is important to understand the ecological stimuli that regulate the ability of motile diatoms to successfully migrate through their local assemblages in order to successfully exploit resources such as light and nutrients. Our lab has shown how several large single-celled diatom species display characteristic responses to local conditions such as temperature and light. We have also showed how several of these conditions such as adhesion and directional responses can often be modified in the presence of other diatom species. We have investigated this further to show that this effect can be dependent on the relative abundance of diatom species present. For example, when exposed to high blue light irradiations at their leading tip, Stauroneis cells (S. phoenicenteron) will reverse direction in about 43±4 s. However, in the presence of Craticula cells (C. cuspidata) the direction change increases in a concentration dependent manner, increasing to 172±39 s when the Craticula:Stauroneis ratio is 10:1 (same approximate cell density for all experiments). This type of effect can be generated quickly, and appears to be rapidly reversible. In a separate experiment, Stauroneis cells alone reversed direction upon blue light irradiation in 34±3 s, but when these cells were exposed to a large number of Craticula cells this response time increased to 42±2 sec within just a few minutes of exposure. Upon removal from the Craticula cells and rinsing in fresh medium, the cells returned to their initial response time of 35±3 sec. In both cases the direction change response of the Craticula cells seems unaffected by the presence of Stauroneis. We are investigating such species-dependent modulations of motile characteristics to better understand the ways in which species can affect each other's motility and might be able to undertake resource partitioning within a complex algal assemblage to gain even more ecological advantage. This work was supported by grants through the DePaul College of Science and Health, the DePaul University Research Council, and equipment purchased previously through NSF Grant IBN-9982897. S.A. Cohn, K. Patterson, A. Wolske Department of Biological Sciences, DePaul University, Chicago, IL 60614 CONCLUSIONS Our results show that the effect of irradiations at the ends of diatoms can be modulated by the presence of other species. Specifically, our data indicate:  When Craticula and Stauroneis cells are placed together in the same culture, the leading end response time for Craticula cells is unchanged, while the response time for Stauroneis is increased. (Figure 1)  Cell-dependent modulation can also be demonstrated by the addition (and removal) of Craticula cells to a slide chamber containing Stauroneis. Addition of Craticula causes an increase in Stauroneis response time, and removal and rinsing of the Stauroneis restores the response time. (Figure 2)  This modulation is also generated by the presence of Craticula-treated medium. Histogram analysis suggests that some cells become selectively less responsive. (Figure 3) Neither a coverslip pre-treated with Craticula cells, nor the addition of Craticula cell walls from dead cells causes the observed increase in cellular response time of Stauroneis. (Figure 4, 5) Figure 1. The effect of high irradiance leading end blue exposures on Craticula and Stauroneis cells as a function of Stauroneis:Craticula Ratio. Double Rear End Irradiation 0 25 50 75 100 125 150 175 200 225 1:0 9:1 4:1 1:1 1:4 1:9 0:1 ResponseTime(s) Stauroneis:Cra cula Ra o Stauroneis Cra cula Control Un-Irradiated 0 5 10 15 20 25 30 35 40 45 Stauroneis (ini al) w/ Cra cula Add Stauroneis (washed) ResponseTime(sec) Effect of Cra cula Addi on and Removal 0 20 40 60 80 100 Control Cra cula Solu on ResponseTime(s) Effect of Cra cula Treated Medium 0 2 4 6 8 10 12 14 0-20 21-40 41-60 61-80 81-100 101-120 121-140 141-160 161-180 181-200 NumberofCells Response Time Range Distribu on of Cell Responses Diatom Medium Crat Treated Medium Figure 2. The effect of the addition of Craticula on the response time of Stauroneis. A) Stauroneis phoenicenteron cells were cleaned 2 times in distilled water, and then allowed to incubate in either standard diatom medium, or diatom medium taken from cultures in which Craticula cells have been growing. Stauroneis cells were then sealed on a glass slide chamber, and the tips of cells were illuminated on their leading or trailing end with 1 sec of high energy light irradiance (ca. 105 µmol/m2 /s) using epi-illumination and narrow band filters for blue (470 nm) light. Cells were allowed to change direction and the time between the irradiation and the direction change was determined. Error bars represent ± 1 SE. B) Histogram analysis of the cell responses seen in A. Response times o Stauroneis cells in normal medium showed fewer cells at high response times than Stauroneis cells incubated in Craticula-treated cultures. Figure 3. The effect of Craticula-treated medium on Stauroneis response times. Stauroneis phoenicenteron cells were cleaned and sealed on a glass slide chamber. The tips of cells were illuminated on their leading or trailing end with 1 sec of high energy light irradiance (ca. 105 µmol/m2 /s) using epi-illumination and narrow band filters for blue (470 nm) light. Cells were allowed to change direction and the time between the irradiation and the direction change was determined. Response times of single species cultures were compared with that of the samples after the addition of ca. 10:1 ratios of Craticula:Stauroneis cells. After measuring response times of Stauroneis in the mixed cell assemblages, the Stauroneis cells were removed from the mixed culture, and rinsed, and then placed on a new slide chamber and the sample tested for response time again. Error bars represent ± 1 SE. A B Figure 5. The effect of a Craticula pre-treated coverslip on Stauroneis response times. Cleaned glass coverslips were allowed to incubate in cultures containing actively moving Craticula cells on them for 3-5 days. Stauroneis phoenicenteron cells were cleaned and sealed on a glass slide chamber containing either a cleaned glass coverslip, or the Craticula pre-treated coverslip. The tips of cells were illuminated on their leading or trailing end with 1 sec of high energy light irradiance (ca. 105 µmol/m2 /s) using epi-illumination and narrow band filters for blue (470 nm) light. Cells were allowed to change direction and the time between the irradiation and the direction change was determined. Error bars represent ± 1 SE. Figure 4. The effect of a cell walls from dead Craticula on Stauroneis response times. Samples of Craticula cells were killed by inoculating cells into 95% ethanol and allowing cells to incubate for 10 min. Cell walls from these cells were then obtained by placing the cells into a microcentrifuge, sedimenting the cell walls, then rinsing them in distilled water, repeating the sedimentation/rinse three times. 0 10 20 30 40 50 Stauroneis Alone w/ Dead Cells ResponseTime(s) Effect of Dead Cra cula Addi on Stauroneis phoenicenteron cells were cleaned and sealed on a glass slide chamber. The tips of cells were illuminated on their leading or trailing end with 1 sec of high energy irradiance (ca. 105 µmol/m2 /s) blue (470 nm) light, and the response time measured. Stauroneis were then layered with Craticula cell walls from dead cells, and response times measured again. Error bars represent ± 1 SE.