Budget and economic outlook 2014 to 2024
•
1 like•1,669 views

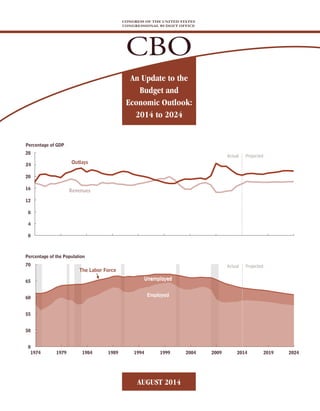
In 3 sentences: CBO projects that the federal budget deficit will continue to shrink in 2014 but federal debt will still be growing. If current laws generally remain unchanged, deficits will persist through 2024, pushing debt held by the public higher to 77% of GDP by 2024. Economic growth is expected to pick up over the next few years but then moderate, with the output gap closing by 2017.

Recommended
More Related Content
What's hot
What's hot (20)
Viewers also liked
Similar to Budget and economic outlook 2014 to 2024
Similar to Budget and economic outlook 2014 to 2024 (20)
More from Luis Taveras EMBA, MS
More from Luis Taveras EMBA, MS (20)
Budget and economic outlook 2014 to 2024
- 1. Unemployed Employed Unemployed Employed The Labor Force Projected Revenues Outlays 1974 0 0 4 50 28 8 55 12 60 16 65 20 70 24 1979 19891984 1994 2014 2019 2024 Actual Projected Actual Percentage of GDP Percentage of the Population 1999 20092004 CONGRESS OF THE UNITED STATES CONGRESSIONAL BUDGET OFFICE CBO An Update to the Budget and Economic Outlook: 2014 to 2024 AUGUST 2014
- 2. CBO Notes Unless otherwise indicated, all years referred to in describing the budget outlook are federal fiscal years (which run from October 1 to September 30), and years referred to in describing the economic outlook are calendar years. Numbers in the text and tables may not add up to totals because of rounding. Also, some values are expressed as fractions to indicate numbers rounded to amounts greater than a tenth of a percentage point. Some figures in this report have vertical bars that indicate the duration of recessions. (A recession extends from the peak of a business cycle to its trough.) The economic forecast was completed in early July, and, unless otherwise indicated, estimates presented in Chapter 2 and Appendix B of this report are based on information available at that time. As referred to in this report, the Affordable Care Act comprises the Patient Protection and Affordable Care Act (Public Law 111-148), the health care provisions of the Health Care and Education Reconciliation Act of 2010 (P.L. 111-152), and the effects of subsequent judicial decisions, statutory changes, and administrative actions. Supplemental data for this analysis are available on CBO’s website (www.cbo.gov/ publication/45653), as is a glossary of common budgetary and economic terms (www.cbo.gov/publication/42904). Pub. No. 5005
- 3. Contents CBO Summary 1 The Budget Deficit Continues to Shrink in 2014, but Federal Debt Is Still Growing 1 Persistent Deficits Through 2024 Would Push Debt Relative to GDP Even Higher 2 Economic Growth Will Pick Up in the Next Few Years and Moderate in Later Years 4 1 The Budget Outlook 7 The Budget Outlook for 2014 8 CBO’s Baseline Budget Projections for 2015 to 2024 16 Alternative Assumptions About Fiscal Policy 23 Changes in CBO’s Baseline Projections Since April 2014 26 2 The Economic Outlook 29 The Economic Outlook Through 2017 30 The Economic Outlook for 2018 to 2024 45 Projections of Income 49 Some Uncertainties in the Economic Outlook 50 Comparison With CBO’s February 2014 Projections 51 Comparison With Other Economic Projections 53 A Changes in CBO’s Baseline Since April 2014 57 Changes to Projections of Revenues 57 Changes to Projections of Outlays 60 B CBO’s Economic Projections for 2014 to 2024 65 List of Tables and Figures 69 About This Document 71
- 5. CBO Summary The federal budget deficit has fallen sharply during the past few years, and it is on a path to decline further this year and next year. However, later in the coming decade, if current laws governing federal taxes and spending generally remained unchanged, revenues would grow only slightly faster than the economy and spending would increase more rapidly, according to the Congressional Budget Office’s (CBO’s) projections. Consequently, relative to the size of the economy, deficits would grow and federal debt would climb. CBO’s budget projections are built upon its economic forecast, which anticipates that the economy will grow slowly this year, on balance, and then at a faster but still moderate pace over the next few years. The gap between the nation’s output and its potential (maximum sustain- able) output will narrow to its historical average by the end of 2017, CBO expects, largely eliminating the underutilization of labor that currently exists. As the economy strengthens over the next few years, inflation is expected to remain below the Federal Reserve’s goal, and interest rates on Treasury securities, which have been exceptionally low since the recession, are projected to rise considerably. The Budget Deficit Continues to Shrink in 2014, but Federal Debt Is Still Growing The federal budget deficit for fiscal year 2014 will amount to $506 billion, CBO estimates, roughly $170 billion lower than the shortfall recorded in 2013. At 2.9 percent of gross domestic product (GDP), this year’s deficit will be much smaller than those of recent years (which reached almost 10 percent of GDP in 2009) and slightly below the average of federal deficits over the past 40 years. However, by CBO’s estimates, federal debt held by the public will reach 74 percent of GDP at the end of this fiscal year—more than twice what it was at the end of 2007 and higher than in any year since 1950. Outlays Spending is expected to rise by about 2 percent this year, to $3.5 trillion (see Summary Table 1). Outlays for man- datory programs, which are governed by statutory criteria and not normally controlled by the annual appropriation process, are projected to rise by about 4 percent. That increase reflects growth in some of the largest programs— including a 15 percent increase in spending for Medicaid and a roughly 5 percent increase in spending for Social Security. In contrast, CBO estimates, net spending for Medicare will increase by only 2 percent in 2014, and spending for some mandatory programs will fall; in particular, outlays for unemployment compensation are expected to drop by nearly 40 percent, primarily because the authority to pay emergency benefits expired at the end of December 2013. Discretionary spending, which is controlled by annual appropriation acts, is anticipated to be 3 percent less in 2014 than it was in 2013. Nondefense discretionary spending is expected to be about the same this year as it was last year, but defense spending is likely to drop by about 5 percent. The government’s net interest costs will rise by nearly 5 percent this year, CBO estimates, the result of the con- tinued accumulation of debt and higher inflation (which has boosted the cost of the Treasury’s inflation-protected securities). Revenues Revenues are expected to increase by about 8 percent this year from last year’s amounts, to $3.0 trillion. Reve- nues from all major sources will rise this year, including individual income taxes (by an estimated 6 percent); pay- roll taxes (by 8 percent); and corporate income taxes (by
- 6. 2 AN UPDATE TO THE BUDGET AND ECONOMIC OUTLOOK: 2014 TO 2024 AUGUST 2014 CBO Summary Table 1. Deficits Projected in CBO’s Baseline Source: Congressional Budget Office. Note: GDP = gross domestic product; n.a. = not applicable. a. Excludes net interest. 15 percent). Increases in wages and salaries and changes in laws—such as those affecting payroll tax rates and income tax deductions for investments in business equip- ment—largely account for the higher tax receipts. In addition, remittances to the Treasury from the Federal Reserve are anticipated to rise by 33 percent this year, owing to increases in both the size of the Federal Reserve’s portfolio of securities and the return on that portfolio. Persistent Deficits Through 2024 Would Push Debt Relative to GDP Even Higher CBO regularly produces projections of what federal spending, revenues, and deficits would look like over the next 10 years if current laws governing federal taxes and spending generally remained unchanged. Those baseline projections are designed to serve as a benchmark that policymakers can use when considering possible changes to those laws. According to CBO’s updated projections, under current law, the annual deficit would remain less than 3 percent of GDP through 2018, but would grow thereafter, reaching nearly 4 percent from 2022 through 2024. (In contrast, over the past 40 years, deficits averaged 3.1 percent of GDP.) The persistent and growing deficits that CBO projects would result in increasing amounts of federal debt held by the public. In CBO’s baseline projections, that debt rises from 74 percent of GDP this year to 77 percent of GDP in 2024. As recently as 2007, federal debt equaled 35 percent of GDP, but the very large deficits of the past several years caused debt to surge (see Summary Figure 1). The large and increasing amount of federal debt would have serious negative consequences, including the following: Increasing federal spending for interest payments, Restraining economic growth in the long term, Giving policymakers less flexibility to respond to unexpected challenges, and Eventually increasing the risk of a fiscal crisis (in which investors would demand high interest rates to buy the government’s debt). Actual, 2015- 2015- 2013 2014 2015 2016 2017 2018 2019 2020 2021 2022 2023 2024 2019 2024 Revenues 2,775 3,006 3,281 3,423 3,605 3,748 3,908 4,083 4,257 4,446 4,644 4,850 17,965 40,243 Outlays 3,455 3,512 3,750 3,979 4,135 4,308 4,569 4,820 5,076 5,391 5,601 5,810 20,741 47,439____ ____ ____ ____ ____ ____ ____ ____ ____ ____ ____ ____ ______ ______ Total Deficit -680 -506 -469 -556 -530 -560 -661 -737 -820 -946 -957 -960 -2,777 -7,196 Net Interest 221 231 251 287 340 412 492 566 627 687 746 799 1,782 5,207 Primary Deficita -459 -275 -218 -269 -190 -148 -169 -170 -193 -259 -211 -161 -995 -1,989 Memorandum (As a percentage of GDP): Total Deficit -4.1 -2.9 -2.6 -2.9 -2.7 -2.7 -3.0 -3.3 -3.5 -3.8 -3.7 -3.6 -2.8 -3.2 Primary Deficita -2.8 -1.6 -1.2 -1.4 -1.0 -0.7 -0.8 -0.8 -0.8 -1.1 -0.8 -0.6 -1.0 -0.9 Debt Held by the Public at the End of the Year 72.0 74.4 74.0 73.6 73.0 72.8 73.1 73.6 74.3 75.4 76.4 77.2 n.a. n.a. Total
- 7. SUMMARY AN UPDATE TO THE BUDGET AND ECONOMIC OUTLOOK: 2014 TO 2024 3 CBO Summary Figure 1. Federal Debt Held by the Public Source: Congressional Budget Office. Outlays Between 2014 and 2024, annual outlays are projected to grow, on net, by $2.3 trillion, reflecting an average annual increase of 5.2 percent. Boosted by the aging of the population, the expansion of federal subsidies for health insurance, rising health care costs per beneficiary, and mounting interest costs on federal debt, spending for the three fastest-growing components of the budget accounts for 85 percent of the total projected increase in outlays over the next 10 years: Annual spending for Social Security is projected to grow by almost 80 percent. Under current law, outlays for that program would climb from 4.9 percent of GDP this year to 5.6 percent in 2024, according to CBO’s estimates. Annual net outlays for the government’s major health care programs (Medicare, Medicaid, the Children’s Health Insurance Program, and subsidies for health insurance purchased through exchanges) are projected to rise by more than 85 percent. Outlays for those programs would grow from 4.9 percent of GDP to 5.9 percent, CBO anticipates. Outlays for net interest in 2024 are projected to be more than triple those in 2014—the result of both projected growth in federal debt and a rise in interest rates. Net interest outlays would rise from 1.3 percent of GDP this year to 3.0 percent by the end of the coming decade, CBO expects. In contrast, taken together, all other spending is projected to grow by only about 20 percent. Relative to GDP, such spending would fall—from 9.3 percent this year to 7.3 percent by 2024, its lowest percentage since 1940 (the earliest year for which comparable data have been reported). Total outlays in the baseline amount to 20.4 percent of GDP in 2014, hover around 21 percent (their average for the past 40 years) from 2015 through 2020, and then rise to about 22 percent from 2022 through 2024. In CBO’s projections, both net interest and mandatory spending grow relative to GDP from 2014 to 2024, by 1.7 percent and 1.4 percent, respectively; discretionary spending falls by 1.6 percent of GDP over that period. Revenues Revenues are projected to grow by $1.8 trillion between 2014 and 2024, or at an annual rate of 4.9 percent. Provisions of law that have recently taken effect (such as the expiration of certain tax provisions) and, to a lesser extent, the ongoing economic expansion mostly explain a projected jump in federal revenues from this year to next, from 17.5 percent of GDP to 18.3 percent. Greater receipts from individual income taxes (up from 8.1 percent of GDP in 2014 to 8.5 percent in 2015) and 1940 1950 1960 1970 1980 1990 2000 2010 2020 0 20 40 60 80 100 120 Actual Projected Percentage of Gross Domestic Product
- 8. 4 AN UPDATE TO THE BUDGET AND ECONOMIC OUTLOOK: 2014 TO 2024 AUGUST 2014 CBO corporate income taxes (rising from 1.8 percent of GDP to 2.2 percent) largely account for that increase. From 2015 through 2024, in CBO’s baseline, total revenues change little relative to GDP—amounting to between 18.0 percent and 18.3 percent in each year— because of offsetting factors. Under current law, individ- ual income tax receipts would rise by nearly 1 percent of GDP between 2015 and 2024, reaching 9.4 percent; that increase would occur mainly because a greater proportion of income would fall into higher income tax brackets, a result of tax brackets being indexed for inflation but not for growth in real income. But that rise would be offset both by a decline in corporate income taxes, which are projected to fall to 1.8 percent of GDP in 2024 (mostly because of an expected drop in domestic profits relative to the size of the economy), and by smaller remittances from the Federal Reserve. Changes From CBO’s Previous Budget Projections The deficit that CBO now estimates for 2014 is a bit larger than the $492 billion the agency projected in April.1 CBO’s estimate of revenues dropped by $26 bil- lion from the April projection, mostly because of lower- than-anticipated receipts from corporate income taxes. CBO’s estimate of outlays this year declined by $11 bil- lion, particularly because spending for Medicare and discretionary programs is now expected to be lower than the earlier estimates. Deficits over the coming decade are now projected to total $7.2 trillion—about $400 billion less than the cumulative deficit CBO projected in April. Although revenues for that period are projected to be lower than the amounts that were previously estimated, projected outlays decline even more, largely because of lower antici- pated interest costs. Economic Growth Will Pick Up in the Next Few Years and Moderate in Later Years Real (inflation-adjusted) GDP grew at an annual rate of only 0.9 percent during the first half of this calendar year, but CBO expects stronger growth during the second half, in part because the effects of some restraining factors in the first part of the year, such as bad weather, have abated and because recent data, particularly regarding employ- ment, indicate that the economic expansion is on firmer ground. All told, real GDP will increase by 1.5 percent from the fourth quarter of 2013 through the fourth quarter of 2014, CBO estimates. CBO projects that the growth of real GDP will pick up after this year, to an annual average rate of 3.4 percent from 2014 through 2016 (see Summary Figure 2). CBO anticipates that growth over the next few years will be stronger than growth this year for three main reasons: In response to increased demand for their goods and services, businesses will increase their investments in new structures and equipment at a faster pace and will continue to expand their workforces. Consumer spending will also grow more rapidly, spurred by recent gains in household wealth and— with an improving labor market—gains in labor income. Fewer vacant housing units, more rapid formation of new households, and further improvement in mortgage markets will lead to larger increases in home building. The Degree of Slack in the Economy Over the Next Few Years The faster growth of output will reduce the amount of underutilized productive resources—or “slack”—in the economy over the next few years. CBO estimates that GDP was about 4 percent less than its potential value at the end of last year, but by the end of 2017, that shortfall is expected to narrow to its historical average, which is about ½ percent. Similarly, the slack in the labor market—reflected in both an elevated unemployment rate and temporary weakness in people’s participation in the labor force because of lim- ited job prospects—is expected to largely disappear by the end of 2017. CBO projects that increased hiring will bring the unemployment rate closer to the agency’s esti- mate of the natural rate of unemployment (that is, the rate arising from all sources except fluctuations in the overall demand for goods and services)—reducing it from 6.2 percent in the second quarter of 2014 to 5.6 percent in the fourth quarter of 2017. CBO also expects that the 1. See Congressional Budget Office, Updated Budget Projections: 2014 to 2024 (April 2014), www.cbo.gov/publication/45229.
- 9. SUMMARY AN UPDATE TO THE BUDGET AND ECONOMIC OUTLOOK: 2014 TO 2024 5 CBO Summary Figure 2. Actual Values and CBO’s Projections of Key Economic Indicators Sources: Congressional Budget Office; Bureau of Economic Analysis; Bureau of Labor Statistics; Federal Reserve. Notes: Real gross domestic product (GDP) is the output of the economy adjusted to remove the effects of inflation. The unemployment rate is a measure of the number of jobless people who are available for work and are actively seeking jobs, expressed as a percentage of the labor force. The overall inflation rate is based on the price index for personal consumption expenditures; the core rate excludes prices for food and energy. Data are annual. For real GDP and inflation, values from 1999 through 2013 (the thin lines) reflect revisions to the national income and product accounts that the Bureau of Economic Analysis made on July 30, 2014. Values from 2013 through 2024 (the thick lines) reflect the data available and projections made before July 30. Percentage changes are measured from the fourth quarter of one calendar year to the fourth quarter of the next year. -4 -2 0 2 4 6 Percentage Change 1999 2004 2009 2014 2019 2024 Real GDP Actual Projected 0 2 4 6 8 10 12 1999 2004 2009 2014 2019 2024 Actual Projected Unemployment Rate Percent 0 1 2 3 4 5 1999 2004 2009 2014 2019 2024 Percentage Change in Prices Percent Inflation Actual Projected Overall Inflation Core Inflation 0 1 2 3 4 5 6 7 1999 2004 2009 2014 2019 2024 Interest Rates 10-Year Treasury Notes 3-Month Treasury Bills Actual Projected
- 10. 6 AN UPDATE TO THE BUDGET AND ECONOMIC OUTLOOK: 2014 TO 2024 AUGUST 2014 CBO greater hiring will encourage some people to reenter the labor force, slowing both the decline in the unemploy- ment rate and the decline in labor force participation that would result from underlying demographic trends and federal policies by themselves. Nonetheless, CBO antici- pates that the labor force participation rate (the percent- age of people in the civilian noninstitutionalized popula- tion who are age 16 or older and are either working or actively seeking work) will decline slightly—from 62.8 percent in the second quarter of 2014 to 62.3 per- cent in the fourth quarter of 2017. Inflation and Interest Rates Over the Next Few Years Reduced slack in the economy will remove some of the downward pressure on the rate of inflation and interest rates that has existed in the past several years. However, with some slack remaining and with widely held expect- ations for low inflation, CBO anticipates that the rate of inflation, as measured by the price index for personal consumption expenditures (PCE), will remain below the Federal Reserve’s goal of 2 percent during the next few years. By CBO’s estimates, the interest rate on 3-month Treasury bills will remain near zero until the second half of 2015 and then rise to an average of 2.1 percent in 2017; the rate on 10-year Treasury notes is projected to rise from an average of 2.4 percent last year to 4.2 percent in 2017. The Economic Outlook for 2018 and Later Years CBO’s forecast for 2018 and later years is not based on projections of cyclical developments in the economy, because the agency does not attempt to predict economic fluctuations that far into the future. Instead, the forecast is based on projections of underlying factors that affect the economy’s productive capacity. In CBO’s projections, real GDP grows by 2.2 percent per year, on average, between 2018 and 2024—a rate that matches the agency’s estimate of the growth of potential output in those years but is notably less than the average growth of potential output during the 1980s and 1990s. That difference largely reflects the retirement of members of the baby-boom generation as well as a relatively stable labor force participation rate among working-age women (after decades of strong increases) and the effects of fed- eral tax and spending policies embodied in current law. In addition, the lingering effects of the recent recession and slow recovery are expected to cause the level of GDP to be lower during the 2018–2024 period than it otherwise would be. Between 2018 and 2024, by CBO’s estimates, the unemployment rate will average 5.6 percent (falling slightly over the period, from 5.6 percent to 5.5 percent), and inflation (as measured by the PCE price index) will average 2.0 percent. The interest rate on 3-month Treasury bills will average 3.4 percent during that period, and the rate on 10-year Treasury notes will average 4.7 percent, according to CBO’s projections. Changes From CBO’s Previous Economic Projections CBO’s current economic projections differ in some respects from the ones issued in February 2014.2 The agency has significantly lowered its projection of growth in real GDP for 2014, reflecting surprising economic weakness in the first half of the year. However, the level of real GDP over most of the coming decade is projected to be only modestly lower than estimated in February. In addition, CBO now anticipates lower interest rates throughout the projection period and a lower unemployment rate for the next six years. 2. See Congressional Budget Office, The Budget and Economic Outlook: 2014 to 2024 (February 2014), www.cbo.gov/ publication/45010.
- 11. CHAPTER CBO 1 The Budget Outlook The Congressional Budget Office (CBO) estimates that the budget deficit in fiscal year 2014 will total $506 billion, up from the $492 billion the agency esti- mated in April.1 Relative to the size of the economy, this year’s deficit—at 2.9 percent of gross domestic product (GDP)—will be slightly below the average experienced over the past 40 years, and 2014 will mark the fifth consecutive year in which the deficit has declined as a percentage of GDP since peaking at 9.8 percent in 2009 (see Figure 1-1). Nevertheless, measured relative to the size of the economy, debt held by the public will increase for the seventh year in a row, reaching 74 percent of GDP by the end of 2014, the highest ratio since 1950. As specified in law, CBO constructs its baseline projec- tions of federal revenues and spending under the assump- tion that current laws will generally remain unchanged. If that was to occur, the period of shrinking deficits would soon come to an end. Between 2015 and 2024, annual budget shortfalls are projected to rise substantially—from a low of $469 billion in 2015 to $960 billion in 2024— mainly because of significant growth in spending on retirement and health care programs caused by the aging of the population, rising per capita health care costs, and an expansion of federal subsidies for health insurance, and because of growing interest payments on federal debt. CBO expects that deficits during that decade would total $7.2 trillion if current laws remained unchanged (see Table 1-1). As a percentage of GDP, deficits are projected to rise from 2.6 percent in 2015 to almost 4 percent near the end of the 10-year period. By comparison, the deficit aver- aged 3.1 percent of GDP between 1974 and 2013 and 2.3 percent in the 40 years before fiscal year 2008, when the most recent recession began. From 2015 through 2024, both revenues and outlays are projected to exceed their 40-year averages as measured relative to GDP (see Figure 1-2 on page 10). In CBO’s current baseline projections, federal debt held by the public reaches 77 percent of GDP by 2024, up from 72 percent at the end of 2013 and roughly twice the 39 percent average of the past four decades. As recently as the end of 2007, federal debt equaled just 35 percent of GDP. Such high and rising debt would have serious negative consequences for both the economy and the federal bud- get. When interest rates rise to more typical levels—as CBO expects to happen in the next few years—federal spending on interest payments will increase considerably. Moreover, when the federal government borrows, it increases the overall demand for funds, which generally raises the cost of borrowing and reduces lending to busi- nesses and other entities; the eventual result would be a smaller stock of capital and lower output and income than would otherwise be the case, all else being equal. In addition, the large amount of debt might restrict policy- makers’ ability to use tax and spending policies to respond to unexpected challenges, such as economic downturns or financial crises. Finally, continued growth in the debt might lead investors to doubt the govern- ment’s willingness or ability to pay its obligations, which would require the government to pay much higher interest rates on its borrowing. Although CBO’s current baseline projections show a slightly larger deficit for 2014 than the agency estimated in April, those new projections indicate smaller deficits over the 2015–2024 period. The projected deficit for this year is now $14 billion larger than the projection made in 1. See Congressional Budget Office, Updated Budget Projections: 2014 to 2024 (April 2014), www.cbo.gov/publication/45229.
- 12. 8 AN UPDATE TO THE BUDGET AND ECONOMIC OUTLOOK: 2014 TO 2024 AUGUST 2014 CBO Figure 1-1. Total Deficits or Surpluses Source: Congressional Budget Office. April; CBO’s estimates of outlays (primarily for Medicare and discretionary programs) declined, but its estimate of revenues dropped more. The projected cumulative deficit from 2015 through 2024 is $422 billion less than it was in April. Though revenues for that period are projected to be lower than the amounts that were previously reported, projected outlays have declined even more, largely because of lower anticipated interest payments. The Budget Outlook for 2014 In the absence of additional legislation that would affect spending or revenues this fiscal year, the deficit in 2014 will be more than $170 billion lower than the $680 bil- lion shortfall recorded in 2013, CBO estimates. The deficit will be smaller because revenues, which are expected to increase by about 8 percent, are growing much more rapidly this year than outlays, which CBO anticipates will increase by less than 2 percent. As a per- centage of GDP, the 2014 deficit is projected to drop to 2.9 percent from last year’s 4.1 percent. Outlays in 2014 Outlays are expected to increase by $57 billion this year, to a total of $3.5 trillion. CBO projects that spending will equal 20.4 percent of GDP—a drop from last year’s 20.8 percent and roughly equal to the average experienced over the past 40 years: Mandatory spending is projected to rise both in nominal terms and as a share of GDP in 2014, reaching 12.3 percent.2 Discretionary spending, by contrast, is expected to decline in nominal terms and to drop by 0.4 percent of GDP to 6.8 percent.3 Outlays for net interest are projected to rise in nominal terms but to remain unchanged relative to the size of the economy, at 1.3 percent. Mandatory Spending. Outlays for mandatory programs are projected to rise by $79 billion, or 4 percent, this year to $2.11 trillion (see Table 1-2 on page 12). Most manda- tory spending consists of outlays for Social Security and the federal government’s major health care programs— Medicare (net of premiums and other offsetting receipts), Medicaid, the Children’s Health Insurance Program, and subsidies for health insurance purchased through exchanges and related spending. By CBO’s estimate, the largest increases in net outlays, compared with spending 1974 1979 1984 1989 1994 1999 2004 2009 2014 2019 2024 -10 -8 -6 -4 -2 0 2 4 Average Deficit, 1974 to 2013 (-3.1%) Deficits Surpluses Actual Projected Percentage of Gross Domestic Product 2. Mandatory spending is governed by statutory criteria and is not normally controlled by the annual appropriation process. 3. Discretionary spending is controlled by annual appropriation acts in which policymakers specify how much money is to be provided for a broad array of government activities, including, for example, defense, law enforcement, and transportation.
- 13. CHAPTER ONE AN UPDATE TO THE BUDGET AND ECONOMIC OUTLOOK: 2014 TO 2024 9 CBO Table 1-1. CBO’s Baseline Budget Projections Source: Congressional Budget Office. Note: n.a. = not applicable; * = between zero and 0.05 percent. a. The revenues and outlays of the Social Security trust funds and the net cash flow of the Postal Service are classified as off-budget. Actual, 2015- 2015- 2013 2014 2015 2016 2017 2018 2019 2020 2021 2022 2023 2024 2019 2024 1,316 1,390 1,526 1,623 1,735 1,835 1,931 2,035 2,142 2,254 2,371 2,493 8,649 19,944 948 1,024 1,065 1,102 1,146 1,193 1,249 1,309 1,359 1,416 1,473 1,531 5,754 12,842 274 315 389 413 452 469 465 463 464 469 478 490 2,188 4,552 237 278 302 285 272 251 263 276 292 307 323 336 1,373 2,907_____ _____ _____ _____ _____ _____ _____ _____ _____ _____ _____ _____ _____ _____ 2,775 3,006 3,281 3,423 3,605 3,748 3,908 4,083 4,257 4,446 4,644 4,850 17,965 40,243 On-budget 2,102 2,270 2,514 2,626 2,774 2,882 3,005 3,143 3,280 3,430 3,589 3,755 13,801 30,998 Off-budgeta 673 736 767 797 830 867 903 940 977 1,015 1,055 1,095 4,164 9,245 2,032 2,110 2,312 2,500 2,601 2,689 2,840 2,989 3,159 3,378 3,504 3,634 12,941 29,604 1,202 1,170 1,188 1,192 1,194 1,208 1,237 1,264 1,291 1,326 1,352 1,377 6,019 12,628 221 231 251 287 340 412 492 566 627 687 746 799 1,782 5,207_____ _____ _____ _____ _____ _____ _____ _____ _____ _____ _____ _____ _____ _____ 3,455 3,512 3,750 3,979 4,135 4,308 4,569 4,820 5,076 5,391 5,601 5,810 20,741 47,439 On-budget 2,821 2,806 3,002 3,184 3,289 3,406 3,609 3,795 3,982 4,223 4,353 4,477 16,490 37,320 Off-budgeta 634 706 749 794 846 902 960 1,025 1,094 1,168 1,248 1,333 4,251 10,119 -680 -506 -469 -556 -530 -560 -661 -737 -820 -946 -957 -960 -2,777 -7,196 -719 -537 -487 -559 -515 -524 -604 -652 -702 -793 -764 -722 -2,689 -6,322 39 30 18 2 -16 -36 -57 -85 -117 -153 -193 -238 -87 -874 11,983 12,797 13,305 13,927 14,521 15,135 15,850 16,642 17,518 18,520 19,534 20,554 n.a. n.a. 16,632 17,197 17,975 18,924 19,889 20,788 21,686 22,618 23,577 24,565 25,581 26,622 99,262 222,225 7.9 8.1 8.5 8.6 8.7 8.8 8.9 9.0 9.1 9.2 9.3 9.4 8.7 9.0 5.7 6.0 5.9 5.8 5.8 5.7 5.8 5.8 5.8 5.8 5.8 5.7 5.8 5.8 1.6 1.8 2.2 2.2 2.3 2.3 2.1 2.0 2.0 1.9 1.9 1.8 2.2 2.0 1.4 1.6 1.7 1.5 1.4 1.2 1.2 1.2 1.2 1.2 1.3 1.3 1.4 1.3____ ____ ____ ____ ____ ____ ____ ____ ____ ____ ____ ____ ____ ____ 16.7 17.5 18.3 18.1 18.1 18.0 18.0 18.1 18.1 18.1 18.2 18.2 18.1 18.1 On-budget 12.6 13.2 14.0 13.9 14.0 13.9 13.9 13.9 13.9 14.0 14.0 14.1 13.9 13.9 Off-budgeta 4.0 4.3 4.3 4.2 4.2 4.2 4.2 4.2 4.1 4.1 4.1 4.1 4.2 4.2 12.2 12.3 12.9 13.2 13.1 12.9 13.1 13.2 13.4 13.8 13.7 13.6 13.0 13.3 7.2 6.8 6.6 6.3 6.0 5.8 5.7 5.6 5.5 5.4 5.3 5.2 6.1 5.7 1.3 1.3 1.4 1.5 1.7 2.0 2.3 2.5 2.7 2.8 2.9 3.0 1.8 2.3____ ____ ____ ____ ____ ____ ____ ____ ____ ____ ____ ____ ____ ____ 20.8 20.4 20.9 21.0 20.8 20.7 21.1 21.3 21.5 21.9 21.9 21.8 20.9 21.3 On-budget 17.0 16.3 16.7 16.8 16.5 16.4 16.6 16.8 16.9 17.2 17.0 16.8 16.6 16.8 Off-budgeta 3.8 4.1 4.2 4.2 4.3 4.3 4.4 4.5 4.6 4.8 4.9 5.0 4.3 4.6 -4.1 -2.9 -2.6 -2.9 -2.7 -2.7 -3.0 -3.3 -3.5 -3.8 -3.7 -3.6 -2.8 -3.2 -4.3 -3.1 -2.7 -3.0 -2.6 -2.5 -2.8 -2.9 -3.0 -3.2 -3.0 -2.7 -2.7 -2.8 0.2 0.2 0.1 * -0.1 -0.2 -0.3 -0.4 -0.5 -0.6 -0.8 -0.9 -0.1 -0.4 72.0 74.4 74.0 73.6 73.0 72.8 73.1 73.6 74.3 75.4 76.4 77.2 n.a. n.a. Net interest Corporate income taxes Outlays Discretionary Mandatory Total Other On-budget Payroll taxes Revenues Individual income taxes Individual income taxes Payroll taxes Corporate income taxes Other Total Outlays Discretionary Mandatory Net interest Total Deficit (-) or Surplus Total Debt Held by the Public Total Deficit (-) or Surplus On-budget Off-budgeta In Billions of Dollars As a Percentage of Gross Domestic Product Off-budgeta Debt Held by the Public Memorandum: Gross Domestic Product Revenues
- 14. 10 AN UPDATE TO THE BUDGET AND ECONOMIC OUTLOOK: 2014 TO 2024 AUGUST 2014 CBO Figure 1-2. Total Revenues and Outlays Source: Congressional Budget Office. in 2013, will be for those programs, for the government’s transactions with Fannie Mae and Freddie Mac, and for higher education. (Payments from Fannie Mae and Freddie Mac to the Treasury are recorded as reductions in outlays; CBO expects that such payments will be smaller this year than they were last year, thereby boosting out- lays.) Such increases in outlays will be partially offset by lower mandatory outlays for other programs, particularly unemployment compensation, the Federal Housing Administration’s (FHA’s) loan guarantee programs, and deposit insurance. Federal spending for the major health care programs will jump by $67 billion (or about 9 percent) in 2014, CBO estimates. The largest increase will be for Medicaid outlays, which are projected to grow by $40 billion (or 15 percent) this year, in part because some states have expanded eligibility for Medicaid coverage under the provisions of the Affordable Care Act (ACA). Similarly, subsidies for health insurance purchased through exchanges established under the ACA became available in January 2014. Outlays for those subsidies, along with related spending, will total $17 billion in 2014, CBO estimates. Spending for those purposes totaled $1 billion in 2013, primarily for grants to states to establish exchanges. (Subsidies for the purchase of insurance were not yet available in 2013.) Medicare outlays are continu- ing to grow at a modest rate in 2014; CBO expects that they will increase by $12 billion (about 2 percent), simi- lar to the rate of growth in 2013 (after adjusting for a shift in the timing of certain payments) and below the rate of growth in the number of Medicare beneficiaries. Outlays for Social Security benefits are projected to climb by $37 billion—or 4.6 percent—this year. That increase includes the effect of the 1.5 percent cost-of- living adjustment that beneficiaries received in January, as well as an estimated 2.1 percent increase in the number of beneficiaries. CBO estimates that net outlays for Fannie Mae and Freddie Mac as well as for higher education will be negative in 2014 as they were in 2013, but by smaller amounts. (Smaller negative outlays result in a larger defi- cit.) Payments from Fannie Mae and Freddie Mac to the Treasury are recorded as reductions in outlays (rather Outlays are projected to grow faster than revenues after 2018; as a result, projected deficits rise to almost 4 percent of GDP from 2022 through 2024. 1974 1979 1984 1989 1994 1999 2004 2009 2014 2019 2024 0 4 8 12 16 20 24 28 0 4 8 12 16 20 24 28 Outlays Revenues Average Outlays, 1974 to 2013 (20.5%) Average Revenues, 1974 to 2013 (17.4%) Actual Projected Percentage of Gross Domestic Product
- 15. CHAPTER ONE AN UPDATE TO THE BUDGET AND ECONOMIC OUTLOOK: 2014 TO 2024 11 CBO than as revenues) because they do not stem from the fed- eral government’s power to tax. Such payments totaled $97 billion in 2013 but will fall to $75 billion in 2014.4 Mandatory outlays for higher education were negative $26 billion in 2013 but are expected to total negative $4 billion this year. Those outlays include subsidies for student loans issued in the current year, revisions to the subsidy costs of loans made in previous years, and man- datory spending for the Federal Pell Grant Program. In CBO’s projections, outlays are negative for direct student loans because, over the life of the loan, the expected pay- ments received by the government are greater than the expected cost of making the loans as accounted for under the Federal Credit Reform Act. In the other direction, net spending for some programs will fall in 2014. For example, expenditures for unem- ployment compensation are expected to decline for a fourth consecutive year. Such spending, which totaled $69 billion in 2013, will fall to $43 billion in 2014, CBO estimates, primarily because the authority to pay emer- gency benefits expired at the end of December 2013. (The 2014 amount is roughly one-quarter of what the federal government spent for unemployment benefits in 2010, when spending for such benefits peaked at $159 billion.) Mandatory outlays for the loan guarantee programs of the Federal Housing Administration mostly represent the revisions made each year to the estimated costs of guaran- tees made in previous years, as required by the Federal Credit Reform Act. (Those revisions are called credit sub- sidy reestimates. The budgetary effects of new guarantees each year are categorized as discretionary.) In 2013, the Administration recorded mandatory outlays of $27.6 billion for reestimates related to FHA’s loan guar- antee programs; this year, it recorded a much smaller amount, $0.7 billion—a reduction in mandatory outlays of $27 billion. (Those outlays are reflected in the “Other” line under “Other Programs” in Table 1-2.) In 2014, premium payments by financial institutions for deposit insurance will exceed spending by $14 billion, CBO projects, resulting in net outlays of negative $14 billion. In contrast, net outlays for deposit insurance totaled a positive $4 billion last year, mostly because receipts from premiums and assessments were lower. As a result, net outlays for deposit insurance will fall by $18 billion. In addition, spending for both the Supple- mental Nutrition Assistance Program and for agriculture programs is estimated to fall by about $6 billion, relative to the amounts recorded in 2013. Discretionary Spending. CBO anticipates that outlays from annual appropriations will total $1.17 trillion in 2014, which is $32 billion (or 3 percent) less than they were last year (see Table 1-3 on page 14). That decline is almost entirely attributable to a drop in defense spending: Defense outlays, which amounted to $626 billion in 2013, will fall by $32 billion (or about 5 percent) to $594 billion in 2014, according to CBO’s calculations, marking the third consecutive year in which such spend- ing has declined. Much of that drop is the result of lower spending on military operations in Afghanistan, which will fall by roughly $20 billion this year, CBO estimates. All told, defense outlays this year are expected to be about 15 percent less than they were at their peak in 2011; CBO estimates that roughly half of that decline stems from lower spending for military operations in Afghanistan and Iraq. CBO expects that nondefense discretionary outlays will total $576 billion in 2014. That amount would be about the same as such spending last year and 12 percent less than its peak in 2010, when outlays were boosted by spending from the American Recovery and Reinvestment Act of 2009. 4. In CBO’s baseline, transactions with Fannie Mae and Freddie Mac are recorded differently for 2014 than they are for the 2015– 2024 period. Because the government placed Fannie Mae and Freddie Mac into conservatorship in 2008 and now controls their operations, CBO considers the activities of those two entities to be governmental. Therefore, for the 10-year period that follows the current fiscal year, CBO projects the subsidy costs of the entities’ new activities using procedures similar to those specified in the Federal Credit Reform Act of 1990 for determining the costs of federal credit programs, but with adjustments to reflect the market risk associated with those activities. The Administration, by contrast, considers Fannie Mae and Freddie Mac to be outside the federal government for budgetary purposes and records cash transactions between them and the Treasury as federal outlays or receipts. (In CBO’s view, those transactions are intragovernmental.) To provide CBO’s best estimate of what the Treasury will ultimately report as the federal deficit for 2014, CBO’s current baseline includes an estimate of the cash receipts from the two entities to the Treasury for this year (while retaining its risk-adjusted projections of subsidy costs for later years).
- 16. 12 AN UPDATE TO THE BUDGET AND ECONOMIC OUTLOOK: 2014 TO 2024 AUGUST 2014 CBO Table 1-2. Mandatory Outlays Projected in CBO’s Baseline Billions of Dollars Continued Actual, 2015- 2015- 2013 2014 2015 2016 2017 2018 2019 2020 2021 2022 2023 2024 2019 2024 Social Security Old-Age and Survivors Insurance 668 703 740 782 832 886 944 1,008 1,072 1,139 1,210 1,286 4,185 9,900 Disability Insurance 140 142 147 152 157 163 169 176 185 194 204 215 789 1,762___ ___ ___ ___ ___ ____ ____ ____ ____ ____ ____ ____ ____ _____ Subtotal 808 845 887 935 989 1,049 1,113 1,184 1,257 1,333 1,414 1,500 4,974 11,662 Major Health Care Programs Medicarea 585 603 620 667 683 703 774 826 883 979 1,009 1,038 3,446 8,181 Medicaid 265 305 328 366 395 416 438 461 485 511 539 570 1,943 4,509 Exchange subsidies and related spendingb 1 17 50 84 103 103 109 116 123 129 134 137 450 1,088 Children's Health Insurance Program 9 10 11 10 6 6 6 6 6 6 6 6 39 67___ ___ ____ ____ ____ ____ ____ ____ ____ ____ ____ ____ ____ _____ Subtotala 861 935 1,009 1,127 1,187 1,228 1,327 1,407 1,497 1,625 1,688 1,751 5,878 13,846 Income Security Programs Earned income, child, and other tax creditsc 84 86 88 91 92 93 76 77 78 80 81 82 441 839 Supplemental Nutrition Assistance Program 83 77 78 78 77 75 74 74 74 73 73 74 382 749 Supplemental Security Income 53 54 55 61 58 55 62 63 65 72 69 65 291 626 Unemployment compensation 69 43 37 38 40 42 45 48 51 54 56 59 201 469 Family support and foster cared 32 31 31 32 32 32 32 32 33 33 33 34 159 323 Child nutrition 20 20 22 23 24 25 26 27 28 29 30 32 119 264___ ___ ___ ___ ___ ___ ___ ___ ___ ___ ___ ___ ____ ____ Subtotal 340 310 311 322 323 322 314 321 328 340 343 345 1,593 3,270 Federal Civilian and Military Retirement Civiliane 92 94 96 100 102 105 109 112 116 120 124 128 513 1,112 Military 54 55 57 63 60 57 63 64 66 73 70 67 299 639 Other 7 8 8 8 8 8 9 10 10 10 10 10 40 90___ ___ ___ ___ ___ ___ ___ ___ ___ ___ ___ ___ ___ ____ Subtotal 153 157 161 170 170 170 180 186 192 202 204 205 852 1,841 Veterans' Programsf Income security 66 71 74 83 79 74 83 84 85 93 87 81 392 822 Other 14 16 23 20 17 18 19 19 20 21 22 22 97 201__ __ __ __ __ __ ___ ___ ___ ___ ___ ___ ___ ____ Subtotal 80 88 96 103 96 92 102 103 105 114 109 103 489 1,023 Other Programs Agriculture 24 18 12 15 14 14 14 14 14 14 14 14 69 140 MERHCF 8 9 10 10 11 11 12 13 14 14 15 16 54 126 Deposit insurance 4 -14 -10 -10 -9 -9 -15 -17 -11 -13 -14 -15 -53 -123 Higher education -26 -4 -8 -8 -5 -3 -2 -3 -3 -4 -4 -4 -26 -43 Other 84 53 68 68 70 67 61 61 61 61 62 63 334 642__ __ __ __ __ __ __ __ __ __ __ __ ___ ___ Subtotal 95 62 71 75 80 81 70 68 74 73 74 74 377 741 Total
- 17. CHAPTER ONE AN UPDATE TO THE BUDGET AND ECONOMIC OUTLOOK: 2014 TO 2024 13 CBO Table 1-2. Continued Mandatory Outlays Projected in CBO’s Baseline Billions of Dollars Source: Congressional Budget Office. Notes: Data on spending for benefit programs in this table generally exclude administrative costs, which are discretionary. MERHCF = Department of Defense Medicare-Eligible Retiree Health Care Fund (including TRICARE for Life). a. Gross spending, excluding the effects of Medicare premiums and other offsetting receipts. (Net Medicare spending is included in the memorandum section of the table.) b. Subsidies for health insurance purchased through exchanges established under the Affordable Care Act. c. Includes outlays for the American Opportunity Tax Credit and other credits. d. Includes the Temporary Assistance for Needy Families program, the Child Support Enforcement program, the Child Care Entitlement program, and other programs that benefit children. e. Includes Civil Service, Foreign Service, Coast Guard, and other, smaller retirement programs as well as annuitants’ health care benefits. f. Income security includes veterans’ compensation, pensions, and life insurance programs. Other benefits are primarily education subsidies. Most of the costs of veterans’ health care are classified as discretionary spending and thus are not shown in this table. g. Includes premium payments, recoveries of overpayments made to providers, and amounts paid by states from savings on Medicaid’s prescription drug costs. h. The amounts recorded for 2013 and 2014 reflect cash payments from Fannie Mae and Freddie Mac to the Treasury and are therefore recorded as offsetting receipts. In addition, CBO estimates net mandatory spending totaling $16 billion between 2015 and 2024. Those amounts are included on the “Other” line of the category “Other Programs” and reflect CBO's estimate of the subsidy cost of new loans and guarantees made by those two entities in each year, adjusted for market risk. i. Consists of outlays for Medicare, Medicaid, subsidies for health insurance purchased through exchanges and related spending, and the Children’s Health Insurance Program. Medicare spending is net of premiums paid by beneficiaries and other offsetting receipts. Actual, 2015- 2015- 2013 2014 2015 2016 2017 2018 2019 2020 2021 2022 2023 2024 2019 2024 Offsetting Receipts Medicareg -93 -99 -103 -109 -117 -126 -136 -144 -154 -166 -179 -191 -591 -1,426 Federal share of federal employees' retirement Social Security -16 -16 -17 -18 -18 -19 -20 -20 -21 -22 -22 -23 -91 -199 Military retirement -21 -20 -20 -20 -21 -22 -22 -23 -24 -25 -25 -26 -105 -229 Civil service retirement and other -29 -29 -30 -30 -33 -34 -35 -36 -37 -39 -40 -41 -162 -355___ ___ ___ ___ ___ ___ ___ ___ ___ ___ ___ ___ ___ ___ -66 -65 -67 -68 -72 -74 -77 -79 -82 -85 -88 -91 -358 -783 Receipts related to natural resources -15 -14 -15 -15 -14 -17 -17 -18 -18 -18 -19 -21 -79 -172 MERHCF -9 -8 -7 -8 -8 -9 -9 -10 -10 -11 -12 -12 -41 -96 Fannie Mae and Freddie Mach -97 -75 0 0 0 0 0 0 0 0 0 0 0 0 Other -25 -26 -33 -32 -34 -27 -27 -29 -30 -30 -30 -29 -152 -300___ ___ ___ ___ ___ ___ ___ ___ ___ ___ ___ ___ ___ ___ Subtotal -305 -287 -225 -232 -245 -253 -266 -280 -294 -310 -327 -344 -1,222 -2,778 Total Mandatory Outlays 2,032 2,110 2,312 2,500 2,601 2,689 2,840 2,989 3,159 3,378 3,504 3,634 12,941 29,604 Memorandum: Mandatory Spending Excluding the Effects of Offsetting Receipts 2,336 2,397 2,537 2,732 2,845 2,942 3,106 3,270 3,453 3,689 3,831 3,977 14,163 32,382 Spending for Medicare Net of Offsetting Receipts 492 504 517 558 566 576 638 681 729 813 830 848 2,855 6,755 Spending for Major Health Care Programs Net of Offsetting Receiptsi 768 835 906 1,018 1,070 1,101 1,191 1,263 1,343 1,459 1,508 1,560 5,286 12,420 Total Subtotal
- 18. 14 AN UPDATE TO THE BUDGET AND ECONOMIC OUTLOOK: 2014 TO 2024 AUGUST 2014 CBO Table 1-3. Discretionary Spending Projected in CBO’s Baseline Billions of Dollars Source: Congressional Budget Office. Notes: CBO’s baseline projections incorporate the assumption that the caps on discretionary budget authority and the automatic enforcement procedures specified in the Budget Control Act of 2011 (as amended) remain in effect through 2021. Nondefense discretionary outlays are usually higher than budget authority because of spending from the Highway Trust Fund and the Airport and Airway Trust Fund that is subject to obligation limitations set in appropriation acts. The budget authority for such programs is provided in authorizing legislation and is not considered discretionary. n.a. = not applicable. a. The amount of budget authority for 2014 in CBO’s baseline does not match the sum of the spending caps plus adjustments to the caps, for two main reasons. First, $18 billion in savings from changes to mandatory programs in the final appropriation legislation were credited against the caps; in CBO’s baseline, those savings appear in their normal mandatory accounts. Second, estimates for certain offsetting collections have been reduced by about $4 billion, boosting estimated budget authority for some accounts. b. The caps for 2013 applied to “security” and “nonsecurity” funding rather than to defense and nondefense funding. The security category comprised discretionary appropriations for the Departments of Defense, Homeland Security, and Veterans Affairs; the National Nuclear Security Administration; the intelligence community management account (Treasury account 95-0401-0-1-054); and discretionary accounts related to international affairs (budget function 150). The nonsecurity category comprised all other discretionary appropriations. Most discretionary budget authority for 2013 was further reduced by sequestration in that year—for defense programs, by 7.8 percent, and for nondefense programs, by 5.0 percent, though the caps themselves were not reduced. c. Funding for overseas contingency operations, emergencies, disaster relief, and certain program integrity initiatives (which identify and reduce overpayments in some benefit programs) is generally not constrained by the statutory caps established by the Budget Control Act. In CBO’s baseline, funding for those purposes is extrapolated from the amount provided in 2014 with adjustments for inflation. If future funding equaled the amounts projected in CBO’s baseline, the caps would be revised upward by equivalent amounts. Actual, 2015- 2015- 2013 2014a 2015 2016 2017 2018 2019 2020 2021 2022 2023 2024 2019 2024 Budget Authority 600 606 608 612 626 641 656 672 688 705 722 740 3,144 6,672 540 527 506 506 517 530 544 558 570 584 599 614 2,603 5,528_____ _____ _____ _____ _____ _____ _____ _____ _____ _____ _____ _____ _____ _____ Total 1,140 1,133 1,114 1,118 1,144 1,171 1,200 1,230 1,259 1,289 1,321 1,354 5,747 12,200 626 594 598 610 616 623 641 656 671 693 704 716 3,088 6,528 576 576 589 582 578 585 595 608 620 633 648 661 2,930 6,100_____ _____ _____ _____ _____ _____ _____ _____ _____ _____ _____ _____ _____ _____ Total 1,202 1,170 1,188 1,192 1,194 1,208 1,237 1,264 1,291 1,326 1,352 1,377 6,019 12,628 Memorandum: Caps in the Budget Control Act (as Amended), Including Automatic Reductions to the Caps Defense n.a. 521 521 523 536 549 562 576 590 n.a. n.a. n.a. 2,691 n.a. Nondefense n.a. 492 492 492 504 515 529 543 555 n.a. n.a. n.a. 2,533 n.a._____ _____ _____ _____ _____ _____ _____ _____ _____ _____ Total 1,043 b 1,012 1,014 1,015 1,040 1,065 1,092 1,119 1,145 n.a. n.a. n.a. 5,225 n.a. Defense n.a. 86 87 89 90 92 94 96 98 n.a. n.a. n.a. 453 n.a. Nondefense n.a. 13 13 14 14 14 14 15 15 n.a. n.a. n.a. 69 n.a.____ ____ ____ ____ ____ ____ ____ ____ ____ ____ Total 153 b 99 100 102 104 107 109 111 113 n.a. n.a. n.a. 522 n.a. Defense Adjustments to the Capsc Outlays Defense Nondefense Total Nondefense
- 19. CHAPTER ONE AN UPDATE TO THE BUDGET AND ECONOMIC OUTLOOK: 2014 TO 2024 15 CBO Net Interest. Outlays for the budget category “net interest” consist of the government’s interest payments on debt held by the public minus interest income the government receives. Such outlays will rise by nearly 5 percent, to $231 billion this year from $221 billion last year, CBO estimates. Because interest rates remain very low by historical standards, those amounts are similar to the net interest outlays 15 to 20 years ago, when the gov- ernment’s debt was much smaller. Much of the growth in 2014 results from continued accumulation of debt as well as higher inflation this year, which has boosted the cost of inflation-protected securities issued by the Treasury. Revenues in 2014 On the basis of tax collections through July 2014, CBO expects federal revenues to total $3.0 trillion this fiscal year, $231 billion (or about 8 percent) more than in 2013. Individual income and payroll (social insurance) taxes, the two largest sources of revenues, are expected to record the largest gains in nominal dollars. Receipts from both corporate income taxes and remittances by the Federal Reserve, two smaller sources of revenues, are expected to increase by smaller dollar amounts (though by larger percentages). CBO expects total revenues rela- tive to the size of the economy to rise from 16.7 percent in 2013 to 17.5 percent in 2014, close to the average of the past 40 years (17.4 percent). Individual Income Taxes. CBO anticipates that collec- tions of individual income taxes will increase by $73 billion (or about 6 percent) in 2014. Withheld income taxes, which are generally about triple the size of nonwithheld income tax receipts, account for most of the increase in revenues, primarily because of increases in wages and salaries. Receipts from nonwithheld income taxes are also expected to increase, largely because of the effects of higher nonwage income in 2013 and 2014 on quarterly estimated payments. Payroll Taxes. CBO expects that receipts from payroll taxes—which primarily fund Social Security and Medi- care’s Hospital Insurance program—will increase by $76 billion (or about 8 percent).5 The increase in payroll tax receipts largely reflects increases in wages and salaries and a change in tax law. Specifically, the 2 percentage- point payroll tax cut that was in effect in calendar years 2011 and 2012 expired in January 2013, so the tax rates in effect from October 2012 through December 2012 (the first quarter of fiscal year 2013) were lower than those in place during the rest of fiscal year 2013 and all of fiscal year 2014. Corporate Income Taxes. Income tax payments by corporations, net of refunds, are expected to increase by $41 billion (or about 15 percent) this year. Most of that increase, CBO estimates, results from the expiration of various tax provisions at the end of calendar year 2013. In particular, taxable profits have increased in calendar year 2014 as a result of the expiration at the end of calendar year 2013 of rules that allowed firms with large amounts of investment to expense—that is, immediately deduct— 50 percent of their investments in equipment.6 However, regulations governing estimated tax payments allow firms to delay some of the resulting increase in tax payments until fiscal year 2015. Remittances From the Federal Reserve. Much of the remaining increase in revenues results from remittances from the Federal Reserve, which are expected to increase in fiscal year 2014 by $25 billion (or about 33 percent). That increase is attributable primarily to the larger size of the central bank’s portfolio of securities and to a higher yield on that portfolio. Comparison With OMB’s Recent Estimates The Office of Management and Budget (OMB) recently updated its budget projections.7 For 2014, OMB anticipates a deficit of $561 billion—$55 billion more than CBO’s estimate—if there is no further legislation affecting revenues or spending. Differing estimates of discretionary outlays account for about two-thirds of that gap: Based on past experience and on data for the fiscal year to date, CBO expects that many programs will spend their appropriations more slowly than OMB anticipates. Mandatory spending in CBO’s baseline is also below OMB’s estimate—by $14 billion—primarily because 5. In the federal budget, payroll tax receipts are referred to as “social insurance and retirement receipts.” 6. By contrast, businesses with relatively small amounts of investment in new equipment have been permanently allowed since 1982 to fully deduct those costs in the year in which the equipment was placed in service, although the maximum amount of such investments allowed to be deducted has changed over time. 7. OMB’s most recent update was published in Office of Manage- ment and Budget, Fiscal Year 2015 Mid-Session Review: Budget of the U.S. Government (July 11, 2014), www.whitehouse.gov/omb/ budget/MSR.
- 20. 16 AN UPDATE TO THE BUDGET AND ECONOMIC OUTLOOK: 2014 TO 2024 AUGUST 2014 CBO Figure 1-3. Components of the Total Increase in Outlays in CBO’s Baseline Between 2014 and 2024 Source: Congressional Budget Office. Notes: The category “Major Health Care Programs” consists of Medicare, Medicaid, the Children’s Health Insurance Program, and subsidies for health insurance purchased through exchanges and related spending. (Medicare spending is net of premiums paid by beneficiaries and other offsetting receipts.) The category “All Other Programs” consists of all mandatory programs other than Social Security, the major health care programs, and net interest, as well as defense and nondefense discretionary programs. CBO anticipates that net outlays for deposit insurance will be $5 billion below OMB’s estimate and that outlays for Medicare and Medicaid will each be $4 billion lower. CBO’s estimates of both revenues and net interest spend- ing in 2014 are higher than what OMB anticipates, by $13 billion and $7 billion, respectively. CBO’s Baseline Budget Projections for 2015 to 2024 Under the assumption that fiscal policy unfolds as specified by current law, CBO projects that the budget deficit will shrink again in 2015, to $469 billion, or 2.6 percent of GDP. Between 2016 and 2024, deficits would follow an upward trend, reaching $960 billion, or almost 4 percent of GDP, by the end of the period.8 CBO’s baseline projections are not a forecast of future outcomes. They are constructed in accordance with pro- visions of the Balanced Budget and Emergency Deficit Control Act of 1985 and the Congressional Budget and Impoundment Control Act of 1974. As those laws spec- ify, CBO constructs its baseline projections under the assumption that current laws will generally remain unchanged; the projections can therefore serve as a benchmark against which potential changes in law can be measured. However, even if federal laws remained unchanged for the next decade, actual budgetary outcomes would almost certainly differ from CBO’s baseline projections, perhaps significantly, because of unanticipated changes in eco- nomic conditions and other factors that affect federal spending and revenues. CBO’s projections of outlays and revenues depend on the agency’s economic projections for the coming decade—including forecasts for such vari- ables as interest rates, inflation, and GDP—as well as myriad technical factors. Discrepancies between those projections and actual outcomes can result in significant differences between baseline budget projections and actual outcomes. For example, in February, CBO esti- mated that if the rate of inflation was higher (or lower) than CBO projects by 1 percentage point each year, baseline deficits over the 10-year period would be about $0.8 trillion larger (or smaller).9 Outlays From 2015 Through 2024 Under current law, total outlays are projected to hover around 21 percent of GDP—their average for the past 40 years—through 2020 and then to rise, totaling close to 22 percent of GDP from 2021 through 2024. In nom- inal terms, outlays would grow, on net, by $2.3 trillion between 2014 and 2024, CBO estimates, an average annual increase of 5.2 percent. The three fastest-growing components of the budget— Social Security, the major health care programs, and net interest—account for 85 percent of the total increase in outlays over the coming decade (see Figure 1-3). Through 2024, spending for Social Security is projected Three components of the budget account for 85 percent of the total increase in outlays over the coming decade. Total Increase in Outlays: $2.3 Trillion All Other Programs (15%) Net Interest (25%) Social Security (28%) Major Health Care Programs (32%) 8. CBO’s updated baseline projections incorporate the effects of legislation enacted through August 7, 2014. 9. For further discussion, see Congressional Budget Office, The Budget and Economic Outlook: 2014 to 2024 (February 2014), Appendix D, www.cbo.gov/publication/45010.
- 21. CHAPTER ONE AN UPDATE TO THE BUDGET AND ECONOMIC OUTLOOK: 2014 TO 2024 17 CBO to grow by about $650 billion, an increase of almost 80 percent, and outlays for the major health care pro- grams (net of offsetting receipts) are projected to rise by more than $720 billion, an increase of more than 85 percent. Net interest outlays in 2024 are projected to be more than triple interest outlays in 2014, increasing by almost $570 billion during that period—the result of both projected growth in federal debt and a rise in interest rates. During the same period, mandatory spending apart from that for Social Security and the major health care programs is projected to rise by about $150 billion, an increase of about one-third, and discretionary spending is projected to rise by about $210 billion, an increase of less than one-fifth. Mandatory Spending. For most mandatory spending pro- grams, CBO’s projections incorporate the assumption that current laws continue unchanged and reflect antici- pated developments in the economy, demographics, and other factors. They also incorporate the effects of seques- tration—across-the-board reductions in funding imposed by the Budget Control Act of 2011 (as amended)—on the programs subject to it through 2024. CBO projects that under current law, mandatory spend- ing (net of offsetting receipts, which are recorded as reductions in outlays) would increase from $2.1 trillion in 2014 to $3.6 trillion in 2024, an average yearly increase of roughly 5½ percent. As a percentage of GDP, mandatory spending is projected to be about 13 percent between 2015 and 2020 and then to rise, reaching nearly 14 percent of GDP from 2022 through 2024.10 During the past 40 years, mandatory spending has averaged 10.0 percent of GDP (though it has exceeded that aver- age in every year since 2002—reflecting the significant growth in spending for Social Security and the major health care programs in the past decade). Under current law, outlays for Social Security and the major health care programs would grow from 10.0 per- cent of GDP in 2015 to 11.5 percent in 2024, CBO projects; spending for Social Security is currently greater than spending for those health care programs, but under current law, that ranking would be reversed in 2015 and later years (see Figure 1-4). In CBO’s baseline projections: Spending for both Social Security and Medicare remains fairly stable as a percentage of GDP for the first half of the projection period. However, spending for those programs rises relative to GDP in the second half of the period, mostly because of the aging of the population. By 2024, Social Security and net Medicare outlays reach 5.6 percent and 3.2 percent of GDP, respectively, compared with 4.9 percent and 2.9 percent in 2014 (see Figure 1-5). Federal outlays for Medicaid rise as a share of GDP over the next 10 years, from 1.8 percent in 2014 to 2.1 percent in 2024. There are three main reasons for that growth: More states are expected to expand Medicaid coverage under the provisions of the ACA; more people in states that have already expanded such coverage are expected to enroll in Medicaid; and federal spending for Medicaid benefits per person is expected to increase over time. Spending on subsidies for health insurance purchased through exchanges, along with related spending, increases from 0.1 percent of GDP in 2014 to 0.5 percent in 2024.11 Such subsidies became available in 2014 for people who met income and other eligibility criteria. All told, spending on the government’s major health care programs, net of offsetting receipts, increases from 4.9 percent of GDP in 2014 to 5.9 percent of GDP in 2024. 10. In CBO’s baseline, mandatory outlays dip from 13.8 percent of GDP in 2022 to 13.7 percent in 2023 and to 13.6 percent in 2024. That pattern results largely from shifts in the timing of certain payments. Because October 1, 2022, and October 1, 2023, will fall on weekends, certain federal payments that are due on each of those days will instead be made at the end of the preceding September and thus be shifted into the previous fiscal year. Without those timing shifts, mandatory outlays in CBO’s baseline would increase from 13.5 percent of GDP in 2022 to 13.9 percent in 2024. 11. That calculation includes the outlays for risk adjustment, reinsurance, and risk corridor payments, which reallocate cash flows among insurers and are offset over time on the revenue side of the budget.
- 22. 18 AN UPDATE TO THE BUDGET AND ECONOMIC OUTLOOK: 2014 TO 2024 AUGUST 2014 CBO Figure 1-4. Projected Outlays for Major Budget Categories Source: Congressional Budget Office. Notes: The category “Major Health Care Programs” consists of Medicare, Medicaid, the Children’s Health Insurance Program, and subsidies for health insurance purchased through exchanges and related spending. (Medicare spending is net of premiums paid by beneficiaries and other offsetting receipts.) “Other Mandatory Spending” is all mandatory spending other than that for major health care programs, Social Security, and net interest. All other mandatory spending, net of offsetting receipts, declines as a share of GDP, from 2.5 percent in 2014 to 2.2 percent in 2024. Included in that category, for example, are programs that provide income support (such as unemployment compen- sation and the Supplemental Nutrition Assistance Program), military and civilian retirement, veterans’ benefits, and agriculture spending. That decline is projected to occur because spending for many of the programs included in that category rises roughly with inflation, and the rate of inflation is projected to be well below the rate of growth in nominal GDP. Discretionary Spending. Discretionary spending encom- passes a wide array of federal activities funded or controlled through annual appropriations—including, for example, most defense spending and outlays for high- way programs, elementary and secondary education, housing assistance, international affairs, and administra- tion of justice. Measured as a share of GDP, discretionary outlays are projected to drop from 6.8 percent in 2014 to 5.2 percent in 2024; over the past 40 years, they have averaged 8.3 percent. Spending for Social Security and the federal government's major health care programs is projected to rise from 9.5 percent of GDP in 2013 to 11.5 percent in 2024. 2013 2014 2015 2016 2017 2018 2019 2020 2021 2022 2023 2024 0 1 2 3 4 5 6 Major Health Care Programs Social Security Net Interest Percentage of Gross Domestic Product Other Mandatory Spending Nondefense Discretionary Spending Defense Discretionary Spending
- 23. CHAPTER ONE AN UPDATE TO THE BUDGET AND ECONOMIC OUTLOOK: 2014 TO 2024 19 CBO Figure 1-5. Spending and Revenues Projected in CBO’s Baseline, Compared With Levels in 1974 Source: Congressional Budget Office. Notes: The category “Major Health Care Programs” consists of Medicare, Medicaid, the Children’s Health Insurance Program, and subsidies for health insurance purchased through exchanges and related spending. (Medicare spending is net of premiums paid by beneficiaries and other offsetting receipts.) “Other Mandatory Spending” is all mandatory spending other than that for major health care programs, Social Security, and net interest. For discretionary spending, CBO’s baseline incorporates the caps on budget authority put in place by the Budget Control Act, including the reductions in those caps that are scheduled to occur in fiscal years 2016 through 2021 under the law’s automatic enforcement procedures.12 However, appropriations for programs not constrained by the caps—for overseas contingency operations (military operations and related activities in Afghanistan and other countries), activities designated as emergency require- ments, disaster relief (up to certain limits), and certain efforts to reduce overpayments in benefit programs— are assumed to grow with inflation from the amounts provided in 2014.13 For 2015, the caps on discretionary budget authority for defense and nondefense programs are each less than $1 billion above those for 2014. However, the year-to- year changes in the budget authority projected in the baseline are different: Discretionary budget authority for nondefense programs in CBO’s baseline declines by $21 billion in 2015 primarily because, in 2014, some reductions in mandatory budget authority were included in appropriation legislation to help keep funding within the caps. CBO’s baseline for discretionary programs for 2015 does not include such changes to mandatory programs (since no further changes of that sort have been enacted yet), so satisfying the caps would require providing less discretionary budget authority in that year (unless similar changes to mandatory programs are legislated again in the appropriation process).14 2024 2014 1974 3.7 4.9 5.6 1.0 4.9 5.9 2.7 2.5 2.2 -0.4 -2.9 -3.6 Social Security Major Health Care Programs Total Revenues Deficit Other Mandatory Spending 5.4 3.5 2.7 Defense Discretionary Spending 3.9 3.4 2.5 Nondefense Discretionary Spending 2024 2014 1974 18.1 20.4 21.8 Total Outlays Percentage of Gross Domestic Product 1.4 1.3 3.0 Net Interest 2024 2014 1974 17.7 17.5 18.2 12. Budget authority refers to the authority provided by law to incur financial obligations that will result in immediate or future outlays of federal government funds. 13. Spending for certain transportation programs is controlled by obligation limitations, which are also not constrained by the caps on discretionary spending. 14. CBO has also updated its estimates of offsetting collections— some fees and other charges that are triggered by appropriation action and credited against discretionary spending for the particular accounts affected. In total, those estimates have been reduced, boosting estimated budget authority by about $4 billion relative to what CBO had previously estimated.
- 24. 20 AN UPDATE TO THE BUDGET AND ECONOMIC OUTLOOK: 2014 TO 2024 AUGUST 2014 CBO For defense programs, budget authority in CBO’s baseline is $2 billion higher in 2015 than in 2014 as a result of the slightly higher cap and the assumption that funding for overseas contingency operations next year will grow from this year’s level at the rate of inflation. After 2015, CBO projects, discretionary budget authority would rise by about 2 percent a year, on average, reflect- ing the rate of increase in the caps called for under the Budget Control Act. In the baseline, total discretionary outlays grow very slowly over the next few years—at an annual average rate of less than 1 percent between 2015 and 2018—and then keep pace with the projected 2 percent annual increase in budget authority, reaching $1.4 trillion by the end of the projection period. Net Interest. CBO expects two factors to sharply boost the government’s interest payments on debt held by the public during the coming decade—rising interest rates and growing debt. Between calendar years 2014 and 2019, CBO expects, the interest rate on 3-month Treasury bills will rise from 0.1 percent to 3.5 percent and the rate on 10-year Treasury notes will rise from 2.8 percent to 4.7 percent; both will remain at those levels through 2024. At the same time, debt held by the public is projected to increase significantly under current law. That debt consists mostly of securities that the Treasury issues to raise cash to fund the federal government’s activities and to pay off its maturing liabilities. The net amount that the Treasury borrows by selling those securities (the amounts that are sold minus the amounts that have matured) is influenced primarily by the annual budget deficit. In addition, the Treasury borrows to provide financing for student loans and other credit programs; CBO projects that such additional borrowing, often called other means of financing, will average roughly $55 billion per year during the 2015–2024 period. After accounting for all of the government’s borrowing needs, CBO projects that under current law, debt held by the public would rise from $12.8 trillion at the end of 2014 to $20.6 trillion at the end of 2024 (see Table 1-4). Relative to the size of the economy, it would stay between 72 percent and 74 percent of GDP through 2020 but then grow steadily, reaching 77 percent of GDP at the end of 2024. Although CBO has reduced its projection of interest outlays over the 10-year projection period relative to its previous baseline (see Appendix A), rising interest rates and growing federal debt are still projected to raise net interest payments significantly. According to CBO’s esti- mates, such payments would increase from $231 billion in 2014, or 1.3 percent of GDP, to $799 billion in 2024, or 3.0 percent of GDP—the highest ratio since 1996. Revenues From 2015 Through 2024 Total revenues are projected to rise from 17.5 percent of GDP this year to 18.3 percent of GDP in 2015, largely as a result of changes in provisions of law that have already been implemented and, to a lesser extent, the ongoing economic expansion and new fees and fines scheduled to take effect under the ACA. During the rest of the decade beginning in 2015, total revenues are projected to remain relatively stable as a share of GDP, fluctuating between 18.0 percent and 18.3 percent—compared with their 40-year average of 17.4 percent of GDP. That stability in total revenues as a percentage of GDP after 2015 reflects roughly offsetting movements in three revenue sources: Individual income tax receipts are projected to continue to increase relative to GDP, as a result of real bracket creep, increases in withdrawals from tax- deferred retirement accounts as more baby boomers retire, changes in tax provisions, and other factors. Corporate income tax receipts are projected to decline relative to the size of the economy after 2017 largely because of an expected drop in domestic economic profits relative to GDP as a result of growing labor costs, rising interest payments on businesses’ debt, and increasing depreciation deductions from a changing composition of business capital. Remittances to the Treasury from the Federal Reserve—which have been very large since 2010 because of changes in the size and composition of the central bank’s portfolio—are projected to decline to more typical levels.
- 25. CHAPTER ONE AN UPDATE TO THE BUDGET AND ECONOMIC OUTLOOK: 2014 TO 2024 21 CBO Table 1-4. Federal Debt Projected in CBO’s Baseline Billions of Dollars Source: Congressional Budget Office. Note: GDP = gross domestic product. a. Debt held by the public minus the value of outstanding student loans and other credit transactions, financial assets (such as preferred stock) purchased from institutions participating in the Troubled Asset Relief Program, cash balances, and other financial instruments. b. Federal debt held by the public plus Treasury securities held by federal trust funds and other government accounts. c. The amount of federal debt that is subject to the overall limit set in law. Debt subject to limit differs from gross federal debt mainly because most debt issued by agencies other than the Treasury and the Federal Financing Bank is excluded from the debt limit. That limit was most recently set at $17.2 trillion but has been suspended through March 15, 2015. On March 16, the debt limit will be raised to its previous level plus the amount of federal borrowing that occurred while the limit was suspended. d. The average interest rate is calculated as net interest divided by debt held by the public. All told, CBO estimates that, under current law, revenues would grow at an average annual rate of 4.9 percent from 2014 to 2024, slightly slower than the rate of increase in spending. Individual Income Taxes. If current laws do not change, receipts from individual income taxes are expected to rise markedly relative to GDP over the next 10 years—from 8.1 percent in 2014, just above the average of 7.9 percent over the past 40 years, to 9.4 percent by 2024, higher than in all but two of the past 40 years. That increase would result from the following: Real Bracket Creep. In CBO’s projections, the largest factor pushing up average individual income tax rates— that is, income taxes as a percentage of total income—is real bracket creep. That phenomenon occurs because the income tax brackets and exemptions under both the regular income tax and the alternative minimum tax are indexed only to inflation and not for growth in real, or Actual, 2013 2014 2015 2016 2017 2018 2019 2020 2021 2022 2023 2024 Debt Held by the Public at the 11,281 11,983 12,797 13,305 13,927 14,521 15,135 15,850 16,642 17,518 18,520 19,534 Changes in Debt Held by the Public Deficit 680 506 469 556 530 560 661 737 820 946 957 960 Other means of financing 22 309 39 65 64 53 54 55 56 57 56 61___ ___ ___ ___ ___ ___ ___ ___ ___ ___ ___ ___ Total 701 815 508 622 595 613 715 792 876 1,002 1,013 1,021 Debt Held by the Public at the 11,983 12,797 13,305 13,927 14,521 15,135 15,850 16,642 17,518 18,520 19,534 20,554 Memorandum: Debt Held by the Public at the End of the Year (As a percentage of GDP) 72.0 74.4 74.0 73.6 73.0 72.8 73.1 73.6 74.3 75.4 76.4 77.2 Debt Held by the Public Minus Financial Assetsa In billions of dollars 11,067 11,589 12,017 12,532 13,022 13,541 14,163 14,863 15,649 16,561 17,488 18,417 As a percentage of GDP 66.5 67.4 66.9 66.2 65.5 65.1 65.3 65.7 66.4 67.4 68.4 69.2 Gross Federal Debtb 16,719 17,804 18,426 19,165 19,905 20,668 21,514 22,420 23,379 24,421 25,457 26,515 Debt Subject to Limitc 16,699 17,783 18,405 19,144 19,883 20,646 21,492 22,398 23,357 24,399 25,436 26,494 Average Interest Rate on Debt Held by the Public (Percent)d 1.8 1.8 1.9 2.1 2.3 2.7 3.1 3.4 3.6 3.7 3.8 3.9 Beginning of the Year End of the Year
- 26. 22 AN UPDATE TO THE BUDGET AND ECONOMIC OUTLOOK: 2014 TO 2024 AUGUST 2014 CBO inflation-adjusted, income.15 When real economic growth occurs, total income grows faster than the inflation-indexed tax brackets do, pushing more income into higher tax brackets. That factor causes projected revenues relative to GDP to rise by 0.5 percentage points from 2014 to 2024. Increases in Distributions From Tax-Deferred Retirement Accounts. CBO expects that in coming years, as more members of the baby-boom generation retire, taxable distributions from tax-deferred retirement accounts will grow more rapidly than GDP. Those distributions are also expected to increase relative to GDP over the next few years because balances in those accounts have been boosted of late by substantial increases in equity prices. By CBO’s estimate, the increase in distributions from such accounts will cause revenues relative to GDP to rise by 0.2 percentage points between now and 2024. Changes in Tax Provisions. Certain tax provisions that reduced revenues expired at the end of calendar year 2013, including rules allowing corporate and non- corporate businesses to accelerate depreciation deductions more than was allowed for most years before 2008 and more than is allowed currently. (Income of noncorporate business owners is subject to the individual income tax.) The effect of those expiring provisions and other changes in tax rules causes individual income tax revenues in CBO’s baseline to rise by 0.2 percentage points between 2014 and 2015, and that increase largely persists thereaf- ter through 2024. Other Factors. Other factors are projected to raise individ- ual income tax receipts as a share of GDP by 0.4 percent- age points between now and 2024. Among those factors is an expectation that earnings will grow faster for higher- income people than for others during the next decade— as they have over the past several decades—causing a larger share of income to be taxed at higher rates.16 In addition, total earnings are projected to rise slightly rela- tive to GDP from 2016 to 2024, reflecting a gradual recovery in the labor share of national income (see Chapter 2 for a more detailed discussion). Payroll Taxes. Receipts from payroll taxes are projected to decline slightly relative to the size of the economy in the next two years, from 6.0 percent of GDP this year to 5.8 percent in 2016, and to decline further to 5.7 percent in 2024. Much of the decline through 2016 reflects a reduction in receipts from states’ deposits to unemploy- ment trust funds.17 Those receipts grew rapidly following the recession, as states increased their deposits to replen- ish trust funds that had been depleted because of high unemployment and the resulting large payments of unemployment insurance benefits. But as trust fund balances grew in 2013 and 2014, those state deposits began to decline; CBO expects them to continue to fall to more typical levels over the next few years. Payroll tax receipts as a percentage of GDP continue to decline very gradually in CBO’s baseline through 2024 because, as earnings grow faster for higher-income people than for others over the next decade, a greater share of earnings would be above the taxable maximum amount for Social Security. That effect is only partially offset by the projected rise in wages and salaries as a share of GDP over the period. Corporate Income Taxes. Under current law, CBO pro- jects that corporate income tax receipts would rise from 1.8 percent of GDP in 2014 to 2.3 percent of GDP by 2017. That jump reflects a continuing increase in the average corporate tax rate on domestic economic profits (that is, corporate tax receipts as a percentage of domestic economic profits). The projected increase in the average corporate tax rate stems largely from a waning of various factors that have held the rate down since the recession. The rate fell sharply from 2007 to 2010, in part because of a signifi- cant drop in corporations’ realizations of capital gains and in part because of a sharp increase in deductions of bad 15. The alternative minimum tax is a parallel income tax system with fewer exemptions, deductions, and rates than the regular income tax. Households must calculate the amount that they owe under both the alternative minimum tax and the regular income tax, and then pay the larger of the two amounts. 16. That increase in individual income tax receipts is partially offset in CBO’s baseline by a decrease in payroll tax receipts. Faster growth in earnings for higher-income people would lower the average payroll tax rate because a greater share of earnings would be above the taxable maximum amount for Social Security ($117,000 in 2014, indexed to growth in average earnings for all workers). 17. Deposits by states to their unemployment trust funds are consid- ered federal revenues. Those deposits typically stem from taxes that states levy on employers’ wage payments but can also include lump-sum amounts from other sources, such as from the proceeds of issuing bonds.
- 27. CHAPTER ONE AN UPDATE TO THE BUDGET AND ECONOMIC OUTLOOK: 2014 TO 2024 23 CBO debts from corporate income. Since then, the rate has risen somewhat, but it has not returned to its 2007 level and remains low by historical standards. Although the reasons for the low rate in the past two years will not become clear until detailed information from corporate tax returns becomes available in the future, CBO expects that whatever factors have been at work will dissipate as the economy continues to recover. The resulting increase in the average corporate tax rate is projected to boost cor- porate receipts relative to GDP by 0.4 percentage points between 2014 and 2017. Expiring tax provisions also contribute significantly to the increase in projected corporate receipts from 2014 to 2015, but that effect is temporary and is mostly gone by 2017. In particular, the expiration of the provisions that allowed firms to expense 50 percent of their investments in equipment is expected to boost receipts substantially in 2015, but the effects wane in nominal dollars after 2015 because the provisions affected the timing of deductions rather than their overall amount. After the next few years, corporate income tax receipts are projected to decline again relative to the size of the econ- omy—from 2.3 percent of GDP in 2017 to 1.8 percent in 2024. That decrease is attributable mainly to a pro- jected drop in corporations’ domestic economic profits as a share of GDP, which is expected to result primarily from growing labor costs, rising interest payments on businesses’ debt, and increasing depreciation deductions on the stock of business capital as it shifts toward faster- depreciating property. Receipts From Other Sources. The federal government also collects revenues from excise taxes, estate and gift taxes, customs duties, remittances from the Federal Reserve, and miscellaneous fees and fines. CBO projects that, all together, revenues from those sources will decline from 1.6 percent of GDP this year to 1.3 percent of GDP in 2024. Remittances of the Federal Reserve are expected to fall from 0.6 percent of GDP this year—their highest level in history—to below 0.2 percent of GDP by 2024. In recent years, the central bank has significantly expanded the size of its asset holdings and changed the composition of those holdings, boosting its earnings and subsequent remittances to the Treasury far above typical levels. CBO anticipates that the size and composition of the Federal Reserve’s portfolio, along with its remittances to the Treasury, will gradually return to amounts roughly in line with historical experience. Under current law, those declining receipts from the Federal Reserve would be partially offset, CBO estimates, by rising receipts from other sources. The largest such change is in miscellaneous fees and fines, which are pro- jected to increase from 0.2 percent of GDP in 2014 to 0.3 percent of GDP in each year between 2015 and 2024 as new fees and fines under the ACA take effect. Alternative Assumptions About Fiscal Policy To illustrate how different decisions by policymakers about federal spending programs and the federal tax system would affect future deficits, CBO estimated the budgetary effects of several alternative policies (see Table 1-5). The discussion here focuses on the policies’ direct effects on revenues and outlays, but the changes also would affect the costs of paying interest on federal debt (shown separately in the table). Military and Diplomatic Operations in Afghanistan and Other War-Related Activities The first alternative path addresses spending for overseas contingency operations. The outlays projected in the baseline come from budget authority provided for those purposes in 2013 and prior years, the $92 billion in budget authority provided for 2014, and the roughly $1.0 trillion that is projected to be appropriated over the 2015–2024 period (under the assumption that annual funding is set at $92 billion, with adjustments for antici- pated inflation, in accordance with the rules governing baseline projections).18 In coming years, the funding required for overseas con- tingency operations might be smaller than the amounts projected in the baseline if the number of deployed troops and the pace of operations diminished over time. For that reason, CBO has formulated a budget scenario that reflects a reduction in the number of U.S. troops deployed abroad for military actions, and a concomitant reduction in related diplomatic operations and foreign aid. Many other scenarios—some costing more and some less—are also possible. 18. Funding for overseas contingency operations in 2014 includes $85 billion for military operations and indigenous security forces and $7 billion for diplomatic operations and foreign aid.
- 28. 24 AN UPDATE TO THE BUDGET AND ECONOMIC OUTLOOK: 2014 TO 2024 AUGUST 2014 CBO Table 1-5. Budgetary Effects of Selected Policy Alternatives Not Included in CBO’s Baseline Billions of Dollars Continued In 2013, the number of active-duty, reserve, and National Guard personnel deployed for war-related activities aver- aged about 125,000, and that total has declined to about 100,000 in 2014, CBO estimates. In this alternative sce- nario, the average number of military personnel deployed for war-related purposes would decline further over three years: to 70,000 in 2015, 50,000 in 2016, and 30,000 in 2017 and thereafter. (Those levels could represent various allocations of forces around the world.) Under that sce- nario, and assuming that the war-related funding for dip- lomatic operations and foreign aid declines at a similar rate, total discretionary outlays over the 2015–2024 period would be $615 billion less than the amount in the baseline.19 Other Discretionary Spending Policymakers could vary discretionary funding in many ways from the amounts projected in the baseline. For example, if lawmakers eliminated or modified the caps on discretionary funding and set appropriations to grow each year through 2024 at the same rate as inflation after 2015- 2015- 2014 2015 2016 2017 2018 2019 2020 2021 2022 2023 2024 2019 2024 Reduce the Number of Troops Deployed for Overseas Contingency Operations to 30,000 by 2017a Effect on the deficitb 0 19 38 51 61 68 72 74 76 77 78 238 615 Debt service 0 * 1 2 4 8 11 15 18 22 26 15 108 Increase Discretionary Appropriations at the Rate of Inflation After 2014c Effect on the deficitb 0 -24 -49 -61 -68 -74 -79 -85 -89 -93 -96 -276 -718 Debt service 0 * -1 -3 -5 -9 -13 -17 -21 -26 -31 -18 -126 Freeze Most Discretionary Appropriations at the 2014 Amountd Effect on the deficitb 0 -11 -15 0 21 45 70 96 124 154 184 40 668 Debt service 0 * * -1 * 1 3 7 12 18 26 * 66 Maintain Medicare's Payment Rates for Physicians at the Current Ratee Effect on the deficitb 0 -7 -10 -12 -11 -11 -13 -14 -16 -18 -18 -52 -131 Debt service 0 * * -1 -1 -2 -2 -3 -4 -5 -6 -4 -23 Remove the Effect of the Automatic Enforcement Procedures Specified in the Budget Control Actf Effect on the deficitb n.a. -6 -63 -87 -95 -98 -101 -100 -102 -109 -113 -350 -874 Debt service n.a. * -1 -3 -7 -12 -16 -21 -26 -32 -38 -22 -156 Policy Alternatives That Affect Discretionary Outlays Policy Alternative That Affects Both Discretionary and Mandatory Outlays Total Policy Alternative That Affects Mandatory Outlays 19. Legislation that placed limits on appropriations for overseas contingency operations that were below the amounts in CBO’s baseline would result in estimated reductions in spending relative to the outlays in CBO’s baseline, which are based on the projection of $1.0 trillion in budget authority over 10 years, extrapolated from 2014 funding. That sum, however, is just a baseline projection; such funding has not yet been provided, and there are no funds in the Treasury set aside for that purpose. As a result, reductions relative to the baseline might simply reflect policy decisions that have already been made and that would be realized even without such funding constraints. Moreover, if future policymakers believed that national security required appropriations above the capped amounts, they would almost certainly provide emergency appropriations that would not, under current law, be counted against the caps.
- 29. CHAPTER ONE AN UPDATE TO THE BUDGET AND ECONOMIC OUTLOOK: 2014 TO 2024 25 CBO Table 1-5. Continued Budgetary Effects of Selected Policy Alternatives Not Included in CBO’s Baseline Billions of Dollars Sources: Congressional Budget Office; staff of the Joint Committee on Taxation. Notes: Negative numbers indicate an increase in the deficit; positive numbers indicate a decrease in the deficit. * = between -$500 million and $500 million; n.a. = not applicable. a. For this alternative, CBO does not extrapolate the $92 billion in budget authority for military operations, diplomatic activities, and foreign aid in Afghanistan and other countries provided for 2014. Rather, the alternative incorporates the assumption that the number of troops falls to about 30,000 by 2017, and that funding for overseas contingency operations declines as well, to $58 billion in 2015, $44 billion in 2016, and then to about $30 billion per year from 2017 on—for a total of $340 billion over the 2015–2024 period. b. Excludes debt service. c. These estimates reflect the assumption that appropriations will not be constrained by caps set by the Budget Control Act of 2011 and will instead grow at the rate of inflation from their 2014 level. Discretionary funding related to federal personnel is inflated using the employment cost index for wages and salaries; other discretionary funding is adjusted using the gross domestic product price index. d. This option reflects the assumption that appropriations other than those for overseas contingency operations would generally be frozen at the 2014 amount through 2024. e. Medicare’s current payment rates for physicians’ services are scheduled to drop by 24 percent on April 1, 2015, and to change by small amounts in subsequent years. In this alternative, payment rates are assumed to continue at their current levels through 2024. f. The Budget Control Act of 2011 specified that if lawmakers did not enact legislation originating from the Joint Select Committee on Deficit Reduction that would reduce projected deficits by at least $1.2 trillion, automatic procedures would go into effect to reduce both discretionary and mandatory spending during the 2013–2021 period. Those procedures are now in effect and take the form of equal cuts (in dollar terms) in funding for defense and nondefense programs. For the 2016–2021 period, the automatic procedures lower the caps on discretionary budget authority specified in the Budget Control Act (caps for 2014 and 2015 were revised by the Bipartisan Budget Act of 2013); for the 2022–2024 period, CBO has extrapolated the reductions estimated for 2021. Nonexempt mandatory programs will be reduced through sequestration; those provisions have been extended through 2024. The budgetary effects of this option cannot be combined with those of any of the alternatives that affect discretionary spending other than the one to reduce the number of troops deployed for overseas contingency operations. g. These estimates are mainly from the staff of the Joint Committee on Taxation and are preliminary. They reflect the impact of extending about 70 tax provisions. Nearly all of those provisions have been extended previously; some, such as the research and experimentation tax credit, have been extended multiple times. 2014, discretionary spending would be $718 billion higher for that period than it is in the baseline. If, by contrast, lawmakers kept appropriations for 2015 through 2024 at the nominal 2014 amount, total discre- tionary outlays would be $668 billion lower over that period. Under that scenario (sometimes called a freeze in regular appropriations), total discretionary spending would fall from 6.8 percent of GDP in fiscal year 2014 to 4.5 percent in 2024. Medicare’s Payments to Physicians Spending for Medicare’s payments to physicians is con- strained by a rate-setting system called the sustainable growth rate. If the system is allowed to operate as cur- rently structured, the fees that physicians receive for their services will be reduced by about 24 percent in April 2015 and will increase and decrease by small amounts in subsequent years, CBO projects. If, instead, lawmakers overrode those scheduled reductions—as they have every 2015- 2015- 2014 2015 2016 2017 2018 2019 2020 2021 2022 2023 2024 2019 2024 0 -139 -79 -73 -70 -88 -85 -86 -89 -93 -96 -448 -897 0 -1 -3 -6 -10 -15 -19 -24 -29 -34 -39 -34 -179 in CBO's Baseline 102 97 97 96 97 98 100 102 104 106 108 486 1,005 -506 -469 -556 -530 -560 -661 -737 -820 -946 -957 -960 -2,777 -7,196 Total Deficit in CBO's Baseline Policy Alternative That Affects the Tax Code Extend Expiring Tax Provisionsg Effect on the deficitb Debt service Memorandum: Outlays for Overseas Contingency Operations
- 30. 26 AN UPDATE TO THE BUDGET AND ECONOMIC OUTLOOK: 2014 TO 2024 AUGUST 2014 CBO year since 2003—spending on Medicare would be greater than the amounts projected in CBO’s baseline. For exam- ple, holding payment rates through 2024 at current levels would raise outlays for Medicare (net of premiums paid by beneficiaries) by $131 billion (or about 2 percent) between 2015 and 2024. The overall effect of the policy on Medicare (and on the deficit) would depend on whether lawmakers offset the effects of the change, as they often have done in the past, with other changes to reduce deficits. Automatic Spending Reductions The Budget Control Act put in place automatic proce- dures to reduce discretionary and mandatory spending through 2021. Those procedures require equal reductions (in dollar terms) in defense and nondefense spending. The Bipartisan Budget Act canceled the reductions in discretionary budget authority for 2014 and 2015 and instead set new caps for those years. Other legislation extended the reductions to mandatory spending through 2024. If lawmakers chose to prevent those automatic cuts each year—starting in 2015 for mandatory programs and in 2016 for discretionary programs—without making other changes that reduced spending, total outlays over the 2015–2024 period would be $874 billion (or about 2 percent) higher than the amounts in CBO’s baseline. Total discretionary outlays would be $753 billion (or 6 percent) higher, and outlays from mandatory pro- grams—most of which are not subject to sequestration— would be $121 billion (or 0.4 percent) higher.20 Revenues A host of tax provisions, many of which have been extended repeatedly, have recently expired or are scheduled to expire over the next decade. If all of those provisions were permanently extended, CBO and the staff of the Joint Committee on Taxation (JCT) estimate, revenues would be lower—and outlays for refundable tax credits would be higher (although by a much smaller amount)—by a total of $897 billion over the 2015–2024 period. Most of those tax provisions expired at the end of December 2013. They include a provision allowing businesses to immediately deduct 50 percent of new investments in equipment, which JCT estimates accounts for $244 billion of the budgetary effects of extending all of the provisions. The largest budgetary cost of extending all of the tax provisions is estimated to occur in 2015 because the estimates reflect the assumption that the provisions would be extended retroactively but too late for any bud- getary effects to occur in 2014; those effects that would have occurred in 2014 would instead affect tax collec- tions and payments for refundable tax credits in 2015. The estimated budgetary cost increases starting in 2019 because certain provisions affecting refundable tax credits are scheduled to expire at the end of December 2017. Extending those provisions would boost outlays for refundable credits and reduce revenues by a total of about $163 billion over the 2019–2024 period. (Payments for refundable credits are typically made a year after the applicable tax year.) Changes in CBO’s Baseline Projections Since April 2014 CBO completed its previous set of baseline projections in April 2014. Since then, the agency has increased its esti- mate of the deficit in 2014 by $14 billion, mostly because receipts from corporate income taxes are turning out to be less than CBO anticipated; in contrast, the agency has reduced its baseline projection of the cumulative deficit from 2015 to 2024 by $422 billion. (For details on the revisions beyond those provided in this section, see Appendix A.) CBO has lowered projected total outlays from 2015 through 2024 by $753 billion (or about 2 percent): Projections of net interest payments, which have been reduced by $618 billion, account for most of the total revision in outlays; about three-quarters of that reduction stems from lower projected interest rates (as discussed in Chapter 2). Mandatory spending in the baseline is lower by $133 billion. Revisions to the economic forecast account for $81 billion of that reduction, and technical changes account for an additional $56 billion. Recently enacted legislation relating to veterans’ health care and the Highway Trust Fund partially offset those reductions, increasing mandatory outlays by $5 billion over the 10-year period. 20. Because of interactions between the effects of different policy options, the estimated budgetary effects of this option cannot be added to the estimated budgetary effects of any of the alternatives that affect discretionary spending other than the one to reduce the number of troops deployed for overseas contingency operations.