The document summarizes an experimental study of gas hydrate formation and deposition in oil and condensate systems using a visual rocking cell. Key findings include:
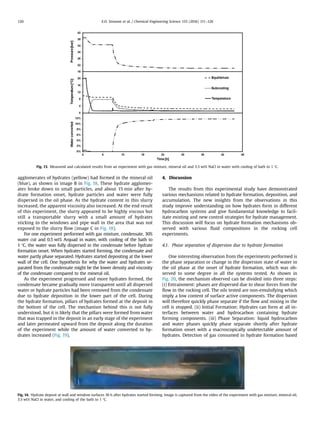
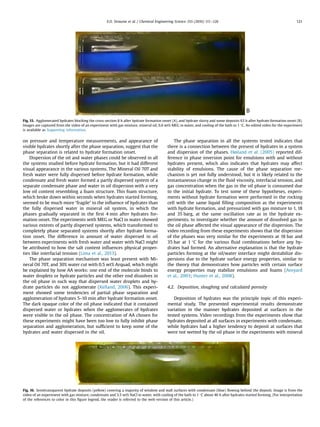
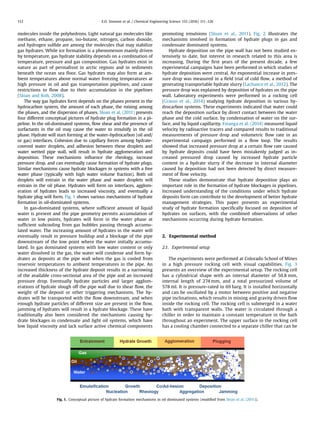
- Hydrate deposition was observed in all systems tested, with higher deposition on surfaces exposed to condensate or gas compared to oil-wetted surfaces.
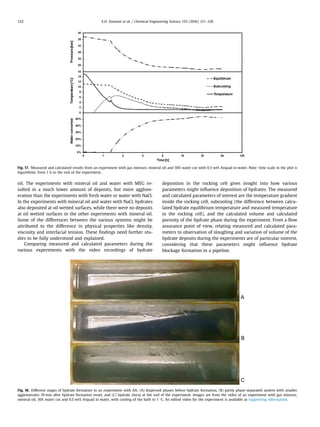
- Porous hydrate deposits formed under conditions with a large temperature gradient and high subcooling, which then suffered sloughing due to fluid shear.
- Hydrate formation in a system with mineral oil, 30% water cut, and an anti-agglomerant resulted in a transportable hydrate slurry.

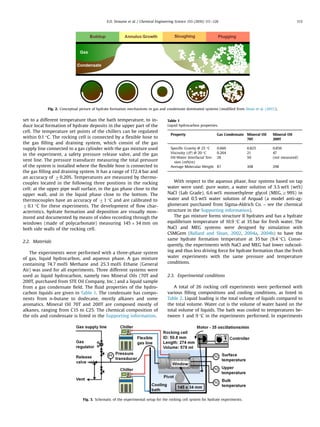
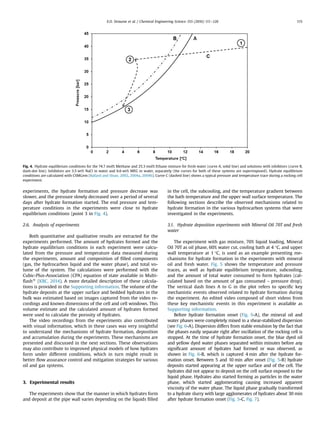
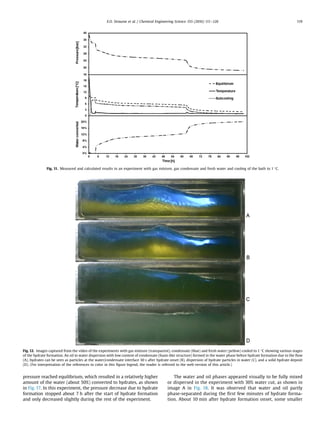
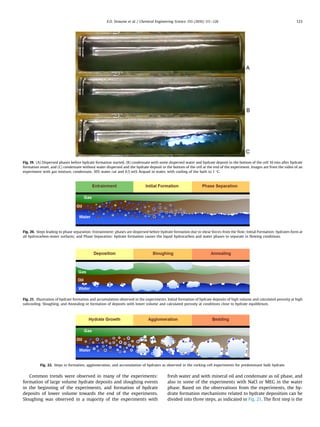
![with higher bath temperature than 1 °C, the upper wall was cooled
to 1 °C. Cooling of the surrounding bath to a higher temperature
resulted in lower subcooling, and a temperature gradient in the
rocking cell that favored hydrate deposition at the upper pipe wall.
The pressure during an experiment decreased from about 39 bar
before cooling to between 16 and 30 bar (depending on the
cooling temperature) at hydrate equilibrium conditions at the end
of the experiment. Consequently, the amount of water converted
to hydrates also varies depending on the pressure decrease due to
hydrate formation during an experiment.
2.4. Experimental procedure
The preparation of an experiment started with cleaning of the
rocking cell with water and dish cleaning soap followed by a
throughout rinsing with deionized water to remove any remaining
surfactants from the cleaning procedure. The water, liquid hydro-
carbon and optionally additives were then filled by weight under
atmospheric conditions. After filling of the liquid components, the
flexible gas line and hoses to chiller controlling the upper wall
temperature were connected, and the rocking cell was placed in
the temperature controlled bath. The rocking cell was then pres-
surized with gas to 38 barg at 20 °C and oscillated for about one
hour at constant temperature in order to saturate the liquid hy-
drocarbon phase with the gas mixture.
When stable pressure indicated that the liquid had been satu-
rated, the data acquisition for the experiment was started. The set
point temperature of the chillers controlling the bath and upper
pipe wall temperatures were changed from 20 °C to the experi-
mental temperatures for the given experiment, and kept at these
temperatures throughout the length of the experiment. The os-
cillation rate of the rocking cell was set to a constant rate of 35
oscillations per minute throughout the entire experiment.
After an experiment was stopped, the system was heated to
20 °C again, and if a new experiment was planned with the same
fluids, the new experiment was started when all the hydrates had
dissociated and the pressure and temperature had stabilized. The
“memory effect” was important in experiments with NaCl or MEG
in the water phase because the thermodynamic inhibitor reduced
the subcooling. It was difficult to initiate hydrate formation in
these experiments. The hydrates were therefore dissociated at a
temperature just slightly above the hydrate equilibrium tem-
perature at the set pressure in these experiments in order to form
hydrates faster in the next experiment. When the planned ex-
periments of a given filling composition of the rocking cell were
completed, the system was depressurized slowly to atmospheric
conditions. The flexible gas line and hoses to chiller were dis-
connected, and the liquids of the rocking cell were emptied to li-
quid waste disposal containers.
2.5. Constant volume hydrate formation experiments
The rocking cell is a closed system in which the exchange of
components between phases and change of volumes of the phases
are restricted to the conditions that both total volume and total
amount of each component are constant in the system. The pres-
sure will therefore change depending on the temperature and the
amount of the phases present in the system. Fig. 4 shows the
upper temperature limit for stable hydrates at a given pressures,
which is called hydrate equilibrium temperature, for the gas
composition used in the experiment with the various water
compositions. The typical temperature and pressure trace during
an experiment is also given in the same figure.
As illustrated in the figure, the pressure of this closed volume
system decrease slightly due to contraction of the gas phase while
cooling from start conditions (point 1) to hydrate formation onset
(point 2). Hydrate formation may occur when the temperature and
pressure conditions are such that hydrates are stable with the
given filling of gas, oil and water in the rocking cell. However,
experiments have shown that it is necessary to cool the system to
a subcooling some degrees lower than the hydrate equilibrium
temperature before hydrate formation starts, when there are in-
itially no hydrates present in the system.
The start of hydrate formation (point 2 in Fig. 4) in an experi-
ment could be detected by a rapid decrease of pressure caused by
the gas consumed in the formed hydrates. The temperature would
also slightly increase at the time of hydrate formation, due to the
heat released from the phase change, as illustrated in Fig. 4. The
experiments were run for at least 24 h after hydrate formation
started. In some of the experiments, the pressure stopped de-
creasing after a few hours after it had reached the hydrate equi-
librium pressure at the experimental temperature. In other
Table 2
Experiments performed with various combinations of fluids and experimental conditions.
Number of
experiments
Liquid loading and
water cut
Oil phase Water phase Bath temperature [°C] Upper wall temperature
[°C]
Water converted to hy-
drates [%]
6 70% LL 60% WC Mineral Oil 70T Fresh water 1–9 1 or off 5.1–12.2
2 70% LL 60% WC Mineral Oil 200T Fresh water 1–6 1 or off 7.5–8.0
5 70% LL 60% WC Gas Condensate Fresh water 1–8 1 or off 8.3–21.2
2 70% LL 60% WC Mineral Oil 70T 3.5 wt% NaCl in
water
1–6 1 or off 5.5–11.8
3 70% LL 60% WC Gas Condensate 3.5 wt% NaCl in
water
1–6 1 or off 9.9–21.5
2 70% LL 60% WC Mineral Oil 70T 6.6 wt% MEG in
water
1 off 11.5–15.7n
2 70% LL 60% WC Gas Condensate 6.6 wt% MEG in
water
1 off 19.3–23.3nn
2 70% LL 60% WC Mineral Oil 70T 0.5 wt% Arquad in
water
1–6 1 or off 8.0–13.5
1 57% LL 30% WC Mineral Oil 70T 0.5 wt% Arquad in
water
1 off 52.4
1 59% LL 30% WC Gas Condensate 0.5 wt% Arquad in
water
1 off 76.4
n
The first experiment was performed at 35.9 barg and 12.3 °C as initial conditions after hydrates had first been formed at temperatures below 0 °C and dissociated. The
second experiment was performed at 45.5 barg and 20.1 °C as initial conditions.
nn
The experiments were performed at 36.8 barg and 14.9 °C, and 39.6 barg and 15.2 °C, respectively, as initial conditions after hydrates had first been formed at
temperatures below 0 °C and dissociated.
E.O. Straume et al. / Chemical Engineering Science 155 (2016) 111–126114](https://image.slidesharecdn.com/8828c182-5885-48b7-aa44-555f2db9946e-160928142107/85/13095-4-320.jpg)