1.3 COMBINED COMMON-SIZE AND BASE YEAR ANALYSIS
•Download as DOCX, PDF•
3 likes•11,247 views

Working with Financial Statements COMBINED COMMON-SIZE AND BASE YEAR ANALYSIS

Recommended
Recommended
More Related Content
What's hot
What's hot (20)
Similar to 1.3 COMBINED COMMON-SIZE AND BASE YEAR ANALYSIS
Similar to 1.3 COMBINED COMMON-SIZE AND BASE YEAR ANALYSIS (20)
More from Amani A.Abu Mandeel
More from Amani A.Abu Mandeel (9)
Recently uploaded
Recently uploaded (20)
1.3 COMBINED COMMON-SIZE AND BASE YEAR ANALYSIS
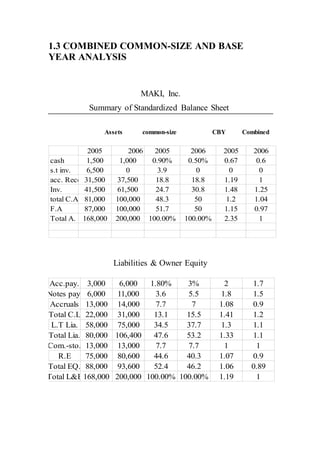
- 1. 1.3 COMBINED COMMON-SIZE AND BASE YEAR ANALYSIS MAKI, Inc. Summary of Standardized Balance Sheet Assets common-size CBY Combined 200620052006200520062005 0.60.670.50%0.90%1,0001,500cash 0003.906,500s.t inv. 11.1918.818.837,50031,500acc. Rece. 1.251.4830.824.761,50041,500Inv. 1.041.25048.3100,00081,000total C.A 0.971.155051.7100,00087,000F.A 12.35100.00%100.00%200,000168,000Total A. Liabilities & Owner Equity 1.723%1.80%6,0003,000Acc.pay. 1.51.85.53.611,0006,000Notes pay. 0.91.0877.714,00013,000Accruals 1.21.4115.513.131,00022,000Total C.L 1.11.337.734.575,00058,000L.T Lia. 1.11.3353.247.6106,40080,000Total Lia. 117.77.713,00013,000Com.-sto. 0.91.0740.344.680,60075,000R.E 0.891.0646.252.493,60088,000Total EQ. 11.19100.00%100.00%200,000168,000Total L&E
- 2. Firstly: Common-Base Year Statement Common-Base Year Financial Statements (Trend Analysis): Select a base year and then express each item or account as a percent of the base-year value of that item. This is useful for picking up trends through time. This statement is a useful way of standardizing financial statements in this case is to choose a base year and then express each item relative to the base year. For example, from 2005 to 2006, MAKI inventory rose from $ 41,500 to $ 61,500. If we pick 2005 as our base year, then we set inventory equal to 1.48 for that year. For the next year, we would calculate inventory relative to the base year as (41,500/61,500) =0.67 in this case, we could say inventory grew by about %81 during the year, and so on for the other items. We calculate common-base year by this formula: Item by the common year/ Item base year= Secondly: Combined common-size and Base Year Analysis: Combined Common-Size and Base (Year Analysis): Express each item in base year as a percent of either total assets or sales. Then, compare each subsequent year’s common-size percent to the base-year percent (abstracts from the growth in assets and sales).
- 3. MAKI's accounts receivable were % 18.8 or $ 31,500 of total assets in 2005. In 2006, they had risen to 37,500, which was %18.8 of total assets. If we do our analysis in terms of dollars. Then the 2006 figure would be $37,500/31,500 = 1.19, representing a %29 increase in receivables. However, if we work with the common-size statements, then the 2006 figure would be 18.8%/18.8%=1. This tells us accounts receivable, as percentage of total assets, grew by zero. Roughly speaking, what we see is that of 1.19 percent total increase, about zero percent ( %1.19-0%) is attributed simply a growth in total assets. We calculate Combined Common-Size and Base Year Assets by this formula: = Common-size amount common year%/ Common- size amount base year%.