The document provides a technical analysis of the QE Index and key Qatari stocks to consider, offering the following assessments:
- The QE Index gained points after four days of falling and may continue to rally if it moves above 12,650, otherwise it could retreat to test 12,600.
- Gulf International Services advanced after consolidation and may surpass resistance at QR90 to reach QR93, but could consolidate if it fails to move above QR90.
- The QERI Index rebounded after five days of losses but needs to move above 4,200 to gain momentum, or it risks consolidating and retesting 4,150.
- Nakilat cleared an interim resistance and may test QR
QNBFS Daily Market Report December 24, 2023QNB Group
The QE Index rose 0.8% to close at 10,285.3. Gains were led by the Transportation and Banks & Financial Services indices, gaining 1.4% and 1.2%, respectively.
QNBFS Daily Market Report October 04, 2023QNB Group
The QE Index rose 0.2% to close at 10,273.3. Gains were led by the Transportation and Consumer Goods & Services indices, gaining 1.7% and 0.1%, respectively.
QNBFS Daily Technical Trader Qatar - October 04, 2023 التحليل الفني اليومي لب...QNB Group
The General Index failed to sustain its breakout above the double-bottom formation’s neckline and continued with its decline into the formation’s territory.
QNBFS Daily Technical Trader Qatar - September 28, 2023 التحليل الفني اليومي ...QNB Group
The General Index failed to sustain its breakout above the double-bottom formation’s neckline and continued with its decline into the formation’s territory.
QNBFS Daily Market Report September 24, 2023QNB Group
The QE Index rose 0.3% to close at 10,323.0. Gains were led by the Transportation and Industrials indices, gaining 0.8% each. Top gainers were Qatar Navigation and Al Khaleej Takaful Insurance Co., rising 3.3% and 2.0%, respectively.
QNBFS Daily Technical Trader Qatar - September 24, 2023 التحليل الفني اليومي ...QNB Group
The General Index failed to sustain its breakout above the double-bottom formation’s neckline and continued with its decline into the formation’s territory.
QNBFS Daily Technical Trader Qatar - September 19, 2023 التحليل الفني اليومي ...QNB Group
The General Index failed to sustain its breakout above the double-bottom formation’s neckline and continued with its decline into the formation’s territory.
QNBFS Daily Market Report September 17, 2023QNB Group
The QE Index declined 0.5% to close at 10,319.3. Losses were led by the Industrials and Consumer Goods & Services indices, falling 1.4% and 1.1%, respectively.
QNBFS Daily Technical Trader Qatar - September 07, 2023 التحليل الفني اليومي ...QNB Group
The General Index failed to
sustain its breakout above the
double-bottom formation’s
neckline and continued with
its decline into the
formation’s territory.
BYD SWOT Analysis and In-Depth Insights 2024.pptxmikemetalprod
Indepth analysis of the BYD 2024
BYD (Build Your Dreams) is a Chinese automaker and battery manufacturer that has snowballed over the past two decades to become a significant player in electric vehicles and global clean energy technology.
This SWOT analysis examines BYD's strengths, weaknesses, opportunities, and threats as it competes in the fast-changing automotive and energy storage industries.
Founded in 1995 and headquartered in Shenzhen, BYD started as a battery company before expanding into automobiles in the early 2000s.
Initially manufacturing gasoline-powered vehicles, BYD focused on plug-in hybrid and fully electric vehicles, leveraging its expertise in battery technology.
Today, BYD is the world’s largest electric vehicle manufacturer, delivering over 1.2 million electric cars globally. The company also produces electric buses, trucks, forklifts, and rail transit.
On the energy side, BYD is a major supplier of rechargeable batteries for cell phones, laptops, electric vehicles, and energy storage systems.
USDA Loans in California: A Comprehensive Overview.pptxmarketing367770
USDA Loans in California: A Comprehensive Overview
If you're dreaming of owning a home in California's rural or suburban areas, a USDA loan might be the perfect solution. The U.S. Department of Agriculture (USDA) offers these loans to help low-to-moderate-income individuals and families achieve homeownership.
Key Features of USDA Loans:
Zero Down Payment: USDA loans require no down payment, making homeownership more accessible.
Competitive Interest Rates: These loans often come with lower interest rates compared to conventional loans.
Flexible Credit Requirements: USDA loans have more lenient credit score requirements, helping those with less-than-perfect credit.
Guaranteed Loan Program: The USDA guarantees a portion of the loan, reducing risk for lenders and expanding borrowing options.
Eligibility Criteria:
Location: The property must be located in a USDA-designated rural or suburban area. Many areas in California qualify.
Income Limits: Applicants must meet income guidelines, which vary by region and household size.
Primary Residence: The home must be used as the borrower's primary residence.
Application Process:
Find a USDA-Approved Lender: Not all lenders offer USDA loans, so it's essential to choose one approved by the USDA.
Pre-Qualification: Determine your eligibility and the amount you can borrow.
Property Search: Look for properties in eligible rural or suburban areas.
Loan Application: Submit your application, including financial and personal information.
Processing and Approval: The lender and USDA will review your application. If approved, you can proceed to closing.
USDA loans are an excellent option for those looking to buy a home in California's rural and suburban areas. With no down payment and flexible requirements, these loans make homeownership more attainable for many families. Explore your eligibility today and take the first step toward owning your dream home.
how can i use my minded pi coins I need some funds.DOT TECH
If you are interested in selling your pi coins, i have a verified pi merchant, who buys pi coins and resell them to exchanges looking forward to hold till mainnet launch.
Because the core team has announced that pi network will not be doing any pre-sale. The only way exchanges like huobi, bitmart and hotbit can get pi is by buying from miners.
Now a merchant stands in between these exchanges and the miners. As a link to make transactions smooth. Because right now in the enclosed mainnet you can't sell pi coins your self. You need the help of a merchant,
i will leave the telegram contact of my personal pi merchant below. 👇 I and my friends has traded more than 3000pi coins with him successfully.
@Pi_vendor_247
If you are looking for a pi coin investor. Then look no further because I have the right one he is a pi vendor (he buy and resell to whales in China). I met him on a crypto conference and ever since I and my friends have sold more than 10k pi coins to him And he bought all and still want more. I will drop his telegram handle below just send him a message.
@Pi_vendor_247
Turin Startup Ecosystem 2024 - Ricerca sulle Startup e il Sistema dell'Innov...Quotidiano Piemontese
Turin Startup Ecosystem 2024
Una ricerca de il Club degli Investitori, in collaborazione con ToTeM Torino Tech Map e con il supporto della ESCP Business School e di Growth Capital
Currently pi network is not tradable on binance or any other exchange because we are still in the enclosed mainnet.
Right now the only way to sell pi coins is by trading with a verified merchant.
What is a pi merchant?
A pi merchant is someone verified by pi network team and allowed to barter pi coins for goods and services.
Since pi network is not doing any pre-sale The only way exchanges like binance/huobi or crypto whales can get pi is by buying from miners. And a merchant stands in between the exchanges and the miners.
I will leave the telegram contact of my personal pi merchant. I and my friends has traded more than 6000pi coins successfully
Tele-gram
@Pi_vendor_247
when will pi network coin be available on crypto exchange.DOT TECH
There is no set date for when Pi coins will enter the market.
However, the developers are working hard to get them released as soon as possible.
Once they are available, users will be able to exchange other cryptocurrencies for Pi coins on designated exchanges.
But for now the only way to sell your pi coins is through verified pi vendor.
Here is the telegram contact of my personal pi vendor
@Pi_vendor_247
What website can I sell pi coins securely.DOT TECH
Currently there are no website or exchange that allow buying or selling of pi coins..
But you can still easily sell pi coins, by reselling it to exchanges/crypto whales interested in holding thousands of pi coins before the mainnet launch.
Who is a pi merchant?
A pi merchant is someone who buys pi coins from miners and resell to these crypto whales and holders of pi..
This is because pi network is not doing any pre-sale. The only way exchanges can get pi is by buying from miners and pi merchants stands in between the miners and the exchanges.
How can I sell my pi coins?
Selling pi coins is really easy, but first you need to migrate to mainnet wallet before you can do that. I will leave the telegram contact of my personal pi merchant to trade with.
Tele-gram.
@Pi_vendor_247
The European Unemployment Puzzle: implications from population agingGRAPE
We study the link between the evolving age structure of the working population and unemployment. We build a large new Keynesian OLG model with a realistic age structure, labor market frictions, sticky prices, and aggregate shocks. Once calibrated to the European economy, we quantify the extent to which demographic changes over the last three decades have contributed to the decline of the unemployment rate. Our findings yield important implications for the future evolution of unemployment given the anticipated further aging of the working population in Europe. We also quantify the implications for optimal monetary policy: lowering inflation volatility becomes less costly in terms of GDP and unemployment volatility, which hints that optimal monetary policy may be more hawkish in an aging society. Finally, our results also propose a partial reversal of the European-US unemployment puzzle due to the fact that the share of young workers is expected to remain robust in the US.
what is the future of Pi Network currency.DOT TECH
The future of the Pi cryptocurrency is uncertain, and its success will depend on several factors. Pi is a relatively new cryptocurrency that aims to be user-friendly and accessible to a wide audience. Here are a few key considerations for its future:
Message: @Pi_vendor_247 on telegram if u want to sell PI COINS.
1. Mainnet Launch: As of my last knowledge update in January 2022, Pi was still in the testnet phase. Its success will depend on a successful transition to a mainnet, where actual transactions can take place.
2. User Adoption: Pi's success will be closely tied to user adoption. The more users who join the network and actively participate, the stronger the ecosystem can become.
3. Utility and Use Cases: For a cryptocurrency to thrive, it must offer utility and practical use cases. The Pi team has talked about various applications, including peer-to-peer transactions, smart contracts, and more. The development and implementation of these features will be essential.
4. Regulatory Environment: The regulatory environment for cryptocurrencies is evolving globally. How Pi navigates and complies with regulations in various jurisdictions will significantly impact its future.
5. Technology Development: The Pi network must continue to develop and improve its technology, security, and scalability to compete with established cryptocurrencies.
6. Community Engagement: The Pi community plays a critical role in its future. Engaged users can help build trust and grow the network.
7. Monetization and Sustainability: The Pi team's monetization strategy, such as fees, partnerships, or other revenue sources, will affect its long-term sustainability.
It's essential to approach Pi or any new cryptocurrency with caution and conduct due diligence. Cryptocurrency investments involve risks, and potential rewards can be uncertain. The success and future of Pi will depend on the collective efforts of its team, community, and the broader cryptocurrency market dynamics. It's advisable to stay updated on Pi's development and follow any updates from the official Pi Network website or announcements from the team.
US Economic Outlook - Being Decided - M Capital Group August 2021.pdfpchutichetpong
The U.S. economy is continuing its impressive recovery from the COVID-19 pandemic and not slowing down despite re-occurring bumps. The U.S. savings rate reached its highest ever recorded level at 34% in April 2020 and Americans seem ready to spend. The sectors that had been hurt the most by the pandemic specifically reduced consumer spending, like retail, leisure, hospitality, and travel, are now experiencing massive growth in revenue and job openings.
Could this growth lead to a “Roaring Twenties”? As quickly as the U.S. economy contracted, experiencing a 9.1% drop in economic output relative to the business cycle in Q2 2020, the largest in recorded history, it has rebounded beyond expectations. This surprising growth seems to be fueled by the U.S. government’s aggressive fiscal and monetary policies, and an increase in consumer spending as mobility restrictions are lifted. Unemployment rates between June 2020 and June 2021 decreased by 5.2%, while the demand for labor is increasing, coupled with increasing wages to incentivize Americans to rejoin the labor force. Schools and businesses are expected to fully reopen soon. In parallel, vaccination rates across the country and the world continue to rise, with full vaccination rates of 50% and 14.8% respectively.
However, it is not completely smooth sailing from here. According to M Capital Group, the main risks that threaten the continued growth of the U.S. economy are inflation, unsettled trade relations, and another wave of Covid-19 mutations that could shut down the world again. Have we learned from the past year of COVID-19 and adapted our economy accordingly?
“In order for the U.S. economy to continue growing, whether there is another wave or not, the U.S. needs to focus on diversifying supply chains, supporting business investment, and maintaining consumer spending,” says Grace Feeley, a research analyst at M Capital Group.
While the economic indicators are positive, the risks are coming closer to manifesting and threatening such growth. The new variants spreading throughout the world, Delta, Lambda, and Gamma, are vaccine-resistant and muddy the predictions made about the economy and health of the country. These variants bring back the feeling of uncertainty that has wreaked havoc not only on the stock market but the mindset of people around the world. MCG provides unique insight on how to mitigate these risks to possibly ensure a bright economic future.
The Evolution of Non-Banking Financial Companies (NBFCs) in India: Challenges...beulahfernandes8
Role in Financial System
NBFCs are critical in bridging the financial inclusion gap.
They provide specialized financial services that cater to segments often neglected by traditional banks.
Economic Impact
NBFCs contribute significantly to India's GDP.
They support sectors like micro, small, and medium enterprises (MSMEs), housing finance, and personal loans.
The WhatsPump Pseudonym Problem and the Hilarious Downfall of Artificial Enga...
1 May Daily technical trader
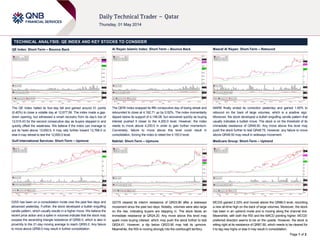
1. Page 1 of 2
TECHNICAL ANALYSIS: QE INDEX AND KEY STOCKS TO CONSIDER
QE Index: Short-Term – Bounce Back
The QE Index halted its four-day fall and gained around 51 points
(0.40%) to close a volatile day at 12,677.59. The index made a gap-
down opening, but witnessed a smart recovery from its day’s low of
12,515.43 for the second consecutive day as buyers stepped in and
quickly offset the weakness. We believe if the index can manage to
put its head above 12,650.0, it may rally further toward 12,768.0 or
else it may retreat to test the 12,600.0 level.
Gulf International Services: Short-Term – Upmove
GISS has been on a consolidation mode over the past few days and
advanced yesterday. Further, the stock developed a bullish engulfing
candle pattern, which usually results in a higher move. We believe the
recent price action and a spike in volumes indicate that the stock may
surpass the ascending triangle resistance of QR90.0, which is also in
proximity to the 21-day moving average to reach QR93.0. Any failure
to move above QR90.0 may result in further consolidation.
Al Rayan Islamic Index: Short-Term – Bounce Back
The QERI Index snapped its fifth consecutive day of losing streak and
rebounded to close at 4,192.71 up by 0.52%. The index momentarily
dipped below its support of 4,148.08, but recovered quickly as buying
interest pushed it closer to the 4,200.0 level. However, the index
needs to move above 4,200.0 in order to gain further momentum.
Conversely, failure to move above this level could result in
consolidation, forcing the index to retest the 4,150.0 level.
Nakilat: Short-Term – Upmove
QGTS cleared its interim resistance of QR23.90 after a sideways
movement since the past two days. Notably, volumes were also large
on the rise, indicating buyers are stepping in. The stock faces an
immediate resistance at QR24.20. Any move above this level may
spark more buying interest, which may push the stock further to test
QR24.61. However, a dip below QR23.90 may halt its upmove.
Meanwhile, the RSI is moving strongly into the overbought territory.
Masraf Al Rayan: Short-Term – Rebound
MARK finally ended its correction yesterday and gained 1.90% to
rebound on the back of large volumes, which is a positive sign.
Moreover, the stock developed a bullish engulfing candle pattern that
usually indicates a bullish move. The stock is on the threshold of its
immediate resistance of QR48.50. Any move above this level may
push the stock further to test QR49.75. However, any failure to move
above QR48.50 may result in sideways movement.
Medicare Group: Short-Term – Uptrend
MCGS gained 2.33% and moved above the QR86.0 level, recording
a new all-time high on the back of large volumes. Moreover, the stock
has been in an uptrend mode and is moving along the channel line.
Meanwhile, with both the RSI and the MACD pointing higher, MCGS’
preferred direction seems to be on the upside. However, the stock is
sitting right at its resistance of QR87.80, which needs to be cleared for
it to tag new highs or else it may result in consolidation.
2. Contacts
Saugata Sarkar Keith Whitney Sahbi Kasraoui QNB Financial Services SPC
Head of Research Head of Sales Manager - HNWI Contact Center: (+974) 4476 6666
Tel: (+974) 4476 6534 Tel: (+974) 4476 6533 Tel: (+974) 4476 6544 PO Box 24025
saugata.sarkar@qnbfs.com.qa keith.whitney@qnbfs.com.qa sahbi.alkasraoui@qnbfs.com.qa Doha, Qatar
DISCLAIMER: This publication has been prepared by QNB Financial Services SPC (“QNBFS”) a wholly-owned subsidiary of Qatar National Bank (“QNB”). QNBFS is regulated by the Qatar Financial Markets Authority and the Qatar Exchange; QNB is
regulated by the Qatar Central Bank. This publication expresses the views and opinions of QNBFS at a given time only. It is not an offer, promotion or recommendation to buy or sell securities or other investments, nor is it intended to constitute legal,
tax, accounting, or financial advice. We therefore strongly advise potential investors to seek independent professional advice before making any investment decision. Although the information in this report has been obtained from sources that QNBFS
believes to be reliable, we have not independently verified such information and it may not be accurate or complete. While this publication has been prepared with the utmost degree of care by our analysts, QNBFS does not make any representations or
warranties as to the accuracy and completeness of the information it may contain, and declines any liability in that respect. QNBFS reserves the right to amend the views and opinions expressed in this publication at any time. It may also express
viewpoints or make investment decisions that differ significantly from, or even contradict, the views and opinions included in this report.
COPYRIGHT: No part of this document may be reproduced without the explicit written permission of QNBFS.
Page 2 of 2
*These stocks are today’s suggested ideas
Overall Methodology: The charts and descriptions on Page 1 provide an indicative view of the future direction of the equities mentioned. The table on page 2 has been provided to denote historical movements in certain stocks. The historical trend analysis uses 21- and 55-
day SMAs for indicating short-term and long-term trends, respectively. Based on these SMAs, the historical direction of the trend is denoted as UP, DOWN or FLAT.
Selection of Key Stocks of the Day: Key stocks’ selection is based on our analysis of 19 members of the QE Index (excludes QNBK QD). Analysis includes identifying trends (short-term as well as long-term), patterns and support/resistance levels.
Trend Direction: The methods used to determine trend direction are subjective in nature. We use 21-day SMA and 55-day SMA, absolute price movements, price movements relative to SMAs and accurately drawn trend lines and chart patterns to determine the short- and
long-term trends.
Investment Horizon: The definition of short term and long term depends upon investors’ preferences and their investment objectives. As a rule of thumb, the time horizon for traders/short-term trend is 1-3 weeks while it is 1-3 months for investors/long-term trend.
Combining Technical and Fundamental Analysis: Investors can combine technical analysis (TA) with fundamental analysis (FA) to maximize their investment returns. While the “True Value” of stocks could be estimated by FA, the entry and exit timings could be fine
tuned using technical analysis to benefit from short-term movements in stock prices.
Trading Tactics: The trend direction should be analyzed based on the time-horizon of your investments. In general, investors attempt selling close to resistance levels during a downtrend and attempt buying close to support levels during uptrend.
Definitions:
1> Simple Moving Average (SMA): A SMA is the average of the closing price of a security for a given period.
2> RSI (Relative Strength Index): A technical momentum indicator that ranges from 0 to 100 and compares the stock’s recent price movements by evaluating recent gains and losses. Stocks with RSI above 70 could be considered overbought and below 30 could be
considered oversold. If the RSI falls below 70, it is a bearish signal. On the other hand, if the RSI rises above 30 it is considered bullish. We use a RSI of 14 days.
3> MACD (Moving Average Convergence Divergence): MACD denotes the relationship between two moving averages, which is used to spot changes in strength, direction, momentum and duration of a stock price trend. The MACD is calculated by subtracting the 26-day
exponential moving average (EMA) from the 12-day EMA. A nine-day EMA of the MACD, called the signal line, is also plotted on top of the MACD, functioning as a trigger for buy/sell signals. The MACD line above the signal line provides a positive signal and vice versa.
Name (Ticker) Last Close Trend Support Resistance
Short Term Long Term First Second First Second
Qatar Exchange Index (QE Index) 12,677.59 UP UP 12,600.00 12,513.75 12,678.84 12,768.17
Al Rayan Islamic Index (QERI Index) 4,192.71 UP UP 4,148.08 4,100.00 4,200.00 4,247.34
Banks and Financial Services Banks and
Masraf Al Rayan (MARK QD)* 48.30 UP UP 47.00 45.90 48.50 49.75
Commercial Bank of Qatar (CBQK QD) 68.30 UP UP 67.30 66.50 69.80 70.70
Doha Bank (DHBK QD) 64.90 UP UP 63.90 62.00 65.70 66.40
Qatar Islamic Bank (QIBK QD) 86.10 UP UP 84.70 81.70 87.30 88.50
Qatar International Islamic Bank (QIIK QD) 84.00 UP UP 83.00 80.70 86.10 98.50
Qatar Insurance (QATI QD) 77.80 UP UP 77.00 76.00 79.00 80.50
Al Khalij Commercial Bank (KCBK QD) 22.30 DOWN UP 21.80 21.29 22.49 22.90
Consumer Goods and Services Consumer G
Medicare Group (MCGS QD)* 87.80 UP UP 85.00 83.40 87.80 90.00
Al Meera Consumer Goods Co. (MERS QD) 182.70 UP UP 181.40 178.50 183.00 185.00
Industrials
Industries Qatar (IQCD QD) 178.00 DOWN DOWN 175.00 173.00 178.30 180.00
Qatar Electricity & Water Co. (QEWS QD) 182.30 DOWN UP 180.00 178.18 184.00 186.00
Gulf International Services (GISS QD)* 90.00 DOWN UP 86.60 84.80 90.00 93.00
Qatari Investors Group (QIGD QD) 66.40 UP UP 64.70 61.30 68.40 71.70
Real Estate
Barwa Real Estate Co. (BRES QD) 37.50 DOWN UP 37.40 36.80 38.40 39.20
United Development Co. (UDCD QD) 25.55 UP UP 25.29 24.70 26.00 26.50
Telecom
Ooredoo (ORDS QD) 147.00 UP UP 145.00 143.00 148.00 149.00
Vodafone Qatar (VFQS QD) 16.92 UP UP 16.89 16.00 17.15 17.99
Transportat
Nakilat (QGTS QD)* 24.00 UP UP 23.90 23.40 24.20 24.61
Milaha (QNNS QD) 98.00 UP UP 95.10 93.00 98.30 100.10