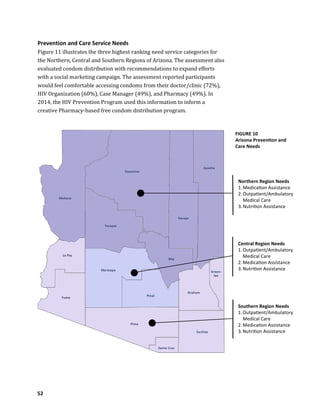
The 2017 to 2021
Integrated HIV Prevention
and Care Plan for Arizona
2017 to 2021
Integrated HIV Prevention
and Care Plan for Arizona
Arizona’s audacious plan to end the local HIV epidemic
Developed by the HIV Statewide Advisory Group
and the Phoenix EMA Ryan White Planning Council
Submitted to the
Centers for Disease Control and Prevention and the
Health Resources and Services Administration on September 30, 2016
HIV Statewide Advisory Group
of the HIV Prevention Program and the
Ryan White Part B Care and Services Program
Arizona Department of Health Services
602-364-3599
AZDHS.gov
Phoenix EMA Ryan White Planning Council
of the Ryan White Part A Program
Maricopa County
602-506-6321
maricopa.gov/rwpc
Contents
Letters of Concurrence.........................................................................i
Acknowledgements...........................................................................iii
Foreword ...........................................................................................1
Executive Summary ............................................................................3
Section 1: Statewide Coordinated Statement of Need.......................14
Section 2: Integrated HIV Prevention and Care Plan ..........................61
Contributions of Stakeholders and Key Partners............................................ 65
Northern Region Plan................................................................................................. 69
Central Region Plan...................................................................................................103
Southern Region Plan...............................................................................................139
Section 3: Monitoring and Evaluation ............................................187
i
ii
iii
Acknowledgements
Community Health Planning & Strategies Committee
Phoenix EMA Ryan White Planning Council
Cheri Tomlinson, Chair
Committee Members
Carmen Batista
Cynthia Trottier
Debby Elliott
Guillermo (Gil) Velez
John Sapero
Nicole Turcotte
Randall Furrow
Ryan White Part A
Program Staff
Alaina Rinne
Chavon Boston
Evelyn Bester
Jane Wixted
Jeremy Hyvarinen
Kaila Johnson
Rose Conner
Victoria Jaquez
About the Phoenix EMA Ryan White Planning Council
The Planning Council is a community group that has been appointed by the
Maricopa County Board of Supervisors to plan the organization and
delivery of HIV services funded by Part A of the Ryan White HIV/AIDS
Treatment Modernization Act. Each Council member is a caring, dedicated
volunteer who has been carefully selected to reflect the diversity of the
community. Members represent the general public, people living with HIV,
Part A service providers, and other health and social service organizations.
About the Community Health Planning & Strategies (CHPS) Committee
The CHPS Committee oversees the design and implementation of
community needs assessments, establishes and monitors the Planning
Council's comprehensive plan for the delivery of HIV/AIDS services, and
establishes guidelines for the provision of Part A services.
iv
Acknowledgements
Arizona HIV Statewide Advisory Group
Chelsey Donohoo, Chair
Members
Alyssa Guido
Calicia White
Cesar Egurrola
Deborah Reardon-Maynard
Felicia McLean
Haley Coles
Harold Thomas
Jai Smith
Jamal Brooks-Hawkins
Jeremy Bright
Jeremy Hyvarinen
Kara Ihrke
Randall Furrow
RJ Shannon
Robert Bourassa
HIV Prevention
Program Staff
Ann Gardner
Deborah Reardon-Maynard
John Sapero
Tiana Galindo
Ryan White Part B
Program Staff
Carmen Batista
Claudia Cardiel
Greg Romero
Jessica Alvidrez
Jimmy Borders
Laura Kroger
LisaMarie Bates
Lora Andrikopoulos
Louisa Vela
Lynelle Brooks-Dorsey
Nicole Vandrovec
About the Arizona HIV Statewide Advisory Group
To better meet CDC/HRSA expectations for integrated HIV prevention and
care planning, the HIV Prevention Program and Ryan White Part B Care and
Services Program combined their respective planning bodies to form the
HIV Statewide Advisory Group (SWAG).
The SWAG is charged with developing and monitoring Arizona's strategic
plan to effectively end the state’s HIV epidemic. The SWAG also guides the
development and implementation of HIV services, social marketing
activities, and quality improvement initiatives.
Membership includes representatives of people living with HIV, services
providers, health departments, community leaders, and other stakeholders.
v
Acknowledgements
This plan has been developed in collaboration with:
Arizona AIDS Education and Training Center
University of Arizona
HIV Prevention Program
Arizona Department of Health Services
HIV Surveillance Program
Arizona Department of Health Services
Las Vegas TGA Ryan White Part A Program
Clark County, Nevada
Ryan White Part A Program
Maricopa County
Ryan White Part B Care and Services Program
Arizona Department of Health Services
Ryan White Part C Programs
El Rio Special Immunology Associates
Maricopa Integrated Health System
University of Arizona Petersen HIV Clinic
Ryan White Part D Program
Maricopa Integrated Health System
STD Control Program
Arizona Department of Health Services
1
Foreword
The Arizona HIV Statewide Advisory Group and the Phoenix EMA Ryan
White Planning Council are pleased to submit this comprehensive plan for
ending the HIV epidemic in Arizona.
When development of this plan began, people throughout the state were
asked two simple questions: 1) What needs to happen in the next five years
to end the HIV epidemic in Arizona? and 2) What are the barriers that
might stop us from achieving this audacious goal?
Hundreds of people responded. People living with HIV shared their
successes and struggles, their service needs, and the accessibility, barriers
and gaps in care they experienced. High-risk HIV negative individuals, and
people recently diagnosed with HIV provided thoughtful answers about
their engagement in HIV prevention methods, their satisfaction with HIV
testing and other prevention services, and what they wish they knew
before becoming HIV positive. They also discussed their social media use,
where they hang out, the impact of local prevention messages, and the HIV
knowledge and perceptions of their friends and family.
Over the course of a year and a half, more than 200 representatives of
people living with HIV, community-based organizations, medical providers,
Ryan White and CDC funded programs, public health programs, community
leaders, Tribal entities, and hospital systems contributed 1,483 man hours
to strategic planning efforts. These individuals participated in two day-long
training sessions focused on best-practices for linkage to care, retention in
care, data-based quality improvement, innovations in prevention services,
and client-centered care.
Participants then used the knowledge they gained from these sessions,
along with their personal expertise, experience, and passion to inform the
development of regional strategies. Teams studied continuums of care for
clinics, regions, and the state. They discussed such issues as the challenge
of abstinence only sex education, rural coalition development, and the
needs for flexible funding and shared data systems. There were meaningful
discussions barriers clients faced, going so far as to begin the work of
problem solving where homeless clients can safely store their medications.
774
Ryan White clients and
high-risk HIV negative
individuals identified service
needs, accessibility, barriers,
and gaps across the
care continuum
203
community partners
participated in a survey of HIV
prevention knowledge and
perceptions among the target
populations they serve
65
newly diagnosed individuals
were surveyed about their
HIV testing and linkage to
care experiences
2
Participants tackled hard questions of how to step up the levels of cultural
competency within our communities, the limits of government influence,
and how we could expand our influence on behalf of the clients.
At times, the planning process was daunting. There were difficult
discussions on realistic versus aspirational objective measures. Powerful
conversations occurred about the impact of social justice issues on HIV
prevention, and engagement/retention in care for people of color. There
were months with multiple meetings scheduled each week, and a now-
legendary series of grueling, four-hour web-based meetings that allowed
for comprehensive public review and comment. Regardless of the amount
or intensity of meetings, Arizona’s Planning Body members showed up with
passion, expertise and creative solutions. Every. Single. Time.
The integrated planning process has spurred some of the most
inclusive and meaningful client-centric HIV discussions Arizona has ever
had. This dialog is far from finished. But, thanks to the many outstanding
contributions of our partners, it's off to an impressive start. On the
following pages, you will learn of the great effort that has been expended to
create this plan, and of the hard work our communities have ahead of them.
We are humbled by the dedication of our Planning Body members, and so
very thankful for their commitment to ending the HIV epidemic in Arizona.
Our programs have already begin preparing to implement the plan with
great excitement. After you read the Plan, we believe you will become just
as engaged.
Please join us as we begin to end the HIV epidemic in Arizona!
Respectfully,
Carmen Batista
Program Manager
Ryan White Part B
Care and Services Program
Arizona Department
of Health Services
John Sapero
Office Chief
HIV Prevention Program
Arizona Department
of Health Services
Rose Conner
Program Manager
Ryan White Part A Program
Maricopa County
225
representatives of people
living with HIV, community-
based organizations, medical
providers, Ryan White and
CDC funded programs, public
health programs, community
leaders, Tribal entities, and
hospital systems contributed
more than
1,483
man hours specifically to
strategic planning for
Arizona’s regional
communities
3
Executive
Summary
4
An Inclusive, Collaborative
Planning Process
How People Involved in Planning Are Reflective of the Local Epidemic
The 2017 to 2021 Integrated HIV Prevention and Care Plan is the most
inclusive planning effort ever undertaken by Arizona’s HIV community.
Participants in the planning process represent all target populations
identified in each region, and a diverse array of program partners and
key stakeholders.
Participation of Planning Body Members
More than 60 Planning Body members and guests contributed 1,209 man
hours to developing local activities and resources for the regional plans.
Members from both Planning Bodies have attended each others’ planning
meetings. Multiple regional planning sessions occurred, with Planning
Body members travelling to each region to meet with stakeholders.
How People Living with HIV Contributed to the Plan
People living with HIV participated in all four stages of planning. A
statewide needs assessment was completed by 5% of all people living with
HIV in Arizona. Foundational data was also collected from high risk
negatives. People living with HIV were included in HIV Symposium and
Planning Body activities over the past two years. The Phoenix EMA Ryan
White Planning Council and HIV Statewide Advisory Group each meet the
federal mandates for representation of people living with HIV and affected
community members. Each Planning Body has regular stakeholder
attendance at meetings.
Community Participation in HIV Symposium Planning Sessions
Arizona HIV Programs co-host 2-day HIV symposiums each year. The
second day of these symposiums is been dedicated to planning. More than
225 unduplicated consumers, providers, stakeholders, Ryan White
Program recipients and sub-recipients, and others contributed 1,483 man
hours to HIV planning. In the first year, this group identified 1) What needs
to happen in the next five years to end the HIV epidemic in Arizona? and 2)
What are the barriers that might stop us from achieving this audacious
goal? In the second year, the Symposium participants voted for regional
goals and objectives, and worked in teams to identify strategies/activities.
The development of this Plan
has been the most inclusive
planning effort ever
undertaken by Arizona’s
HIV community.
The HIV Prevention and Ryan
White Programs collaborate
to present a 2-day HIV
Symposium each year.
5
Community Participation in Prevention and Care Needs Assessments
Arizona’s HIV Programs continue to identify and reach out to populations
disproportionately impacted by HIV. Statewide assessments are completed
every three years, along with yearly regional assessments of target
populations. Additional input is gathered at Planning Body and community
advisory board meetings, at community events, and from focus groups and
client feedback surveys.
 774 people living with HIV informed the 2014 statewide needs
assessment on needs, gaps and barriers across the prevention and care
continuum. This represents 5% of all people living with HIV in Arizona
 203 community members participated in an HIV prevention assessment,
sharing information about sexual habits, STD testing practices and
knowledge of Pre-Exposure Prophylaxis
 65 Newly Diagnosed individuals reflected on their experiences being
tested for HIV, coping with receiving their diagnosis, and getting linked
to medical care
 People at high risk for contracting HIV are engaged in yearly needs
assessments conducted by the HIV Prevention Program
The HIV Prevention Program has also established work groups to guide
social marketing initiatives and service delivery. Participants of the work
groups include representatives of people living with HIV, people at-risk for
acquiring HIV, human equity groups, youth groups, English and Spanish-
language media entities, non-elected community leaders, and non-
federally funded partners.
Participation of Program Leadership
The development of the Integrated HIV Prevention and Care Plan was
guided by the Program leads for the HIV Prevention Program, Arizona’s
Ryan White Programs, the Arizona AIDS Education and Train Center and
the HIV Surveillance and STD Control Programs, in collaboration with the
Planning Body Chairs. Many of these programs are lead by or employ
people living with HIV.
How Impacted Communities Will Remain Engaged in Planning
and Provide Critical Insight Into Developing Solutions
Arizona considers the integrated Plan a living document that will evolve
with continued input from impacted communities. The HIV Statewide
Advisory Group and the Phoenix EMA Ryan White Planning Council will be
In 2015, the Phoenix EMA
Ryan White Planning Council
and HIV Statewide Advisory
Group collaboratively
presented a consumer-
centric Leadership Academy.
6
implementing a variety of community engagement methods, above and
beyond collection of needs assessment data and recruitment to Planning
Bodies. Some of the methods include:
 Mobile town halls throughout Arizona (two to three per year)
 Client/Community member orientation sessions
 Graphic facilitation of community engagement sessions
 Use of internet-based feedback solutions, such as online surveys
Stakeholders and Partners Who Were Not Involved in the Planning
Process, But Who are Needed
During the planning process, an additional 22 agencies and special interest
groups were identified by participants for future inclusion in planning
efforts. These entities include the Arizona Alliance of Community Health
Centers, Black Chamber of Commerce, youth leadership from the Black
Lives Matter – Tucson chapter, and Latino Clinic Amistades, among others.
Planning: A Regional Approach
For integrated planning purposes, Arizona has been delineated into three
distinct geographically differentiated regions, each with specific public
health concerns and HIV challenges.
FIGURE 1
Northern, Central and
Southern Regions
Southern Region
Central Region
Northern Region
7
The Northern Region
The Northern Region includes Mohave, Coconino, Yavapai, Gila, Navajo,
and Apache counties. This region is 47,890 square miles, with a population
of 792,935 in 2014. Much of the Northern Region is tribal land and/or
national forest, and is largely rural outside of the cities of Flagstaff,
Prescott and Sedona. The sparse population density poses many challenges
both for prevention and care of persons living with HIV. Major HIV issues
in the Northern Region include rural health care delivery concerns and
disparities, transportation, stigma, limited service delivery areas by county
and other health departments or providers due to population density, and
access to resources. Federally-funded HIV care in Mohave county is
provided by both the Las Vegas TGA Ryan White Part A Program and the
Arizona Ryan White Part B Program. Arizona’s HIV Prevention Program
funds prevention services in Northern Arizona. The region utilizes an
established telemedicine network.
Target Populations
 Men who have Sex with Men (MSM), especially youth and MSM of Color
 Hispanics, regardless of gender
 American Indians, regardless of gender
 Injection Drug Users
Activity Highlights
 Implementation of Pre-Exposure Prophylaxis (PrEP) Engagement
Assistance programming, and efforts to increase consumer use of PrEP
 Increased collaboration with mental health/substance abuse providers
 Increased HIV testing, and diversification of HIV testing locations,
including opt-out HIV testing in hospital settings
 Strengthening of partnerships with providers, correctional facilities, and
hospital systems to improve linkage to care timeframes
 Evaluation and implementation of innovative linkage to care/retention in
care service models specific adapted to rural communities
Mohave county, in the
Northern Region, was
identified by the CDC as one
of 221 counties nationwide at
risk for an HIV/Hepatitis
outbreak.
8
The Central Region
The Central Region is comprised of Maricopa and Pinal counties, and had an
estimated population of 4,489,109 in 2014. The Central Region includes
Phoenix, the state’s capital, which is the sixth most populated city in
America. Phoenix’ 2015 population was estimated to be more than
1,563,025. The Central Region accounts for more than 70% of the state’s
HIV incidence and prevalence. Major HIV issues affecting the Central Region
include ethnic/racial disparities, especially within the African American/
Black community, stigma, lack of sexual health education in schools, and
access to care issues.
The Central Region defines the geographic service delivery area for the
Phoenix EMA Ryan White Part A Program. Ryan White Parts B, C and D, and
the HIV Prevention Program also provide services in the Region.
Target Populations
 Men who have Sex with Men (MSM), especially youth and MSM of Color
 Hispanics, regardless of gender
 African Americans/Blacks, regardless of gender
 Transgender Individuals
Activity Highlights
 Implementation of Pre-Exposure Prophylaxis (PrEP) Engagement
Assistance programming, and efforts to increase consumer use of PrEP
 Increased HIV testing, and diversification of HIV testing locations,
including opt-out HIV testing in hospital settings
 Form reduction and process improvements to reduce duplication of effort
among funding sources
 Quality improvement initiatives designed to reduce linkage to care
timeframes
 Consumer and provider training related to stigma reduction, cultural
competency, and client empowerment
 Social marketing initiatives to increase HIV testing and awareness, PrEP
engagement, and engagement in care
More than 70% of Arizona’s
HIV incidence and prevalence
occurs in Maricopa county, in
the Central Region.
9
The Southern Region
The Southern Region includes Yuma, Pima, Santa Cruz, Cochise, Graham,
Greenlee, and La Paz counties. The 2014 population for this region was
1,449,440. Pima County has the state’s second highest prevalence (16%)
and is home to Tucson, the state’s second largest city. Four counties (Yuma,
Pima, Santa Cruz, and Cochise) border Mexico. Hispanics account for a large
percentage of the population of Southern Region counties, with the largest
concentration being in counties along the international border. Major HIV
prevention issues in the Southern Region include rural health care delivery
concerns and disparities, transportation, stigma, limited service delivery
areas by county and other health departments or providers due to
population density, access to resources, and border issues.
The HIV Prevention and Ryan White Part B and C Programs provide HIV
prevention and care services in the Southern Region.
Target Populations
 Men who have Sex with Men (MSM), especially youth and MSM of Color
 Hispanics, regardless of gender
 African Americans/Blacks regardless of gender
 Injection Drug Users
Activity Highlights
 Implementation of Pre-Exposure Prophylaxis (PrEP) Engagement
Assistance programming, and efforts to increase consumer use of PrEP
 Increased HIV testing, and diversification of HIV testing locations,
including opt-out HIV testing in hospital settings
 Engagement of community stakeholders and policy makers in advocacy
for expanded HIV education, increased local HIV funding, and other HIV-
centric issues
 Strengthening partnerships with providers, correctional facilities, and
community-based organizations to expand availability and accessibility of
quality housing for people living with HIV
 Consumer and provider training related to stigma reduction, cultural
competency, and client empowerment
 Social marketing initiatives to increase HIV testing and awareness, PrEP
engagement, and engagement in care
Four counties in the Southern
Region border Mexico.
10
Regional Objectives and Strategies to Achieve the National HIV/AIDS Strategy’s
Goal 1: Reduce New Infections.
Northern Region
Objective 1
Increase the percentage of people living with HIV who
know their serostatus to at least 90%.
Strategies
 Community Engagement
 Education
 Prevention, Testing & Linkage to Care
Objective 2
Increase the percentage of newly diagnosed persons
linked to HIV medical care within one month of their
HIV diagnosis to at least 85%.
Strategies
 Funding
 Patient-Centered Care
 Streamline Processes
Central Region
Objective 1
Increase the percentage of people living with HIV who
know their serostatus to at least 90%.
Strategies
 Prevention, Testing & Linkage to Care
 Education
 Community Engagement
 Stigma Reduction
Objective 2
Increase the percentage of newly diagnosed persons
linked to HIV medical care within one month of their
HIV diagnosis to at least 85%.
Strategies
 Streamline Processes
 Community Engagement
 Patient-Centered Care
Southern Region
Objective 1
Increase the percentage of people living with HIV who
know their serostatus to at least 90%.
Strategies
 Prevention, Testing & Linkage to Care
 Education
 Stigma Reduction
Objective 2
Increase the percentage of persons with diagnosed HIV
infection who are virally suppressed to at least 80%.
Strategies
 Patient-Centered Care
 Streamline Processes
 Incentives for Care
 Stigma Reduction
11
Regional Objectives and Strategies to Achieve the National HIV/AIDS Strategy’s
Goal 2: Increase Access to Care and Improve Health Outcomes for People Living With HIV.
Northern Region
Objective 1
Increase the percentage of newly diagnosed persons
linked to HIV medical care within one month of their
HIV diagnosis to at least 85%.
Strategies
 Prevention, Testing & Linkage to Care
 Streamline Processes
 Patient-Centered Care
Objective 2
Increase the percentage of persons with diagnosed HIV
infection who are retained in care to at least 90%.
Strategies
 Patient-Centered Care
 Funding
 Data Standardization
Central Region
Objective 1
Increase the percentage of newly diagnosed persons
linked to HIV medical care within one month of their
HIV diagnosis to at least 85%.
Strategies
 Streamline Processes
 Education
 Patient-Centered Care
Objective 2
Increase the percentage of persons with diagnosed HIV
infection who are virally suppressed to at least 80%.
Strategies
 Patient-Centered Care
 Community Engagement
 Streamline Processes
Southern Region
Objective 1
Increase the percentage of newly diagnosed persons
linked to HIV medical care within one month of their
HIV diagnosis to at least 85%.
Strategies
 Patient-Centered Care
 Community Engagement
 Stigma Reduction
 Prevention, Testing & Linkage to Care
Objective 2
Increase the percentage of persons with diagnosed HIV
infection who are retained in care to at least 90%.
Strategies
 Streamline Processes
 Patient-Centered Care
 Data Standardization
 Education
12
Regional Objectives and Strategies to Achieve the National HIV/AIDS Strategy’s
Goal 3: Reduce HIV-Related Health Disparities and Health Inequities.
Northern Region
Objective 1
Increase the percentage of people living with HIV who
know their serostatus to at least 90%.
Strategies
 Stigma Reduction
 Community Engagement
 Funding
Objective 2
Increase the percentage of newly diagnosed persons
linked to HIV medical care within one month of their
HIV diagnosis to at least 85%.
Strategies
 Patient-Centered Care
 Community Engagement
 Stigma Reduction
Central Region
Objective 1
Reduce disparities in the rate of new diagnosis by at
least 15% in the following groups: gay and bisexual
men, young Black gay and bisexual men, and Black
females.
Strategies
 Funding
 Patient-Centered Care
 Stigma Reduction
 Population-Specific Assessment
& Strategy Development
Objective 2
Reduce the percentage of persons in HIV medical care
who are homeless to no more than 5%.
Strategies
 Community Engagement
 Funding
 Patient-Centered Care
Southern Region
Objective 1
Reduce the percentage of persons in HIV medical care
who are homeless to no more than 5%.
Strategies
 Funding
 Quality Housing
 Community Engagement
Objective 2
Reduce disparities in the rate of new diagnoses by at
least 15% in the following groups: gay and bisexual
men, young Black gay and bisexual men, and Black
females.
Strategies
 Community Engagement
 Education
 Stigma Reduction
Objective 3
Increase the percentage of youth and persons who
inject drugs with diagnosed HIV infection who are
virally suppressed to at least 80%.
Strategies
 Education
 Prevention, Testing & Linkage to Care
 Community Engagement
13
Regional Objectives and Strategies to Achieve the National HIV/AIDS Strategy’s
Goal 4: Achieve a More Coordinated Response to the HIV Epidemic.
Northern Region
Objective 1
Increase the percentage of people living with HIV who
know their serostatus to at least 90%.
Strategies
 Community Engagement
 Prevention, Testing & Linkage to Care
 Education
Objective 2
Increase the percentage of newly diagnosed persons
linked to HIV medical care within one month of their
HIV diagnosis to at least 85%.
Strategies
 Prevention, Testing & Linkage to Care
 Streamline Processes
 Patient-Centered Care
Central Region
Objective 1
Reduce disparities in the rate of new diagnosis by at
least 15% in the following groups: gay and bisexual
men, young Black gay and bisexual men, and Black
females.
Strategies
 Coordinated Data Collection &
Dissemination
 Patient-Centered Care
Objective 2
Reduce the percentage of persons in HIV medical care
who are homeless to no more than 5%.
Strategies
 Community Engagement
 Funding
 Patient-Centered Care
Southern Region
Objective 1
Increase the percentage of newly diagnosed persons
linked to HIV medical care within one month of their
HIV diagnosis to at least 85%.
Strategies
 Funding
 Community Engagement
 Policy Development
 Prevention, Testing & Linkage to Care
Objective 2
Increase the percentage of persons with diagnosed HIV
infection who are retained in HIV medical care to at
least 90%.
Strategies
 Patient-Centered Care
 Streamline Processes
 Funding
14
Section 1
Statewide Coordinated
Statement of Need
15
Epidemiologic Overview
of Arizona
Geographical Description
In 2015, Arizona’s population was estimated at 6,828,065. The most
populous counties experienced an increase in population whereas lesser
populated counties remained relatively stable or decreased in size. The
state’s population grew by 435,758 (6.8%) between April 2010 to July
2015 according to the U.S. Census Bureau’s estimates. The three most
populous counties in Arizona, Maricopa (350,590), Pima (29,762), and
Pinal (30,814) have the largest increases in terms of absolute numbers.
Arizona’s least populated county, Greenlee (2015: 9,529), has the largest
rate of increase, 12.9%. Maricopa, which is Arizona’s most populous
county, has the second highest rate of increase (9.2%). Five out of the
twelve counties (Apache, Gila, La Paz, Santa Cruz, and Cochise) in Arizona
that have a population of less than 320,000 have actually had decreases in
population.
The state is 113,909 square miles in area, divided into fifteen counties.
Fifty-seven percent is under state and federal jurisdiction, and sixteen
percent is privately or corporately owned. Federally owned lands include
six national forests: Kaibab, Coconino, Apache-Sitgreaves, Prescott, Tonto,
and Coronado. There are 23 national parks, monuments, and historic sites
in Arizona from Grand Canyon National Park and Monument to Canyon de
Chelly with its Anasazi ruins.
More than a quarter of the area of the state is reservation land that is
home to 22 federally recognized American Indian tribes. The largest tribal
land areas include 25,000 acres of the Navajo Nation, the largest American
Indian reservation in the US, and the entire Tohono O'odham Nation, the
second largest reservation in the country. The smallest is the 85-acre
Tonto Apache Reservation near Payson. Tribal lands are separate
jurisdictions with their own tribal governments, laws and law
enforcement units. Approximately 18% of tribal members reside on tribal
lands, while 82% reside in urban settings. Some counties have high
proportions of American Indians among their population. Seventy-seven
16
percent of Apache County, 48% of Navajo County, and 29% of Coconino
County residents are American Indians.
Planning: A Regional Approach
The Epidemiologic Overview is focused on Arizona as a jurisdiction. For
integrated planning purposes, Arizona has been delineated into three
distinct geographically differentiated regions, each with specific public
health concerns and HIV challenges. Section II of the plan will include
abbreviated regional epi data and plans that were locally developed with
support from the Planning Bodies and HIV leadership.
Northern Region
The Northern Region of the jurisdiction is comprised of Mohave, Yavapai,
Coconino, Gila, Navajo, and Apache counties. The Northern Region
combined population was estimated at 792,935 in 2014. The largest city,
Flagstaff is located in Coconino county and had a 2015 estimated
population of 70,320. Much of the Northern Region is tribal land and/or
national forest, which contributes to its rural, or “frontier” vastness. The
sparse population density poses many challenges both for prevention and
care of persons living with HIV. Key HIV issues in the Northern Region
include rural health care delivery concerns and disparities, transportation,
stigma, limited service delivery areas by county and other health
departments or providers due to population density, and access to
resources. Federally-funded HIV care in Mohave county is provided by both
the Las Vegas TGA Ryan White Part A Program and the Arizona Ryan White
Part B Program. Arizona’s HIV Prevention Program funds prevention
services in Northern Arizona.
Central Region
The Central Region of the jurisdiction is comprised of Maricopa and Pinal
counties, and had an estimated population of 4,489,109 in 2014. The
Central Region includes Phoenix, the state’s capitol, which is the sixth most
populated city in America. Phoenix’ 2015 population was estimated to be
more than 1,563,025. The Central Region accounts for more than 70% of
the state’s HIV incidence and prevalence. Major HIV issues affecting the
Central Region include ethnic/racial disparities, especially within the
African American/Black community, stigma, lack of sexual health education
in schools, and access to care challenges. The Central Region defines the
geographic service delivery area for the Phoenix EMA Ryan White Part A
Program. Ryan White Parts B, C and D, and the HIV Prevention Program
also provide services in the Region.
17
FIGURE 2
Northern, Central and
Southern Regions
Southern Region
The Southern Region of the jurisdiction includes Yuma, Pima, Santa Cruz,
Cochise, Graham, Greenlee, and La Paz counties. The 2014 population for
this Region was 1,449,440. Pima County has the
state’s second highest prevalence (16%) and is
home to Tucson, the state’s second largest city.
Four counties (Yuma, Pima, Santa Cruz, and
Cochise) border Mexico. Hispanics account for a
large percentage of the population of Southern
Region counties, with the largest concentration
being in counties along the international border.
Key HIV prevention issues in the Southern
Region include rural health care delivery
concerns and disparities, transportation, stigma,
limited service delivery areas by county and
other health departments or providers due to
population density, access to resources, and
border issues.
The HIV Prevention and Ryan White Part B and C
Programs provides HIV prevention and care
services in the Southern Region.
Socioeconomic, Demographic and Burden of HIV Data
The socio-demographic characteristics of newly diagnosed individuals,
people living with HIV, and people at high-risk for acquiring HIV provides
the basis for setting priorities, identifying appropriate interventions and
services, and allocating resources.
Income
Arizona’s 2014 median annual income is $49,928 with 18% of Arizonans
living in poverty. High school graduates compose 86% of the population
and bachelor’s degree or higher composed 27% from the same year.
Sixteen percent of the population has insurance. Nine percent have a
disability and are under 65 years old. Among Ryan White clients. Arizona
has 514,290 veterans. 13.5% of the Arizonans are foreign born.
Among Ryan White clients 79% earn 200% of the federal poverty level or
less, with 51% being under 100% of the federal poverty level.
18
When evaluating healthcare coverage, 37% have Medicaid, 26% are
Medicare, 19% have private insurance (or marketplace insurance), 1%
have other insurance and 17% have no insurance. Among Arizona’s Ryan
White clients, 88% are stably housed, followed by 7% with unstable
housing, 3% temporary housing, and 1% non-permanently housed.
Incidence and Prevalence
The State of Arizona experienced an 18% increase in new HIV cases from
2011 to 2012. However, the amount of AIDS cases decreased by 10% from
2011 to 2012. The result was a total HIV/AIDS case increase of 12% from
2011 to 2012, with the majority of new HIV cases among Whites (342 or
39%), Men who have Sex with Men (541 or 61%) and those ranging in age
from 20 to 44 (644 or 74%). Correspondingly, the majority of new AIDS
cases presented amongst Whites (141 or 43%), Men who have Sex with
Men (163 or 50%) within the age ranges of 20 to 44 years of age (190 or
58%). In 2012,the combined HIV/AIDS prevalence of 15,288 represents a
4% or 583 person increase from 2011 and a 7% or 1,046 person increase
from 2010. Race/ethnicity categories for people living with HIV are 57%
White, 26% Hispanic, 11% African American/Black, 4% American Indian/
Alaska Native, 1% Asian/Pacific Islander and 1% Multi-racial. Gender ratios
present at 87% male and 13% female. Additionally, the age categories for
people living with HIV are: 1% under 19 years of age, 34% from 20 to 44
and 65% over age 45.
Regional data on incidence, prevalence and trends will be presented in
Section II with the regional plans.
2010 2011 2012 2013 2014
New HIV 406 403 488 526 605
New AIDS 225 174 155 204 157
Total New
HIV/AIDS
631 577 643 730 762
Total HIV 6866 7142 7474 7759 8265
Total AIDS 7376 7563 7814 8039 8424
Total HIV/AIDS 14242 14705 15288 15798 16689
TABLE 1
HIV/AIDS Incidence and
Prevalence Totals in Arizona
2010 to 2014
19
Mode of Transmission
Number of
Cases
% Total
MSM 442 73
IDU 34 6
MSM/IDU 31 5
High-Risk Heterosexual Contact 23 4
Presumed Heterosexual Contact 58 9
Vertical 2 0.3
No Risk Reported 16 3
TABLE 2
2014 Arizona Incidence
Among Males,
by Mode of Transmission
KEY
MSM: Men who have Sex with Men
IDU: Injection Drug User
HRH: High-Risk Heterosexual
NRR: No Reported Risk
Vertical: Mother-to-Child Transmission
TABLE 3
2014 Arizona Incidence
Among Females,
by Mode of Transmission
KEY
MSM: Men who have Sex with Men
IDU: Injection Drug User
HRH: High-Risk Heterosexual
NRR: No Reported Risk
Vertical: Mother-to-Child
Transmission
Mode of Transmission
Number of
Cases
% Total
MSM NA NA
IDU 19 16
MSM/IDU NA NA
High-Risk Heterosexual Contact 49 40
Presumed Heterosexual Contact 45 37
Vertical 2 2
No Risk Reported 6 5
20
* Asian Pacific/Islander/Hawaiian + Men having Sex with Men ++++ No Reported Risk/Unknown Risk
** American Indian/Alaskan Native ++ Injection Drug Use
*** Multiple Race/Other Race +++ Other/Hemophilia/Transfusion and Blood Products/Transplant Recipient
Emergent HIV Emergent AIDS Emergent HIV & AIDS
Cases
% State
Total
Rate Per
100,000
Cases
% State
Total
Rate Per
100,000
Cases
% State
Total
Rate Per
100,000
By Gender
Male 508 84 15.42 137 87.3 4.16 645 84.6 19.57
Female 97 16 2.91 20 12.7 0.6 117 15.4 3.51
TOTAL 605 100 9.13 157 100 2.37 762 100 11.5
By Age
Under 2 0 0 0 0 0 0 0 0 0
2 to 12 2 0.3 0.2 1 0.6 0.1 3 0.4 0.3
13 to 19 41 6.8 6.46 0 0 0 41 5.4 6.46
20 to 24 118 19.5 24.35 9 5.7 1.86 127 16.7 26.2
25 to 29 123 20.3 27.87 17 10.8 3.85 140 18.4 31.72
30 to 34 88 14.5 19.98 21 13.4 4.77 109 14.3 24.75
35 to 39 73 12.1 17.87 19 12.1 4.65 92 12.1 22.51
40 to 44 61 10.1 14.48 19 12.1 4.51 80 10.5 19
45 to 49 33 5.5 8.11 30 19.1 7.37 63 8.3 15.48
50 to 54 30 5 6.99 17 10.8 3.96 47 6.2 10.95
55 to 59 16 2.6 3.94 11 7 2.71 27 3.5 6.65
60 to 64 11 1.8 2.97 8 5.1 2.16 19 2.5 5.12
65 and Above 9 1.5 0.88 5 3.2 0.49 14 1.8 1.37
Age Unknown 0 0 N/A 0 0 N/A 0 0 N/A
TOTAL 605 100 9.13 157 100 2.37 762 100 11.5
By Race/Ethnicity
White Non-Hispanic 220 36.4 5.76 66 42 1.73 286 37.5 7.49
Black Non-Hispanic 117 19.3 39.49 15 9.6 5.06 132 17.3 44.55
Hispanic 210 34.7 10.47 57 36.3 2.84 267 35 13.32
*A/PI/H Non-Hispanic 14 2.3 6.24 3 1.9 1.34 17 2.2 7.58
**AI/AN Non-Hispanic 41 6.8 14.64 16 10.2 5.71 57 7.5 20.35
***MR/O Non-Hispanic 3 0.5 N/A 0 0 N/A 3 0.4 N/A
TOTAL 605 100 9.13 157 100 2.37 762 100 11.5
By Mode of Transmission
+
MSM 389 64.3 N/A 82 52.2 N/A 471 61.8 N/A
++
IDU 42 6.9 N/A 16 10.2 N/A 58 7.6 N/A
MSM / IDU 28 4.6 N/A 5 3.2 N/A 33 4.3 N/A
Heterosexual 59 9.8 N/A 16 10.2 N/A 75 9.8 N/A
+++
O/H/TF/TPR 4 0.7 N/A 1 0.6 N/A 5 0.7 N/A
++++
NRR/UR 83 13.7 N/A 37 23.6 N/A 120 15.7 N/A
TOTAL 605 100 9.13 157 100 2.37 762 100 11.5
TABLE 4
Arizona Reported
Emergent Cases 2014
21
* Asian Pacific/Islander/Hawaiian + Men having Sex with Men ++++ No Reported Risk/Unknown Risk
** American Indian/Alaskan Native ++ Injection Drug Use
*** Multiple Race/Other Race +++ Other/Hemophilia/Transfusion and Blood Products/Transplant Recipient
Prevalent HIV Prevalent AIDS Prevalent HIV & AIDS
Cases
% State
Total
Rate Per
100,000
Cases
% State
Total
Rate Per
100,000
Cases
% State
Total
Rate Per
100,000
By Gender
Male 6956 41.7 211.1 7329 43.9 222.42 14285 85.6 433.52
Female 1309 7.8 39.29 1095 6.6 32.87 2404 14.4 72.16
TOTAL 8265 49.5 124.72 8424 50.5 127.12 16689 100 251.85
By Age
Under 2 2 0 0 0 0 0 0 0 0
2 to 12 51 0.3 5.13 11 0.1 1.11 62 0.4 6.24
13 to 19 75 0.4 11.83 14 0.1 2.21 89 0.5 14.03
20 to 24 359 2.2 74.07 77 0.5 15.89 436 2.6 89.95
25 to 29 693 4.2 157.02 269 1.6 60.95 962 5.8 217.97
30 to 34 832 5 188.88 449 2.7 101.93 1281 7.7 290.82
35 to 39 876 5.2 214.38 698 4.2 170.82 1574 9.4 385.2
40 to 44 1066 6.4 253.11 1053 6.3 250.03 2119 12.7 503.14
45 to 49 1199 7.2 294.56 1590 9.5 390.62 2789 16.7 685.18
50 to 54 1321 7.9 307.8 1824 10.9 425.01 3145 18.8 732.81
55 to 59 844 5.1 207.94 1162 7 286.29 2006 12 494.24
60 to 64 484 2.9 130.47 721 4.3 194.35 1205 7.2 324.82
65 and Above 446 2.7 43.77 556 3.3 54.57 1002 4.5 71.54
Age Unknown 19 0.1 NA 0 0 NA 19 0.1 NA
TOTAL 8265 49.5 124.72 8424 50.5 127.12 16689 100 251.85
By Race/Ethnicity
White Non-Hispanic 4366 26.2 114.27 4622 27.7 120.97 8988 53.9 235.24
Black Non-Hispanic 1113 6.7 375.67 1018 6.1 343.61 2131 12.8 719.28
Hispanic 2208 13.2 110.12 2254 13.5 112.41 4462 26.7 222.53
*A/PI/H Non-Hispanic 135 0.8 60.18 107 0.6 47.7 242 1.5 107.88
**AI/AN Non-Hispanic 279 1.7 99.61 336 2 119.96 615 3.7 219.57
***MR/O Non-Hispanic 164 1 N/A 87 0.5 N/A 251 1.5 N/A
TOTAL 8265 49.5 124.72 8424 50.5 127.12 16689 100 251.85
By Mode of Transmission
+
MSM 4977 29.8 N/A 5080 30.4 N/A 10057 60.3 N/A
++
IDU 767 4.6 N/A 910 5.5 N/A 1677 10 N/A
MSM / IDU 535 3.2 N/A 856 5.1 N/A 1391 8.3 N/A
Heterosexual 921 5.5 N/A 910 5.5 N/A 1831 11 N/A
+++
O/H/TF/TPR 121 0.7 N/A 96 0.6 N/A 217 1.3 N/A
++++
NRR/UR 944 5.7 N/A 572 3.4 N/A 1516 9.1 N/A
TOTAL 8265 49.5 124.72 8424 50.5 127.12 16689 100 251.85
TABLE 5
Arizona Estimated
Prevalence 2015
22
HIV Risk Factors
2015 Youth Risk Behavior Surveillance System (YRBSS) data for Arizona
reports 39% of youth have had sex and among those who were sexually
active 45% did not use a condom during last sexual intercourse. Arizona
does not use the YRBSS to survey youth about HIV, intravenous drug use, or
partner violence through the YRBSS.
In 2015, the Ryan White Part A and B Programs, with assistance from the
HIV Prevention Program, conducted a survey of 65 newly diagnosed
individuals to better understand risks and inform strategies. Participants
were 71% male, 29% female, 35% aged 18 to 24, 39% 39 to 44, 17% 45 to
54, 9% 55+, 43% White, 35% African American/Black, 11% Native
American, 2% Asian or Pacific Islander, 8% Other, 32% Hispanic/Latino,
49% Men who have Sex with Men (MSM), 34% Heterosexual, 6% Injection
Drug User, 9% Other, and 1% Men who have Sex with Men and Injection
Drug User. Of MSM respondents, 64% use web applications for sex. Of
those, 52% are seeking sex 5+ days a week, 24% 3 to 4 days a week and
24% 1 to 2 days a week. Overwhelmingly, participants reported receiving
their HIV information from their doctors and internet searches (Google,
Bing, etc.) with limited use of school and social media resources.
FIGURE 3
Arizona 5-Year
Emergent HIV/AIDS
Case Rate Trend
23
FIGURE 4
Arizona Emergent
HIV/AIDS Case Trend
by Single Year
Figure 2 shows the five-year average rates, which have less year-on-year
variance than the single-year rates. The five-year emergent HIV/AIDS case
rate declined steadily throughout the 1990s, leveling off from the 1998-
2002 time period and began to decline slightly again starting with the 2003
to 2007 time period. The five-year rates have had an overall decline for the
past decade. The 2009 to 2013 five-year rates are 23% lower than the rate
for 2003 to 2007.
The single-year rates have fluctuated more than the five-year rates, but a
similar pattern is present (Figure 3). These rates also declined through the
1990’s. The 2014 single-year rate is 13% lower than the rate for the year
2000, however, the rate for 2014 (11.5 per 100,000) is slightly higher than
in 2013 (11.02 per 100,000). According to the most recent estimates of the
Centers for Disease Control and Prevention, the 2011 estimated HIV/AIDS
diagnosis rate for Arizona was under the national rate of 11.9 per 100,000
population (CDC Diagnoses of HIV Infection in the United States and
Dependent Areas, 2014 (http://www.cdc.gov/hiv/pdf/library/reports/
surveillance/cdc-hiv-surveillance-report-us.pdf).
24
FIGURE 5
Arizona HIV/AIDS
Prevalence Trend
Figure 4 shows the number of HIV/AIDS cases in Arizona. Arizona is
currently considered a moderate morbidity state, with CDC-estimated
prevalence in the middle rate category among states with well-established
confidential name-based HIV reporting. Prevalence numbers have
continued to rise in Arizona, but this is expected given the population of
Arizona has been increasing every year for the past decade. As of December
2014, prevalence of reported HIV infection is 250.63 cases per 100,000
persons. Currently, there are 16,608 persons living with HIV/AIDS in
Arizona, a rise of 23% in five years. The increase in prevalence rates may be
due to the efficacy of multi-drug treatments for HIV infection, which have
sharply reduced the number of HIV-related deaths.
Of the 13,447 prevalent cases in the state five years ago, only 12.3%
reported residing in another state, or had died in another state. Among
prevalent cases, 25.5 % were diagnosed in another state.
In June 2009, the number of persons living with AIDS in Arizona surpassed
the number of persons with HIV infection who have not been diagnosed
with AIDS (Figure 3). Because the burden of HIV-related disease is greater
among persons with AIDS, treatment, utilization, and continuity of care are
an increasingly critical issues.
Among all the risk groups in Figure 6, Men who have Sex with Men (MSM)
account for the largest proportion of emergent HIV/AIDS cases in Arizona.
In 2014, the proportion of emergent cases that were MSM-related was
25
FIGURE 6
Arizona Percentage of
Emergent Cases by Reported
Risk Behavior, 1990 to 2014
Key
MSM: Men who have Sex with Men
IDU: Injection Drug User
HRH: High-Risk Heterosexual
NRR: No Reported Risk
FIGURE 7
Estimated Single-Year
Emergent HIV/AIDS Rates
by Risk
1990 to 2014
KEY
MSM: Men who have Sex with Men
IDU: Injection Drug User
HRH: High-Risk Heterosexual
NRR: No Reported Risk
61.8%, the highest among all risk groups. The single-year MSM rate,
however has declined from 64.5% in 2013 to 61.8% in 2014. The
downward trend in rates among MSM has been mirrored by a similar
upward trend among persons with No Reported Risk (NRR), which has
decreased from 17.5% in 2013 to 15.7% in 2014.
Rates of HIV/AIDS prevalence and emergence differ sharply between Black
Non-Hispanics and other racial/ethnic groups in Arizona. According to the
2014 single-year rates (Figure 6), the rate of HIV/AIDS emergence in Black
Non-Hispanics have increased from 80% from 2010 to 2014. The 2014
26
emergent HIV/AIDS rate among Black Non-Hispanics in Arizona is 273%
greater than the statewide average. These results are consistent with
national data. The CDC estimates Black Non-Hispanics made up 46% of new
2011 HIV diagnoses despite composing only 12% of the overall population
(CDC slide set, HIV Surveillance by race/ethnicity, through 2011 data
http://www.cdc.gov/hiv/topics/surveillance/resources/slides/general/
index.ht).
2015 Survey of Newly Diagnosed Clients for Ryan White Parts A and B
Since 2014, the HIV Prevention Program and Ryan White Part A and B
Programs have collaborated on needs assessment activities. The 2015
Survey of Newly Diagnosed Clients was commissioned to gain a better
understand 1) The experiences of individuals who have been recently
diagnosed, and how organizational systems and processes enhanced or
challenged their entry into care, 2) The client-centric issues (mindset,
stigma, support systems, etc.) that enhanced or challenged entry-to-care for
these individuals, 3) The knowledge/awareness/perceptions of HIV that
these individuals had prior to being diagnosed, including a retrospective
“hindsight” analysis of what changes in their knowledge, choices, actions,
etc. might have minimized their risk of contracting HIV, and 4) How these
individuals find, access and navigate systems of HIV care. Table 6
summarizes the results of this survey.
27
Received
Prior HIV
Prevention
Messages
Knew an HIV+
Person
Prior to
Diagnosis
Never
Tested
Before
Diagnosis
Diagnosis
Location
Know
of PrEP
Undetectable
at Time
of Survey
Gender
Male 67% 37% 48%
52% Clinic or
HIV testing site
30% 52%
Female 68% 11% 42% 42% Doctor’s Office 0% 79%
Age Group
18 to 24 78% 22% 43%
57% Clinic or
HIV testing site
30% 57%
25 to 44 56% 68% 40%
56% Clinic or
HIV testing site
28% 72%
45 to 54 64% 36% 63%
55% Emergency
Department/Hospital
0% 73%
55+ 83% 33% 50% 83% Doctor’s Office 0% 83%
Race/Ethnicity
White 64% 36% 29%
39% Clinic or
HIV testing site
18% 64%
Hispanic/Latino 62% 14% 38%
48% Clinic or
HIV testing site
29% 57%
African American
or Black
65% 30% 39%
61% Clinic or
HIV testing facility
30% 74%
Native American 86% 29% 100%
43% Emergency
Department/Hospital
0% 57%
Asian/Pacific
Islander
100% 0% 100%
100% Clinic or
HIV testing site
0% 100%
Risk Factor
MSM 75% 38% 41%
59% Clinic or
HIV testing site
41% 53%
Heterosexual 68% 5% 50%
36% Clinic or
HIV testing site
0% 82%
IDU 50% 50% 50%
50% Doctor’s Office
50% Emergency Dept.
0% 50%
TABLE 6
2015 Survey of Newly
Diagnosed Clients for
Ryan White Parts A and B
28
The Arizona HIV
Care Continuum
The HIV Continuum of Care—sometimes also referred to as the HIV
treatment cascade—is a model that is used by federal, state, and local
agencies to identify issues and opportunities related to improving the
delivery of services to people living with HIV across the entire continuum
of care. The Arizona HIV Continuum of Care was created using data from
eHARS (electronic HIV/AIDS Reporting System), an analysis of unmet
needs, and ADAP (AIDS Drug Assistance Program) information. The
definitions were agreed upon by the Arizona Regional Quality Group,
composed of HIV Prevention, all Ryan White Parts in Arizona and HIV
Surveillance.
As shown in Figure 8, in 2014 there were 16,769 HIV infected individuals
in Arizona: an estimated 1,641 who are unaware of their HIV status, and
16,769 individuals who have been diagnosed as being HIV positive. Of the
16,769 who are aware of their status, 10,590 were linked to care. Of that
number, 8,105 are retained in care. 8,270 HIV positive individuals are on
Antiretroviral Therapy. Finally, only 8,003 HIV positive individuals have an
undetectable viral load.
The percentages of HIV cases in Arizona, as shown in Figure 9, indicate just
over half of all individuals diagnosed with HIV (aware of their HIV status)
are linked to care (63%), but less than half (48%) are retained in care. 48%
of individuals in Arizona who are aware of their HIV status have an
undetectable viral load.
When 100% of HIV positive Arizonans are linked to and retained in care, a
greater number of individuals will be on Antiretroviral Therapy, which will
increase the percentage of individuals with an undetectable viral load. Data
suggest that HIV positive individuals with an undetectable viral load are
less infectious, and are less likely to transmit HIV via sexual contact.
Continuum of Care Definitions
HIV-Diagnosed: Prevalent cases that
have been diagnosed
Linked to HIV Care: Prevalent cases
with a documented lab test, doctor
visit or medication use in the calendar
year
Incidence Linked to HIV Care: Incident
cases for the year of the spectrum that
were linked with a documented lab
test, doctor visit or medication use
within 90 days of their diagnosis, but
not on the same day of the diagnosis.
If a person has their first CD4, viral load
or genotype on the same day as their
diagnostic test the date of second CD4,
viral load or genotype will be used as
the linkage
Retained in HIV Care: Prevalent cases
with a documented lab test,
doctor visit or antiretroviral (ARV) use
in the first and second six months of
the year
On ARV Therapy: Prevalent cases with
documented ARV use or whose last
viral load of the calendar year was
undetectable
Adherent/Suppressed: Prevalent cases
whose last viral load of the calendar
year was undetectable (<200 C/mL)
29
Continuum Disparities
Arizona utilizes a diagnosed based continuum. Continuum definitions can
be found to the left. All columns were evaluated utilizing the 2014 calendar
year data and with one exception, include a denominator of all the 2014
clients in the eHARs data system.
The HIV Surveillance Program has provided Arizona and regional
continuum data dissected by race, gender, and risk. In evaluating the
Arizona continuums, American Indians have some of the strongest
outcomes with 85% of new cases linked and 60% virally suppressed.
African American/Black and Hispanic populations report some of the
lowest viral load suppression rates at 43% compared to 48% statewide.
Men who have Sex with Men and Injection Drug User risk factors
consistently scores the lowest with a linkage rate of 61%, retention rate of
45% and viral load suppression rate of 66%.The highest risk factor for viral
load suppression is held by the Perinatal/Blood/Other group at 75%,
followed by Men who have Sex with Men at 73%.
16769
10590
8105 80038270
541
of
762
FIGURE 8
2014 Arizona HIV
Continuum of Care
30
Ryan White Programs have supplemented Surveillance continuums with
more frequent continuums developed by local CAREWare data. Currently,
all Ryan White Programs in Arizona are collecting client lab values through
Ryan White eligibility, or for Part C-hosted medical treatment. The Ryan
White Programs have developed an Access database which translates
CAREWare outcome reports to more easily graphed metrics. The Arizona
Ryan White continuums are evaluated by race, gender, risk, housing, payer
and service category. The continuums may be dissected by any of the Ryan
White HIV/AIDS Program Services Report (RSR) data elements. Of interest
are noted disparities among youth with 56% viral load suppression rates
versus an 87% viral load suppression rate for adult males in RWPB/ADAP.
Unstably housed report 67% viral load suppression rates compared to
92% among those stably housed. Among a review of race and ethnicity
outcomes, viral load suppression rates range from 80% for African
American/Black clients to 93% for Asian clients.
FIGURE 9
Screenshot of Arizona
Deep Dive Data Analysis Tool
To further understand health disparities, the Arizona Regional Quality
Group developed a “deep dive” tool (figure 10) to evaluate health
disparities along the continuum. This group is composed of leadership and
quality staff from all the Ryan White Programs in Arizona, and the HIV
Prevention and HIV Surveillance Programs. This “deep dive” tool evaluates
the statistical significance of various factors and translates the likelihood of
retention and viral load suppression into a statement such as, “Youth are
1.75 times less likely to be retained in care than the average Ryan White
31
client” or “Clients with Ryan White as a primary payer are 3.4 times more
likely to be retained and two times more likely to be virally suppressed
than the average Ryan White client.” The tool identifies the p-value for each
data element, and odds ratio. The Arizona Regional Quality Group has
decided to focus on health outcomes for transgender (two times less likely
to be retained, two times less likely to be virally suppressed) and youth
(1.75 times less likely to be retained and 1.75 times less likely to be virally
suppressed).
Prevention and Care Programs are receiving CDC-provided technical
assistant to design a transgender provider training and a transgender
needs assessment for use in 2017.
Continuum Planning
The HIV Care Continuum is one of Arizona’s primary tools for measuring
progress towards ending HIV through viral load suppression in Arizona.
Recognizing the importance of comparable continuum data, the Arizona
Regional Quality Group established statewide definitions and won a
National Quality Award in 2015 for this collaborative regional quality
group work. Continuum data has been heavily featured in both Annual HIV
Symposiums. These Symposiums were attended by Planning Body
members, staff from the HIV Prevention Program, Arizona Ryan White
Programs, non-federally funded AIDS Service Organizations and
community members. The HIV Prevention Program presented on the
alignment of its activities across the care continuum, including promotion
of routine HIV testing, and the use of evidence-based behavioral
interventions to support treatment as prevention.
Within the Ryan White Programs, local continuums are used to drive
change at the sub-recipient level. During quarterly monitoring calls, Ryan
White Part A and B sub-recipients are given an agency-specific continuums
that benchmarks outcomes to the regional and state average. Agency-
specific continuums include evaluation by race/ethnicity, age, housing
status, and a variety of factors. To further impact the continuum, the Ryan
White Programs will be developing related, client named reports to
distribute to sub-recipients, so they can follow up on individuals who are
not virally suppressed or retained in care. Analysis of continuum data is
leading to a transgender assessment and youth focused activities in 2017.
32
Due to the sharing of multiple sub-recipient agencies, the HIV Prevention
Program and Ryan White Part B Program participate in joint quarterly
monitoring calls for the 15 agencies funded outside of Maricopa and Pinal
counties. The Ryan White Part A Quality Committee directs all sub-
recipient quality improvement activities for linkage, retention or viral load
suppression. The recently formed Ryan White Part B/HIV Prevention
Program Quality Committee will soon guide similar quality initiatives.
Some continuum-focused successes include a workgroup of the HIV
Prevention Program, Maricopa County Department of Public Health, and the
Ryan White Part A Program that implemented activities that decreased
linkage to care timeframes from an average of 58 days to 32 days. Related
processes have evaluated and streamlined required paperwork, adjusted
client scheduling approaches, and guided increased allocation of resources
for newly diagnosed clients.
Continuum data is also being used to engage a larger, non-federally funded
community. The Ryan White Part B Program is exploring opportunities to
use rebate funds to help private HIV clinicians develop data reporting tools
that would allow private clinicians to compare their practice to regional
averages and Ryan White clinic performance. A group of private physicians
have petitioned the Mayor of Phoenix to have the city designated as the 10th
North American UNAIDS 90-90-90 Fast-Track City. The 90% aware, 90%
retained, and 90% virally suppressed goals of the Fast-Track Cities
Initiative is a variation of the continuum data that is being tweaked and
integrated into the larger Integrated Plan framework. Due to the
continuum’s ability to show the story of how the community is moving
closer or further from the end of the HIV epidemic, development of a
community facing ‘continuum report card’ is currently in the works.
33
Financial and Human
Resources Inventory
HIV Workforce Capacity and Impact on Prevention and Care Systems
The Arizona HIV Workforce Capacity was ascertained by surveying
providers statewide to determine present capacity and identify gaps in
capacity. The workforce was identified as follows: HIV Specialists,
Physicians, Nurse Practitioners, Physician Assistants, Registered Nurses,
Licensed Practical Nurses, Medical Assistants, Nutritional Counselors,
Psychiatrists, Psychologists, Licensed Clinical Social Workers, Medical Case
Manager, Support Case Managers, Dentists, Dental Hygienists, and
Administrative Support staff. The workforce impacts HIV prevention and
care service delivery system by providing adequate availability of care and
the quality of that care. Inadequate staffing could have a negative impact on
services available to clients. Additional staff was identified as necessary
and ways to address this issue are outlined in Table 8. Different funding
sources interact via partnership between the Arizona Ryan White
Programs, the HIV Prevention Program, local agencies and organizations,
and providers working together to ensure services complement each other
and are not duplicated.
HIV Resources Inventory
Arizona partners funded by the Health Services and Resources
Administration, The Centers for Disease Control and Prevention, the
Substance Abuse and Mental Health Services Administration, Housing
Opportunities for Persons Living with AIDS, the National Institutes of
Health, Indian Health Services, Arizona State Department of Health Service,
and Arizona Medicaid, as well as those receiving from private sources,
foundations, donations, and fees provided resource information via a
comprehensive survey. Table 9 provides a high level summary of the
$112,066,332 of HIV funding in Arizona. Table 10 identifies the services
and correlation to phases of the continuum of care. Tables 11 to 16 detail
the agency funding sources, Catalog of Federal Domestic Assistance
numbers, dollar amounts per award or private funding source, and how the
sources are being used. Detailed funding sources are located at the end of
the Financial and Human Resources Inventory Section.
34
Funding Source Interaction
The Arizona Ryan White Programs and the HIV Prevention Programs grant
participate in a monthly conference call to discuss collaborative issues,
which include program updates, grant issues, and funding priorities. This
regular meeting provides an opportunity for the recipients to share
information on issues that may require assistance from the other Arizona
programs. The Ryan White Part B program has availability of rebate funds
Identified Need
Number
of Staff
Number
Providing
HIV Care
Additional
Resources Identified
by Participants
HIV Specialist 23 23 16
Physician
(non-HIV specialist)
21 17 14
Nurse Practitioner 24 18 14
Physician Assistant 22 18 13
Registered Nurse 24 19 14
Licensed Practical Nurse 20 16 13
Medical Assistant 23 19 14
Nutritional Counselor 22 16 15
Psychiatrist 19 17 13
Psychologist 22 18 13
Licensed Clinical
Social Worker
18 15 15
Medical Case Manager 23 19 17
Support Case Manager 21 19 16
Dentist 20 16 13
Dental Hygienist 20 16 13
Administrative Support 26 19 15
TABLE 7
2016 HIV Workforce Capacity
35
through the AIDS Drug Assistance Program, and has established
mechanisms for the other Arizona recipients to request rebate funds for
allowable HIV services that are needed, but not currently funded through
grant funding. Several projects have been funded through rebate funds in
2015, including housing, medical services for newly diagnosed individuals,
data system improvements, medical case management, trauma informed
care training, and expanded core and support services.
All of the recipients participate in the Arizona Regional Quality Group,
which analyzes statewide and regional data. This collaboration has resulted
in identification of gaps in service that may be resolved through additional
funding.
The Ryan White Part B, C and D Programs, the HIV Prevention Program, and
Arizona’s Medicaid Program have representation on the Phoenix EMA Ryan
White Planning Council, and these representatives participate in the
Council’s annual Priority Setting and Resource Allocations process.
Additionally, the Ryan White Part B and HIV Prevention Programs
collaborate with the Las Vegas TGA Part A Program, which is responsible for
funding HIV services in Mohave County, Arizona to ensure adequate
funding is available for the needs of people living with HIV in this region.
Needed Resources
The Financial and HIV Workforce Capacity Inventories identified the
following resources needed to meet the Statewide goal of ending the HIV
epidemic by 2021.
The Arizona recipients and sub-recipients will evaluate progress on
improvement in each of these identified need areas on an annual basis as
part of the monitoring and evaluation process outlined in the Integrated
HIV Prevention and Care Plan.
The Workforce Inventory Survey participants identified the following
changes could assist in addressing workforce gaps: 53% improved
reimbursement for clinical services, 48% additional state funding, 44%
additional federal funding, and 20% other.
36
Identified Need Steps to Secure Resources Timeline
Additional HIV Medical
Providers Training and preceptorship by AETC 2017to 2021
Increased Federal Funding
for HIV Prevention
Annual needs assessment to identify
priorities
2017 to 2021
Increased Federal Funding
for HIV Services
Annual Priority and Resource Setting
Allocation process to identify
priorities and funding levels
2017 to 2021
Improved Reimbursement
Rate by Medicaid
Continued discussion with Medicaid
on establishing rates specific for HIV
care and services
2017 to 2021
HIV Prevention and Service
Needs Assessment
Update needs assessment every two
years
2017 to 2021
Increased Partner Services
HIV Prevention Program to identify
resources that could be allocated to
increase partner services
2017 to 2021
Increased Number
of Test Sites
HIV Prevention Program in
partnership with Ryan White Care
Sites
2017 to 2021
Improved health literacy Ryan White Parts A and B to fund
health literacy initiatives
2017 to 2021
Improved Treatment
Adherence
Ryan White Programs to evaluate as
part of continuum focused activities
2017 to 2021
Increased Resources for
Housing
Ryan White Part B to meet with
partners and identify resources
2017 to 2021
Education/Awareness
campaigns for Underserved
Populations
HIV leadership to plan with
community input
2017 to 2021
Provide Services in More
Culturally Competent
Manner
Planning Bodies to inform cultural
competency training.
2017 to 2021
TABLE 8
2016 HIV Workforce Capacity
Additional Staff Needed and
Steps to Secure Resources
37
TABLE92016AggregateArizonaHIVResources
TABLE10HIVCareContinuumStepsImpactedbyServicesProvided
TABLE112016HRSAArizonaHIVResources
TABLE11(Continued)2016HRSAArizonaHIVResources
TABLE122016CDCArizonaHIVResources
TABLE12(Continued)2016HRSAArizonaHIVResources
TABLE132016SAMHSAArizonaHIVResources
TABLE13(Continued)2016SAMHSAArizonaHIVResources
TABLE142016HOPWA(HousingOpportunitiesforPersonswithAIDS)andNIH(NationalInstituteofHealth)ARIZONAHIVResources
TABLE152016IndianHealthServices(IHS),ArizonaDepartmentofHealthServicesandArizonaMedicaidHIVResources
TABLE162016Non-GovernmentalArizonaHIVResources
48
Assessing Needs,
Gaps, and Barriers
Process Description for Identifying HIV Prevention and Care Needs
Since 2014, HIV Prevention and Ryan White Parts A and B have
collaborated on the development of needs assessments. This partnership
has informed assessment design, timing, and cross promotion of
assessments. Prevention and Care assessments are both presented to the
Statewide Advisory Group and Phoenix EMA Planning Council.
The 2014 Arizona Statewide Needs Assessment for PWLHA was
commissioned to provide consumer driven data with regard to needs, use,
barriers, and gaps in care within the Phoenix, Arizona Eligible
Metropolitan Area (Ryan White Part A) and the State (Ryan White Part B
and HIV Prevention Programs). A total of 774 Arizona Ryan White clients
responded to a survey as part of the assessment, representing 5% of the
2012 prevalence statistics for Arizona. In order to survey 5% of the
population a framework was developed that defined the counts by region,
gender, age, race/ethnicity, risk factor, and new diagnosis vs. ongoing
diagnosis. All regions responded with surveys that met or exceeded their
sample size. Findings were further detailed by six severe need groups: 1.
Newly Diagnosed; 2. Men who have Sex with Men; 3. Hispanics; 4. African
Americans/Blacks; 5: American Indians/Alaska Natives; and 6. Youth-
Adolescence and Young Adults (age 13 to 24).
Specific topics studied included an analysis of client level data to show the
client utilization/impact of the Affordable Care Act, a final report and
database of the survey data as a PowerPoint presentation, and Needs
Assessment document with an Executive Summary in English and Spanish.
Also included is a comparison of the current findings to prior reports and a
stratification of data and findings by regions.
The benefits of the needs assessment include:
1. Ability to integrate planning based on the findings of the 2014 Arizona
Statewide Needs Assessment for people living with HIV (Barriers and
Gaps in Care Continuum Completion)
2. Assessing the impact of Affordable Care Act implementation on people
living with HIV receiving services in Arizona
49
3. Analyzing findings to inform Annual Priority Setting and Resource
Allocation Process based on impact of Affordable Care Act
4. Creating a “Roadmap” for delivery of Ryan White services for Statewide
HIV Care Continuum completion
5. Benchmarking Arizona to other states’ HIV Care Continuum and impact
of Affordable Care Act
6. Using statewide data for policy decision makers to identify the
continued/new role for Ryan White services
7. Updating client data to inform the Ryan White Program’s competitive
grant applications, comprehensive plans and Statewide Coordinated
Statement of Need; and
8. Utilizing data to inform HIV Prevention Program activities, based on
information provided by Newly Diagnosed survey respondents.
The report can be accessed at: http://www.maricopa.gov/rwpc/docs/
StatewideNeedsAssessment2014.pdf.
The HIV Prevention Program conducted a statewide health prevention
survey with the goal of improving health outcomes for Arizonans. 203
community members completed the needs assessment. The data was used
to help guide targeted prevention programs throughout the state to help
Arizonans live healthier lives. The assessment included internet surveys
during November and December of 2015. Multiple methods for deploying
the survey to the general public were used including flyers, emails, listserv,
palm cards, and multiple organizational websites linking to the survey. Key
interest areas were libraries, colleges and universities, local bars and night
clubs, gay and lesbian organizations, and multiple social media streams
such as Facebook, Grindr, Jack’d and Craigslist.
The methodology for conducting this special study included the following
areas: 1) documentation review; 2) data collection and analysis; and 3) the
production of a final report. The data collection process utilized an online
survey instrument that adhered to the topics determined and approved by
the HIV Prevention Program. Also in this process, the partnering consultant
created survey tools and scripts to evaluate the patterns of where newly
HIV diagnosed clients might socialize and social media trends used to
communicate and find sexual partners. The survey assessed sexual
practices such as using alcohol during sexual encounters (46% responded
often and sometimes). 25% reported using drugs during sexual
50
encounters, 28% never have protected sex, and 47% hadn’t heard of Pre-
Exposure Prophylaxis. These tools were closely linked to elements utilized
by HIV Prevention Program staff as insights into the community’s sexual
habits. This information will further guide Arizona’s strategies and will be
used to develop targeted HIV prevention programs throughout the state.
Strategies for Including Stakeholders and Participants
That Reflect the HIV Epidemic
The HIV Statewide Advisory Group (SWAG) and the Phoenix EMA Planning
Council (Planning Council) have multiple members that represent people
living with HIV and those at high risk for acquiring HIV. The Planning
Council is composed of a diverse group of institutional, sub-recipient, and
consumer members who provide guidance to the program on policy and
priorities for all service categories and reflect the demographics of the local
epidemic. The consumer members who serve on the Planning Council take
an active role in identifying priorities on behalf of the community and
participate in informing and educating the community on health issues. In
2015, the Planning Council and the SWAG hosted a Leadership Academy,
designed to empower the community members of both Planning Bodies to
take on expanded leadership roles in the community and among peers.
The HIV Statewide Advisory Group (SWAG) has diverse makeup but fewer
community members. The SWAG has supported community engagement by
1) hosting mobile meetings throughout Arizona to make it easier for clients
and community members to participate in the planning process and 2)
engaging sub-recipients to help recruit community members for the
planning process. During community planning sessions, 22 potential
partnering agencies were identified. Some of the agencies include the
Arizona Alliance of Communities, one•n•ten youth groups, and the
National Association of Social Workers. As part of the plan development,
recipients identified a framework to host regional meetings two to three
times a year, and solicit partner invitations in advance. During the regional
meetings, participants will review evidence-based prevention and care
practices for mental health, substance abuse, and homelessness, and select
practices that would work for their community to begin planning
implementation of selected practices. The regional meetings will likely be
paired with a mobile town hall or other opportunity for local community
engagement.
51
The Arizona Ryan White Program collaborate to share information
gathered through their Community Advisory Boards and consumer surveys
and incorporates this input into the planning process. These Boards meet
regularly to discuss clinic initiatives, aggregate client outcomes, and give
input on strategies to improve health for people living with HIV.
Summary of Needs, Gaps and Barriers by Subpopulation
The following is a summary of the top three needs, gaps and barriers for
selected populations. “1” is the most significant need, gap, or barrier and
“3” reflects the third most significant need, gap or barrier. Subpopulations
were informed by the Early Identification of Individuals with HIV/AIDS
(EIIHA) subpopulations and Arizona’s epidemiology reports. Additional
analysis and subpopulations can be found in the full 2014 Needs
Assessment Report at http://www.maricopa.gov/rwpc/docs/
StatewideNeedsAssessment2014.pdf.
TABLE 17
HIV Prevention and Care
Service Needs, Gaps and
Barriers by Designated
Populations
52
Prevention and Care Service Needs
Figure 11 illustrates the three highest ranking need service categories for
the Northern, Central and Southern Regions of Arizona. The assessment also
evaluated condom distribution with recommendations to expand efforts
with a social marketing campaign. The assessment reported participants
would feel comfortable accessing condoms from their doctor/clinic (72%),
HIV Organization (60%), Case Manager (49%), and Pharmacy (49%). In
2014, the HIV Prevention Program used this information to inform a
creative Pharmacy-based free condom distribution program.
FIGURE 10
Arizona Prevention and
Care Needs
Southern Region Needs
1.Outpatient/Ambulatory
Medical Care
2.Medication Assistance
3.Nutrition Assistance
Central Region Needs
1.Outpatient/Ambulatory
Medical Care
2.Medication Assistance
3.Nutrition Assistance
Northern Region Needs
1.Medication Assistance
2.Outpatient/Ambulatory
Medical Care
3.Nutrition Assistance
53
FIGURE 11
Service Gaps for
Prevention and Care
In Arizona
Southern Region Gaps
1.Vision Care
2.Transportation
3.Housing Assistance
Central Region Gaps
1.Transportation
2.Housing Assistance
3.Nutrition Assistance
Northern Region Gaps
1.Vision Care
2.Holistic/Alternative
Therapy
3.Exercise
Barriers to HIV Prevention
In 2015, HIV Prevention and the Ryan White program conducted a needs
assessment of individuals that had been newly diagnosed within the past
year. This survey followed the participant through the continuum and
identified demographic data, where participants receive their HIV
information, continuum outcomes, HIV testing practices and knowledge of
Pre-Exposure Prophylaxis (PrEP). Highlighted results can be found in
Section 1. Notably, only 41% of respondents who identified as Men who
have Sex with Men knew about PrEP. Stigma continues to be high—71% of
the newly diagnosed report that they did not know anyone with HIV.
54
The full report can be found at: http://www.maricopa.gov/rwpc/docs/
PhoenixEMA_Newly_Dx_Survey20Results_FINALREPORT_02292016.pdf.
In a community assessment conducted by the HIV Prevention Program,
which was predominantly completed by HIV negative individuals, 47% had
not heard of PrEP in the past 12 months.
Social and Structural Barriers
Arizona experiences many of the common social and structural barriers as
the census bureau reports that 18% of Arizonans are at or below 100% of
the federal poverty level (FPL) and approximately 44% of Ryan White Part
A and B clients are under 100% FPL. Arizona is 31% Latino, 5% African
American/Black and 5% Native American. The Latino and African
American communities face similar stigma and cultural challenges around
homosexuality and HIV. The Latino population has faced challenges related
to Arizona SB 1070 legislation, which was identified as one of the strictest
anti-illegal immigration legislations of its time. Arizona’s sex education is
predominantly limited to abstinence-only programs, and Arizona one of
eight states that has banned schools from portraying “homosexuality as a
positive alternative life-style… suggests that some methods of sex are safe
methods of homosexual sex” AZ Rev. Stat. § 15-716(c).
Homelessness
The prevalence of homelessness is 1% to 2% among people living with HIV
in the Central Region, although 34% cited they have ‘ever’ been homeless
in the 2014 Comprehensive Statewide Needs Assessment . Over 65% of the
homeless respondents report mental, physical, and/or substance abuse
disabilities (Homeless in Arizona – Annual Report 2014). A Point-In-Time
study conducted for the Housing and Urban Development grant
determined Maricopa County has 8,000 chronically homeless individuals.
Homelessness has been shown to result in premature mortality, with
lifespans typically shortened by 25 years. Challenges with discontinuous
care, significant co-morbidities including cardiac, podiatric, respiratory,
and infectious disease processes often result in the homeless individuals
using emergency departments for medical care. This use of emergency
services costs and average of $39,000 per person annually. A Healthcare
for the Homeless Program in Boston, Massachusetts tracked chronically
homeless individuals for five years and determined their average medical
cost per year was $28,346. In the 2014 Comprehensive Statewide Needs
Assessment, 9% (n=49) of respondents report being currently homeless,
55
9% (n=52) have been homeless in the past two years, but not now, and
16% (n=91) have been homeless over two years ago, but not now. It is
noteworthy Phoenix is recognized as the first city in the nation to eradicate
homelessness among veterans (HUD, 2014).
Previous Incarceration
Stigma associated with the formerly incarcerated often cloud individual’s
prioritization of HIV medical care. Barriers to housing access, employment,
transportation, and other base subsistence needs result in the inability to
function without significant case management to clear these obstacles.
These are often complicated by custody issues, and either past or current
substance use, which led to their incarceration. Legal support is often
required to assist this group. A total of 110 incarcerated/recently released
persons were served by Ryan White Part A medical programs in 2014. Of
those 110, 10 were new, 84 continuing, and 16 returning to care. In the
2014 Comprehensive Statewide Needs Assessment, 28 recently released
HIV positive prisoners responded. This group listed Housing Assistance as
their priority need and service. This was followed by a tie of numerous
services including emergency financial assistance, oral health,
transportation, non-HIV medications, and vision care.
Backgrounder 2014 found 20% of inmates in jails and 15% of inmates in
state prisons have serious mental illness. Social instability, depression, as
well as other mental illnesses including anxiety disorders is associated with
difficulty adhering to anti-retroviral therapy.
Serious Mental Illness
According to the 2014 Comprehensive Statewide Needs Assessment, 64%
of clients surveyed stated that they had received mental or behavioral
health services since HIV diagnosis. More than 50% of people with Major
Depression, the most prevalent treatable mental illness, have not been
clinically diagnosed. For people living with HIV who have been evaluated
for Major Depressive Disorder, at least half are inadequately or not treated.
This is particularly true for individuals with triple diagnoses (mental
illness, substance use disorder, and HIV) who demonstrate poor clinical
outcomes. Underlying mental illness among those with HIV is a significant
barrier to entering drug treatment. Serious mental illness results in
average costs of $14,000 per year. The Agency for Healthcare Research and
Quality cites a cost of $57.5 billion in 2006 for mental health care in the US,
equivalent to the cost of cancer care. Unlike cancer, much of the economic
56
burden of mental illness is not the cost of care, but the loss of income due to
unemployment, expenses for social supports, and a range of indirect costs
due to a chronic disability which begins early in life (NIMH, 2011).
Substance Abuse
Substance abuse, in particular IV-injection drugs, contributes to the spread
of the epidemic when users trade sex for drugs or money, or when they
engage in risky sexual behaviors they might not engage in when sober.
Mohave County, which has shared service delivery among the HIV
Prevention Program, Arizona Ryan White Part B Program, and Las Vegas
TGA Ryan White Part A Program was flagged by the Centers for Disease
Control and Prevention as a potential place for an HIV and Hepatitis
Outbreak, due to high injection drug use in the area. Two particular drugs
of concern in the Central Region include use of crystal methamphetamine,
particularly among Men who have Sex with Men, and growing dependence
on illegal prescription drugs. The Central Region rate of 18% injection drug
use among people living with HIV is lower than the 22% national rate in
2011 (Source: Center for Disease Control & Prevention, IDU Fact Sheet).
Hepatitis C
In the 2010 Needs Assessment 21% of the 500 survey respondents
reported a history of, or treatment for Hepatitis C. In the 2014 Needs
Assessment 15% of the 578 survey respondents reported a history of, or
treatment for Hepatitis C. While Hepatitis C is now curable due to
pharmaceutical advancements, the $100,000 average cost per client is
extremely prohibitive. In July 2015, the Arizona AIDS Drug Assistance
Program (ADAP) became the first ADAP in the nation to cover Hepatitis C
treatment medications for all ADAP-eligible clients in Arizona.
Although Arizona does not have any legal barriers or regulations regarding
who may test and how to offer counseling, the testing of pregnant women
continues to be opt-in, which requires additional steps on the part of the
tester and tested. Arizona’s Ryan White Part D Program staff helped 18 of
21 hospitals throughout Maricopa and Pinal Counties establish protocols
for testing of high-risk pregnant women and treatment for any found
positives. The Ryan White Part C Program in Maricopa county conducted a
multi-part campaign to educate the community when HIV testing in the
Maricopa County Hospital’s Emergency Room transitioned to an opt-out
model. The Ryan White program has worked with ADHS’s Border Health
Office, the Arizona Mexico Commission, and the Maricopa County Sheriff’s
57
Department to identify community needs around access to and retention in
care of HIV positive undocumented individuals. An HIV indicator is
integrated in the US-Mexico health plan.
Health Department Barriers
The Arizona Department of Health Services continues to operate under a
hiring freeze for all non mission-critical staff. The hiring freeze is extended
to employees and contract staff. The other Arizona Ryan White Programs do
not have the same limitations. Infrastructure at the sub-recipient agencies is
well established. Technical assistance is provided on an ongoing and as-
needed basis.
Program Barriers
Arizona Department of Health Services shares data under the Arizona
Public Health Law and does not consider the Ryan White Program a HIPAA
covered entity. This has created some challenges with sharing of Ryan
White data between the state and some of the HIV clinics. Data sharing
agreements are being discussed.
Service Provider Barriers
The Integrated HIV Prevention and Care Plan identifies opportunities to
further include private physicians, community groups, and additional
stakeholders. Integrating planning into a large symposium model was
successful in engaging 225 individuals in the planning process. Participating
stakeholders include rural and urban clinicians, federally funded service
providers, Planning Body members, and community members. With input
from 1042 clients and a conservatively estimated 2,692 man-hours from
key stakeholders, the 2017 to 2021 Integrated HIV Prevention and Care
Plan is the most inclusive HIV-specific plan completed within Arizona. To
further extend the reach, the HIV Statewide Advisory Group is developing 1)
business cases and tools to communicate the value of HIV prevention and
care programs, and 2) a call to action for our new partners which will move
the community closer to the audacious goal of ending HIV in Arizona.
58
FIGURE 12
Client-Identified Barriers for
HIV Prevention and Care
Needs
Southern Region Barriers
1.Transportation
2.Oral Health Care
3.Vision Care
Central Region Barriers
1.Vision Care
2.Housing Assistance
3.Medication Assistance
Northern Region Barriers
1.Transportation
2.Support Groups (tie)
Insurance (tie)
Specialty Doctors (tie)
Vision Care (tie)
59
Data: Access, Sources
And Systems
Main Data Sources
Arizona continuum data is based on the eHARS data collected through lab
feeds. Local Ryan White continuum data is collected through CAREWare.
Ryan White Parts A and B have separate, parallel CAREWare systems and
share the same CAREWare consultant. Both systems require viral load data
as part of a client’s six month eligibility renewal. The lab data is entered into
CAREWare and can be accessed through CAREWare’s Health Resources and
Services Administration and HIV/AIDS Bureau performance reports, or
custom reports. These reports are then manipulated through a separate
access database that allows generation of continuum reports comparing
regional and state averages. This data can also be bisected by data collected
for Ryan White reporting needs or other CAREWare data.
Additional data is collected through:
 Patient Reporting Investigation Surveillance Manager (PRISM): PRISM
provides a unique approach, and robust technical architecture to
complete real-time monitoring of HIV/STD disease burden,
identification of emerging outbreaks, monitoring and assurance of
appropriate treatments, and quality of data for epidemiologic analysis
and reporting. The Arizona HIV Prevention and STD Control Programs
use PRISM to collect data related to disease investigation and partner
services activities.
 CAREWare Data: The Ryan White Programs have a robust CAREWare
system that allows for analysis beyond required Ryan White reporting,
including costs per client service at aggregate and agency levels,
multitude of custom reports, eligibility status, and communication
 Use of a Central Eligibility model and web application tools has been
effective in supporting compliance to RSR data elements
 Qualitative Data from client feedback surveys and needs assessments
 Surveillance Data compiled by the HIV Surveillance Program
60
Data Policies that Facilitate/Serve as a Barrier
Arizona may be the last state in the country that does not legally mandate
the reporting of virally suppressed HIV labs. The Arizona Surveillance
program is working closely with the Rule-Writing Committee and
anticipates a public comment period soon and implementation in 2017. The
program currently receives almost all of the reports because an inclusive
batch process has been preferred by the lab companies.
Arizona continues to work with its legal team to review Ryan White Part B’s
status as an uncovered entity and data sharing agreement opportunities
with local partners. An established data sharing agreement will be
fundamental to establishment of any integrated data systems to support
linkage to care and service coordination for newly diagnosed individuals.
Data Desired by Planning Groups That Was Unavailable
The Prevention and Care programs have an overwhelming amount of data
and data analysis available for discussion. During the process, an
intentional effort was made to minimize the paperwork and data provided,
while having all the data resources available on a thumb drive if any
questions arose.
One debated data element was the use of aspirational versus realistic
objective measures and the associated costs required to reach either
measure. During the planning process, a detailed analysis identified it could
cost $32 million for Arizona to reach the 90% awareness of positive HIV
status goal set by the National HIV/AIDS Strategy. The mathematical
modeling of the costs and potential impact was challenging to identify for
all the goals and objectives. Ultimately the planning bodies decided to keep
the national goals and targets with a local decision to either increase or
decrease the impacted area by an undeclared amount.
61
Section 2
Integrated HIV
Prevention and Care Plan
62
An Inclusive, Collaborative
Planning Process
How People Involved in Planning Are Reflective the Local Epidemic
The 2017 to 2021 Integrated HIV Prevention and Care Plan is the most
inclusive planning effort ever undertaken by Arizona’s HIV community.
Participants in the planning process represent all target populations
identified in each region, and a diverse array of program partners and
key stakeholders.
Participation of Planning Body Members
More than 60 Planning Body members and guests contributed 1,209 man
hours to developing local activities and resources for the regional plans.
Members from both Planning Bodies have attended each others’ planning
meetings. Multiple regional planning sessions occurred, with Planning Body
members travelling to each region to meet with stakeholders.
How People Living with HIV Contributed to the Plan
People living with HIV participated in all four stages of planning. A
statewide needs assessment was completed by 5% of all people living with
HIV in Arizona. Foundational data was also collected from high risk
negatives. People living with HIV were included in HIV Symposium and
Planning Body activities over the past two years. The Phoenix EMA Ryan
White Planning Council and HIV Statewide Advisory Group each meet the
federal mandates for representation of people living with HIV and affected
community members. Each Planning Body has regular stakeholder
attendance at meetings.
Community Participation in HIV Symposium Planning Sessions
Arizona HIV Programs co-host 2-day HIV symposiums each year. The
second day of these symposiums is been dedicated to planning. More than
225 unduplicated consumers, providers, stakeholders, Ryan White
Program recipients and sub-recipients, and others contributed 1,483 man
hours to HIV planning. In the first year, this group identified 1) What needs
to happen in the next five years to end the HIV epidemic in Arizona? and
63
2) What are the barriers that might stop us from achieving this audacious
goal? In the second year, the Symposium participants voted for regional
goals and objectives, and then worked in teams to identify strategies and
activities.
Community Participation in Prevention and Care Needs Assessments
Arizona’s HIV Programs continue to identify and reach out to populations
disproportionately impacted by HIV. Statewide assessments are completed
every three years, along with yearly regional assessments of target
populations. Additional input is gathered at Planning Body and community
advisory board meetings, at community events, and from focus groups and
client feedback surveys.
 774 people living with HIV informed the 2014 statewide needs
assessment on needs, gaps and barriers across the prevention and care
continuum. This represents 5% of all people living with HIV in Arizona
 203 community members participated in an HIV prevention assessment,
sharing information about sexual habits, STD testing practices and
knowledge of Pre-Exposure Prophylaxis
 65 Newly Diagnosed individuals reflected on their experiences being
tested for HIV, coping with receiving their diagnosis, and getting linked to
medical care
People at high risk for contracting HIV are engaged in yearly needs
assessments conducted by the HIV Prevention Program,
The HIV Prevention Program has also established work groups to guide
social marketing initiatives and service delivery. Participants of the work
groups include representatives of people living with HIV, people at-risk for
acquiring HIV, human equity groups, youth groups, English and Spanish-
language media entities, non-elected community leaders, and non-federally
funded partners.
Participation of Program Leadership
The development of the Integrated HIV Prevention and Care Plan was
guided by the Program leads for the HIV Prevention Program, Arizona’s
Ryan White Programs, the Arizona AIDS Education and Train Center and
the HIV Surveillance and STD Control Programs, in collaboration with the
Planning Body Chairs. Many of these programs are lead by or employ
people living with HIV.
64
How Impacted Communities Will Remain Engaged in Planning
and Provide Critical Insight Into Developing Solutions
Arizona considers the integrated Plan a living document that will evolve
with continued input from impacted communities. The HIV Statewide
Advisory Group and the Phoenix EMA Ryan White Planning Council will be
implementing a variety of community engagement methods, above and
beyond collection of needs assessment data and recruitment to Planning
Bodies. Some of the methods include:
 Mobile town halls throughout Arizona (two to three per year)
 Client/Community member orientation sessions
 Graphic facilitation of community engagement sessions
 Use of internet-based feedback solutions, such as social media
engagement, online surveys, webinars, etc.
Stakeholders and Partners Who Were Not Involved in the Planning
Process, But Who are Needed
During the planning process, an additional 22 agencies and special interest
groups were identified by participants for future inclusion in planning
efforts. These entities include the Arizona Alliance of Community Health
Centers, Black Chamber of Commerce, youth leadership from the Black
Lives Matter – Tucson chapter, and Latino Clinic Amistades, among others.
The HIV Prevention and Ryan White Part B Programs are to develop Region
-specific communication strategies utilizing new and traditional media to
educate the public on HIV prevention and care initiatives and the progress
of the Integrated HIV Prevention and Care Plan, and promote engagement
of new individuals in planning efforts.
65
Contributions of
Stakeholders and Key Partners
66
Stakeholder Group Contributions to Plan Development
People Living
with HIV
 774 individuals (5% of all of Arizona’s people living with HIV) participated in 2014 needs assessment
identifying needs, gaps, and barriers
 65 newly diagnosed individuals were surveyed about their HIV testing and linkage to care
experiences
 Planning Bodies include people living with HIV as both members and public participants. These
individuals contributed to all Planning Body activities related to Plan development
 Government entities and community-based organizations hire people living with HIV, and many have
HIV positive leadership
 Participated in Symposium planning
Community
Members
 203 people participated in HIV Prevention-focused assessments
 Multiple community members on both Planning Bodies
Non-traditional
Partner Agencies
 Multiple non-government funded agencies participated in Symposium Planning
 Human Equity Groups have informed HIV Prevention and Care Planning, and have facilitated
relationship building with community leadership to begin planning and implementing initiatives to
address HIV in communities of color
 Cox and Univision, two large media entities, and print/radio/online media partners have promoted
HIV initiatives to the public, and reported on HIV issues
 Representatives of media companies, news and lifestyle magazines/newspapers, radio, and social
media/marketing have participated in work groups to guide HIV-related social marketing initiatives
HIV Statewide
Advisory Group
 Oversaw the completion of comprehensive statewide needs assessments
 Participated in the planning and presentation of annual HIV Symposium planning sessions
 Review, revise and finalize all strategies and activities for Arizona’s Regional plans
 Statewide Advisory Group leadership travelled to take part in planning sessions that occurred
outside of metropolitan Phoenix
Phoenix EMA
Ryan White
Planning Council
 Oversaw the completion of comprehensive statewide needs assessment of people living with HIV and
Ryan White clients, in collaboration with other HIV Prevention and Care Programs
 Participated in both Symposium planning sessions
 Responsible for the development of care-centric strategies and activities for the Central Region plan
HIV Prevention
Program
 Co-designed comprehensive statewide needs assessments of people living with HIV and high risk,
impacted communities
 Co-wrote the Plan. Lead partner for integrating all community and planning body input into the
Regional Plans
 Co-hosted the HIV Symposiums
 Contributed data for the Statewide Coordinated Statement of Need
Phoenix EMA
Ryan White
Part A Program
 Lead the small government leadership team for the Integrated Plan
 Co-designed comprehensive statewide needs assessments of people living with HIV and high risk
populations
 Co-wrote the Plan. Lead for the Financial and Human Resources Inventory
 Co-hosted the HIV Symposiums
 Contributed data for the Statewide Coordinated Statement of Need
67
Stakeholder Group Contributions to Plan Development
Arizona
Ryan White Part B
Care and
Services Program
 Co-designed comprehensive statewide needs assessments of people living with HIV and high risk,
impacted communities
 Co-wrote the Plan. Lead program for the development of the Statewide Coordinated Statement of
Need
 Co-hosted the HIV Symposiums
 Contributed data for the Statewide Coordinated Statement of Need
 Supports allowable programs with rebate funds throughout Arizona
Arizona
Ryan White
Part C Programs
 Co-designed comprehensive statewide needs assessments of people living with HIV and high risk,
impacted communities
 Co-hosted the HIV Symposiums
 Contributed data for the Statewide Coordinated Statement of Need
 Supported Central and Southern Region activities to inform planning efforts
Arizona
Ryan White
Part D Program
 Co-designed comprehensive statewide needs assessments of people living with HIV and high risk,
impacted communities
 Co-hosted the HIV Symposiums
 Contributed data for the Statewide Coordinated Statement of Need
 Supported Central Region activities to inform planning efforts
Arizona AIDS
Education and
Training Center
 Provided HIV training to stakeholders engaged in the development of the Plan
 Coordinated Southern Region stakeholder engagement and planning sessions
 Participated in the Financial and HIV Workforce Capacity Survey
 Membership on the HIV Statewide Advisory Group
 Provided technical assistance during Plan development
 Conducted a Pre-Exposure Prophylaxis readiness assessment of providers and consumers
Arizona Regional
Quality Group
 Participated in HIV Symposiums
 Participated in the regional plan writing
 Approved the statewide definitions for use in the continuums developed by HIV Surveillance
 Regularly monitor health outcomes for all Arizona Ryan White Programs
Last Vegas TGA
Ryan White
Part A Program
 Supported Northern Region Needs Assessment activities, and conducted regional focus groups to
inform planning efforts
 Participated in HIV Symposium planning sessions
 Solicited feedback from Las Vegas medical providers and community-based organizations related to
the medical care and supportive service needs of Mohave county clients accessing care in Las Vegas
HIV Surveillance
Program
 Co-wrote the Plan. Lead program for conducting an epidemiology overview
 Developed and continuum data for the Plan
 Participated in HIV Symposium planning sessions
 Assisted with cost analysis for achievement of outcomes
STD Control
Program
 Participated in HIV Symposium planning sessions
 Assisted with cost analysis for achievement of outcomes
 Developed data capture and export methodologies, to provide data for planning
68
Stakeholder Group Contributions to Plan Development
Community Health
Centers
 Participated in the Financial and HIV Workforce Capacity Survey
 Representatives have joined both Planning Bodies
 Federally Qualified Health Center (FQHC) and FQHC look-a-like participation in HIV Symposiums
 Southern Community Health Centers have hosted local community sessions for developing the
integrated plan
Medicaid  Membership on the Phoenix EMA Ryan White Planning Council
 Provided data for the Statewide Coordinated Statement of Need
 Participated in Financial and HIV Workforce Capacity Survey
 Allocates resources for HIV medications for eligible clients in the community
Medicare  Participated in Financial and HIV Workforce Capacity Survey
 Allocates resources for HIV medications for eligible clients in the community
Veterans Health
Administration
 Contributed to Statewide Coordinated Statement of Need
 Allocates resources for HIV medications for eligible clients in the community
Housing
and Urban
Development
 Representation on the Planning Bodies
 Actively participated in the development of the plans for the Central and Southern Regions
 Participated in the Financial and HIV Workforce Capacity Survey
 Allocates resources for HIV medications for eligible clients in the community
NORTHERN ARIZONA 69
Northern Region Plan
70 NORTHERN ARIZONA
The Northern Region
Target Populations
 Men who have Sex with Men (MSM), especially youth and MSM of Color
 Hispanics, regardless of gender
 American Indians, regardless of gender
 Injection Drug Users
Activity Highlights
 Implementation of Pre-Exposure Prophylaxis (PrEP) Engagement
Assistance programming, and efforts to increase consumer use of PrEP
 Increased collaboration with mental health/substance abuse providers
 Increased HIV testing, and diversification of HIV testing locations,
including opt-out HIV testing in hospital settings
 Strengthening of partnerships with providers, correctional facilities, and
hospital systems to improve linkage to care timeframes
 Evaluation and implementation of innovative linkage to care/retention in
care service models specific adapted to rural communities
The Northern Region includes Mohave, Coconino, Yavapai, Gila, Navajo, and
Apache counties. This region is 47,890 square miles, with a population of
792,935 in 2014. Much of the Northern Region is tribal land and/or
national forest, and is largely rural outside of the cities of Flagstaff, Prescott
and Sedona. Major HIV issues in the Northern Region include rural health
care delivery concerns and disparities, transportation, stigma, limited
service delivery areas by county and other health departments or
providers due to population density, and access to resources. Federally-
funded HIV prevention and care services in Mohave county are provided by
both the HIV Prevention Program, the Arizona Ryan White Part B Program,
and the Las Vegas TGA Ryan White Part A Program.
The 2015 Arizona Department of Health Services Epidemiology Report
shows the Northern Region had 12% of the state population, 7% of the new
HIV cases, and 6% of the ongoing HIV cases. 2015 census data for Northern
Arizona reports a higher percentage of Native Americans than the other
two Regions, particularly in Apache County (74%), Navajo County (45%),
and Coconino County (27%).
CONTINUUM OF CARE DEFINITIONS
HIV-Diagnosed: Prevalent cases that
have been diagnosed
Linked to HIV Care: Prevalent cases
with a documented lab test, doctor
visit or medication use in the calendar
year
Incidence Linked to HIV Care: Incident
cases for the year of the spectrum that
were linked with a documented lab
test, doctor visit or medication use
within 90 days of their diagnosis, but
not on the same day of the diagnosis.
If a person has their first CD4, viral load
or genotype on the same day as their
diagnostic test the date of second CD4,
viral load or genotype will be used as
the linkage
Retained in HIV Care: Prevalent cases
with a documented lab test,
doctor visit or antiretroviral (ARV) use
in the first and second six months of
the year
On ARV Therapy: Prevalent cases with
documented ARV use or whose last
viral load of the calendar year was
undetectable
Adherent/Suppressed: Prevalent cases
whose last viral load of the calendar
year was undetectable (<200 C/mL)
NORTHERN ARIZONA 71
In 2014, HIV incidence dropped to 39 (22 case reduction from previous
year), while prevalence increased by 64, indicating that at least 25 HIV
positive people who were not diagnosed in Northern Arizona moved into
the region.
Review of continuum data in Figure 15 by race/ethnicity shows that
African American/Black clients in Northern Arizona have the highest viral
load suppression at 57%, followed by American Indians/Alaskan Natives at
54%. Latinos have the lowest rates of linkage (55%) and viral load
suppression (44%).
In Figure 17, the most frequently reported risk factors for Northern
Arizona are Men who have Sex with Men (319 people), Injection Drug
Users (207 people), and Men who have Sex with Men who are Injection
Drug Users (98 people).
FIGURE 13
2014 Northern Arizona
HIV Continuum of Care
676
331
424
345 353
26
of
31
72 NORTHERN ARIZONA
FIGURE 14
2014 Northern Arizona
HIV Continuum of Care
by Race/Ethnicity
FIGURE 15
2014 Northern Arizona HIV
Continuum of Care by Gender
NORTHERN ARIZONA 73
FIGURE 16
2014 Northern Arizona
HIV Continuum of Care
by Risk Category
KEY
MSM: Men who have Sex with Men
IDU: Injection Drug User
HRH: High-Risk Heterosexual
NRR: No Reported Risk
TABLE 18
Comparison of
Northern Region
Incidence and Prevalence
Totals by Year
Year Prevalence Incidence
2005 562 44
2006 606 27
2007 652 42
2008 706 39
2009 740 40
2010 747 45
2011 795 36
2012 896 33
2013 939 61
2014 1003 39
74 NORTHERN ARIZONA
TABLE 19
Northern Arizona
Regional Incidence
2009 to 2013
Emergent HIV Emergent AIDS Emergent HIV & AIDS
Cases
% State
Total
Rate Per
100,000
Cases
% State
Total
Rate Per
100,000
Cases
% State
Total
Rate Per
100,000
By Gender
Male 100 46.5 5.16 82 38.1 4.23 182 84.7 9.40
Female 22 10.2 1.12 11 5.1 0.56 33 15.3 1.67
TOTAL 122 56.7 3.12 93 43.3 2.38 215 100.0 5.50
By Age
Under 2 0 0.0 0.00 0 0.0 0.00 0 0.0 0.00
2 to 12 0 0.0 0.00 0 0.0 0.00 0 0.0 0.00
13 to 19 1 0.5 0.27 1 0.5 0.27 2 0.9 0.53
20 to 24 18 8.4 6.82 6 2.8 2.27 24 11.2 9.09
25 to 29 25 11.6 12.16 11 5.1 5.35 36 16.7 17.51
30 to 34 14 6.5 7.35 8 3.7 4.20 22 10.2 11.56
35 to 39 17 7.9 8.94 12 5.6 6.31 29 13.5 15.25
40 to 44 12 5.6 5.77 13 6.0 6.25 25 11.6 12.02
45 to 49 19 8.8 7.79 9 4.2 3.69 28 13.0 11.48
50 to 54 7 3.3 2.52 11 5.1 3.96 18 8.4 6.48
55 to 59 6 2.8 2.10 11 5.1 3.86 17 7.9 5.96
60 to 64 2 0.9 0.70 6 2.8 2.11 8 3.7 2.82
65 and Above 1 0.5 0.13 5 2.3 0.66 6 2.8 0.79
Age Unknown 0 0.0 NA 0 0.0 NA 0 0.0 NA
TOTAL 122 56.7 3.12 93 43.3 2.38 215 100.0 5.50
By Race/Ethnicity
White Non-Hispanic 46 21.4 1.81 38 17.7 1.49 84 39.1 3.30
Black Non-Hispanic 3 1.4 6.61 4 1.9 8.81 7 3.3 15.42
Hispanic 11 5.1 2.13 8 3.7 1.55 19 8.8 3.68
*A/PI/H Non-Hispanic 1 0.5 2.27 0 0.0 0.00 1 0.5 2.27
**AI/AN Non-Hispanic 58 27.0 7.65 41 19.1 5.41 99 46.0 13.06
***MR/O Non-Hispanic 3 1.4 NA 2 0.9 NA 5 2.3 NA
TOTAL 122 56.7 3.12 93 43.3 2.38 215 100.0 5.50
By Mode of Transmission
+
MSM 52 24.2 NA 44 20.5 NA 96 44.7 NA
++
IDU 26 12.1 NA 13 6.0 NA 39 18.1 NA
MSM / IDU 13 6.0 NA 14 6.5 NA 27 12.6 NA
Heterosexual 17 7.9 NA 4 1.9 NA 21 9.8 NA
+++
O/H/TF/TPR 0 0.0 NA 0 0.0 NA 0 0.0 NA
++++
NRR/UR 14 6.5 NA 18 8.4 NA 32 14.9 NA
TOTAL 122 56.7 3.12 93 43.3 2.38 215 100.0 5.50
* Asian Pacific/Islander/Hawaiian + Men having Sex with Men ++++ No Reported Risk/Unknown Risk
** American Indian/Alaskan Native ++ Injection Drug Use
*** Multiple Race/Other Race +++ Other/Hemophilia/Transfusion and Blood Products/Transplant Recipient
NORTHERN ARIZONA 75
TABLE 20
Northern Arizona
Prevalence 2014
Prevalent HIV Prevalent AIDS Prevalent HIV & AIDS
Cases
% State
Total
Rate Per
100,000
Cases
% State
Total
Rate Per
100,000
Cases
% State
Total
Rate Per
100,000
By Gender
Male 346 34.5 88.62 473 47.2 121.5 819 81.7 209.77
Female 90 9.0 22.69 94 9.4 23.70 184 18.3 46.40
TOTAL 436 43.5 55.40 567 56.5 72.04 1003 100.0 127.44
By Age
Under 2 0 0.0 0.00 0 0.0 0.00 0 0.0 0.00
2 to 12 1 0.1 0.97 1 0.1 0.97 2 0.2 1.93
13 to 19 6 0.6 8.32 2 0.2 2.77 8 0.8 11.09
20 to 24 17 1.7 31.17 5 0.5 9.17 22 2.2 40.34
25 to 29 27 2.7 64.08 14 1.4 33.23 41 4.1 97.31
30 to 34 35 3.5 87.33 26 2.6 64.87 61 6.1 152.20
35 to 39 36 3.6 96.54 39 3.9 104.58 75 7.5 201.12
40 to 44 66 6.6 163.28 62 6.2 153.38 128 12.8 316.66
45 to 49 62 6.2 139.40 107 10.7 240.58 169 16.8 379.98
50 to 54 81 8.1 149.99 111 11.1 205.55 192 19.1 355.54
55 to 59 53 5.3 91.13 101 10.1 173.66 154 15.4 264.80
60 to 64 25 2.5 42.77 58 5.8 99.23 83 8.3 141.99
65 and Above 27 2.7 16.39 41 4.1 24.89 68 6.8 41.29
Age Unknown 0 0.0 NA 0 0.0 NA 0 0.0 NA
TOTAL 436 43.5 55.40 567 56.5 72.04 1003 100.0 127.44
By Race/Ethnicity
White Non-Hispanic 267 26.6 52.44 337 33.6 66.19 604 60.2 118.64
Black Non-Hispanic 16 1.6 161.68 18 1.8 181.89 34 3.4 343.57
Hispanic 46 4.6 43.19 57 5.7 53.51 103 10.3 96.70
*A/PI/H Non-Hispanic 8 0.8 84.45 6 0.6 63.34 14 1.4 147.79
**AI/AN Non-Hispanic 90 9.0 59.21 142 14.2 93.42 232 23.1 152.63
***MR/O Non-Hispanic 9 0.9 NA 7 0.7 NA 16 1.6 NA
TOTAL 436 43.5 55.40 567 56.5 72.04 1003 100.0 127.44
By Mode of Transmission
+
MSM 216 21.5 NA 284 28.3 NA 500 49.9 NA
++
IDU 67 6.7 NA 86 8.6 NA 153 15.3 NA
MSM / IDU 46 4.6 NA 89 8.9 NA 135 13.5 NA
Heterosexual 57 5.7 NA 70 7.0 NA 127 12.7 NA
+++
O/H/TF/TPR 6 0.6 NA 6 0.6 NA 12 1.2 NA
++++
NRR/UR 44 4.4 NA 32 3.2 NA 76 7.6 NA
TOTAL 436 43.5 55.40 567 56.5 72.04 1003 100.0 127.44
* Asian Pacific/Islander/Hawaiian + Men having Sex with Men ++++ No Reported Risk/Unknown Risk
** American Indian/Alaskan Native ++ Injection Drug Use
*** Multiple Race/Other Race +++ Other/Hemophilia/Transfusion and Blood Products/Transplant Recipient
76 NORTHERN ARIZONA
GOAL 1:
INCREASE ACCESS TO CARE AND IMPROVE HEALTH
OUTCOMES FOR PEOPLE LIVING WITH HIV.
Objective 1:
Increase the percentage of people living with HIV who know their
serostatus to at least 90%.
Strategy 1: Community Engagement
1.1.1.1
Establish a formalized processes to engage state, county and tribal entities, local providers
and community stakeholders in ongoing dialog and collaboration to improve HIV services.
Explore digital methods to conduct this activity.
Metric: Establishment of formalized processes
Lead Program: HIV Statewide Advisory Group
Partners:
HIV Prevention Program, Ryan White Part B Program, Arizona AIDS Education and
Training Center, State/County Entities, Tribal Entities, Community-Based Organizations,
Community Stakeholders
Start/End: 2018 to 2021
1.1.1.2
Annually present at least one consumer-centric, culturally responsible training designed to
engage clients in medical care and supportive services. Activities should be offered using
both traditional methods (support groups, peer mentoring, provider talks, etc.) and digital
methods (online forums, video webinars, etc.).
Metric: At least one training is presented each year
Lead Program: HIV Prevention Program
Partners:
Ryan White Part B Program, State/County Entities, Tribal Entities, Indian Health Service,
Community-Based Organizations, Community Stakeholders
Start/End: 2017 to 2019
NORTHERN ARIZONA 77
Strategy 1: Community Engagement continued
1.1.1.3 Engage additional community partners to promote HIV testing/medical care.
Metric: The number of additional community partners engaged each year
Lead Program: HIV Prevention Program
Partners:
Ryan White Part B Program, State/County Entities, Tribal Entities, Indian Health Service,
Community-Based Organizations, Community Stakeholders
Start/End: 2017 to 2019
1.1.1.4
Increase the number of medical providers offering HIV testing as a routine part of care for
all clients.
Metric: The number of additional medical providers engaged in routine HIV testing each year
Lead Program: Ryan White Part B Program
Partners:
Ryan White Part B Program, State/County Entities, Tribal Entities, Indian Health Service,
Community-Based Organizations, Community Stakeholders
Start/End: 2017 to 2021
78 NORTHERN ARIZONA
GOAL 1:
INCREASE ACCESS TO CARE AND IMPROVE HEALTH
OUTCOMES FOR PEOPLE LIVING WITH HIV.
Objective 1:
Increase the percentage of people living with HIV who know their
serostatus to at least 90%.
Strategy 2: Education
1.1.2.1
Annually, develop and implement at least one social marketing initiative using new media
(online ads, in-app ads, etc.) to reach target populations which are designed to engage
individuals to be tested for HIV and/or enter medical care.
Metric: The implementation of at least one social marketing initiative each year
Lead Program: HIV Prevention Program
Partners:
Ryan White Programs, HIV Prevention Program, State/County Entities, Tribal Entities,
Arizona AIDS Education and Training Center, Community-Based Organizations, Community
Stakeholders
Start/End: 2017 to 2021
1.1.2.2
Biannually, provide at least one regional training for primary medical providers that
includes information on HIV, extra-genital STD screening, and retention in care.
Metric: At least one training completed every two years
Lead Program: Arizona AIDS Education and Training Center
Partners:
Ryan White Part B Program, State/County Entities, Tribal Entities, Local Medical Providers,
HIV Prevention Program, Community-Based Organizations
Start/End: 2018 to 2020
NORTHERN ARIZONA 79
GOAL 1:
INCREASE ACCESS TO CARE AND IMPROVE HEALTH
OUTCOMES FOR PEOPLE LIVING WITH HIV.
Objective 1:
Increase the percentage of people living with HIV who know their
serostatus to at least 90%.
Strategy 3: Prevention, Testing & Linkage to Care
1.1.3.1
Engage Flagstaff Medical Center to implement semi-targeted opt-out HIV testing in their
emergency department. (semi-targeted: patients at risk, have clinical indications).
Metric:
Opt-out testing implemented at Flagstaff Medical Center; the number of tests conducted
each year
Lead Program: Coconino County Health Department
Partners:
HIV Prevention Program, Ryan White Part B Program, Flagstaff Medical Center, Medical
Providers, Arizona AIDS Education and Training Center, Maricopa Integrated Health
System
Start/End: 2018 to 2021
1.1.3.2
Conduct new, innovative initiatives to improve accessibility to free HIV testing, focusing on
getting never-tested people tested. Initiatives might include home test kit delivery,
expanded outreach testing, etc.
Metric: The number of initiatives implemented each year; the number of new HIV tests each year
Lead Program: HIV Prevention Program
Partners:
Ryan White Part B Program, Arizona AIDS Education and Training Center, State/County
Entities, Tribal Entities, Community-Based Organizations
Start/End: 2018 to 2021
1.1.3.3
Implement same-day supplemental/confirmatory testing among testing providers, to
decrease the time from diagnosis-lab-first medical appointment.
Metric: Same-day supplemental/confirmatory testing implemented
Lead Program: HIV Prevention Program
Partners:
Ryan White Part B Program, Arizona AIDS Education and Training Center, State/County
Entities, Tribal Entities, Community-Based Organizations
Start/End: 2017 to 2020
80 NORTHERN ARIZONA
Strategy 1: Prevention, Testing & Linkage to Care continued
1.1.3.4
Annually, develop and implement at least one PrEP-focused social marketing initiative
focused on target populations, designed to engage individuals to become educated and
engaged in PrEP.
Metric: The implementation of at least one social marketing initiative each year
Lead Program: HIV Prevention Program
Partners:
Ryan White Programs, HIV Prevention Program, State/County Entities, Tribal Entities,
Community-Based Organizations
Start/End: 2017 to 2021
1.1.3.5
Establish the provision of PrEP Evaluation Assistance services by at least two Northern
Arizona community-based organizations. PrEP Evaluation Assistance is designed to
educate and engage high-risk HIV negative people in the use of Pre-Exposure Prophylaxis
as an HIV Prevention Method.
Metric:
PrEP Evaluation Assistance offered by at least two organizations; utilization and
engagement in PrEP monitored and evaluated
Lead Program: HIV Prevention Program
Partners:
Ryan White Programs, State/County Entities, Tribal Entities, Community-Based
Organizations
Start/End: 2017 to 2021
1.1.3.6
Increase the number of medical providers educated on HIV/PrEP, and ultimately
prescribing PrEP, by one provider per year.
Metric: The number of providers educated about PrEP, and the prescribing PrEP each year
Lead Program: Arizona AIDS Education and Training Center
Partners: Ryan White Programs, HIV Prevention Program, State/County Entities, Tribal Entities
Start/End: 2017 to 2021
NORTHERN ARIZONA 81
GOAL 1:
INCREASE ACCESS TO CARE AND IMPROVE HEALTH
OUTCOMES FOR PEOPLE LIVING WITH HIV.
Objective 2:
Increase the percentage of newly diagnosed persons linked to HIV medical
care within one month of their HIV diagnosis to at least 85%.
Strategy 1: Funding
1.2.1.1
Increase the availability of support services that assist clients to attend their first medical
appointment and lab services.
Metric: Increased availability of support services
Lead Program: Ryan White Part B Program
Partners: Community-Based Organizations
Start/End: 2017 to 2021
1.2.1.2 Expand Affordable Care Act benefits navigation services.
Metric: Increase in the number of entities providing benefits navigation services
Lead Program: Ryan White Part B Program
Partners: State/County Entities, Tribal Entities, Community-Based Organizations
Start/End: 2017 to 2019
1.2.1.3
Provide community-based organizations with technical assistance regarding grant writing,
sustainability, billing capacity, etc.
Metric: The number of technical assistance opportunities requested and provided
Lead Program: HIV Prevention Program
Partners: Ryan White Part B Program, Arizona AIDS Education and Training Center
Start/End: 2017 to 2021
82 NORTHERN ARIZONA
GOAL 1:
INCREASE ACCESS TO CARE AND IMPROVE HEALTH
OUTCOMES FOR PEOPLE LIVING WITH HIV.
Objective 2:
Increase the percentage of newly diagnosed persons linked to HIV medical
care within one month of their HIV diagnosis to at least 85%.
Strategy 2: Patient-Centered Care
1.2.2.1
Annually, provide at least one training for Ryan White sub-recipients, community-based
organizations, and other service providers, focusing on such topics as cultural competency,
health equity, disclosure of HIV diagnosis, and/or CLAS training. Explore opportunities to
collaborate with other local training opportunities to increase participation. A self-
appraisal should be implemented prior to each training.
Metric: Presentation of at least one training opportunity each year
Lead Program: Ryan White Part B Program
Partners:
HIV Prevention Program, Arizona AIDS Education and Training Center, State/County
Entities, Tribal Entities, Community-Based Organizations, Medical Providers
Start/End: 2017 to 2021
1.2.2.2
Annually, implement at least one social marketing initiative to educate clients about
seeking HIV care from knowledgeable, culturally appropriate providers, and the ability to
switch providers for more comprehensive care.
Metric: At least marketing initiative implemented each year
Lead Program: HIV Prevention Program
Partners:
Ryan White Part B Program, Arizona AIDS Education and Training Center, State/County
Entities, Tribal Entities, Aunt Rita’s Foundation, Community-Based Organizations
Start/End: 2017 to 2021
NORTHERN ARIZONA 83
Strategy 2: Patient-Centered Care continued
1.2.2.3
Create and distribute resources for providers that define step-by-step processes to link HIV
positive clients to care, focusing on clients being linked from private medical providers,
correctional facilities, emergency departments, and behavioral health/recovery centers.
Include promotion of HIVAZ.org as an educational and referral resource.
Metric: The step-by-step guide is published and available in traditional and electronic formats
Lead Program: Ryan White Part B Program
Partners:
HIV Prevention Program, Arizona AIDS Education and Training Center, State/County
Entities, Tribal Entities, Community-Based Organizations, Medical Providers, Behavioral
Health/Substance Use Providers
Start/End: 2018to 2019
1.2.2.4
Increase the number of providers offering HIV services in Northern Arizona, including
providers offering services via telemedicine.
Metric: The number of new providers offering services in Northern Arizona
Lead Program: Arizona AIDS Education and Training Center
Partners:
Ryan White Part B Program, State/County Entities, Tribal Entities, Community-Based
Organizations, Medical Providers
Start/End: 2018 to 2021
1.2.2.5 Develop and distribute client self-advocacy resources in traditional and electronic formats.
Metric: The resources are developed and distributed throughout the community
Lead Program: HIV Statewide Advisory Group
Partners:
HIV Prevention Program, Ryan White Part B Program, State/County Entities, Tribal
Entities, Community-Based Organizations, Community Stakeholders
Start/End: 2017 to 2021
84 NORTHERN ARIZONA
GOAL 1:
INCREASE ACCESS TO CARE AND IMPROVE HEALTH
OUTCOMES FOR PEOPLE LIVING WITH HIV.
Objective 2:
Increase the percentage of newly diagnosed persons linked to HIV medical
care within one month of their HIV diagnosis to at least 85%.
Strategy 3: Streamline Processes
1.2.3.1 Develop methodologies to improve the delivery and success of Early Intervention Services.
Metric: Methodologies are defined, implemented and evaluated
Lead Program: Ryan White Part B Program
Partners: State/County Entities, Tribal Entities, Northern Arizona Healthcare Providers
Start/End: 2018 to 2019
1.2.3.2
Establish a common enrollment application for Ryan White Programs, including an online
enrollment portal.
Metric: Completion of the online enrollment portal and policies and procedures
Lead Program: Ryan White Part B Program
Partners: Ryan White Programs
Start/End: 2017 to 2018
1.2.3.3 Develop reporting methodologies to accurately determine linkage to care timeframes.
Metric: The reporting methodologies are developed and utilized
Lead Program: Ryan White Part B Program
Partners:
HIV Prevention Program, HIV Surveillance Program, State/County Entities, Tribal Entities,
Northern Arizona Healthcare Providers, Community-Based Organizations
Start/End: 2017 to 2019
NORTHERN ARIZONA 85
GOAL 2:
INCREASE ACCESS TO CARE AND IMPROVE HEALTH OUTCOMES FOR
PEOPLE LIVING WITH HIV.
Objective 1:
Increase the percentage of newly diagnosed persons linked to HIV medical
care within one month of their HIV diagnosis to at least 85%.
Strategy 1: Prevention, Testing & Linkage to Care
2.1.1.1
Annually, present at least one HIV testing and linkage to care training, designed to increase
dialog among providers to reduce linkage to care timeframes.
Metric: At least one training is presented each year
Lead Program: Arizona AIDS Education and Training Center
Partners:
Ryan White Part B Program, HIV Prevention Program, State/County Entities, Tribal
Entities, Northern Arizona Healthcare Providers, Community-Based Organizations
Start/End: 2017 to 2021
2.1.1.2
Identify and evaluate HIV testing, linkage to care, and engagement in care models that have
proven successful when implemented in rural areas..
Metric: Identification of service delivery models; evaluation of these models for implementation
Lead Program: HIV Prevention Program
Partners:
Ryan White Part B Program, State/County Entities, Tribal Entities, Medical Providers,
Community-Based Organizations, Northern Arizona University
Start/End: 2018 to 2021
2.1.1.3
Increase collaboration with substance abuse agencies in northern Arizona to increase HIV
testing and linkage to care, and referrals to/from HIV services and substance Abuse
programs.
Metric: The number of collaborations established.
Lead Program: Coconino County Health Department
Partners:
Ryan White Part B Program, State/County Entities, Tribal Entities, Community-Based
Organizations, Substance Abuse Providers
Start/End: 2017 to 2021
86 NORTHERN ARIZONA
Strategy 1: Prevention, Testing & Linkage to Care continued
2.1.1.4
Develop and implement an annual community-based initiative to promote HIV awareness,
testing/linkage to care, and engagement in care that is culturally and linguistically
appropriate.
Metric:
At least one initiative implemented each year; yearly assessment data demonstrating
improved knowledge of HIV awareness, use of HIV testing/linkage to care services, and
increased engagement in care
Lead Program: HIV Prevention Program
Partners:
Ryan White Part B Program, State/County Entities, Tribal Entities, Community-Based
Organizations, Community Stakeholders
Start/End: 2017 to 2021
NORTHERN ARIZONA 87
GOAL 2:
INCREASE ACCESS TO CARE AND IMPROVE HEALTH OUTCOMES FOR
PEOPLE LIVING WITH HIV.
Objective 1:
Increase the percentage of newly diagnosed persons linked to HIV medical
care within one month of their HIV diagnosis to at least 85%.
Strategy 2: Streamline Processes
2.1.2.1
Develop and implement activities designed to improve communication between healthcare
agencies serving American Indians, state/county entities, healthcare organizations, and
community-based organizations.
Metric: Activities are developed and implemented, and evaluated annually
Lead Program: Ryan White Part B Program
Partners:
County/State Entities, Tribal Entities, Indian Health Service, Northern Arizona Healthcare
Providers, Community-Based Organizations
Start/End: 2017 to 2021
2.1.2.2 Clearly identified care navigation processes for all communities.
Metric:
The navigation processes for each community in the region are defined; processes are
distributed in traditional and electronic form
Lead Program: Ryan White Part B Program
Partners:
County/State Entities, Tribal Entities, Indian Health Service, Northern Arizona Healthcare
Providers, Community-Based Organizations
Start/End: 2018 to 2019
2.1.2.3
Integrate HIV case management services with services offered by mental health and
substance abuse providers.
Metric:
Successful integration of HIV case management services by mental health and substance
abuse providers
Lead Program: Ryan White Part B Program
Partners:
County/State Entities, Tribal Entities, Indian Health Service, Northern Arizona Healthcare
Providers, Community-Based Organizations, NARBHA
Start/End: 2017 to 2019
88 NORTHERN ARIZONA
Strategy 2: Streamline Processes continued
2.1.2.4
Identify substance abuse providers and engage them in collaborative efforts to implement
an integrated care team approach (internal and external partnerships) to provide
comprehensive services that promote access to care and retention in care.
Metric: The number of substance abuse providers that adapt an integrated care team approach
Lead Program: Arizona AIDS Education and Training Center
Partners:
Ryan White Part B Program, HIV Prevention Program, Substance Abuse/Behavioral Health
Providers, Northland Cares
Start/End: 2017 to 2019
2.1.2.5
Beginning in 2018, and then annually, provide training for community health workers/
promotoras on HIV testing, prevention and linkage to care.
Metric: The number of trainings provided each year
Lead Program: Arizona AIDS Education and Training Center
Partners: Ryan White Programs, HIV Prevention Program, Community-Based Organizations
Start/End: 2018 to 2021
NORTHERN ARIZONA 89
GOAL 2:
INCREASE ACCESS TO CARE AND IMPROVE HEALTH OUTCOMES FOR
PEOPLE LIVING WITH HIV.
Objective 1:
Increase the percentage of newly diagnosed persons linked to HIV medical
care within one month of their HIV diagnosis to at least 85%.
Strategy 3: Patient-Centered Care
2.1.3.1
Implement a standardized referral process that institutes culturally competent, “warm”
referrals between service providers.
Metric: The implementation of a standardized referral process
Lead Program: Ryan White Part B Program
Partners:
HIV Prevention Program, County/State Entities, Tribal Entities, Substance Abuse/
Behavioral Health Providers, Correctional Facilities, Community-Based Organizations
Start/End: 2017 to 2021
2.1.3.2
Annually, provide at least one training for healthcare and community-based providers that
addresses issues such as cultural competency, motivational interviewing, trauma-informed
care, treatment adherence etc. Training may be provided in-person or online.
Metric: At least one competency training is provided each year.
Lead Program: Arizona AIDS Education and Training Center
Partners:
Ryan White Part B Program, HIV Prevention Program, County/State Entities, Tribal
Entities, Community-Based Organizations
Start/End: 2017 to 2021
2.1.3.3
Assess the needs of newly diagnosed clients that have co-occurring issues, such as
homeless or substance abuse issues. Develop action items based on the evaluation of the
assessment
Metric: The completion of the assessment; development of action items
Lead Program: Ryan White Part B Program
Partners:
HIV Prevention Program, County/State Entities, Tribal Entities, Community-Based
Organizations
Start/End: 2018 to 2019
90 NORTHERN ARIZONA
Strategy 3: Patient-Centered Care continued
2.1.3.4
Evaluate the capacity of service organizations to enable clients to receive medical and
supportive service appointments at their home or other convenient location, when feasible.
As an alternative, evaluate the need and ability to provide increased access to
transportation services.
Metric:
Capacity to provide offsite medical and supportive service appointments is evaluated; the
need and ability to provide increased transportation services is evaluated; action items
developed
Lead Program: Ryan White Part B Program
Partners: State Entities, Tribal Entities, Community-Based Organizations
Start/End: 2018 to 2019
NORTHERN ARIZONA 91
GOAL 2:
INCREASE ACCESS TO CARE AND IMPROVE HEALTH OUTCOMES FOR
PEOPLE LIVING WITH HIV.
Objective 2:
Increase the percentage of persons with diagnosed HIV infection who are
retained in care to at least 90%.
Strategy 1: Patient-Centered Care
2.2.1.1
Identify and evaluate health team models/strategies that would be effective in rural
communities.
Metric: Models and/or strategies identified and evaluated; action items developed
Lead Program: Ryan White Part B Program
Partners:
Arizona AIDS Education and Training Center, HIV Prevention Program, County/State
Entities, Tribal Entities, Community-Based Organizations
Start/End: 2019 to2020
2.2.1.2
Assess people living with HIV, at-risk individuals, in target populations, and providers to
inform HIV planning, service delivery, and quality improvement initiatives.
Metric: The assessment is completed and evaluated; action items are developed
Lead Program: Ryan White Part B Program
Partners:
HIV Prevention Program, State/County Entities, Tribal Entities, Community-Based
Organizations, Community Stakeholders
Start/End: 2018 to 2019
92 NORTHERN ARIZONA
GOAL 2:
INCREASE ACCESS TO CARE AND IMPROVE HEALTH OUTCOMES
FOR PEOPLE LIVING WITH HIV.
Objective 2:
Increase the percentage of persons with diagnosed HIV infection who are
retained in care to at least 90%.
Strategy 2: Funding
2.2.2.1
Evaluate retention-in-care service delivery and funding to include community outreach
services.
Metric: Service delivery and funding evaluated
Lead Program: Ryan White Part B Program
Partners:
HIV Prevention Program, County/State Entities, Tribal Entities, Community-Based
Organizations
Start/End: 2018 to 2019
2.2.2.2
Conduct an assessment of the capacity building opportunities for community-based
organizations and providers seeking to diversify their funding sources.
Metric: Completion of the assessment
Lead Program: Ryan White Part B Program
Partners:
HIV Prevention Program, County/State Entities, Tribal Entities, Community-Based
Organizations
Start/End: 2017 to 2019
2.2.2.3
Compile data from multiple sources, including continuums of care specific to each target
population, to justify the need for funding, and disseminate this information to community
partners.
Metric: Completion of needs assessment, Key informant interviews
Lead Program: Ryan White Part B Program
Partners:
HIV Prevention Program, County/State Entities, Tribal Entities, Indian Health Service,
Arizona AIDS Education and Training Center
Start/End: 2017 to 2019
NORTHERN ARIZONA 93
GOAL 2:
INCREASE ACCESS TO CARE AND IMPROVE HEALTH OUTCOMES FOR
PEOPLE LIVING WITH HIV.
Objective 2:
Increase the percentage of persons with diagnosed HIV infection who are
retained in care to at least 90%.
Strategy 3: Data Standardization
2.2.3.1
Reduce paperwork among community providers by establishing a universal enrollment
and data-sharing process for non-Ryan White services.
Metric: Completion of the universal enrollment process
Lead Program: Ryan White Part B Program
Partners: Community-Based Organizations
Start/End: 2018 to 2019
2.2.3.2
Evaluate the feasibility of implementing a shared data system for prevention and care
services, that includes linkage to care information.
Metric: An implementation evaluation is completed; action items are developed
Lead Program: Ryan White Part B Program
Partners:
HIV Prevention Program, County/State Entities, Tribal Entities, Community-Based
Organizations
Start/End: 2017 to 2020
94 NORTHERN ARIZONA
GOAL 3: REDUCE HIV-RELATED DISPARITIES AND HEALTH INEQUALITIES.
Objective 1:
Increase the percentage of people living with HIV who know their
serostatus to at least 90%.
Strategy 1: Stigma Reduction
3.1.1.1
Conduct an assessment of the HIV knowledge, stigma, behaviors, education and service
needs of local target populations most at-risk for contracting HIV, and people who are
living with HIV.
Metric: Assessment completed
Lead Program: HIV Statewide Advisory Group
Partners:
HIV Prevention Program, Ryan White Part B Program, Arizona AIDS Education and
Training Center, State/County Entities, Tribal Entities, Community-Based Organizations
Start/End: 2017 to 2019
3.1.1.2
Establish partnerships with community stakeholders and entities that serve target
populations to develop and implement strategies to address multiple types of stigma
(individual, family, friends, providers, culture, etc.).
Metric: The establishment of partnerships
Lead Program: HIV Prevention Program
Partners:
Ryan White Part B Program, Arizona AIDS Education and Training Center, State/County
Entities, Tribal Entities, Community-Based Organizations, Community Stakeholders
Start/End: 2017 to 2021
NORTHERN ARIZONA 95
GOAL 3: REDUCE HIV-RELATED DISPARITIES AND HEALTH INEQUALITIES.
Objective 1:
Increase the percentage of people living with HIV who know their
serostatus to at least 90%.
Strategy 2: Community Engagement
3.1.2.1
Biannually, develop and implement at least one initiative to decrease negative perceptions
of HIV and HIV testing.
Metric: At least one initiative implemented every two years
Lead Program: HIV Prevention Program
Partners:
Ryan White Part B Program, County/State Entities, Tribal Entities, Community-Based
Organizations, Community Stakeholders
Start/End: 2017 to 2019
3.1.2.2
Collaborate with American Indian communities to develop culturally appropriate sexual
health education and HIV messaging materials.
Metric: The development of materials
Lead Program: HIV Prevention Program
Partners:
Arizona AIDS Education and Training Center, County/State Entities, Tribal Health Entities,
Indian Health Service
Start/End: 2018 to 2020
96 NORTHERN ARIZONA
GOAL 3: REDUCE HIV-RELATED DISPARITIES AND HEALTH INEQUALITIES.
Objective 1:
Increase the percentage of people living with HIV who know their
serostatus to at least 90%.
Strategy 3: Funding
3.1.3.1
Identify and evaluate methodologies for providers to modify the way they offer HIV/STD/
Hepatitis prevention and care services to create opportunities for third-party billing.
Metric: Methodologies identified and evaluated for implementation; action items developed
Lead Program: HIV Prevention Program
Partners:
Ryan White Part B Program, County/State Entities, Tribal Entities, Community-Based
Organizations
Start/End: 2017 to 2019
3.1.3.2
Identify opportunities to combine programmatic resources to create efficiencies in
contracting, improve service integration, and reduce duplication of effort and/or
competition for funding.
Metric: Successful identification and implementation of new opportunities for efficiency
Lead Program: Ryan White Part B Program
Partners:
HIV Prevention Program, State/County Entities, Tribal Entities, Community-Based
Organizations
Start/End: 2017 to 2019
3.1.3.3
Assess opportunities to provide free/low cost services for people living with HIV who have
co-infections that need to be addressed.
Metric: Assessment completed; action items developed
Lead Program: HIV Prevention Program
Partners: County/State Entities, Tribal Health Entities, Community-Based Organizations
Start/End: 2018 to 2019
NORTHERN ARIZONA 97
GOAL 4: ACHIEVE A MORE COORDINATED RESPONSE TO THE HIV EPIDEMIC.
Objective 1:
Increase the percentage of people living with HIV who know their
serostatus to at least 90%.
Strategy 1: Community Engagement
4.1.1.1
Recruit people living with HIV and other stakeholders to become to become leaders,
advocates, planners and peer mentors for the local HIV community.
Metric: The number of people recruited for community leadership each year
Lead Program: HIV Statewide Advisory Group
Partners:
HIV Prevention Program, Ryan White Part B Program, County/State Entities, Tribal
Entities, Youth Organizations, Community-Based Organizations
Start/End: 2017 to 2018
4.1.1.2
Annually, provide at least one leadership development, advocacy, and other training for
HIV community leaders.
Metric: At least one training provided each year
Lead Program: HIV Statewide Advisory Group
Partners:
HIV Prevention Program, Ryan White Part B Program, County/State Entities, Tribal
Entities, Youth Organizations, Community-Based Organizations
Start/End: 2018 to 2021
98 NORTHERN ARIZONA
GOAL 4: ACHIEVE A MORE COORDINATED RESPONSE TO THE HIV EPIDEMIC.
Objective 1:
Increase the percentage of people living with HIV who know their
serostatus to at least 90%.
Strategy 2: Prevention, Testing & Linkage to Care
4.1.2.1
Develop and implement activities that support the integration of comprehensive sexual
health services as a routine part of care, including routine HIV/STD/Hepatitis testing.
Metric: The development and implementation of activities
Lead Program: HIV Prevention Program
Partners:
Ryan White Part B Program, Arizona AIDS Education and Training Center, County/State
Entities, Tribal Entities, Community-Based Organizations
Start/End: 2018 to 2021
4.1.2.2
Coordinate HIV/STD/Hepatitis testing services to ensure equity of service delivery among
diverse providers, and appropriateness of services delivered to various age groups and
target populations.
Metric: The number and types of collaborative activities
Lead Program: HIV Prevention Program
Partners:
Ryan White Part B Program, County/State Entities, Tribal Entities, Community-Based
Organizations
Start/End: 2018 to 2021
NORTHERN ARIZONA 99
GOAL 4: ACHIEVE A MORE COORDINATED RESPONSE TO THE HIV EPIDEMIC.
Objective 1:
Increase the percentage of people living with HIV who know their
serostatus to at least 90%.
Strategy 3: Education
4.1.3.1
Annually, provide at least one fact-based, culturally and linguistically appropriate HIV
education opportunity to youth aged 13 to 19, and/or organizations serving youth.
Metric: The presentation of one education opportunity each year; the number of youth participants
Lead Program: HIV Prevention Program
Partners:
Ryan White Part B Program, Northern Arizona Providers, County/State Entities, Tribal
Entities, Youth Organizations, Community-Based Organizations
Start/End: 2017 to 2018
4.1.3.2
Establish a partnership with the Office of Women’s and Children’s Health reproductive
health program to include HIV education and testing as a part of its programming.
Metric: Partnership established
Lead Program: HIV Prevention Program
Partners: Ryan White Part B Program, State/County Entities
Start/End: 2017 to 2021
4.1.3.3
Establish a partnership with the Northern Arizona Regional Behavioral Health Authority to
include HIV education and testing as a part of its programming.
Metric: Partnership established
Lead Program: HIV Prevention Program
Partners:
Ryan White Part B Program, State/County Entities, Northern Arizona Regional Behavioral
Health Authority
Start/End: 2017 to 2021
100 NORTHERN ARIZONA
Strategy 3: Education continued
4.1.3.4
Establish a partnership with the University/Colleges to include HIV education as a part of
its educational programming.
Metric: Partnership established
Lead Program: HIV Prevention Program
Partners: Ryan White Part B Program, State/County Entities
Start/End: 2017 to 2021
NORTHERN ARIZONA 101
GOAL 4: ACHIEVE A MORE COORDINATED RESPONSE TO THE HIV EPIDEMIC.
Objective 2:
Increase the percentage of newly diagnosed persons linked to HIV medical
care within one month of their HIV diagnosis to at least 85%.
Strategy 1: Prevention, Testing and Linkage to Care
4.2.1.1
Increase referrals for HIV testing, prevention and linkage to care services from substance
abuse providers.
Metric: An increase in the number of referrals
Lead Program: Ryan White Part B Program
Partners:
State/County Entities, Substance Abuse Service Providers, Community-Based
Organizations
Start/End: 2017 to 2021
102 NORTHERN ARIZONA
GOAL 4: ACHIEVE A MORE COORDINATED RESPONSE TO THE HIV EPIDEMIC.
Objective 2:
Increase the percentage of newly diagnosed persons linked to HIV medical
care within one month of their HIV diagnosis to at least 85%.
Strategy 2: Streamline Processes
4.2.2.1
Develop capacity for substance abuse and behavioral health services to obtain SAMHSA
funding assistance for HIV prevention and care services.
Metric: The provision of capacity building assistance
Lead Program: HIV Prevention Program
Partners:
County/State entities, Tribal Health entities, Substance abuse/Behavioral Health Services
Providers, Community-Based Organizations
Start/End: 2018 to 2020
CENTRAL ARIZONA 103
Central Region Plan
104 CENTRAL ARIZONA
The Central Region
Target Populations
 Men who have Sex with Men (MSM), especially youth and MSM of Color
 Hispanics, regardless of gender
 African Americans/Blacks, regardless of gender
 Transgender Individuals
Activity Highlights
 Implementation of Pre-Exposure Prophylaxis (PrEP) Engagement
Assistance programming, and efforts to increase consumer use of PrEP
 Increased HIV testing, and diversification of HIV testing locations,
including opt-out HIV testing in hospital settings
 Form reduction and process improvements to reduce duplication of
effort among funding sources
 Quality improvement initiatives designed to reduce linkage to care
timeframes
 Consumer and provider training related to stigma reduction, cultural
competency, and client empowerment
 Social marketing initiatives to increase HIV testing and awareness, PrEP
engagement, and engagement in care
The Central Region is comprised of Maricopa and Pinal counties, and had
an estimated population of 4,489,109 in 2014. Federally-funded HIV
prevention and care services in the Central Region are provided by the HIV
Prevention Program, and Ryan White Part A, B, C and D Programs. The
region is 14,566 square miles. The Central Region includes Phoenix, the
state’s capitol, which is the sixth most populated city in America at more
than 1,563,025 people in 2015. Pinal County is mostly rural. The Central
Region accounts for more than 70% of the state’s HIV incidence and
prevalence. Major HIV issues affecting the Central Region include ethnic/
racial disparities, especially within the Black community, stigma, lack of
sexual health education in schools, and access to care issues.
The Central Region defines the geographic service delivery area for the
Phoenix EMA Ryan White Part A Program. Ryan White Parts B, C and D, and
the HIV Prevention Program also provide services in the Region.
CONTINUUM OF CARE DEFINITIONS
HIV-Diagnosed: Prevalent cases that
have been diagnosed
Linked to HIV Care: Prevalent cases
with a documented lab test, doctor
visit or medication use in the calendar
year
Incidence Linked to HIV Care:
Incident cases for the year of the
spectrum that were linked with a
documented lab test, doctor visit or
medication use within 90 days of their
diagnosis, but not on the same day of
the diagnosis.
If a person has their first CD4, viral
load or genotype on the same day as
their diagnostic test the date of
second CD4, viral load or genotype
will be used as the linkage
Retained in HIV Care: Prevalent cases
with a documented lab test,
doctor visit or antiretroviral (ARV) use
in the first and second six months of
the year
On ARV Therapy: Prevalent cases
with documented ARV use or whose
last viral load of the calendar year
was undetectable
Adherent/Suppressed: Prevalent
cases whose last viral load of the
calendar year was undetectable (<200
C/mL)
CENTRAL ARIZONA 105
The 2015 Arizona Department of Health Services Epidemiology Report
shows the Central Region had 67% of the state population and 74% of the
new HIV cases and 75% of the ongoing HIV cases. Census data from 2015
shows that Central Arizona reports approximately a quarter of people are
under 18 years old. The percentage of HIV positive Whites (84%) and
Latinos (31%) closely mirror the general state population rates. There is a
higher percentage of African Americans/Blacks in Maricopa County (6% vs.
statewide average of 5%) and a lower percent of Native Americans (3%)
when compared to the statewide average of 5%. In 2014, there were 608
new HIV cases (an increase of 85 cases), while prevalence increased by 192
cases, suggesting an influx of previously diagnosed people living with HIV
to the Central Region.
FIGURE 17
2014 Central Region
HIV Continuum of Care
12196
7574
5945
6530
360
of
516
5711
106 CENTRAL ARIZONA
Review of continuum data in Figure 20 by race/ethnicity shows that
American Indians/Alaskan Native clients in the Central Region have the
highest viral load suppression at 86%, followed by Hispanics at 72%.
Latinos have the lowest rates of linkage to care (58%), and Blacks and
Asians have the lowest rates of viral load suppression (45%).
In Figure 21, the most frequently reported risk factors for the Central
Region are Men who have Sex with Men (7,492 people), Injection Drug
Users (2,101 people) and High Risk Heterosexuals (1,283 people).
FIGURE 18
2014 Central Region
HIV Continuum of Care
by Race/Ethnicity
CENTRAL ARIZONA 107
FIGURE 19
2014 Central Region
HIV Continuum of Care
by Gender
Year Prevalence Incidence
2005 562 44
2006 606 27
2007 652 42
2008 706 39
2009 740 40
2010 747 45
2011 795 36
2012 896 33
2013 939 61
2014 1003 39
TABLE 21
Comparison of Central Region
Incidence and Prevalence
Totals by Year
108 CENTRAL ARIZONA
FIGURE 20
2014 Central Region
HIV Continuum of Care
By Risk Category
KEY
MSM: Men who have Sex with Men
IDU: Injection Drug User
HRH: High-Risk Heterosexual
NRR: No Reported Risk
CENTRAL ARIZONA 109
TABLE 22
Central Arizona
Regional Incidence
2009 to 2013
Emergent HIV Emergent AIDS Emergent HIV & AIDS
Cases
% State
Total
Rate Per
100,000
Cases
% State
Total
Rate Per
100,000
Cases
% State
Total
Rate Per
100,000
By Gender
Male 1544 63.1 14.35 595 24.3 5.53 2139 87.4 19.89
Female 230 9.4 2.13 77 3.1 0.71 307 12.6 2.84
TOTAL 1774 72.5 8.23 672 27.5 3.12 2446 100.0 11.35
By Age
Under 2 4 0.2 0.65 0 0.0 0.00 4 0.2 0.65
2 to 12 14 0.6 0.40 0 0.0 0.00 14 0.6 0.40
13 to 19 71 2.9 3.40 5 0.2 0.24 76 3.1 3.64
20 to 24 343 14.0 23.07 41 1.7 2.76 384 15.7 25.83
25 to 29 353 14.4 22.33 81 3.3 5.12 434 17.7 27.45
30 to 34 257 10.5 16.62 92 3.8 5.95 349 14.3 22.57
35 to 39 228 9.3 15.40 95 3.9 6.42 323 13.2 21.82
40 to 44 189 7.7 12.92 108 4.4 7.38 297 12.1 20.30
45 to 49 138 5.6 9.71 79 3.2 5.56 217 8.9 15.27
50 to 54 87 3.6 6.39 89 3.6 6.53 176 7.2 12.92
55 to 59 57 2.3 4.76 34 1.4 2.84 91 3.7 7.60
60 to 64 21 0.9 1.93 31 1.3 2.85 52 2.1 4.79
65 and Above 12 0.5 0.44 17 0.7 0.62 29 1.2 1.06
Age Unknown 0 0.0 NA 0 0.0 N/A 0 0.0 NA
TOTAL 1774 72.5 8.23 672 27.5 3.12 2446 100.0 11.35
By Race/Ethnicity
White Non-Hispanic 736 30.1 5.80 314 12.8 2.47 1050 42.9 8.27
Black Non-Hispanic 275 11.2 24.77 78 3.2 7.03 353 14.4 31.80
Hispanic 639 26.1 9.83 234 9.6 3.60 873 35.7 13.43
*A/PI/H Non-Hispanic 39 1.6 4.86 14 0.6 1.74 53 2.2 6.60
**AI/AN Non-Hispanic 65 2.7 14.93 30 1.2 6.89 95 3.9 21.82
***MR/O Non-Hispanic 20 0.8 N/A 2 0.1 N/A 22 0.9 N/A
TOTAL 1774 72.5 8.23 672 27.5 3.12 2446 100.0 11.35
By Mode of Transmission
+
MSM 1142 46.7 N/A 353 14.4 N/A 1495 61.1 N/A
++
IDU 115 4.7 N/A 59 2.4 N/A 174 7.1 N/A
MSM / IDU 96 3.9 N/A 30 1.2 N/A 126 5.2 N/A
Heterosexual 164 6.7 N/A 79 3.2 N/A 243 9.9 N/A
+++
O/H/TF/TPR 16 0.7 N/A 0 0.0 N/A 16 0.7 N/A
++++
NRR/UR 241 9.9 N/A 151 6.2 N/A 392 16.0 N/A
TOTAL 1774 72.5 8.23 672 27.5 3.12 2446 100.0 11.35
* Asian Pacific/Islander/Hawaiian + Men having Sex with Men ++++ No Reported Risk/Unknown Risk
** American Indian/Alaskan Native ++ Injection Drug Use
*** Multiple Race/Other Race +++ Other/Hemophilia/Transfusion and Blood Products/Transplant Recipient
110 CENTRAL ARIZONA
Prevalent HIV Prevalent AIDS Prevalent HIV & AIDS
Cases
% State
Total
Rate Per
100,000
Cases
% State
Total
Rate Per
100,000
Cases
% State
Total
Rate Per
100,000
By Gender
Male 5374 43.1 245.69 5359 43.0 245.00 10733 86.1 490.69
Female 971 7.8 43.91 765 6.1 34.59 1736 13.9 78.50
TOTAL 6345 50.9 144.25 6124 49.1 139.22 12469 100.0 283.47
By Age
Under 2 0 0.0 0.00 0 0.0 0.00 0 0.0 0.00
2 to 12 38 0.3 5.53 7 0.1 1.02 45 0.4 6.55
13 to 19 54 0.4 12.76 11 0.1 2.60 65 0.5 15.36
20 to 24 292 2.3 94.93 60 0.5 19.51 352 2.8 114.44
25 to 29 578 4.6 186.18 218 1.7 70.22 796 6.4 256.39
30 to 34 684 5.5 220.53 360 2.9 116.07 1044 8.4 336.59
35 to 39 709 5.7 243.66 545 4.4 187.30 1254 10.1 430.95
40 to 44 844 6.8 282.49 791 6.3 264.75 1635 13.1 547.24
45 to 49 929 7.5 331.56 1189 9.5 424.35 2118 17.0 755.91
50 to 54 969 7.8 340.69 1326 10.6 466.21 2295 18.4 806.90
55 to 59 608 4.9 236.87 777 6.2 302.71 1385 11.1 539.57
60 to 64 342 2.7 150.22 465 3.7 204.25 807 6.5 354.47
65 and Above 285 2.3 47.15 375 3.0 62.04 660 5.3 109.19
Age Unknown 13 0.1 N/A 0 0.0 N/A 13 0.1 N/A
TOTAL 6345 50.9 144.25 6124 49.1 139.22 12469 100.0 283.47
By Race/Ethnicity
White Non-Hispanic 3314 26.6 128.57 3336 26.8 129.42 6650 53.3 257.99
Black Non-Hispanic 923 7.4 388.90 825 6.6 347.61 1748 14.0 736.50
Hispanic 1717 13.8 130.45 1668 13.4 126.73 3385 27.1 257.18
*A/PI/H Non-Hispanic 111 0.9 62.73 78 0.6 44.08 189 1.5 106.81
**AI/AN Non-Hispanic 157 1.3 173.15 159 1.3 175.35 316 2.5 348.50
***MR/O Non-Hispanic 123 1.0 N/A 58 0.5 N/A 181 1.5 N/A
TOTAL 6345 50.9 144.25 6124 49.1 139.22 12469 100.0 283.47
By Mode of Transmission
+
MSM 3934 31.6 N/A 3756 30.1 N/A 7690 61.7 N/A
++
IDU 532 4.3 N/A 620 5.0 N/A 1152 9.2 N/A
MSM / IDU 390 3.1 N/A 599 4.8 N/A 989 7.9 N/A
Heterosexual 670 5.4 N/A 635 5.1 N/A 1305 10.5 N/A
+++
O/H/TF/TPR 84 0.7 N/A 58 0.5 N/A 142 1.1 N/A
++++
NRR/UR 735 5.9 N/A 456 3.7 N/A 1191 9.6 N/A
TOTAL 6345 50.9 144.25 6124 49.1 139.22 12469 100.0 283.47
TABLE 23
Central Arizona
Prevalence 2014
* Asian Pacific/Islander/Hawaiian + Men having Sex with Men ++++ No Reported Risk/Unknown Risk
** American Indian/Alaskan Native ++ Injection Drug Use
*** Multiple Race/Other Race +++ Other/Hemophilia/Transfusion and Blood Products/Transplant Recipient
CENTRAL ARIZONA 111
GOAL 1: REDUCE NEW HIV INFECTIONS.
Objective 1:
Increase the percentage of people living with HIV who know their
serostatus to at least 90%.
Strategy 1: Prevention, Testing & Linkage to Care
1.1.1.1
Annually, increase HIV testing by adding three testing sites and/or testing initiatives,
focusing testing on target populations most at-risk for contacting HIV, including MSM, IDU,
communities of color and the transgender individuals.
Metric: The number of testing sites and/or initiatives added each year.
Lead Program: HIV Prevention Program
Partners: Arizona AIDS Education and Training Center, Ryan White Programs
Start/End: 2017 to 2021
1.1.1.2
Increase the number of medical providers educated on HIV/PrEP, and ultimately
prescribing PrEP, by three providers per year.
Metric: The number of providers educated about PrEP, and the prescribing PrEP each year
Lead Program: Arizona AIDS Education and Training Center
Partners: Ryan White Programs, HIV Prevention Program
Start/End: 2017 to 2021
1.1.1.3
Annually, increase the number of health care professionals trained in knowledge of 4th
generation algorithms for HIV testing by three providers per year.
Metric: The number of health care professionals trained in 4th generation HIV testing each year
Lead Program: Arizona AIDS Education and Training Center
Partners: Ryan White Programs, HIV Prevention Program
Start/End: 2017 to 2021
112 CENTRAL ARIZONA
Strategy 1: Prevention, Testing & Linkage to Care continued
1.1.1.4
Annually, present at least one linkage to care training, designed to increase collaboration
and dialog among HIV agencies to reduce linkage to care timeframes.
Metric: The number of linkage to care trainings provided each year
Lead Program: Arizona AIDS Education and Training Center
Partners:
Ryan White Programs, HIV Prevention Program, State/County Entities, Tribal Entities,
Community-Based Organizations
Start/End: 2017 to 2021
1.1.1.5
Annually, develop and implement at least one social marketing initiative to target
populations, designed to engage individuals to be tested for HIV and/or enter medical care.
Metric: The implementation of at least one social marketing initiative each year
Lead Program: HIV Prevention Program
Partners:
Ryan White Programs, HIV Prevention Program, State/County Entities, Tribal Entities,
Arizona AIDS Education and Training Center, Community-Based Organizations
Start/End: 2017 to 2021
1.1.1.6
Conduct a one-year pilot of PrEP Evaluation Assistance at two locations. PrEP Evaluation
Assistance is designed to educate and engage high-risk HIV negative people in the use of
Pre-Exposure Prophylaxis as an HIV Prevention Method. Monitor and evaluate utilization
and engagement.
Metric: Pilot Program initiated; utilization and engagement in PrEP monitored and evaluated
Lead Program: HIV Prevention Program
Partners: HIV Care Directions, Southwest Center for HIV
Start/End: 2017 to 2018
CENTRAL ARIZONA 113
Strategy 1: Prevention, Testing & Linkage to Care continued
1.1.1.7
Assess the PrEP Evaluation Assistance pilot program. Based on performance, expand
service delivery.
Metric: Based on pilot program performance, expand PrEP Evaluation Assistance services.
Lead Program: HIV Prevention Program
Partners: State/County Entities, Tribal Entities, Community-Based Organizations
Start/End: 2018 to 2021
1.1.1.8
Annually, develop and implement at least one PrEP-focused social marketing initiative
focused on target populations, designed to engage individuals to become educated and
engaged in PrEP.
Metric: The implementation of at least one social marketing initiative each year
Lead Program: HIV Prevention Program
Partners:
Ryan White Programs, HIV Prevention Program, State/County Entities, Tribal Entities,
Community-Based Organizations
Start/End: 2017 to 2021
114 CENTRAL ARIZONA
GOAL 1: REDUCE NEW HIV INFECTIONS.
Objective 1:
Increase the percentage of people living with HIV who know their
serostatus to at least 90%.
Strategy 2: Education
1.1.2.1
Annually, increase the number of HIV providers in Maricopa and Pinal Counties trained on
diagnosis and management of HIV, by six per year statewide
Metric: The number of providers trained on the diagnosis and management of HIV each year
Lead Program: Arizona AIDS Education and Training Center
Partners: Ryan White Programs, HIV Prevention Program, State/County Entities, Tribal Entities
Start/End: 2018 to 2021
1.1.2.2
Annually, provide training to Oral Health professionals in Maricopa and Pinal Counties on
common oral manifestations as seen in patients with HIV.
Metric: The number of dentists trained each year
Lead Program: Arizona AIDS Education and Training Center
Partners: Ryan White Programs, HIV Prevention Program, State/County Entities, Tribal Entities
Start/End: 2017 to 2021
1.1.2.3
Annually, present at least one regional provider training, in collaboration with the
California HIV/STD Training Center.
Metric: The number of trainings provided each year
Lead Program: Arizona AIDS Education and Training Center
Partners:
Ryan White Programs, HIV Prevention Program, State/County Entities, Tribal Entities,
Community-Based Organizations
Start/End: 2017 to 2021
CENTRAL ARIZONA 115
Strategy 2: Education continued
1.1.2.4
Beginning in 2018, and then annually, provide training for community health workers/
promotoras on HIV testing, prevention and linkage to care.
Metric: The number of trainings provided each year
Lead Program: Arizona AIDS Education and Training Center
Partners: Ryan White Programs, HIV Prevention Program, Community-Based Organizations
Start/End: 2018 to 2021
1.1.2.5 Annually, present at least one regional CBO/provider training on trauma-informed care.
Metric: The number of trainings provided each year
Lead Program: Ryan White Part A Program
Partners:
Arizona AIDS Education and Training Center, Other Ryan White Programs, HIV Prevention
Program, Community-Based Organizations
Start/End: 2018 to 2021
116 CENTRAL ARIZONA
GOAL 1: REDUCE NEW HIV INFECTIONS.
Objective 1:
Increase the percentage of people living with HIV who know their
serostatus to at least 90%.
Strategy 3: Community Engagement
1.1.3.1
Develop and implement an annual community-based initiative to promote HIV awareness,
testing/linkage to care, and engagement in care that is culturally and linguistically
appropriate.
Metric:
At least one initiative implemented each year; yearly assessment data demonstrating
improved knowledge of HIV awareness, use of HIV testing/linkage to care services, and
increased engagement in care
Lead Program: HIV Prevention Program
Partners:
Ryan White Programs, State/County Entities, Tribal Entities, Community-Based
Organizations, Community Stakeholders
Start/End: 2017 to 2018
1.1.3.2
Collaboratively develop tools and processes with Immigration and Customs Enforcement
and Border Health programs to coordinate HIV care during deportation.
Metric: Development of the tools and processes
Lead Program: Ryan White Part A Program
Partners:
Ryan White Programs, Arizona AIDS Education and Training Center, Immigration and
Customs Enforcement, Border Health programs, Community-Based Organizations
Start/End: 2017 to 2019
1.1.3.3
Annually, present a collaboratively developed HIV Symposium, offering program
contractors and community stakeholders opportunities for education on service delivery
and quality improvement, as well as engagement in HIV planning activities.
Metric: Presentation of the HIV Symposium each year
Lead Program: HIV Prevention Program
Partners:
Ryan White Programs, State/County Entities, Arizona AIDS Education and Training Center,
HIV Providers, Community-Based Organizations
Start/End: 2017 to 2021
CENTRAL ARIZONA 117
GOAL 1: REDUCE NEW HIV INFECTIONS.
Objective 2:
Increase the percentage of newly diagnosed persons linked to HIV medical
care within one month of their HIV diagnosis to at least 85%.
Strategy 1: Streamline Processes
1.2.1.1
Establish a common enrollment application for Ryan White programs, including an online
enrollment portal.
Metric: Completion of the online enrollment portal, and policies and procedures
Lead Program: Ryan White Part B Program
Partners: Ryan White Programs
Start/End: 2017 to 2018
1.2.1.2
Implement processes that support Ryan White-eligible clients attending their first medical
visit with a doctor on the same day as their HIV diagnosis.
Metric:
The number of newly-diagnosed clients who are offered and attend a same day medical
appointment
Lead Program: Ryan White Part A Program
Partners:
Ryan White Programs, State/County Entities, HIV Prevention Program, Community-Based
Organizations
Start/End: 2017 to 2019
118 CENTRAL ARIZONA
GOAL 1: REDUCE NEW HIV INFECTIONS.
Objective 2:
Increase the percentage of newly diagnosed persons linked to HIV medical
care within one month of their HIV diagnosis to at least 85%.
Strategy 2: Community Engagement
1.2.2.1
Annually, implement a strategy to engage traditional and non-traditional community
partners serving target populations in activities that promote HIV testing, linkage to care,
harm reduction and engagement in care.
Metric: The number of new, traditional and non-traditional partners engaged each year
Lead Program: HIV Prevention Program
Partners:
Ryan White Programs, State/County Entities, Tribal Entities, Community-Based
Organizations
Start/End: 2017 to 2021
1.2.2.2
Implement technology resources to expand partner services, in order to improve health
and prevention outcomes.
Metric: Success of implementing technology that expands partner services
Lead Program: HIV Prevention Program
Partners: State/County Entities
Start/End: 2017 to 2019
1.2.2.3
Annually, assess people living with HIV, at-risk individuals in target populations, and
providers to inform HIV planning, service delivery, and quality improvement initiatives.
Metric: Completion of a yearly assessment
Lead Program: Ryan White Part A Program
Partners: Ryan White Programs, HIV Prevention Program
Start/End: 2017 to 2021
CENTRAL ARIZONA 119
GOAL 1: REDUCE NEW HIV INFECTIONS.
Objective 2:
Increase the percentage of newly diagnosed persons linked to HIV medical
care within one month of their HIV diagnosis to at least 85%.
Strategy 3: Patient-Centered Care
1.2.3.1
Annually, complete at least one quality initiative that drives improvements to decrease
entry to care timeframes.
Metric: Reduction in entry to care timeframes contributable to the implemented quality initiative
Lead Program: Ryan White Part A Program
Partners:
Ryan White Programs, HIV Prevention Program, State/County Entities, Part A Early
Intervention Services sub-recipients, other Part A sub-recipients, Community-Based
Organizations
Start/End: 2017 to 2021
1.2.3.2
Annually, provide cultural competency, health equity, and/or CLAS trainings to sub-
recipients, community-based organizations, and other service providers.
Metric: The number of trainings provided each year
Lead Program: Ryan White Part A Program
Partners: Ryan White Programs, HIV Prevention Program, Ryan White Part A Program sub-recipients
Start/End: 2017 to 2021
1.2.3.3 Establish a Spanish language version of HIVAZ.org.
Metric: Successful implementation of the Spanish language version of HIVAZ.org
Lead Program: HIV Prevention Program
Partners: Aunt Rita's Foundation
Start/End: 2017 to 2018
120 CENTRAL ARIZONA
GOAL 2:
INCREASE ACCESS TO CARE AND IMPROVE HEALTH OUTCOMES FOR
PEOPLE LIVING WITH HIV.
Objective 1:
Increase the percentage of newly diagnosed persons linked to HIV medical
care within one month of their HIV diagnosis to at least 85%.
Strategy 1: Streamline Processes
2.1.1.1
Formalize and implement processes between Part A Early Intervention Services sub-
recipients and State and County correctional facilities, to improve linkages to HIV care and
supportive services for recently released inmates.
Metric: Processes formalized and implemented
Lead Program: Ryan White Part A Program
Partners:
Ryan White Part A sub-recipients for Early Intervention Services, Ryan White Programs,
State/County Correctional Entities, HIV Prevention Program
Start/End: 2017 to 2018
2.1.1.2
Diversify accessibility to HIV prevention and care services for homeless clients by at least
two new providers.
Metric: Two new providers offering HIV prevention and care services targeted to homeless people.
Lead Program: Ryan White Part A
Partners:
Ryan White Part A sub-recipients, Ryan White Programs, HIV Prevention Program, HOPWA,
Housing Services Providers
Start/End: 2017 to 2019
2.1.1.3 Implement HIV prevention strategies in correctional systems.
Metric: Successful implementation of HIV Prevention strategies in State/local correctional systems
Lead Program: HIV Prevention Program
Partners: Ryan White Programs, State/Local Correctional Health Systems, CBOs
Start/End: 2018 to 2020
CENTRAL ARIZONA 121
Strategy 1: Streamline Processes continued
2.1.1.4
Evaluate the feasibility of implementing a shared data system for prevention and care
services, that includes linkage to care information.
Metric: An implementation evaluation is completed; action items are developed
Lead Program: Ryan White Part B Program
Partners: Ryan White Programs, HIV Prevention Program, Community-Based Organizations
Start/End: 2018 to 2019
122 CENTRAL ARIZONA
GOAL 2:
INCREASE ACCESS TO CARE AND IMPROVE HEALTH OUTCOMES FOR
PEOPLE LIVING WITH HIV.
Objective 1:
Increase the percentage of newly diagnosed persons linked to HIV medical
care within one month of their HIV diagnosis to at least 85%.
Strategy 2: Education
2.1.2.1
Develop a comprehensive, accessible, and culturally/linguistically appropriate library of
health literacy resources for HIV positive and high-risk HIV negative clients, utilizing digital
and traditional media formats.
Metric: Health literacy resources established
Lead Program: Ryan White Part A
Partners:
Ryan White Programs, HIV Prevention Program, Arizona AIDS Education and Training
Center
Start/End: 2017 to 2019
2.1.2.2
Annually, provide training to at least five medical providers related to the diagnosis and
management of HIV, and trauma-informed care.
Metric: At least five HIV medical providers trained each year
Lead Program: Arizona AIDS Education and Training Center
Partners: Ryan White Programs, HIV Prevention Program
Start/End: 2017 to 2021
CENTRAL ARIZONA 123
GOAL 2:
INCREASE ACCESS TO CARE AND IMPROVE HEALTH OUTCOMES FOR
PEOPLE LIVING WITH HIV.
Objective 1:
Increase the percentage of newly diagnosed persons linked to HIV medical
care within one month of their HIV diagnosis to at least 85%.
Strategy 3: Patient-Centered Care
2.1.3.1
By 2018, implement an electronic patient portal in the Ryan White Part C clinic, and
provide ongoing education for clients on the use of patient portal technology.
Metric:
Implementation of the Patient Portal system by 2018; the number of clients utilizing the
system each year from 2019-on
Lead Program: Ryan White Part C Program
Partners: Ryan White Programs, HIV Prevention Program
Start/End: 2017 to 2018
2.1.3.2
Annually, conduct quarterly reviews of Part A sub-recipient quality improvement
initiatives that address linkage to care timeframes.
Metric: Reviews conducted each quarter
Lead Program: Ryan White Part A Program Clinical Quality Management Committee
Partners: Ryan White Programs, HIV Prevention Program
Start/End: 2017 to 2021
2.1.3.3
Establish a baseline for culturally and linguistically appropriate patient-centered care for
those who are HIV negative, including services related to PrEP, harm reduction, condom
distribution, behavioral interventions, and other prevention interventions.
Metric: Baseline established
Lead Program: HIV Prevention Program
Partners:
HIV Statewide Advisory Committee, Part A Planning Council’s Community Health Planning
and Strategies Committee
Start/End: 2018 to 2021
124 CENTRAL ARIZONA
GOAL 2:
INCREASE ACCESS TO CARE AND IMPROVE HEALTH OUTCOMES FOR
PEOPLE LIVING WITH HIV.
Objective 2:
Increase the percentage of persons diagnose with HIV infection who are
virally suppressed to at least 80%.
Strategy 1: Patient-Centered Care
2.2.1.1
Annually, conduct quarterly reviews of viral load suppression data provided by Part A sub-
recipient quality improvement initiatives designed to increase viral load suppression rates.
Metric: Quarterly reviews of viral load suppression data conducted
Lead Program: Ryan White Part A Program Clinical Quality Management Committee
Partners: Ryan White Programs, HIV Prevention Program
Start/End: 2017 to 2021
2.2.1.2
Develop and implement a strategy to expand Part A-funded treatment adherence services,
to improve viral load suppression rates among Ryan White Part A clients.
Metric: The development and implementation of the strategy
Lead Program: Ryan White Part A Program
Partners: Other Ryan White Programs, HIV Prevention Program
Start/End: 2017 to 2019
2.2.1.3
Develop and implement an HIV prevention strategy for HIV positive individuals, focusing
on retention in care, treatment adherence, and viral suppression.
Metric: The development and implementation of the strategy
Lead Program: HIV Prevention Program
Partners:
Ryan White Programs, State/County Entities, Tribal Entities, Community-Based
Organizations
Start/End: 2017 to 2018
CENTRAL ARIZONA 125
GOAL 2:
INCREASE ACCESS TO CARE AND IMPROVE HEALTH OUTCOMES
FOR PEOPLE LIVING WITH HIV.
Objective 2:
Increase the percentage of persons diagnose with HIV infection who are
virally suppressed to at least 80%.
Strategy 2: Community Engagement
2.2.2.1
Biannually, conduct a culturally responsive media initiative that promotes retention in care
and viral suppression to people living with HIV.
Metric: Completion of the media initiative every two years
Lead Program: HIV Prevention Program
Partners:
Ryan White Programs, HIV Statewide Advisory Group, Part A Planning Council’s
Community Health Planning and Strategies Committee, Ryan White Part C Consumer
Advisory Board
Start/End: 2018 to 2020
2.2.2.2
Annually, expand the utilization of HIV care, prevention, and PrEP continuum of care
models by at least one non-Ryan White funded medical practice.
Metric:
At least one non-Ryan White medical practices engages in the use of continuum of care
models each year
Lead Program: Ryan White Part B Program
Partners: Ryan White Programs, Arizona AIDS Education and Training Center
Start/End: 2018 to 2021
126 CENTRAL ARIZONA
GOAL 2:
INCREASE ACCESS TO CARE AND IMPROVE HEALTH OUTCOMES FOR
PEOPLE LIVING WITH HIV.
Objective 2:
Increase the percentage of persons diagnose with HIV infection who are
virally suppressed to at least 80%.
Strategy 3: Streamline Processes
2.2.3.1
Establish baseline data that identifies the number of newly diagnosed clients that are
virally suppressed within 180 days of entry to medical care, and develop a strategy to
increase the number of clients that achieve viral suppression within this timeframe.
Metric:
The baseline data is established, and a strategy to increase the number of clients is
developed
Lead Program: Ryan White Part A Program
Partners: Ryan White Programs, HIV Surveillance Program, Arizona Regional Quality Group
Start/End: 2017 to 2019
2.2.3.2
Implement the proposed strategy to increase the percentage of newly diagnosed clients
that are virally suppressed within 180 days of their first medical appointment.
Metric:
The strategy is implemented; percentage change in the number of newly diagnosed clients
that are virally suppressed within 180 of their first medical appointment
Lead Program: Ryan White Part A Program
Partners: Ryan White Programs, HIV Surveillance Program, Arizona Regional Quality Group
Start/End: 2019 to 2021
CENTRAL ARIZONA 127
GOAL 3: REDUCE HIV-RELATED DISPARITIES AND HEALTH INEQUALITIES.
Objective 1:
Reduce disparities in the rate of new diagnosis by at least 15% in the
following groups: gay and bisexual men, young Black gay and bisexual men,
and Black females.
Strategy 1: Funding
3.1.1.1
Conduct an assessment of the capacity building opportunities for community-based
organizations and providers seeking to diversify their funding sources.
Metric: Completion of the assessment
Lead Program: Ryan White Part A Program
Partners: Ryan White Programs, HIV Prevention Program, Community-Based Organizations
Start/End: 2017
3.1.1.2
Annually, provide at least one capacity building opportunities to CBOs/providers seeking
to diversify their funding sources.
Metric: At least one capacity building opportunity provided each year
Lead Program: Ryan White Part A Program
Partners: Ryan White Programs, HIV Prevention Program, Community-Based Organizations
Start/End: 2018 to 2021
3.1.1.3
Compile data from multiple sources, including continuums of care specific to each target
population, to justify the need for funding, and disseminate this information to community
partners.
Metric: The data is compiled, published and distributed to community partners
Lead Program: Arizona Regional Quality Group
Partners:
Ryan White Programs, HIV Prevention Program, Surveillance, State/County Entities, Tribal
Entities, Community-Based Organizations
Start/End: 2018 to 2021
128 CENTRAL ARIZONA
Strategy 1: Funding continued
3.1.1.4
Develop and implement an action plan to address disparities in populations that are most
affected by HIV, with consideration for traditional and non-traditional funding sources.
Metric: Development and Implementation of the action plan
Lead Program: HIV Statewide Advisory Group
Partners: Ryan White Part A Planning Council, Community-Based Organizations
Start/End: 2019 to 2021
CENTRAL ARIZONA 129
GOAL 3: REDUCE HIV-RELATED DISPARITIES AND HEALTH INEQUALITIES.
Objective 1:
Reduce disparities in the rate of new diagnosis by at least 15% in the
following groups: gay and bisexual men, young Black gay and bisexual men,
and Black females.
Strategy 2: Patient-Centered Care
3.1.2.1
Annually, train at least three non-Ryan White medical providers to enhance their
knowledge of, and ability to link clients to Ryan White and Prevention services.
Metric: Three or more providers are trained each year
Lead Program: Arizona AIDS Education and Training Center
Partners: Ryan White Programs, HIV Prevention Program
Start/End: 2017 to 2021
3.1.2.2
Annually, provide at least one training for funded and non-funded entities related to
culturally and linguistically appropriate HIV care and prevention services.
Metric: At least one training provided each year
Lead Program: Arizona AIDS Education and Training Center
Partners: Ryan White Programs, HIV Prevention Program, Community-Based Organizations
Start/End: 2017 to 2021
130 CENTRAL ARIZONA
GOAL 3: REDUCE HIV-RELATED DISPARITIES AND HEALTH INEQUALITIES.
Objective 1:
Reduce disparities in the rate of new diagnosis by at least 15% in the
following groups: gay and bisexual men, young Black gay and bisexual men,
and Black females.
Strategy 3: Stigma Reduction
3.1.3.1
Annually, implement at least one HIV stigma reduction social marketing initiative each
year, utilizing new and traditional media.
Metric: At least one stigma reduction social marketing initiative implemented each year
Lead Program: HIV Prevention Program
Partners:
Part A Planning Council, HIV Statewide Advisory Group, Ryan White Programs,
Community-Based Organizations
Start/End: 2017 to 2021
CENTRAL ARIZONA 131
GOAL 3: REDUCE HIV-RELATED DISPARITIES AND HEALTH INEQUALITIES.
Objective 1:
Reduce disparities in the rate of new diagnosis by at least 15% in the
following groups: gay and bisexual men, young Black gay and bisexual men,
and Black females.
Strategy 4: Population-Specific Assessment & Strategy Development
3.1.4.1
Conduct an assessment of the health disparities, and HIV prevention and care needs of gay
and bisexual men, young Black gay and bisexual men and Black females.
Metric: Completion of the assessment
Lead Program: HIV Prevention Program
Partners:
Ryan White Programs, Part A Planning Council, HIV Statewide Advisory Group,
Arizona AIDS Education and Training Center, Community-Based Organizations, National
Association of State and Territorial AIDS Directors, HRSA technical consultants
Start/End: 2018
3.1.4.2
Develop and implement a strategy to address issues identified in the assessment. Establish
advisory bodies, comprised of each target population, to inform activities and monitor
outcomes.
Metric: Strategies developed and implemented
Lead Program: HIV Prevention Program
Partners:
Ryan White Programs, Part A Planning Council, HIV Statewide Advisory Group,
Community-Based Organizations
Start/End: 2018 to 2021
3.1.4.3 Annually, monitor and revise the strategy.
Metric: Strategies monitored and revised, as needed
Lead Program: HIV Prevention Program
Partners: Ryan White Programs, Part A Planning Council, HIV Statewide Advisory Group,
Community-Based Organizations
Start/End: 2019 to 2021
132 CENTRAL ARIZONA
GOAL 3: REDUCE HIV-RELATED DISPARITIES AND HEALTH INEQUALITIES.
Objective 2:
Reduce the percentage of persons in HIV medical care who are homeless to
no more than 5%.
Strategy 1: Community Engagement
3.2.1.1
Establish referral mechanisms and MOUs with the centralized homeless housing hubs, such
as CASS Welcome Center, UMOM Family Housing Hub, and Mesa Family Housing Hub for
referrals to Ryan White and HOPWA services.
Metric: Referral mechanisms are defined, and MOUs are established
Lead Program: Ryan White Part A Program
Partners: Local Housing Coordinators, HOPWA
Start/End: 2017 to 2018
3.2.1.2
Develop and implement a strategy that defines a more holistic approach to serving
homeless individuals who are HIV positive (i.e., housing, mental health and substance
abuse services, HIV care).
Metric: The strategy is developed and implemented
Lead Program: HIV Statewide Advisory Group
Partners:
HIV Prevention Program, Ryan White Part A Program, HOPWA, Housing Providers,
Community-Based Organizations
Start/End: 2018 to 2021
CENTRAL ARIZONA 133
GOAL 3: REDUCE HIV-RELATED DISPARITIES AND HEALTH INEQUALITIES.
Objective 2:
Reduce the percentage of persons in HIV medical care who are homeless to
no more than 5%.
Strategy 2: Funding
3.2.2.1 Determine partnership opportunities with HOPWA to seek additional funding sources.
Metric: Partnership opportunities are determined
Lead Program: Ryan White Part B Program
Partners: Ryan White Programs, HOPWA
Start/End: 2018 to 2019
3.2.2.2
Explore opportunities to use Ryan White Part B rebate funds for housing services.
Implement activities as funding allows.
Metric: Opportunities identified, activities initiated
Lead Program: Ryan White Part B Program
Partners: Ryan White Programs, HOPWA
Start/End: 2017 to 2018
134 CENTRAL ARIZONA
GOAL 3: REDUCE HIV-RELATED DISPARITIES AND HEALTH INEQUALITIES.
Objective 2:
Reduce the percentage of persons in HIV medical care who are homeless to
no more than 5%.
Strategy 3: Patient-Centered Care
3.2.3.1
Develop and implement a strategy to increase housing opportunities for HIV clients with
increased challenges in obtaining housing such as a history of past felonies, disabilities,
mental health issues and/or substance abuse.
Metric: Strategy developed and implemented
Lead Program: Ryan White Part A Program
Partners: Ryan White Programs, HOPWA, Community-Based Organizations
Start/End: 2017 to 2018
3.2.3.2 Identify emergency housing options for homeless individuals.
Metric: Emergency housing options identified
Lead Program: Ryan White Part A Program
Partners: Ryan White Programs, HOPWA, Community-Based Organizations
Start/End: 2018
3.2.3.3
Collaborate with the Southern Arizona AIDS Foundation Harm Reduction Program, other
harm reduction programs, and HIV housing programs to evaluate and adopt best practices
statewide.
Metric: Best practices evaluated and implemented as appropriate
Lead Program: Ryan White Part A Program
Partners: Ryan White Programs, HOPWA, HIV Prevention Program, Community-Based Organizations
Start/End: 2018 to 2021
CENTRAL ARIZONA 135
GOAL 4: ACHIEVE A MORE COORDINATED RESPONSE TO THE HIV EPIDEMIC.
Objective 1:
Reduce disparities in the rate of new diagnosis by at least 15% in the
following groups: gay and bisexual men, young Black gay and bisexual men,
and Black females.
Strategy 1: Coordinated Data Collection & Dissemination
4.1.1.1
Identify and assess each Program’s target populations related to health disparities, then
develop and implement a strategy to reduce these disparities.
Metric: Strategy developed and implemented
Lead Program: Arizona Regional Quality Group
Partners: Ryan White Programs, HIV Prevention Program, HIV Surveillance
Start/End: 2017 to 2018
4.1.1.2
Share data among programs and providers to increase collaboration and maximize
available funding to better address health disparities.
Metric: Data sharing agreements in place, and data sharing has begun
Lead Program: Arizona Regional Quality Group
Partners: Ryan White Programs, HIV Prevention Program, HIV Surveillance
Start/End: 2018 to 2021
4.1.1.3
Use data to identify and implement capacity building opportunities among new and
traditional partners to address disparities in target populations.
Metric: Capacity-building opportunities identified and implemented
Lead Program: Arizona Regional Quality Group
Partners: Ryan White Programs, HIV Prevention Program, Medicaid
Start/End: 2018 to 2021
136 CENTRAL ARIZONA
GOAL 4: ACHIEVE A MORE COORDINATED RESPONSE TO THE HIV EPIDEMIC.
Objective 1:
Reduce disparities in the rate of new diagnosis by at least 15% in the
following groups: gay and bisexual men, young Black gay and bisexual men,
and Black females.
Strategy 2: Patient-Centered Care
4.1.2.1
Annually, complete at least one quality initiative that drives improvements to decrease
entry to care timeframes.
Metric: At least one quality initiative completed each year
Lead Program: Ryan White Part A Program Continuous Quality Management Committee
Partners: Ryan White Programs, HIV Prevention Program, State/County Entities, Tribal Entities
Start/End: 2017 to 2021
4.1.2.2
Annually, collect and analyze needs assessment data to identify and implement strategies
to improve patient centered care provided to Ryan White clients.
Metric: Data collected and analyzed; strategies developed and implemented
Lead Program: Ryan White Part A Planning Council
Partners:
Ryan White Part A Program/Part A Continuous Quality Management Committee, HIV
Statewide Advisory Group, Ryan White Programs, HIV Prevention Program
Start/End: 2017 to 2021
4.1.2.3
Annually, utilize consumer feedback to inform Ryan White Program quality improvement
projects.
Metric: Consumer feedback activities completed, projects implemented based on analysis
Lead Program: Part A Continuous Quality Management Committee
Partners: Part A Planning Council, Ryan White Part A Program
Start/End: 2017 to 2021
CENTRAL ARIZONA 137
GOAL 4: ACHIEVE A MORE COORDINATED RESPONSE TO THE HIV EPIDEMIC.
Objective 1:
Reduce disparities in the rate of new diagnosis by at least 15% in the
following groups: gay and bisexual men, young Black gay and bisexual men,
and Black females.
Strategy 3: Stigma Reduction
4.1.3.1
Establish partnerships with community stakeholders and entities that serve target
populations to develop and implement strategies to address multiple types of stigma
(individual, family, friends, providers, culture, etc.).
Metric: Partnerships Established
Lead Program: HIV Prevention Program
Partners:
Ryan White Programs, Part A Planning Council, HIV Statewide Advisory Group, State/
County Entities, Community-Based Organizations
Start/End: 2018 to 2021
4.1.3.2
Annually, implement at least one stigma reduction initiative each year, utilizing new and
traditional media. Assess success and adjust strategies based on data.
Metric: At least one stigma reduction initiative implemented each year
Lead Program: HIV Prevention Program
Partners:
Ryan White Programs, Part A Planning Council, HIV Statewide Advisory Group, State/
County Entities, Community-Based Organizations
Start/End: 2018 to 2021
138 CENTRAL ARIZONA
GOAL 4: ACHIEVE A MORE COORDINATED RESPONSE TO THE HIV EPIDEMIC.
Objective 2:
Reduce the percentage of persons in HIV medical care who are homeless to
no more than 5%.
Strategy 1: Funding
4.2.2.1
Assess opportunities to use rebate funds for housing services, and implement any
strategies that are identified.
Metric: Opportunities assessed, and strategies implemented
Lead Program: Ryan White Part B Program
Partners: Ryan White Programs, HOPWA, Community-Based Organizations
Start/End: 2017 to 2018
4.2.2.2
Identify opportunities to combine programmatic resources to create efficiencies in
contracting, improve service integration, and reduce duplication of effort and/or
competition for funding.
Metric: Successful identification and implementation of new opportunities for efficiency
Lead Program: Ryan White Part B Program
Partners: All other Ryan White Programs, HIV Prevention Program
Start/End: 2018
SOUTHERN ARIZONA 139
Southern Region Plan
140 SOUTHERN ARIZONA
The Southern Region
Target Populations
 Men who have Sex with Men (MSM), especially youth and MSM of Color
 Hispanics, regardless of gender
 African Americans/Blacks regardless of gender
 Injection Drug Users
Activity Highlights
 Implementation of Pre-Exposure Prophylaxis (PrEP) Engagement
Assistance programming, and efforts to increase consumer use of PrEP
 Increased HIV testing, and diversification of HIV testing locations,
including opt-out HIV testing in hospital settings
 Engagement of community stakeholders and policy makers in advocacy
for expanded HIV education, increased local HIV funding, and other HIV-
centric issues
 Strengthening partnerships with providers, correctional facilities, and
community-based organizations to expand availability and accessibility
of quality housing for people living with HIV
 Consumer and provider training related to stigma reduction, cultural
competency, and client empowerment
 Social marketing initiatives to increase HIV testing and awareness, PrEP
engagement, and engagement in care
The Southern Region includes Yuma, Pima, Santa Cruz, Cochise, Graham,
Greenlee, and La Paz counties. The 2014 population for this Region was
1,449,440. Pima County has the state’s second highest prevalence (16%)
and is home to Tucson, the state’s second largest city. Four counties (Yuma,
Pima, Santa Cruz, and Cochise) border Mexico. Hispanics account for a large
percentage of the population of Southern Region counties, with the largest
concentration being in counties along the international border. The Tohono
O’odham Nation is the largest tribal area in Southern Arizona. Major HIV
prevention issues in the Southern Region include rural health care delivery
concerns and disparities, transportation, stigma, limited service delivery
areas by county and other health departments or providers due to
population density, access to resources, and border issues.
The HIV Prevention and Ryan White Part B and C Programs provide HIV
prevention and care services in the Southern Region.
CONTINUUM OF CARE DEFINITIONS
HIV-Diagnosed: Prevalent cases that
have been diagnosed
Linked to HIV Care: Prevalent cases
with a documented lab test, doctor
visit or medication use in the calendar
year
Incidence Linked to HIV Care:
Incident cases for the year of the
spectrum that were linked with a
documented lab test, doctor visit or
medication use within 90 days of their
diagnosis, but not on the same day of
the diagnosis.
If a person has their first CD4, viral
load or genotype on the same day as
their diagnostic test the date of
second CD4, viral load or genotype
will be used as the linkage
Retained in HIV Care: Prevalent cases
with a documented lab test,
doctor visit or antiretroviral (ARV) use
in the first and second six months of
the year
On ARV Therapy: Prevalent cases
with documented ARV use or whose
last viral load of the calendar year
was undetectable
Adherent/Suppressed: Prevalent
cases whose last viral load of the
calendar year was undetectable (<200
C/mL)
SOUTHERN ARIZONA 141
2556
1350
1622
1341 1416
74
of
96
FIGURE 21
2014 Pima County
HIV Continuum of Care
FIGURE 22
2014 Remaining
Southern Region
HIV Continuum of Care
594
240
306
240 254
12
of
16
142 SOUTHERN ARIZONA
The 2015 Arizona Department of Health Services Epidemiology Report
shows the Southern Region had 22% of the state population, 19% of the
new HIV cases, and 19% of the ongoing HIV cases. Census data from 2015
shows that Southern Arizona has a higher than average percentage of
Hispanics or Latinos in Santa Cruz County (83%), Greenlee County (46%)
and Cochise County (35%). In 2014, the new cases dropped to 115 (19 case
reduction from previous year), while prevalence increased by 142,
indicating that at least 27 HIV positive people who were not diagnosed in
Southern Arizona moved to the region.
FIGURE 23
2014 Pima County
HIV Continuum of Care
by Race/Ethnicity
SOUTHERN ARIZONA 143
FIGURE 24
2014 Remaining
Southern Region
HIV Continuum of Care
by Race/Ethnicity
TABLE 24
Comparison of
Pima County and
All Southern Region
Incidence and Prevalence
by Year, 2005 to 2014
Pima County Breakout
All Southern Region
(including Pima County)
Year Prevalence Incidence Year Prevalence Incidence
2005 562 44 2005 2226 163
2006 606 27 2006 2428 157
2007 652 42 2007 2558 156
2008 706 39 2008 2681 125
2009 740 40 2009 2758 142
2010 747 45 2010 2785 149
2011 795 36 2011 2879 120
2012 896 33 2012 2964 95
2013 939 61 2013 3075 134
2014 1003 39 2014 3217 115
144 SOUTHERN ARIZONA
FIGURE 26
2014 Remaining
Southern Region
HIV Continuum of Care
by Gender
FIGURE 25
2014 Pima County
HIV Continuum of Care
by Gender
SOUTHERN ARIZONA 145
FIGURE 27
2014 Pima County
HIV Continuum of Care
by Risk Category
FIGURE 28
2014 Remaining Southern
HIV Continuum of Care
by Risk Category
KEY
MSM: Men who have Sex with Men
IDU: Injection Drug User
HRH: High-Risk Heterosexual
NRR: No Reported Risk
KEY
MSM: Men who have Sex with Men
IDU: Injection Drug User
HRH: High-Risk Heterosexual
NRR: No Reported Risk
146 SOUTHERN ARIZONA
TABLE 25
Pima County Breakout
Incidence 2009 to 2013
Emergent HIV Emergent AIDS Emergent HIV & AIDS
Cases
% State
Total
Rate Per
100,000
Cases
% State
Total
Rate Per
100,000
Cases
% State
Total
Rate Per
100,000
By Gender
Male 216 50.9 8.83 140 33.0 5.72 356 84.0 14.55
Female 50 11.8 1.98 18 4.2 0.71 68 16.0 2.69
TOTAL 266 62.7 5.34 158 37.3 3.17 424 100.0 8.52
By Age
Under 2 1 0.2 0.81 0 0.0 0.00 1 0.2 0.81
2 to 12 1 0.2 0.14 0 0.0 0.00 1 0.2 0.14
13 to 19 18 4.2 3.87 3 0.7 0.65 21 5.0 4.52
20 to 24 30 7.1 7.66 9 2.1 2.30 39 9.2 9.96
25 to 29 46 10.8 13.59 14 3.3 4.14 60 14.2 17.72
30 to 34 29 6.8 9.15 14 3.3 4.42 43 10.1 13.57
35 to 39 32 7.5 11.00 30 7.1 10.31 62 14.6 21.30
40 to 44 19 4.5 6.52 28 6.6 9.60 47 11.1 16.12
45 to 49 33 7.8 10.55 30 7.1 9.59 63 14.9 20.14
50 to 54 28 6.6 8.37 13 3.1 3.89 41 9.7 12.26
55 to 59 13 3.1 4.01 11 2.6 3.39 24 5.7 7.40
60 to 64 8 1.9 2.67 2 0.5 0.67 10 2.4 3.34
65 and Above 8 1.9 1.00 4 0.9 0.50 12 2.8 1.51
Age Unknown 0 0.0 NA 0 0.0 NA 0 0.0 NA
TOTAL 266 62.7 5.34 158 37.3 3.17 424 100.0 8.52
By Race/Ethnicity
White Non-Hispanic 120 28.3 4.32 63 14.9 2.27 183 43.2 6.59
Black Non-Hispanic 37 8.7 19.98 18 4.2 9.72 55 13.0 29.70
Hispanic 94 22.2 5.41 63 14.9 3.63 157 37.0 9.04
*A/PI/H Non-Hispanic 3 0.7 2.04 6 1.4 4.08 9 2.1 6.11
**AI/AN Non-Hispanic 7 1.7 5.36 7 1.7 5.36 14 3.3 10.71
***MR/O Non-Hispanic 5 1.2 NA 1 0.2 NA 6 1.4 NA
TOTAL 266 62.7 5.34 158 37.3 3.17 424 100.0 8.52
By Mode of Transmission
+
MSM 152 35.8 NA 78 18.4 NA 230 54.2 NA
++
IDU 18 4.2 NA 9 2.1 NA 27 6.4 NA
MSM / IDU 7 1.7 NA 3 0.7 NA 10 2.4 NA
Heterosexual 47 11.1 NA 43 10.1 NA 90 21.2 NA
+++
O/H/TF/TPR 3 0.7 NA 0 0.0 NA 3 0.7 NA
++++
NRR/UR 39 9.2 NA 25 5.9 NA 64 15.1 NA
TOTAL 266 62.7 5.34 158 37.3 3.17 424 100.0 8.52
* Asian Pacific/Islander/Hawaiian + Men having Sex with Men ++++ No Reported Risk/Unknown Risk
** American Indian/Alaskan Native ++ Injection Drug Use
*** Multiple Race/Other Race +++ Other/Hemophilia/Transfusion and Blood Products/Transplant Recipient
SOUTHERN ARIZONA 147
TABLE 26
Pima County Breakout
Prevalence 2014
Prevalent HIV Prevalent AIDS Prevalent HIV & AIDS
Cases
% State
Total
Rate Per
100,000
Cases
% State
Total
Rate Per
100,000
Cases
% State
Total
Rate Per
100,000
By Gender
Male 1008 38.6 205.43 1219 46.7 248.43 2227 85.3 453.86
Female 191 7.3 37.76 193 7.4 38.15 384 14.7 75.91
TOTAL 1199 45.9 120.31 1412 54.1 141.69 2611 100.0 262.00
By Age
Under 2 0 0.0 0.00 0 0.0 0.00 0 0.0 0.00
2 to 12 9 0.3 6.69 3 0.1 2.23 12 0.5 8.92
13 to 19 13 0.5 13.85 0 0.0 0.00 13 0.5 13.85
20 to 24 46 1.8 51.76 9 0.3 10.13 55 2.1 61.89
25 to 29 63 2.4 105.05 30 1.1 50.03 93 3.6 155.08
30 to 34 84 3.2 133.15 52 2.0 82.43 136 5.2 215.58
35 to 39 96 3.7 170.18 83 3.2 147.13 179 6.9 317.31
40 to 44 131 5.0 227.13 164 6.3 284.35 295 11.3 511.48
45 to 49 160 6.1 278.92 245 9.4 427.09 405 15.5 706.01
50 to 54 228 8.7 354.10 331 12.7 514.06 559 21.4 868.16
55 to 59 156 6.0 240.36 230 8.8 354.38 386 14.8 594.74
60 to 64 103 3.9 168.89 157 6.0 257.43 260 10.0 426.32
65 and Above 105 4.0 61.36 108 4.1 63.11 213 8.2 124.47
Age Unknown 5 0.2 NA 0 0.0 NA 5 0.2 NA
TOTAL 1199 45.9 120.31 1412 54.1 141.69 2611 100.0 262.00
By Race/Ethnicity
White Non-Hispanic 657 25.2 120.31 790 30.3 144.66 1447 55.4 264.97
Black Non-Hispanic 137 5.2 365.58 151 5.8 402.94 288 11.0 768.51
Hispanic 340 13.0 95.58 401 15.4 112.72 741 28.4 208.30
*A/PI/H Non-Hispanic 14 0.5 45.04 23 0.9 74.00 37 1.4 119.04
**AI/AN Non-Hispanic 25 1.0 95.56 28 1.1 107.03 53 2.0 202.59
***MR/O Non-Hispanic 26 1.0 NA 19 0.7 NA 45 1.7 NA
TOTAL 1199 45.9 120.31 1412 54.1 141.69 2611 100.0 262.00
By Mode of Transmission
+
MSM 690 26.4 NA 870 33.3 NA 1560 59.7 NA
++
IDU 137 5.2 NA 156 6.0 NA 293 11.2 NA
MSM / IDU 78 3.0 NA 126 4.8 NA 204 7.8 NA
Heterosexual 150 5.7 NA 165 6.3 NA 315 12.1 NA
+++
O/H/TF/TPR 26 1.0 NA 26 1.0 NA 52 2.0 NA
++++
NRR/UR 118 4.5 NA 69 2.6 NA 187 7.2 NA
TOTAL 1199 45.9 120.31 1412 54.1 141.69 2611 100.0 262.00
* Asian Pacific/Islander/Hawaiian + Men having Sex with Men ++++ No Reported Risk/Unknown Risk
** American Indian/Alaskan Native ++ Injection Drug Use
*** Multiple Race/Other Race +++ Other/Hemophilia/Transfusion and Blood Products/Transplant Recipient
148 SOUTHERN ARIZONA
TABLE 27
All Southern Arizona
Regional Incidence
(including Pima County)
2009 to 2013
Emergent HIV Emergent AIDS Emergent HIV & AIDS
Cases
% State
Total
Rate Per
100,000
Cases
% State
Total
Rate Per
100,000
Cases
% State
Total
Rate Per
100,000
By Gender
Male 278 51.3 7.79 179 33.0 5.02 457 84.3 12.81
Female 63 11.6 1.74 22 4.1 0.61 85 15.7 2.34
TOTAL 341 62.9 4.74 201 37.1 2.79 542 100.0 7.53
By Age
Under 2 1 0.2 0.53 0 0.0 0.00 1 0.2 0.53
2 to 12 1 0.2 0.10 0 0.0 0.00 1 0.2 0.10
13 to 19 18 3.3 2.58 4 0.7 0.57 22 4.1 3.15
20 to 24 39 7.2 7.07 10 1.8 1.81 49 9.0 8.88
25 to 29 65 12.0 13.61 21 3.9 4.40 86 15.9 18.01
30 to 34 43 7.9 9.71 18 3.3 4.06 61 11.3 13.77
35 to 39 37 6.8 8.98 37 6.8 8.98 74 13.7 17.96
40 to 44 25 4.6 6.00 32 5.9 7.68 57 10.5 13.68
45 to 49 41 7.6 9.23 34 6.3 7.66 75 13.8 16.89
50 to 54 38 7.0 8.09 19 3.5 4.05 57 10.5 12.14
55 to 59 15 2.8 3.31 14 2.6 3.09 29 5.4 6.41
60 to 64 9 1.7 2.15 4 0.7 0.95 13 2.4 3.10
65 and Above 9 1.7 0.77 8 1.5 0.68 17 3.1 1.45
Age Unknown 0 0.0 NA 0 0.0 NA 0 0.0 NA
TOTAL 341 62.9 4.74 201 37.1 2.79 542 100.0 7.53
By Race/Ethnicity
White Non-Hispanic 149 27.5 3.98 74 13.7 1.98 223 41.1 5.96
Black Non-Hispanic 46 8.5 18.92 20 3.7 8.23 66 12.2 27.14
Hispanic 127 23.4 4.47 90 16.6 3.17 217 40.0 7.64
*A/PI/H Non-Hispanic 4 0.7 2.22 7 1.3 3.89 11 2.0 6.11
**AI/AN Non-Hispanic 10 1.8 5.35 9 1.7 4.81 19 3.5 10.16
***MR/O Non-Hispanic 5 0.9 NA 1 0.2 NA 6 1.1 NA
TOTAL 341 62.9 4.74 201 37.1 2.79 542 100.0 7.53
By Mode of Transmission
+
MSM 190 35.1 NA 96 17.7 NA 286 52.8 NA
++
IDU 30 5.5 NA 16 3.0 NA 46 8.5 NA
MSM / IDU 12 2.2 NA 7 1.3 NA 19 3.5 NA
Heterosexual 54 10.0 NA 52 9.6 NA 106 19.6 NA
+++
O/H/TF/TPR 3 0.6 NA 0 0.0 NA 3 0.6 NA
++++
NRR/UR 52 9.6 NA 30 5.5 NA 82 15.1 NA
TOTAL 341 62.9 4.74 201 37.1 2.79 542 100.0 7.53
* Asian Pacific/Islander/Hawaiian + Men having Sex with Men ++++ No Reported Risk/Unknown Risk
** American Indian/Alaskan Native ++ Injection Drug Use
*** Multiple Race/Other Race +++ Other/Hemophilia/Transfusion and Blood Products/Transplant Recipient
SOUTHERN ARIZONA 149
TABLE 28
All Southern Arizona
Regional Prevalence
(including Pima County)
2014
Prevalent HIV Prevalent AIDS Prevalent HIV & AIDS
Cases
% State
Total
Rate Per
100,000
Cases
% State
Total
Rate Per
100,000
Cases
% State
Total
Rate Per
100,000
By Gender
Male 1236 38.4 172.30 1497 46.5 208.69 2733 85.0 380.99
Female 248 7.7 34.28 236 7.3 32.62 484 15.0 66.90
TOTAL 1484 46.1 102.99 1733 53.9 120.28 3217 100.0 223.27
By Age
Under 2 0 0.0 0.00 0 0.0 0.00 0 0.0 0.00
2 to 12 12 0.4 5.89 3 0.1 1.47 15 0.5 7.37
13 to 19 15 0.5 10.81 1 0.0 0.72 16 0.5 11.53
20 to 24 50 1.6 40.79 12 0.4 9.79 62 1.9 50.58
25 to 29 88 2.7 99.15 37 1.2 41.69 125 3.9 140.84
30 to 34 113 3.5 125.23 63 2.0 69.82 176 5.5 195.05
35 to 39 131 4.1 163.05 114 3.5 141.89 245 7.6 304.94
40 to 44 156 4.8 190.33 200 6.2 244.02 356 11.1 434.35
45 to 49 208 6.5 252.49 294 9.1 356.89 502 15.6 609.39
50 to 54 271 8.4 298.63 387 12.0 426.46 658 20.5 725.09
55 to 59 183 5.7 201.02 284 8.8 311.97 467 14.5 512.99
60 to 64 117 3.6 137.88 198 6.2 233.34 315 9.8 371.22
65 and Above 134 4.2 53.66 140 4.4 56.06 274 8.5 109.72
Age Unknown 6 0.2 N/A 0 0.0 N/A 6 0.2 N/A
TOTAL 1484 46.1 102.99 1733 53.9 120.28 3217 100.0 223.27
By Race/Ethnicity
White Non-Hispanic 785 24.4 106.94 949 29.5 129.28 1734 53.9 236.22
Black Non-Hispanic 174 5.4 354.84 175 5.4 356.88 349 10.8 711.72
Hispanic 445 13.8 76.41 529 16.4 90.83 974 30.3 167.23
*A/PI/H Non-Hispanic 16 0.5 42.20 23 0.7 60.66 39 1.2 102.86
**AI/AN Non-Hispanic 32 1.0 85.53 35 1.1 93.55 67 2.1 179.09
***MR/O Non-Hispanic 32 1.0 N/A 22 0.7 N/A 54 1.7 N/A
TOTAL 1484 46.1 102.99 1733 53.9 120.28 3217 100.0 223.27
By Mode of Transmission
+
MSM 827 25.7 N/A 1040 32.3 N/A 1867 58.0 N/A
++
IDU 168 5.2 N/A 204 6.3 N/A 372 11.6 N/A
MSM / IDU 99 3.1 N/A 168 5.2 N/A 267 8.3 N/A
Heterosexual 194 6.0 N/A 205 6.4 N/A 399 12.4 N/A
+++
O/H/TF/TPR 31 1.0 N/A 32 1.0 N/A 63 2.0 N/A
++++
NRR/UR 165 5.1 N/A 84 2.6 N/A 249 7.7 N/A
TOTAL 1484 46.1 102.99 1733 53.9 120.28 3217 100.0 223.27
* Asian Pacific/Islander/Hawaiian + Men having Sex with Men ++++ No Reported Risk/Unknown Risk
** American Indian/Alaskan Native ++ Injection Drug Use
*** Multiple Race/Other Race +++ Other/Hemophilia/Transfusion and Blood Products/Transplant Recipient
150 SOUTHERN ARIZONA
GOAL 1: REDUCE NEW HIV INFECTIONS.
Objective 1:
Increase the percentage of people living with HIV who know their
serostatus to at least 90%.
Strategy 1: Prevention, Testing & Linkage to Care
1.1.1.1
Create renewed interest in HIV by implementing at least two targeted strategies (social
marketing, town halls, etc.) designed to educate the community, foster conversation, and
engage people to get tested for HIV and/or engage in medical care.
Metric:
The number of strategies implemented each year; the number of new HIV tests each year
and/or the number of people engaged to enter medical care
Lead Program: HIV Prevention Program
Partners: State/County Entities, Tribal Entities, Community-based Organizations
Start/End: 2017 to 2021
1.1.1.2
Conduct new, innovative initiatives to improve accessibility to free HIV testing, focusing on
getting never-tested people tested. Initiatives might include home test kit delivery, routine
HIV testing in medical centers, etc.
Metric: The number of initiatives implemented each year; the number of new HIV tests each year
Lead Program: HIV Prevention Program
Partners:
All Ryan White Programs, Arizona AIDS Education and Training Center, State/County
Entities, Tribal Entities, Community-Based Organizations
Start/End: 2018 to 2021
1.1.1.3
Conduct a one-year pilot of PrEP Evaluation Assistance at Pima County Health Department.
PrEP Evaluation Assistance is designed to educate and engage high-risk HIV negative
people in the use of Pre-Exposure Prophylaxis .
Metric: Pilot Program initiated; utilization and engagement in PrEP monitored and evaluated.
Lead Program: Pima County Health Department
Partners: HIV Prevention Program
Start/End: 2017 to 2018
SOUTHERN ARIZONA 151
Strategy 1: Prevention, Testing & Linkage to Care continued
1.1.1.4
Assess the Pima County Health Department PrEP Evaluation Assistance pilot program.
Based on performance, expand service delivery to additional entities.
Metric: Based on pilot program performance, expand PrEP Evaluation Assistance services.
Lead Program: HIV Prevention Program
Partners: State/County Entities, Tribal Entities, Community-Based Organizations
Start/End: 2018 to 2021
1.1.1.5
Annually, develop and implement at least one PrEP-focused social marketing initiative
focused on target populations, designed to engage individuals to become educated and
engaged in PrEP.
Metric: The implementation of at least one social marketing initiative each year
Lead Program: HIV Prevention Program
Partners:
Ryan White Programs, HIV Prevention Program, State/County Entities, Tribal Entities,
Community-Based Organizations
Start/End: 2017 to 2021
152 SOUTHERN ARIZONA
GOAL 1: REDUCE NEW HIV INFECTIONS.
Objective 1:
Increase the percentage of people living with HIV who know their
serostatus to at least 90%.
Strategy 2: Education
1.1.2.1
Annually, provide at least one fact-based, culturally and linguistically appropriate HIV
education opportunity to youth aged 13 to 19, and/or organizations serving youth.
Metric: The presentation of one education opportunity each year; the number of youth participants
Lead Program: HIV Prevention Program
Partners: Community-Based Organizations, Youth Organizations, School Boards
Start/End: 2019 to 2021
1.1.2.2
Annually, educate policy makers on the need to expand HIV/STD/pregnancy prevention
education to youth.
Metric:
Thee presentation of HIV/STD/pregnancy prevention information to policy makers each
year; number of policy makers educated
Lead Program: HIV Statewide Advisory Group
Partners:
Political Action Entities, State/County Entities, Tribal Entities, Community-Based
Organizations
Start/End: 2019 to 2021
1.1.2.3
Identify local partners to advocate for increased support for HIV prevention initiatives,
including syringe access.
Metric: The number of partners identified
Lead Program: HIV Statewide Advisory Group
Partners: State/County Entities, Tribal Entities, Community-Based Organizations
Start/End: 2018 to 2019
SOUTHERN ARIZONA 153
Strategy 2: Education continued
1.1.2.4
Biannually, present on HIV-related topics (HIV testing update, PrEP& PEP, initiating ARV
therapy, continuity of care for patients returning to Mexico) to the Yuma Family Medicine
Residency program.
Metric: One presentation completed every two years
Lead Program: Arizona AIDS Education and Training Center
Partners: Yuma Family Medicine Residency Program
Start/End: 2018 to 2020
1.1.2.5
Yearly, provide at least one education presentation to promotoras programs on HIV,
including general HIV knowledge, HIV testing, PrEP, stigma reduction, and connecting
patients to HIV care in Mexico.
Metric: At least one education presentation provided each year
Lead Program: Arizona AIDS Education and Training Center
Partners:
Promotoras Programs, State/County Entities, Tribal Entities, Border Health Programs,
Community-Based Organizations
Start/End: 2017 to 2021
1.1.2.6 Yearly, provide at least one education presentation on HIV and opioids.
Metric: At least one education presentation completed each year
Lead Program: Arizona AIDS Education and Training Center
Partners: State/County Entities, Tribal Entities, Community-Based Organizations
Start/End: 2017 to 2018
154 SOUTHERN ARIZONA
GOAL 1: REDUCE NEW HIV INFECTIONS.
Objective 1:
Increase the percentage of people living with HIV who know their
serostatus to at least 90%.
Strategy 3: Stigma Reduction
1.1.3.1
Conduct an assessment of the HIV knowledge, stigma, behaviors, education and service
needs of local target populations most at-risk for contracting HIV, and people who are
living with HIV.
Metric: Completion of the assessment
Lead Program: HIV Statewide Advisory Group
Partners:
HIV Prevention Program, Ryan White Programs, Arizona AIDS Education and Training
Center, State/County Entities, Tribal Entities, Community-Based Organizations
Start/End: 2017 to 2018
1.1.3.2
Annually, implement at least two social marketing initiatives that address issues identified
in the assessment, using local input to guide the implementation (campaign development,
populations to target, methodologies, etc.).
Metric: At least two social marketing initiatives are implemented each year
Lead Program: HIV Prevention Program
Partners:
Ryan White Programs, Arizona AIDS Education and Training Center, State/County Entities,
Tribal Entities, Community-Based Organizations, Community Stakeholders
Start/End: 2018 to 2021
1.1.3.3
Annually, implement at least one initiative (training, social marketing, provider update,
etc.) that addresses internal/external HIV stigma reduction, including stigma among
heterosexual people living with HIV.
Metric: At least one initiative implemented each year
Lead Program: Ryan White Part B Program
Partners:
Ryan White Programs, Arizona AIDS Education and Training Center, State/County Entities,
Tribal Entities, Community-Based Organizations, Community Stakeholders
Start/End: 2019 to 2021
SOUTHERN ARIZONA 155
Strategy 3: Stigma Reduction continued
1.1.3.4
Assess systematic and provider behaviors related to HIV stigma when accessing/providing
services, and develop a strategy to address identified issues.
Metric: Assessment completed; strategy developed
Lead Program: Ryan White Part B Program
Partners:
Ryan White Programs, Arizona AIDS Education and Training Center, State/County Entities,
Tribal Entities, Community-Based Organizations, Community Stakeholders
Start/End: 2018
156 SOUTHERN ARIZONA
GOAL 1: REDUCE NEW HIV INFECTIONS.
Objective 2:
Increase the percentage of persons with diagnosed HIV infection who are
virally suppressed to at least 80%.
Strategy 1: Patient-Centered Care
1.2.1.1
Develop and implement activities designed to provide newly diagnosed and returning-to-
care clients with easy, rapid access to medication therapy, to eliminate delays to starting
anti-retroviral therapy (ART) while waiting for program enrollment.
Metric:
Activities developed and implemented; decrease in the average number of days it takes
newly diagnosed clients to enter medical care
Lead Program: Ryan White Part B Program
Partners:
Ryan White Programs, Arizona AIDS Education and Training Center, Community-Based
Organizations, Local Health Providers/Pharmacists
Start/End: 2019 to 2021
1.2.1.2
Create and distribute guidelines to define and standardize HIV referral processes, focusing
people living with HIV who are recently released from jail, identified in hospital emergency
departments, and by primary care providers.
Metric:
Guidelines developed and distributed; the number of entities/sites that receive the
guidelines
Lead Program: Ryan White Part B Program
Partners:
Ryan White Programs, Arizona AIDS Education and Training Center, Correctional
Programs, Community-Based Organizations, Local Hospitals and Health Providers
Start/End: 2018 to 2019
SOUTHERN ARIZONA 157
GOAL 1: REDUCE NEW HIV INFECTIONS.
Objective 2:
Increase the percentage of persons with diagnosed HIV infection who are
virally suppressed to at least 80%.
Strategy 2: Streamline Processes
1.2.2.1 Establish a statewide 24-hour telephone hotline for HIV information and referrals.
Metric: The hotline is established; the number of calls the hotline receives each year
Lead Program: HIV Prevention Program
Partners:
Ryan White Programs, State/County Entities, Tribal Entities, Community-Based
Organizations
Start/End: 2018 to 2021
1.2.2.2
Reduce paperwork among community providers by establishing a universal enrollment
and data-sharing process for non-Ryan White services.
Metric: Completion of the universal enrollment process
Lead Program: Ryan White Part B Program
Partners: Community-Based Organizations
Start/End: 2018 to 2019
1.2.2.3
Establish a common enrollment application for Ryan White programs, including an online
enrollment portal.
Metric: Completion of the common enrollment, online portal, and policies and procedures
Lead Program: Ryan White Part B Program
Partners: Ryan White Programs
Start/End: 2017 to 2018
158 SOUTHERN ARIZONA
GOAL 1: REDUCE NEW HIV INFECTIONS.
Objective 2:
Increase the percentage of persons with diagnosed HIV infection who are
virally suppressed to at least 80%.
Strategy 3: Incentives for Care
1.2.3.1
Develop and implement an incentive program for new patients who achieve viral
suppression within a specific timeframe, and continue adherence for one year. Possible
activities include expanding Club 95 (95% treatment adherence, treated to a nice dinner)
and Club MedBox (create weekly med box, get free lunch), as well as other methodologies.
Metric:
The incentive program developed and implemented; the number of clients who received
and incentive
Lead Program: Ryan White Part B Program
Partners: Case Management Providers, State/County Entities, Community-Based Organizations
Start/End: 2018 to 2019
1.2.3.2
Develop and implement incentive programs for HIV testing that appeals to target
populations most at risk for acquiring HIV.
Metric:
The incentive program developed and implemented; the number of clients receiving an
incentive
Lead Program: HIV Prevention Program
Partners:
Ryan White Programs, State/County Entities, Community-Based Organizations, Community
Stakeholders
Start/End: 2018 to 2021
SOUTHERN ARIZONA 159
GOAL 1: REDUCE NEW HIV INFECTIONS.
Objective 2:
Increase the percentage of persons with diagnosed HIV infection who are
virally suppressed to at least 80%.
Strategy 4: Stigma Reduction
1.2.4.1
Annually, implement at least one strategy to increase retention in care and normalize care
for people living with HIV.
Metric: At least one strategy is implemented each year
Lead Program: Ryan White Part B Program
Partners:
Arizona AIDS Education and Training Center, HIV Prevention Program, State/County
Entities, Tribal Entities, Community-Based Organizations
Start/End: 2017 to 2019
1.2.4.2
Annually, provide at least one training for medical providers focused on eliminating
systemic and individual behaviors that cause stigma against HIV clients when they access
services.
Metric: At least one training is provided each year
Lead Program: Ryan White Part B Program
Partners:
Arizona AIDS Education and Training Center, HIV Prevention Program, State/County
Entities, Tribal Entities, Community-Based Organizations, Medical Provider Organizations
Start/End: 2017 to 2021
160 SOUTHERN ARIZONA
GOAL 2:
INCREASE ACCESS TO CARE AND IMPROVE HEALTH OUTCOMES
FOR PEOPLE LIVING WITH HIV.
Objective 1:
Increase the percentage of newly diagnosed persons linked to HIV medical
care within one month of their HIV diagnosis to at least 85%.
Strategy 1: Patient-Centered Care
2.1.1.1
Identify informal opportunities to expand peer-driven navigation and support for
engagement in care/retention in care that are not agency-driven, such as an syringe
exchange model used in Phoenix, the Tucson Interfaith HIV/AIDS Network volunteer
model, and/or other models.
Metric: Service models and peer participants are identified; models are implemented
Lead Program: Ryan White Part B Program
Partners:
Arizona AIDS Education and Training Center, HIV Prevention Program, State/County
Entities, Tribal Entities, Community-Based Organizations
Start/End: 2018 to 2019
2.1.1.2
Annually, provide at least one training for point-of-entry providers, that addresses issues
such developing supportive relationships with coworkers and clients, addressing
compassion exhaustion, "freshness", and providing high-quality services.
Metric: At least one training provided each year; the number of providers trained
Lead Program: Arizona AIDS Education and Training Center
Partners:
Ryan White Part B Program, HIV Prevention Program, State/County Entities, Tribal
Entities, Community-Based Organizations, Medical Provider Organizations
Start/End: 2017 to 2021
SOUTHERN ARIZONA 161
GOAL 2:
INCREASE ACCESS TO CARE AND IMPROVE HEALTH OUTCOMES
FOR PEOPLE LIVING WITH HIV.
Objective 1:
Increase the percentage of newly diagnosed persons linked to HIV medical
care within one month of their HIV diagnosis to at least 85%.
Strategy 2: Community Engagement
2.1.2.1
Develop and implement outreach strategies that improve collaboration and
communication with private medical providers and the Veterans Administration related to
reporting of new HIV diagnoses and lab results for HIV clients.
Metric: Outreach strategies developed and implemented; evaluation of improvements in reporting
Lead Program: HIV Surveillance Program
Partners:
Ryan White Programs, Arizona AIDS Education and Training Center, Private Medical
Providers
Start/End: 2017 to 2021
2.1.2.2
Develop and implement a community-led initiative to establish informal and formal
methodologies to educate private providers regarding HIV reporting and HIV care.
Metric: The development and implementation of the initiative; the number of providers educated
Lead Program: Arizona AIDS Education and Training Center
Partners:
Ryan White Programs, State/County Entities, Tribal Entities, Private Medical Providers,
Community-Based Organizations
Start/End: 2017 to 2019
162 SOUTHERN ARIZONA
GOAL 2:
INCREASE ACCESS TO CARE AND IMPROVE HEALTH OUTCOMES FOR
PEOPLE LIVING WITH HIV.
Objective 1:
Increase the percentage of newly diagnosed persons linked to HIV medical
care within one month of their HIV diagnosis to at least 85%.
Strategy 3: Prevention, Testing and Linkage to Care
2.1.3.1
Annually, provide at least one training opportunity each year, designed to increase
communication between HIV agencies to improve linkage to care/retention in care.
Metric: Presentation of at least one training each year.
Lead Program: HIV Prevention Program
Partners:
Ryan White Programs, Arizona AIDS Education and Training Center, State/County Entities,
Tribal Entities, Community-Based Organizations
Start/End: 2018 to 2021
SOUTHERN ARIZONA 163
GOAL 2:
INCREASE ACCESS TO CARE AND IMPROVE HEALTH OUTCOMES
FOR PEOPLE LIVING WITH HIV.
Objective 2
Increase the percentage of persons with diagnosed HIV infection who are
retained in care to at least 90%.
Strategy 1: Streamline Processes
2.2.1.1
Assess the ability of Pima County Health Department and community providers to increase
availability of Benefits Navigation services, in order to decrease the number of clients who
drop out of care due to difficulties navigating their benefits enrollment/re-enrollment and/
or insurance coverage.
Metric: Completion of the assessment and implementation of Benefits Navigation services
Lead Program: Ryan White Part B Program
Partners: State/County Entities, Community-Based Organizations
Start/End: 2017 to 2018
2.2.1.2
Implement an acuity-focused service delivery model for case management services,
designed to improve care coordination of clients erratically engaged in care, and empower
clients to transition from case-managed care to self-managed care.
Metric: Implementation of the service delivery model
Lead Program: Ryan White Part B Program
Partners: Case Management Providers, Community-Based Organizations, Ryan White Clients
Start/End: 2018 to 2019
2.2.1.3 Identify three-to-four Benefits Navigators to assist with off-season insurance enrollment.
Metric: Navigators identified and contracted
Lead Program: Ryan White Part B Program
Partners: State/County Entities, Existing Benefits Navigators, Community-Based Organizations
Start/End: 2017 to 2019
164 SOUTHERN ARIZONA
GOAL 2:
INCREASE ACCESS TO CARE AND IMPROVE HEALTH OUTCOMES FOR
PEOPLE LIVING WITH HIV.
Objective 2
Increase the percentage of persons with diagnosed HIV infection who are
retained in care to at least 90%.
Strategy 2: Patient-Centered Care
2.2.2.1
Establish workgroups to evaluate service delivery models for mental health, substance use,
and housing/homeless services, and post-incarceration engagement in care services.
Metric: The workgroups are established; an evaluation is completed
Lead Program: HIV Statewide Advisory Group
Partners:
Ryan White Part B Program, State/County Entities, Tribal Entities, Community-Based
Organizations, Community Stakeholders
Start/End: 2018 to 2021
2.2.2.2
Develop and implement strategies to strengthen referral processes for people living with
HIV who are recently-released from jail, identified in emergency departments, etc.
Metric: The strategies are developed and implemented
Lead Program: Ryan White Part B Program
Partners:
State/County Entities, Tribal Entities, Correctional Facilities, Hospitals, Community-Based
Organizations, Community Stakeholders
Start/End: 2018 to 2021
2.2.2.3
Evaluate and implement methods to incentivize people living with HIV who are released
from correctional facilities to become engage in care.
Metric: Methods are evaluated and implemented; the number of clients receiving an incentive
Lead Program: Ryan White Part B Program
Partners:
State/County Entities, Tribal Entities, Correctional Facilities, Community-Based
Organizations, Community Stakeholders
Start/End: 2018 to 2021
SOUTHERN ARIZONA 165
Strategy 2: Patient-Centered Care continued
2.2.2.4
Educate private providers about the availability of Ryan-White funded HIV services, other
HIV services available in the community, and the importance of referring clients to these
services (better health outcomes, engagement in care, etc.).
Metric: The number of providers educated
Lead Program: Ryan White Part B Program
Partners:
Private Medical Provider Networks, County/State Entities, Tribal Entities, Arizona AIDS
Education and Training Center, Correctional Facilities, Community-Based Organizations
Start/End: 2018 to 2020
166 SOUTHERN ARIZONA
GOAL 2:
INCREASE ACCESS TO CARE AND IMPROVE HEALTH OUTCOMES FOR
PEOPLE LIVING WITH HIV.
Objective 2
Increase the percentage of persons with diagnosed HIV infection who are
retained in care to at least 90%.
Strategy 3: Data Standardization
2.2.3.1
Assess the ability to develop and implement a universal database/data sharing process
among HIV partners.
Metric: Completion of the assessment; action items identified
Lead Program: Ryan White Part B Program
Partners:
Ryan White Programs, County/State Entities, Tribal Entities, Arizona AIDS Education and
Training Center, Correctional Facilities, Community-Based Organizations
Start/End: 2017 to 2019
2.2.3.2
Annually, expand the utilization of HIV care, prevention, and PrEP continuum of care
models by at least one non-Ryan White funded medical provider
Metric:
At least one non-Ryan White medical provider engages in the use of continuum of care
models each year
Lead Program: Ryan White Part B Program
Partners: Ryan White Programs, Arizona AIDS Education and Training Center
Start/End: 2018 to 2021
SOUTHERN ARIZONA 167
GOAL 2:
INCREASE ACCESS TO CARE AND IMPROVE HEALTH OUTCOMES
FOR PEOPLE LIVING WITH HIV.
Objective 2
Increase the percentage of persons with diagnosed HIV infection who are
retained in care to at least 90%.
Strategy 4: Education
2.2.4.1
Biannually, provide at least one regional training for primary medical providers that
includes information on HIV, extra-genital STD screening, and retention in care.
Metric: At least one training completed every two years
Lead Program: Arizona AIDS Education and Training Center
Partners:
Ryan White Part B Program, State/County Entities, Tribal Entities, Local Medical Providers,
HIV Prevention Program, Community-Based Organizations
Start/End: 2018 to 2020
2.2.4.2
Increase the number of HIV providers who are trained in the diagnosis, treatment and
management of HIV.
Metric: The number of providers trained each year
Lead Program: Arizona AIDS Education and Training Center
Partners:
Ryan White Part B Program, State/County Entities, Tribal Entities, Local Medical Providers,
HIV Prevention Program, Community-Based Organizations
Start/End: 2017 to 2021
2.2.4.3
Annually, present at least one regional provider training, in collaboration with national
providers.
Metric: The completion of at least one regional provider training each year
Lead Program: Ryan White Part B Program
Partners:
Arizona AIDS Education and Training Center, State/County Entities, Tribal Entities, Local
Medical Providers, HIV Prevention Program, Community-Based Organizations
Start/End: 2017 to 2020
168 SOUTHERN ARIZONA
GOAL 3:
INCREASE ACCESS TO CARE AND IMPROVE HEALTH OUTCOMES FOR
PEOPLE LIVING WITH HIV.
Objective 1:
Reduce the percentage of persons in HIV medical care who are homeless to
no more than 5%.
Strategy 1: Funding
3.1.1.1 Complete an assessment of the housing needs of people living with HIV in Pima County.
Metric: The completion of the assessment; action items identified
Lead Program: HIV Statewide Advisory Group
Partners:
Ryan White Part B Program, State/County Entities, Tribal Entities, Local Medical Providers,
HIV Prevention Program, HOPWA, Housing Providers, Correctional Facilities, Community-
Based Organizations, Community Stakeholders
Start/End: 2017 to 2018
3.1.1.2
Identify resources to address medication storage at safe spaces for people living with HIV
who are homeless.
Metric: Identification of resources; information distributed to community stakeholders
Lead Program: HIV Statewide Advisory Group
Partners:
Ryan White Part B Program, State/County Entities, Tribal Entities, Local Medical Providers,
HIV Prevention Program, HOPWA, Housing Providers, Correctional Facilities, Community-
Based Organizations, Community Stakeholders
Start/End: 2018 to 2019
SOUTHERN ARIZONA 169
GOAL 3:
INCREASE ACCESS TO CARE AND IMPROVE HEALTH OUTCOMES
FOR PEOPLE LIVING WITH HIV.
Objective 1:
Reduce the percentage of persons in HIV medical care who are homeless to
no more than 5%.
Strategy 2: Quality Housing
3.1.2.1
Collaborate with community partners to improve referral mechanisms and partnerships, in
order to increase the ability of people living with HIV to find and obtain quality housing.
Metric: Referral mechanisms and partnerships evaluated; improvement activities completed
Lead Program: Ryan White Part B Program
Partners:
State/County Entities, Tribal Entities, Local Medical Providers, HIV Prevention Program,
HOPWA, Housing Providers, Correctional Facilities, Community-Based Organizations,
Community Stakeholders
Start/End: 2018 to 2019
170 SOUTHERN ARIZONA
GOAL 3:
INCREASE ACCESS TO CARE AND IMPROVE HEALTH OUTCOMES FOR
PEOPLE LIVING WITH HIV.
Objective 1:
Reduce the percentage of persons in HIV medical care who are homeless to
no more than 5%.
Strategy 3: Community Engagement
3.1.3.1 Create a resource list of housing services providers.
Metric: Resource list completed and distributed to community stakeholders
Lead Program: HIV Statewide Advisory Group
Partners:
Primavera Foundation, State/County Entities, Tribal Entities, Local Medical Providers, HIV
Prevention Program, HOPWA, Housing Providers, Correctional Facilities, Community-Based
Organizations, Community Stakeholders
Start/End: 2017 to 2019
3.1.3.2
Identify key partners outside of the HIV community that can support people living with HIV
to enter/engage in housing services, and promote the availability of HIV services to these
entities.
Metric: Identification of partners
Lead Program: HIV Statewide Advisory Group
Partners:
Primavera Foundation, State/County Entities, Tribal Entities, Local Medical Providers,
HIV Prevention Program, HOPWA, Housing Providers, Correctional Facilities, Community-
Based Organizations, Community Stakeholders
Start/End: 2018 to 2019
SOUTHERN ARIZONA 171
GOAL 3:
INCREASE ACCESS TO CARE AND IMPROVE HEALTH OUTCOMES
FOR PEOPLE LIVING WITH HIV.
Objective 2:
Reduce disparities in the rate of new diagnoses by at least 15% in the
following groups: gay and bisexual men, young Black gay and bisexual men,
and Black females.
Strategy 1: Community Engagement
3.2.1.1
Assess, and then establish collaboration and service delivery among health-based and non-
health-based community entities that “goes to the community” rather than expecting target
populations to come to existing services.
Metric: Completion of the assessment; partnerships and service delivery revisions implemented
Lead Program: Ryan White Part B Program
Partners:
HIV Prevention Program, State/County Entities, Tribal Entities, Community-Based
Organizations, African American Health Coalition, NAACP, Black Lives Matter, Clinica
Amistad, Hispanic Chamber of Commerce, UofA Mobile Clinic, Tribes, Tucson Indian Center,
Border Health Network
Start/End: 2017 to 2021
3.2.1.2
Establish collaborations with colleges, fraternities/sororities, faith-based organizations/
coalitions, organizations serving communities of color, etc. to provide education and
awareness of HIV, engagement in HIV testing among target populations, and community
mobilization to address issues that hinder communities of color from addressing HIV
issues.
Metric: The number of collaborations established
Lead Program: HIV Prevention Program
Partners:
Ryan White Part B Program, State/County Entities, Tribal Entities, Community-Based
Organizations, African American Health Coalition, NAACP, Black Lives Matter, Clinica
Amistad, Hispanic Chamber of Commerce, UofA Mobile Clinic, Tribes, Tucson Indian Center,
Border Health Network
Start/End: 2017 to 2019
172 SOUTHERN ARIZONA
Strategy 1: Community Engagement continued
3.2.1.3
Establish HIV Statewide Advisory Group workgroups to address the service needs of target
communities, and health disparities and social justice issues that affect entry to, and
engagement in medical care. Recruit community partners to take participate in planning
efforts and implementation of activities.
Metric: The establishment of workgroups and recruitment of community partners
Lead Program: HIV Statewide Advisory Group
Partners:
Ryan White Part B Program, State/County Entities, Tribal Entities, Community-Based
Organizations, Social Justice Groups, African American Health Coalition, NAACP, Black Lives
Matter, Clinica Amistad, Hispanic Chamber of Commerce, UofA Mobile Clinic, Tribes,
Tucson Indian Center, Border Health Network
Start/End: 2017 to 2021
SOUTHERN ARIZONA 173
GOAL 3:
INCREASE ACCESS TO CARE AND IMPROVE HEALTH OUTCOMES
FOR PEOPLE LIVING WITH HIV.
Objective 2:
Reduce disparities in the rate of new diagnoses by at least 15% in the
following groups: gay and bisexual men, young Black gay and bisexual men,
and Black females.
Strategy 2: Education
3.2.2.1
Develop an Arizona-specific cultural competency training plan, with an expanded focus to
include how intersections between homophobia, misogyny, racism, law enforcement
interaction, and hiring practices impact HIV service delivery.
Metric: The development of the plan
Lead Program: Ryan White Part B Program
Partners:
HIV Prevention Program, State/County Entities, Tribal Entities, Community-Based
Organizations, African American Health Coalition, NAACP, Black Lives Matter, Clinica
Amistad, Hispanic Chamber of Commerce, UofA Mobile Clinic, Tribes, Tucson Indian Center,
Border Health Network
Start/End: 2018 to 2019
3.2.2.2
Annually, conduct at least one cultural-competency training according to the Arizona-
specific plan.
Metric: At least one training conducted each year
Lead Program: Ryan White Part B Program
Partners:
HIV Prevention Program, State/County Entities, Tribal Entities, Community-Based
Organizations, African American Health Coalition, NAACP, Black Lives Matter, Clinica
Amistad, Hispanic Chamber of Commerce, UofA Mobile Clinic, Tribes, Tucson Indian Center,
Border Health Network
Start/End: 2019 to 2021
174 SOUTHERN ARIZONA
GOAL 3:
INCREASE ACCESS TO CARE AND IMPROVE HEALTH
OUTCOMES FOR PEOPLE LIVING WITH HIV.
Objective 2:
Reduce disparities in the rate of new diagnoses by at least 15% in the
following groups: gay and bisexual men, young Black gay and bisexual men,
and Black females.
Strategy 3: Stigma Reduction
3.2.3.1
Annually, implement at least one peer-to-peer activity designed to reduce internal stigma
among people living with HIV, and/or address wrap-around stigma (family members,
friends, social networks, etc.).
Metric: At least one activity conducted each year
Lead Program: Ryan White Part B Program
Partners:
HIV Prevention Program, Arizona AIDS Education and Training Center, State/County
Entities, Tribal Entities, Community-Based Organizations, Community Stakeholders
Start/End: 2018 to 2021
3.2.3.2
Annually, present at least one training for HIV care and prevention providers related to
stigma reduction and trauma-informed care. Ideally, training should coincide with medical
and/or other service delivery training.
Metric: At least one training is presented each year
Lead Program: Ryan White Part B Program
Partners:
HIV Prevention Program, Arizona AIDS Education and Training Center, State/County
Entities, Tribal Entities, Community-Based Organizations, Community Stakeholders
Start/End: 2018 to 2021
SOUTHERN ARIZONA 175
Strategy 3: Stigma Reduction continued
3.2.3.3
Complete an assessment of HIV knowledge, stigma, trauma-informed care, behaviors, and
education needs targeting communities of color and transmission routes.
Metric: The completion of the assessment
Lead Program: HIV Statewide Advisory Group
Partners:
State/County Entities, Tribal Entities, Local Medical Providers, HIV Prevention Program,
Community-Based Organizations, Social Justice Groups
Start/End: 2017 to 2019
3.2.3.4 Establish partner HIV testing as a standard of service delivery for HIV testing providers.
Metric: Partner HIV testing is established and adopted as a service delivery standard
Lead Program: HIV Prevention Program
Partners:
Ryan White Part B Program, State/County Entities, Tribal Entities, Local Medical Providers,
HIV Prevention Program, Community-Based Organizations
Start/End: 2018 to 2021
3.2.3.4
State and local entities collaboratively develop HIV prevention and care messaging that
appropriately addresses target populations.
Metric: Population-specific messaging developed
Lead Program: HIV Prevention Program
Partners:
Ryan White Part B Program, State/County Entities, Tribal Entities, Community-Based
Organizations, Community Stakeholders
Start/End: 2018 to 2021
176 SOUTHERN ARIZONA
GOAL 3:
INCREASE ACCESS TO CARE AND IMPROVE HEALTH OUTCOMES FOR
PEOPLE LIVING WITH HIV.
Objective 3:
Increase the percentage of youth and persons who inject drugs with
diagnosed HIV infection who are virally suppressed to at least 80%.
Strategy 1: Education
3.3.1.1
Identify and evaluate existing and needed resources that can be utilized to improve service
delivery, self-efficacy and engagement in care among youth who inject drugs.
Metric: Resources are identified and evaluated
Lead Program: HIV Prevention Program
Partners:
Ryan White Part B Program, State/County Entities, Tribal Entities, Community-Based
Organizations, Youth Organizations, Substance Use Providers, Case Management Providers
Start/End: 2018 to 2019
3.3.1.2
Develop and implement strategies to improve service delivery, self-efficacy and
engagement in care among youth who inject drugs.
Metric: The strategies are implemented
Lead Program: HIV Statewide Advisory Group
Partners:
HIV Prevention Program, Ryan White Part B Program, State/County Entities, Tribal
Entities, Community-Based Organizations, Youth Organizations, Substance Use Providers,
Case Management Providers
Start/End: 2019 to 2021
SOUTHERN ARIZONA 177
GOAL 3:
INCREASE ACCESS TO CARE AND IMPROVE HEALTH OUTCOMES
FOR PEOPLE LIVING WITH HIV.
Objective 3:
Increase the percentage of youth and persons who inject drugs with
diagnosed HIV infection who are virally suppressed to at least 80%.
Strategy 2: Prevention, Testing & Linkage to Care
3.3.2.1
Biannually, implement at least one outreach initiatives to youth and persons who inject
drugs, designed to engage individuals to be tested for HIV and/or enter medical care.
Metric: The implementation of at least one outreach initiative every two years
Lead Program: HIV Prevention Program
Partners:
Ryan White Part B Program, State/County Entities, Tribal Entities, Community-Based
Organizations, Youth Organizations, Substance Use Providers, Case Management Providers
Start/End: 2018 to 2020
3.3.2.2 Increase HIV testing sites for the youth and persons who inject drugs.
Metric:
An increase in the number of HIV testing sites that provide services for youth and persons
who inject drugs.
Lead Program: HIV Prevention Program
Partners:
Ryan White Part B Program, State/County Entities, Tribal Entities, Community-Based
Organizations, Youth Organizations, Substance Use Providers, Case Management Providers
Start/End: 2017 to 2021
178 SOUTHERN ARIZONA
GOAL 3:
INCREASE ACCESS TO CARE AND IMPROVE HEALTH OUTCOMES FOR
PEOPLE LIVING WITH HIV.
Objective 3:
Increase the percentage of youth and persons who inject drugs with
diagnosed HIV infection who are virally suppressed to at least 80%.
Strategy 3: Community Engagement
3.3.3.1
Establish a formalized processes to engage state, county and tribal entities, local providers
and community stakeholders in ongoing dialog and collaboration to improve HIV services.
Explore digital methods to conduct this activity.
Metric: Establishment of formalized processes
Lead Program: HIV Statewide Advisory Group
Partners:
HIV Prevention Program, Ryan White Part B Program, Arizona AIDS Education and
Training Center, State/County Entities, Tribal Entities, Community-Based Organizations,
Community Stakeholders
Start/End: 2018 to 2021
3.3.3.2 Develop and implement county-specific plans to obtain community engagement.
Metric:
Specific community engagement plans are established for each County in the southern
Region
Lead Program: HIV Prevention Program
Partners:
Ryan White Part B Program, Arizona AIDS Education and Training Center, State/County
Entities, Tribal Entities, Community-Based Organizations, Community Stakeholders
Start/End: 2017 to 2021
SOUTHERN ARIZONA 179
GOAL 4: ACHIEVE A MORE COORDINATED RESPONSE TO THE HIV EPIDEMIC.
Objective 1:
Increase the percentage of newly diagnosed persons linked to HIV medical
care within one month of their HIV diagnosis to at least 85%.
Strategy 1: Funding
4.1.1.1
Assess the availability of diverse funding opportunities, such as non-federal funding for
Community-Based Organizations, and/or third-party reimbursement, for HIV prevention
and care services.
Metric: The completion of the assessment; utilization of information to obtain non-federal funding
Lead Program: HIV Prevention Program
Partners:
Ryan White Part B Program, Arizona AIDS Education and Training Center, State/County
Entities, Tribal Entities, Community-Based Organizations, Community Stakeholders
Start/End: 2018 to 2021
180 SOUTHERN ARIZONA
GOAL 4: ACHIEVE A MORE COORDINATED RESPONSE TO THE HIV EPIDEMIC.
Objective 1:
Increase the percentage of newly diagnosed persons linked to HIV medical
care within one month of their HIV diagnosis to at least 85%.
Strategy 2: Community Engagement
4.1.2.1
Biannually, present at least one training to community stakeholders on how to advocate for
healthcare initiatives.
Metric: The presentation of at least one training every two years
Lead Program: HIV Statewide Advisory Group
Partners:
HIV Prevention Program, Ryan White Part B Program, Arizona AIDS Education and
Training Center, State/County Entities, Tribal Entities, Community-Based Organizations,
Community Stakeholders
Start/End: 2018 to 2020
4.1.2.2
Expand partnerships, especially with non-HIV providers, to increase HIV awareness and
diversify HIV services for people living with HIV and those at high-risk for acquiring HIV.
Metric: Expansion of partnerships, as possible
Lead Program: HIV Prevention Program
Partners:
Ryan White Part B Program, Arizona AIDS Education and Training Center, State/County
Entities, Tribal Entities, Correctional Facilities, Community-Based Organizations,
Community Stakeholders
Start/End: 2017 to 2021
SOUTHERN ARIZONA 181
GOAL 4: ACHIEVE A MORE COORDINATED RESPONSE TO THE HIV EPIDEMIC.
Objective 1:
Increase the percentage of newly diagnosed persons linked to HIV medical
care within one month of their HIV diagnosis to at least 85%.
Strategy 3: Policy Development
4.1.3.1 Promote routine, opt-out testing as a standard of medical care.
Metric: The number of opportunities for promotion that occurred
Lead Program: Arizona AIDS Education and Training Center
Partners:
Arizona Alliance of Community Health Centers, Hospitals, HIV Prevention Program, Ryan
White Part B Program, Community-Based Organizations, Other Medical Organizations
Start/End: 2017 to 2021
4.1.3.2
Establish a community coalition to address HIV-related policy issues and educate policy
makers on HIV issues.
Metric: Establishment of a community coalition
Lead Program: HIV Statewide Advisory Group
Partners:
HIV Prevention Program, Ryan White Part B Program, State/County Entities, Tribal
Entities, Community-Based Organizations, Health Advocacy Groups
Start/End: 2018 to 2021
182 SOUTHERN ARIZONA
Strategy 3: Policy Development continued
4.1.3.3
Annually, collaborate with community partners to present cat least one comprehensive
sexual education program in a school and/or to youth groups.
Metric: The presentation of at least one comprehensive sexual education program each year
Lead Program: HIV Statewide Advisory Group
Partners:
HIV Prevention Program, Ryan White Part B Program, State/County Entities, Tribal
Entities, Education Entities, Community-Based Organizations, Health Advocacy Groups
Start/End: 2018 to 2021
SOUTHERN ARIZONA 183
GOAL 4: ACHIEVE A MORE COORDINATED RESPONSE TO THE HIV EPIDEMIC.
Objective 1:
Increase the percentage of newly diagnosed persons linked to HIV medical
care within one month of their HIV diagnosis to at least 85%.
Strategy 4: Prevention, Testing & Linkage to Care
4.1.4.1
Establish same-day supplemental/confirmatory testing among testing providers, to
decrease the timeframe between initial diagnosis, first labs, and first medical appointment.
Metric: Same-day confirmatory testing is established
Lead Program: HIV Prevention Program
Partners:
HIV Prevention Program, Ryan White Part B Program, State/County Entities, Tribal
Entities, Community-Based Organizations
Start/End: 2017 to 2021
184 SOUTHERN ARIZONA
GOAL 4: ACHIEVE A MORE COORDINATED RESPONSE TO THE HIV EPIDEMIC.
Objective 2:
Increase the percentage of persons with diagnosed HIV infection who are
retained in HIV medical care to at least 90%.
Strategy 1: Patient-Centered Care
4.2.1.1
Provide at least one training each year to healthcare providers, medical associations, and
healthcare students to engage support and commitment for patient-centered care.
Metric: The presentation of at least one training per year; the number of participants
Lead Program: Arizona AIDS Education and Training Center
Partners:
Local Healthcare Providers, Medical Schools, Colleges/Universities, Community-Based
Organizations, Ryan White Part B Program, HIV Prevention Program
Start/End: 2017 to 2021
4.2.1.2
Assess community capacity to expand the availability of alternative, holistic approaches to
HIV care.
Metric: The assessment is completed; action items are defined
Lead Program: Ryan White Part B Program
Partners:
Local Healthcare Providers, Medical Schools, Colleges/Universities, Community-Based
Organizations, HIV Prevention Program
Start/End: 2019 to 2021
SOUTHERN ARIZONA 185
Strategy 1: Patient-Centered Care continued
4.2.1.4 Promote harm-reduction approaches to medical care to community providers.
Metric: Documentation that promotion activities occurred
Lead Program: Ryan White Part B Program
Partners:
Arizona AIDS Education and Training Center, Local Healthcare Providers, Medical Schools,
Colleges/Universities, Community-Based Organizations, HIV Prevention Program
Start/End: 2018 to 2021
4.2.1.5
Complete an assessment of patient-centered barriers to accessing medical care and
supportive services.
Metric: The assessment is completed; action items developed
Lead Program: HIV Statewide Advisory Group
Partners:
HIV Prevention Program, Ryan White Part B Program, County/State Entities, Tribal
Entities, Correctional Entities, Community-Based Organizations
Start/End: 2019 to 2020
186 SOUTHERN ARIZONA
GOAL 4: ACHIEVE A MORE COORDINATED RESPONSE TO THE HIV EPIDEMIC.
Objective 2:
Increase the percentage of persons with diagnosed HIV infection who are
retained in HIV medical care to at least 90%.
Strategy 2: Streamline Processes
4.2.2.1
Evaluate the ability for client enrollment in the Ryan White Program and ADAP to be
completed by HIV testing staff, to allow for data submission and the scheduling of an initial
medical appointment to occur at the time of diagnosis.
Metric: The completion of an evaluation; action steps defined
Lead Program: Ryan White Part B Program
Partners:
HIV Prevention Program, State/County Entities, Tribal Entities, Community-Based
Organizations
Start/End: 2019 to 2021
SOUTHERN ARIZONA 187
Section 3
Monitoring and Evaluation
188
Monitoring and Evaluation
Monitoring the Integrated HIV Prevention and Care Plan will assist
Programs and Planning Bodies with identifying ways to measure progress
toward goals and objectives, selecting strategies for collecting information,
and analyzing information to inform decision-making, ultimately improving
HIV prevention, care, and treatment efforts.
Updating Planning Bodies
The Ryan White Part A Planning Council, the HIV Statewide Advisory
Group, the Ryan White Part C and D Community Advisory Boards, and the
Ryan White and HIV Prevention Program sub-recipients will be updated on
the progress of the implementation of the Plan. Surveillance and
epidemiological data will be presented on a regular basis to the Planning
Bodies, to assist in following trends, and planning activities and initiatives.
The Planning Bodies have dedicated time on their meeting schedules to
review the Plan implementation, and solicit feedback from members and
stakeholders. The Planning Bodies will provide feedback to the Ryan White
and HIV Prevention Program recipients.
Soliciting Feedback
Each year, the HIV Prevention and Ryan White Programs host an annual
HIV Symposium. In addition to general stakeholder attendance, all Program
sub-recipients are required to have representatives attend. During this
meeting, the Programs will provide updates on the Plan’s activities, and
solicit feedback from participants.
The HIV Prevention and Ryan White Programs conduct regular community
advisory board meetings, focus groups, and needs assessments of target
populations. These activities will be used to gain feedback from people
living with HIV, and those at-risk for acquiring HIV. The Programs are
collaborating on the development of a web-based feedback component on
the Ending HIV in Arizona page of HIVAZ.org, the state’s comprehensive
online HIV resource. This web page will be updated on Plan progress, and
an email response component will allow for continuous feedback from site
visitors. Feedback will be compiled quarterly and provided to the Planning
Bodies for review and action.
189
Monitoring and Evaluating the Goals and Objectives of This Plan
Programs work together to monitor service utilization, develop new
tracking mechanisms for acute and stage zero cases, and use geo-mapped
epidemiological data to target service delivery. Information gathered from
Ryan White sub-recipients, collaborative partners, and other local and
national sources are also used to assess and improve health outcomes
along the HIV care continuum.
The HIV Statewide Advisory Group will meet quarterly to review the
progress of strategies and activities defined in the plan. The Community
Health Planning & Strategies Committee of the Phoenix EMA Ryan White
Planning Council meets monthly, and will conduct similar reviews. These
Planning Bodies will meet jointly at least once per year to collectively
evaluate the Plan.
The HIV Prevention and Ryan White Programs will utilize the National
Quality Center’s Arizona Regional Quality Group meetings, which are held
quarterly, to conduct evaluations that help to improve the quality of the
HIV service delivery system across all Arizona HIV programs.
Use of Surveillance and Program Data to
Assess and Improve Health Outcomes
The HIV Prevention and Ryan White Programs collaborate with the HIV
Surveillance Program, the STD Control Program, private laboratories, and
the Arizona Department of Health Services state laboratory to assure that
the most current, relevant data available is available for use to drive
programmatic development, monitoring and evaluation. Surveillance data
and HIV testing and Partner Services data are used to monitor trends and
positivity rates, and track acute cases of HIV. Electronic lab reporting data
is also evaluated.
We’re going to end the HIV epidemic in Arizona.
You can help. Learn more at:

09.30.16 AZ Integrated Plan

  • 1.
    The 2017 to2021 Integrated HIV Prevention and Care Plan for Arizona
  • 2.
    2017 to 2021 IntegratedHIV Prevention and Care Plan for Arizona Arizona’s audacious plan to end the local HIV epidemic Developed by the HIV Statewide Advisory Group and the Phoenix EMA Ryan White Planning Council Submitted to the Centers for Disease Control and Prevention and the Health Resources and Services Administration on September 30, 2016 HIV Statewide Advisory Group of the HIV Prevention Program and the Ryan White Part B Care and Services Program Arizona Department of Health Services 602-364-3599 AZDHS.gov Phoenix EMA Ryan White Planning Council of the Ryan White Part A Program Maricopa County 602-506-6321 maricopa.gov/rwpc
  • 3.
    Contents Letters of Concurrence.........................................................................i Acknowledgements...........................................................................iii Foreword...........................................................................................1 Executive Summary ............................................................................3 Section 1: Statewide Coordinated Statement of Need.......................14 Section 2: Integrated HIV Prevention and Care Plan ..........................61 Contributions of Stakeholders and Key Partners............................................ 65 Northern Region Plan................................................................................................. 69 Central Region Plan...................................................................................................103 Southern Region Plan...............................................................................................139 Section 3: Monitoring and Evaluation ............................................187
  • 4.
  • 5.
  • 6.
    iii Acknowledgements Community Health Planning& Strategies Committee Phoenix EMA Ryan White Planning Council Cheri Tomlinson, Chair Committee Members Carmen Batista Cynthia Trottier Debby Elliott Guillermo (Gil) Velez John Sapero Nicole Turcotte Randall Furrow Ryan White Part A Program Staff Alaina Rinne Chavon Boston Evelyn Bester Jane Wixted Jeremy Hyvarinen Kaila Johnson Rose Conner Victoria Jaquez About the Phoenix EMA Ryan White Planning Council The Planning Council is a community group that has been appointed by the Maricopa County Board of Supervisors to plan the organization and delivery of HIV services funded by Part A of the Ryan White HIV/AIDS Treatment Modernization Act. Each Council member is a caring, dedicated volunteer who has been carefully selected to reflect the diversity of the community. Members represent the general public, people living with HIV, Part A service providers, and other health and social service organizations. About the Community Health Planning & Strategies (CHPS) Committee The CHPS Committee oversees the design and implementation of community needs assessments, establishes and monitors the Planning Council's comprehensive plan for the delivery of HIV/AIDS services, and establishes guidelines for the provision of Part A services.
  • 7.
    iv Acknowledgements Arizona HIV StatewideAdvisory Group Chelsey Donohoo, Chair Members Alyssa Guido Calicia White Cesar Egurrola Deborah Reardon-Maynard Felicia McLean Haley Coles Harold Thomas Jai Smith Jamal Brooks-Hawkins Jeremy Bright Jeremy Hyvarinen Kara Ihrke Randall Furrow RJ Shannon Robert Bourassa HIV Prevention Program Staff Ann Gardner Deborah Reardon-Maynard John Sapero Tiana Galindo Ryan White Part B Program Staff Carmen Batista Claudia Cardiel Greg Romero Jessica Alvidrez Jimmy Borders Laura Kroger LisaMarie Bates Lora Andrikopoulos Louisa Vela Lynelle Brooks-Dorsey Nicole Vandrovec About the Arizona HIV Statewide Advisory Group To better meet CDC/HRSA expectations for integrated HIV prevention and care planning, the HIV Prevention Program and Ryan White Part B Care and Services Program combined their respective planning bodies to form the HIV Statewide Advisory Group (SWAG). The SWAG is charged with developing and monitoring Arizona's strategic plan to effectively end the state’s HIV epidemic. The SWAG also guides the development and implementation of HIV services, social marketing activities, and quality improvement initiatives. Membership includes representatives of people living with HIV, services providers, health departments, community leaders, and other stakeholders.
  • 8.
    v Acknowledgements This plan hasbeen developed in collaboration with: Arizona AIDS Education and Training Center University of Arizona HIV Prevention Program Arizona Department of Health Services HIV Surveillance Program Arizona Department of Health Services Las Vegas TGA Ryan White Part A Program Clark County, Nevada Ryan White Part A Program Maricopa County Ryan White Part B Care and Services Program Arizona Department of Health Services Ryan White Part C Programs El Rio Special Immunology Associates Maricopa Integrated Health System University of Arizona Petersen HIV Clinic Ryan White Part D Program Maricopa Integrated Health System STD Control Program Arizona Department of Health Services
  • 9.
    1 Foreword The Arizona HIVStatewide Advisory Group and the Phoenix EMA Ryan White Planning Council are pleased to submit this comprehensive plan for ending the HIV epidemic in Arizona. When development of this plan began, people throughout the state were asked two simple questions: 1) What needs to happen in the next five years to end the HIV epidemic in Arizona? and 2) What are the barriers that might stop us from achieving this audacious goal? Hundreds of people responded. People living with HIV shared their successes and struggles, their service needs, and the accessibility, barriers and gaps in care they experienced. High-risk HIV negative individuals, and people recently diagnosed with HIV provided thoughtful answers about their engagement in HIV prevention methods, their satisfaction with HIV testing and other prevention services, and what they wish they knew before becoming HIV positive. They also discussed their social media use, where they hang out, the impact of local prevention messages, and the HIV knowledge and perceptions of their friends and family. Over the course of a year and a half, more than 200 representatives of people living with HIV, community-based organizations, medical providers, Ryan White and CDC funded programs, public health programs, community leaders, Tribal entities, and hospital systems contributed 1,483 man hours to strategic planning efforts. These individuals participated in two day-long training sessions focused on best-practices for linkage to care, retention in care, data-based quality improvement, innovations in prevention services, and client-centered care. Participants then used the knowledge they gained from these sessions, along with their personal expertise, experience, and passion to inform the development of regional strategies. Teams studied continuums of care for clinics, regions, and the state. They discussed such issues as the challenge of abstinence only sex education, rural coalition development, and the needs for flexible funding and shared data systems. There were meaningful discussions barriers clients faced, going so far as to begin the work of problem solving where homeless clients can safely store their medications. 774 Ryan White clients and high-risk HIV negative individuals identified service needs, accessibility, barriers, and gaps across the care continuum 203 community partners participated in a survey of HIV prevention knowledge and perceptions among the target populations they serve 65 newly diagnosed individuals were surveyed about their HIV testing and linkage to care experiences
  • 10.
    2 Participants tackled hardquestions of how to step up the levels of cultural competency within our communities, the limits of government influence, and how we could expand our influence on behalf of the clients. At times, the planning process was daunting. There were difficult discussions on realistic versus aspirational objective measures. Powerful conversations occurred about the impact of social justice issues on HIV prevention, and engagement/retention in care for people of color. There were months with multiple meetings scheduled each week, and a now- legendary series of grueling, four-hour web-based meetings that allowed for comprehensive public review and comment. Regardless of the amount or intensity of meetings, Arizona’s Planning Body members showed up with passion, expertise and creative solutions. Every. Single. Time. The integrated planning process has spurred some of the most inclusive and meaningful client-centric HIV discussions Arizona has ever had. This dialog is far from finished. But, thanks to the many outstanding contributions of our partners, it's off to an impressive start. On the following pages, you will learn of the great effort that has been expended to create this plan, and of the hard work our communities have ahead of them. We are humbled by the dedication of our Planning Body members, and so very thankful for their commitment to ending the HIV epidemic in Arizona. Our programs have already begin preparing to implement the plan with great excitement. After you read the Plan, we believe you will become just as engaged. Please join us as we begin to end the HIV epidemic in Arizona! Respectfully, Carmen Batista Program Manager Ryan White Part B Care and Services Program Arizona Department of Health Services John Sapero Office Chief HIV Prevention Program Arizona Department of Health Services Rose Conner Program Manager Ryan White Part A Program Maricopa County 225 representatives of people living with HIV, community- based organizations, medical providers, Ryan White and CDC funded programs, public health programs, community leaders, Tribal entities, and hospital systems contributed more than 1,483 man hours specifically to strategic planning for Arizona’s regional communities
  • 11.
  • 12.
    4 An Inclusive, Collaborative PlanningProcess How People Involved in Planning Are Reflective of the Local Epidemic The 2017 to 2021 Integrated HIV Prevention and Care Plan is the most inclusive planning effort ever undertaken by Arizona’s HIV community. Participants in the planning process represent all target populations identified in each region, and a diverse array of program partners and key stakeholders. Participation of Planning Body Members More than 60 Planning Body members and guests contributed 1,209 man hours to developing local activities and resources for the regional plans. Members from both Planning Bodies have attended each others’ planning meetings. Multiple regional planning sessions occurred, with Planning Body members travelling to each region to meet with stakeholders. How People Living with HIV Contributed to the Plan People living with HIV participated in all four stages of planning. A statewide needs assessment was completed by 5% of all people living with HIV in Arizona. Foundational data was also collected from high risk negatives. People living with HIV were included in HIV Symposium and Planning Body activities over the past two years. The Phoenix EMA Ryan White Planning Council and HIV Statewide Advisory Group each meet the federal mandates for representation of people living with HIV and affected community members. Each Planning Body has regular stakeholder attendance at meetings. Community Participation in HIV Symposium Planning Sessions Arizona HIV Programs co-host 2-day HIV symposiums each year. The second day of these symposiums is been dedicated to planning. More than 225 unduplicated consumers, providers, stakeholders, Ryan White Program recipients and sub-recipients, and others contributed 1,483 man hours to HIV planning. In the first year, this group identified 1) What needs to happen in the next five years to end the HIV epidemic in Arizona? and 2) What are the barriers that might stop us from achieving this audacious goal? In the second year, the Symposium participants voted for regional goals and objectives, and worked in teams to identify strategies/activities. The development of this Plan has been the most inclusive planning effort ever undertaken by Arizona’s HIV community. The HIV Prevention and Ryan White Programs collaborate to present a 2-day HIV Symposium each year.
  • 13.
    5 Community Participation inPrevention and Care Needs Assessments Arizona’s HIV Programs continue to identify and reach out to populations disproportionately impacted by HIV. Statewide assessments are completed every three years, along with yearly regional assessments of target populations. Additional input is gathered at Planning Body and community advisory board meetings, at community events, and from focus groups and client feedback surveys.  774 people living with HIV informed the 2014 statewide needs assessment on needs, gaps and barriers across the prevention and care continuum. This represents 5% of all people living with HIV in Arizona  203 community members participated in an HIV prevention assessment, sharing information about sexual habits, STD testing practices and knowledge of Pre-Exposure Prophylaxis  65 Newly Diagnosed individuals reflected on their experiences being tested for HIV, coping with receiving their diagnosis, and getting linked to medical care  People at high risk for contracting HIV are engaged in yearly needs assessments conducted by the HIV Prevention Program The HIV Prevention Program has also established work groups to guide social marketing initiatives and service delivery. Participants of the work groups include representatives of people living with HIV, people at-risk for acquiring HIV, human equity groups, youth groups, English and Spanish- language media entities, non-elected community leaders, and non- federally funded partners. Participation of Program Leadership The development of the Integrated HIV Prevention and Care Plan was guided by the Program leads for the HIV Prevention Program, Arizona’s Ryan White Programs, the Arizona AIDS Education and Train Center and the HIV Surveillance and STD Control Programs, in collaboration with the Planning Body Chairs. Many of these programs are lead by or employ people living with HIV. How Impacted Communities Will Remain Engaged in Planning and Provide Critical Insight Into Developing Solutions Arizona considers the integrated Plan a living document that will evolve with continued input from impacted communities. The HIV Statewide Advisory Group and the Phoenix EMA Ryan White Planning Council will be In 2015, the Phoenix EMA Ryan White Planning Council and HIV Statewide Advisory Group collaboratively presented a consumer- centric Leadership Academy.
  • 14.
    6 implementing a varietyof community engagement methods, above and beyond collection of needs assessment data and recruitment to Planning Bodies. Some of the methods include:  Mobile town halls throughout Arizona (two to three per year)  Client/Community member orientation sessions  Graphic facilitation of community engagement sessions  Use of internet-based feedback solutions, such as online surveys Stakeholders and Partners Who Were Not Involved in the Planning Process, But Who are Needed During the planning process, an additional 22 agencies and special interest groups were identified by participants for future inclusion in planning efforts. These entities include the Arizona Alliance of Community Health Centers, Black Chamber of Commerce, youth leadership from the Black Lives Matter – Tucson chapter, and Latino Clinic Amistades, among others. Planning: A Regional Approach For integrated planning purposes, Arizona has been delineated into three distinct geographically differentiated regions, each with specific public health concerns and HIV challenges. FIGURE 1 Northern, Central and Southern Regions Southern Region Central Region Northern Region
  • 15.
    7 The Northern Region TheNorthern Region includes Mohave, Coconino, Yavapai, Gila, Navajo, and Apache counties. This region is 47,890 square miles, with a population of 792,935 in 2014. Much of the Northern Region is tribal land and/or national forest, and is largely rural outside of the cities of Flagstaff, Prescott and Sedona. The sparse population density poses many challenges both for prevention and care of persons living with HIV. Major HIV issues in the Northern Region include rural health care delivery concerns and disparities, transportation, stigma, limited service delivery areas by county and other health departments or providers due to population density, and access to resources. Federally-funded HIV care in Mohave county is provided by both the Las Vegas TGA Ryan White Part A Program and the Arizona Ryan White Part B Program. Arizona’s HIV Prevention Program funds prevention services in Northern Arizona. The region utilizes an established telemedicine network. Target Populations  Men who have Sex with Men (MSM), especially youth and MSM of Color  Hispanics, regardless of gender  American Indians, regardless of gender  Injection Drug Users Activity Highlights  Implementation of Pre-Exposure Prophylaxis (PrEP) Engagement Assistance programming, and efforts to increase consumer use of PrEP  Increased collaboration with mental health/substance abuse providers  Increased HIV testing, and diversification of HIV testing locations, including opt-out HIV testing in hospital settings  Strengthening of partnerships with providers, correctional facilities, and hospital systems to improve linkage to care timeframes  Evaluation and implementation of innovative linkage to care/retention in care service models specific adapted to rural communities Mohave county, in the Northern Region, was identified by the CDC as one of 221 counties nationwide at risk for an HIV/Hepatitis outbreak.
  • 16.
    8 The Central Region TheCentral Region is comprised of Maricopa and Pinal counties, and had an estimated population of 4,489,109 in 2014. The Central Region includes Phoenix, the state’s capital, which is the sixth most populated city in America. Phoenix’ 2015 population was estimated to be more than 1,563,025. The Central Region accounts for more than 70% of the state’s HIV incidence and prevalence. Major HIV issues affecting the Central Region include ethnic/racial disparities, especially within the African American/ Black community, stigma, lack of sexual health education in schools, and access to care issues. The Central Region defines the geographic service delivery area for the Phoenix EMA Ryan White Part A Program. Ryan White Parts B, C and D, and the HIV Prevention Program also provide services in the Region. Target Populations  Men who have Sex with Men (MSM), especially youth and MSM of Color  Hispanics, regardless of gender  African Americans/Blacks, regardless of gender  Transgender Individuals Activity Highlights  Implementation of Pre-Exposure Prophylaxis (PrEP) Engagement Assistance programming, and efforts to increase consumer use of PrEP  Increased HIV testing, and diversification of HIV testing locations, including opt-out HIV testing in hospital settings  Form reduction and process improvements to reduce duplication of effort among funding sources  Quality improvement initiatives designed to reduce linkage to care timeframes  Consumer and provider training related to stigma reduction, cultural competency, and client empowerment  Social marketing initiatives to increase HIV testing and awareness, PrEP engagement, and engagement in care More than 70% of Arizona’s HIV incidence and prevalence occurs in Maricopa county, in the Central Region.
  • 17.
    9 The Southern Region TheSouthern Region includes Yuma, Pima, Santa Cruz, Cochise, Graham, Greenlee, and La Paz counties. The 2014 population for this region was 1,449,440. Pima County has the state’s second highest prevalence (16%) and is home to Tucson, the state’s second largest city. Four counties (Yuma, Pima, Santa Cruz, and Cochise) border Mexico. Hispanics account for a large percentage of the population of Southern Region counties, with the largest concentration being in counties along the international border. Major HIV prevention issues in the Southern Region include rural health care delivery concerns and disparities, transportation, stigma, limited service delivery areas by county and other health departments or providers due to population density, access to resources, and border issues. The HIV Prevention and Ryan White Part B and C Programs provide HIV prevention and care services in the Southern Region. Target Populations  Men who have Sex with Men (MSM), especially youth and MSM of Color  Hispanics, regardless of gender  African Americans/Blacks regardless of gender  Injection Drug Users Activity Highlights  Implementation of Pre-Exposure Prophylaxis (PrEP) Engagement Assistance programming, and efforts to increase consumer use of PrEP  Increased HIV testing, and diversification of HIV testing locations, including opt-out HIV testing in hospital settings  Engagement of community stakeholders and policy makers in advocacy for expanded HIV education, increased local HIV funding, and other HIV- centric issues  Strengthening partnerships with providers, correctional facilities, and community-based organizations to expand availability and accessibility of quality housing for people living with HIV  Consumer and provider training related to stigma reduction, cultural competency, and client empowerment  Social marketing initiatives to increase HIV testing and awareness, PrEP engagement, and engagement in care Four counties in the Southern Region border Mexico.
  • 18.
    10 Regional Objectives andStrategies to Achieve the National HIV/AIDS Strategy’s Goal 1: Reduce New Infections. Northern Region Objective 1 Increase the percentage of people living with HIV who know their serostatus to at least 90%. Strategies  Community Engagement  Education  Prevention, Testing & Linkage to Care Objective 2 Increase the percentage of newly diagnosed persons linked to HIV medical care within one month of their HIV diagnosis to at least 85%. Strategies  Funding  Patient-Centered Care  Streamline Processes Central Region Objective 1 Increase the percentage of people living with HIV who know their serostatus to at least 90%. Strategies  Prevention, Testing & Linkage to Care  Education  Community Engagement  Stigma Reduction Objective 2 Increase the percentage of newly diagnosed persons linked to HIV medical care within one month of their HIV diagnosis to at least 85%. Strategies  Streamline Processes  Community Engagement  Patient-Centered Care Southern Region Objective 1 Increase the percentage of people living with HIV who know their serostatus to at least 90%. Strategies  Prevention, Testing & Linkage to Care  Education  Stigma Reduction Objective 2 Increase the percentage of persons with diagnosed HIV infection who are virally suppressed to at least 80%. Strategies  Patient-Centered Care  Streamline Processes  Incentives for Care  Stigma Reduction
  • 19.
    11 Regional Objectives andStrategies to Achieve the National HIV/AIDS Strategy’s Goal 2: Increase Access to Care and Improve Health Outcomes for People Living With HIV. Northern Region Objective 1 Increase the percentage of newly diagnosed persons linked to HIV medical care within one month of their HIV diagnosis to at least 85%. Strategies  Prevention, Testing & Linkage to Care  Streamline Processes  Patient-Centered Care Objective 2 Increase the percentage of persons with diagnosed HIV infection who are retained in care to at least 90%. Strategies  Patient-Centered Care  Funding  Data Standardization Central Region Objective 1 Increase the percentage of newly diagnosed persons linked to HIV medical care within one month of their HIV diagnosis to at least 85%. Strategies  Streamline Processes  Education  Patient-Centered Care Objective 2 Increase the percentage of persons with diagnosed HIV infection who are virally suppressed to at least 80%. Strategies  Patient-Centered Care  Community Engagement  Streamline Processes Southern Region Objective 1 Increase the percentage of newly diagnosed persons linked to HIV medical care within one month of their HIV diagnosis to at least 85%. Strategies  Patient-Centered Care  Community Engagement  Stigma Reduction  Prevention, Testing & Linkage to Care Objective 2 Increase the percentage of persons with diagnosed HIV infection who are retained in care to at least 90%. Strategies  Streamline Processes  Patient-Centered Care  Data Standardization  Education
  • 20.
    12 Regional Objectives andStrategies to Achieve the National HIV/AIDS Strategy’s Goal 3: Reduce HIV-Related Health Disparities and Health Inequities. Northern Region Objective 1 Increase the percentage of people living with HIV who know their serostatus to at least 90%. Strategies  Stigma Reduction  Community Engagement  Funding Objective 2 Increase the percentage of newly diagnosed persons linked to HIV medical care within one month of their HIV diagnosis to at least 85%. Strategies  Patient-Centered Care  Community Engagement  Stigma Reduction Central Region Objective 1 Reduce disparities in the rate of new diagnosis by at least 15% in the following groups: gay and bisexual men, young Black gay and bisexual men, and Black females. Strategies  Funding  Patient-Centered Care  Stigma Reduction  Population-Specific Assessment & Strategy Development Objective 2 Reduce the percentage of persons in HIV medical care who are homeless to no more than 5%. Strategies  Community Engagement  Funding  Patient-Centered Care Southern Region Objective 1 Reduce the percentage of persons in HIV medical care who are homeless to no more than 5%. Strategies  Funding  Quality Housing  Community Engagement Objective 2 Reduce disparities in the rate of new diagnoses by at least 15% in the following groups: gay and bisexual men, young Black gay and bisexual men, and Black females. Strategies  Community Engagement  Education  Stigma Reduction Objective 3 Increase the percentage of youth and persons who inject drugs with diagnosed HIV infection who are virally suppressed to at least 80%. Strategies  Education  Prevention, Testing & Linkage to Care  Community Engagement
  • 21.
    13 Regional Objectives andStrategies to Achieve the National HIV/AIDS Strategy’s Goal 4: Achieve a More Coordinated Response to the HIV Epidemic. Northern Region Objective 1 Increase the percentage of people living with HIV who know their serostatus to at least 90%. Strategies  Community Engagement  Prevention, Testing & Linkage to Care  Education Objective 2 Increase the percentage of newly diagnosed persons linked to HIV medical care within one month of their HIV diagnosis to at least 85%. Strategies  Prevention, Testing & Linkage to Care  Streamline Processes  Patient-Centered Care Central Region Objective 1 Reduce disparities in the rate of new diagnosis by at least 15% in the following groups: gay and bisexual men, young Black gay and bisexual men, and Black females. Strategies  Coordinated Data Collection & Dissemination  Patient-Centered Care Objective 2 Reduce the percentage of persons in HIV medical care who are homeless to no more than 5%. Strategies  Community Engagement  Funding  Patient-Centered Care Southern Region Objective 1 Increase the percentage of newly diagnosed persons linked to HIV medical care within one month of their HIV diagnosis to at least 85%. Strategies  Funding  Community Engagement  Policy Development  Prevention, Testing & Linkage to Care Objective 2 Increase the percentage of persons with diagnosed HIV infection who are retained in HIV medical care to at least 90%. Strategies  Patient-Centered Care  Streamline Processes  Funding
  • 22.
  • 23.
    15 Epidemiologic Overview of Arizona GeographicalDescription In 2015, Arizona’s population was estimated at 6,828,065. The most populous counties experienced an increase in population whereas lesser populated counties remained relatively stable or decreased in size. The state’s population grew by 435,758 (6.8%) between April 2010 to July 2015 according to the U.S. Census Bureau’s estimates. The three most populous counties in Arizona, Maricopa (350,590), Pima (29,762), and Pinal (30,814) have the largest increases in terms of absolute numbers. Arizona’s least populated county, Greenlee (2015: 9,529), has the largest rate of increase, 12.9%. Maricopa, which is Arizona’s most populous county, has the second highest rate of increase (9.2%). Five out of the twelve counties (Apache, Gila, La Paz, Santa Cruz, and Cochise) in Arizona that have a population of less than 320,000 have actually had decreases in population. The state is 113,909 square miles in area, divided into fifteen counties. Fifty-seven percent is under state and federal jurisdiction, and sixteen percent is privately or corporately owned. Federally owned lands include six national forests: Kaibab, Coconino, Apache-Sitgreaves, Prescott, Tonto, and Coronado. There are 23 national parks, monuments, and historic sites in Arizona from Grand Canyon National Park and Monument to Canyon de Chelly with its Anasazi ruins. More than a quarter of the area of the state is reservation land that is home to 22 federally recognized American Indian tribes. The largest tribal land areas include 25,000 acres of the Navajo Nation, the largest American Indian reservation in the US, and the entire Tohono O'odham Nation, the second largest reservation in the country. The smallest is the 85-acre Tonto Apache Reservation near Payson. Tribal lands are separate jurisdictions with their own tribal governments, laws and law enforcement units. Approximately 18% of tribal members reside on tribal lands, while 82% reside in urban settings. Some counties have high proportions of American Indians among their population. Seventy-seven
  • 24.
    16 percent of ApacheCounty, 48% of Navajo County, and 29% of Coconino County residents are American Indians. Planning: A Regional Approach The Epidemiologic Overview is focused on Arizona as a jurisdiction. For integrated planning purposes, Arizona has been delineated into three distinct geographically differentiated regions, each with specific public health concerns and HIV challenges. Section II of the plan will include abbreviated regional epi data and plans that were locally developed with support from the Planning Bodies and HIV leadership. Northern Region The Northern Region of the jurisdiction is comprised of Mohave, Yavapai, Coconino, Gila, Navajo, and Apache counties. The Northern Region combined population was estimated at 792,935 in 2014. The largest city, Flagstaff is located in Coconino county and had a 2015 estimated population of 70,320. Much of the Northern Region is tribal land and/or national forest, which contributes to its rural, or “frontier” vastness. The sparse population density poses many challenges both for prevention and care of persons living with HIV. Key HIV issues in the Northern Region include rural health care delivery concerns and disparities, transportation, stigma, limited service delivery areas by county and other health departments or providers due to population density, and access to resources. Federally-funded HIV care in Mohave county is provided by both the Las Vegas TGA Ryan White Part A Program and the Arizona Ryan White Part B Program. Arizona’s HIV Prevention Program funds prevention services in Northern Arizona. Central Region The Central Region of the jurisdiction is comprised of Maricopa and Pinal counties, and had an estimated population of 4,489,109 in 2014. The Central Region includes Phoenix, the state’s capitol, which is the sixth most populated city in America. Phoenix’ 2015 population was estimated to be more than 1,563,025. The Central Region accounts for more than 70% of the state’s HIV incidence and prevalence. Major HIV issues affecting the Central Region include ethnic/racial disparities, especially within the African American/Black community, stigma, lack of sexual health education in schools, and access to care challenges. The Central Region defines the geographic service delivery area for the Phoenix EMA Ryan White Part A Program. Ryan White Parts B, C and D, and the HIV Prevention Program also provide services in the Region.
  • 25.
    17 FIGURE 2 Northern, Centraland Southern Regions Southern Region The Southern Region of the jurisdiction includes Yuma, Pima, Santa Cruz, Cochise, Graham, Greenlee, and La Paz counties. The 2014 population for this Region was 1,449,440. Pima County has the state’s second highest prevalence (16%) and is home to Tucson, the state’s second largest city. Four counties (Yuma, Pima, Santa Cruz, and Cochise) border Mexico. Hispanics account for a large percentage of the population of Southern Region counties, with the largest concentration being in counties along the international border. Key HIV prevention issues in the Southern Region include rural health care delivery concerns and disparities, transportation, stigma, limited service delivery areas by county and other health departments or providers due to population density, access to resources, and border issues. The HIV Prevention and Ryan White Part B and C Programs provides HIV prevention and care services in the Southern Region. Socioeconomic, Demographic and Burden of HIV Data The socio-demographic characteristics of newly diagnosed individuals, people living with HIV, and people at high-risk for acquiring HIV provides the basis for setting priorities, identifying appropriate interventions and services, and allocating resources. Income Arizona’s 2014 median annual income is $49,928 with 18% of Arizonans living in poverty. High school graduates compose 86% of the population and bachelor’s degree or higher composed 27% from the same year. Sixteen percent of the population has insurance. Nine percent have a disability and are under 65 years old. Among Ryan White clients. Arizona has 514,290 veterans. 13.5% of the Arizonans are foreign born. Among Ryan White clients 79% earn 200% of the federal poverty level or less, with 51% being under 100% of the federal poverty level.
  • 26.
    18 When evaluating healthcarecoverage, 37% have Medicaid, 26% are Medicare, 19% have private insurance (or marketplace insurance), 1% have other insurance and 17% have no insurance. Among Arizona’s Ryan White clients, 88% are stably housed, followed by 7% with unstable housing, 3% temporary housing, and 1% non-permanently housed. Incidence and Prevalence The State of Arizona experienced an 18% increase in new HIV cases from 2011 to 2012. However, the amount of AIDS cases decreased by 10% from 2011 to 2012. The result was a total HIV/AIDS case increase of 12% from 2011 to 2012, with the majority of new HIV cases among Whites (342 or 39%), Men who have Sex with Men (541 or 61%) and those ranging in age from 20 to 44 (644 or 74%). Correspondingly, the majority of new AIDS cases presented amongst Whites (141 or 43%), Men who have Sex with Men (163 or 50%) within the age ranges of 20 to 44 years of age (190 or 58%). In 2012,the combined HIV/AIDS prevalence of 15,288 represents a 4% or 583 person increase from 2011 and a 7% or 1,046 person increase from 2010. Race/ethnicity categories for people living with HIV are 57% White, 26% Hispanic, 11% African American/Black, 4% American Indian/ Alaska Native, 1% Asian/Pacific Islander and 1% Multi-racial. Gender ratios present at 87% male and 13% female. Additionally, the age categories for people living with HIV are: 1% under 19 years of age, 34% from 20 to 44 and 65% over age 45. Regional data on incidence, prevalence and trends will be presented in Section II with the regional plans. 2010 2011 2012 2013 2014 New HIV 406 403 488 526 605 New AIDS 225 174 155 204 157 Total New HIV/AIDS 631 577 643 730 762 Total HIV 6866 7142 7474 7759 8265 Total AIDS 7376 7563 7814 8039 8424 Total HIV/AIDS 14242 14705 15288 15798 16689 TABLE 1 HIV/AIDS Incidence and Prevalence Totals in Arizona 2010 to 2014
  • 27.
    19 Mode of Transmission Numberof Cases % Total MSM 442 73 IDU 34 6 MSM/IDU 31 5 High-Risk Heterosexual Contact 23 4 Presumed Heterosexual Contact 58 9 Vertical 2 0.3 No Risk Reported 16 3 TABLE 2 2014 Arizona Incidence Among Males, by Mode of Transmission KEY MSM: Men who have Sex with Men IDU: Injection Drug User HRH: High-Risk Heterosexual NRR: No Reported Risk Vertical: Mother-to-Child Transmission TABLE 3 2014 Arizona Incidence Among Females, by Mode of Transmission KEY MSM: Men who have Sex with Men IDU: Injection Drug User HRH: High-Risk Heterosexual NRR: No Reported Risk Vertical: Mother-to-Child Transmission Mode of Transmission Number of Cases % Total MSM NA NA IDU 19 16 MSM/IDU NA NA High-Risk Heterosexual Contact 49 40 Presumed Heterosexual Contact 45 37 Vertical 2 2 No Risk Reported 6 5
  • 28.
    20 * Asian Pacific/Islander/Hawaiian+ Men having Sex with Men ++++ No Reported Risk/Unknown Risk ** American Indian/Alaskan Native ++ Injection Drug Use *** Multiple Race/Other Race +++ Other/Hemophilia/Transfusion and Blood Products/Transplant Recipient Emergent HIV Emergent AIDS Emergent HIV & AIDS Cases % State Total Rate Per 100,000 Cases % State Total Rate Per 100,000 Cases % State Total Rate Per 100,000 By Gender Male 508 84 15.42 137 87.3 4.16 645 84.6 19.57 Female 97 16 2.91 20 12.7 0.6 117 15.4 3.51 TOTAL 605 100 9.13 157 100 2.37 762 100 11.5 By Age Under 2 0 0 0 0 0 0 0 0 0 2 to 12 2 0.3 0.2 1 0.6 0.1 3 0.4 0.3 13 to 19 41 6.8 6.46 0 0 0 41 5.4 6.46 20 to 24 118 19.5 24.35 9 5.7 1.86 127 16.7 26.2 25 to 29 123 20.3 27.87 17 10.8 3.85 140 18.4 31.72 30 to 34 88 14.5 19.98 21 13.4 4.77 109 14.3 24.75 35 to 39 73 12.1 17.87 19 12.1 4.65 92 12.1 22.51 40 to 44 61 10.1 14.48 19 12.1 4.51 80 10.5 19 45 to 49 33 5.5 8.11 30 19.1 7.37 63 8.3 15.48 50 to 54 30 5 6.99 17 10.8 3.96 47 6.2 10.95 55 to 59 16 2.6 3.94 11 7 2.71 27 3.5 6.65 60 to 64 11 1.8 2.97 8 5.1 2.16 19 2.5 5.12 65 and Above 9 1.5 0.88 5 3.2 0.49 14 1.8 1.37 Age Unknown 0 0 N/A 0 0 N/A 0 0 N/A TOTAL 605 100 9.13 157 100 2.37 762 100 11.5 By Race/Ethnicity White Non-Hispanic 220 36.4 5.76 66 42 1.73 286 37.5 7.49 Black Non-Hispanic 117 19.3 39.49 15 9.6 5.06 132 17.3 44.55 Hispanic 210 34.7 10.47 57 36.3 2.84 267 35 13.32 *A/PI/H Non-Hispanic 14 2.3 6.24 3 1.9 1.34 17 2.2 7.58 **AI/AN Non-Hispanic 41 6.8 14.64 16 10.2 5.71 57 7.5 20.35 ***MR/O Non-Hispanic 3 0.5 N/A 0 0 N/A 3 0.4 N/A TOTAL 605 100 9.13 157 100 2.37 762 100 11.5 By Mode of Transmission + MSM 389 64.3 N/A 82 52.2 N/A 471 61.8 N/A ++ IDU 42 6.9 N/A 16 10.2 N/A 58 7.6 N/A MSM / IDU 28 4.6 N/A 5 3.2 N/A 33 4.3 N/A Heterosexual 59 9.8 N/A 16 10.2 N/A 75 9.8 N/A +++ O/H/TF/TPR 4 0.7 N/A 1 0.6 N/A 5 0.7 N/A ++++ NRR/UR 83 13.7 N/A 37 23.6 N/A 120 15.7 N/A TOTAL 605 100 9.13 157 100 2.37 762 100 11.5 TABLE 4 Arizona Reported Emergent Cases 2014
  • 29.
    21 * Asian Pacific/Islander/Hawaiian+ Men having Sex with Men ++++ No Reported Risk/Unknown Risk ** American Indian/Alaskan Native ++ Injection Drug Use *** Multiple Race/Other Race +++ Other/Hemophilia/Transfusion and Blood Products/Transplant Recipient Prevalent HIV Prevalent AIDS Prevalent HIV & AIDS Cases % State Total Rate Per 100,000 Cases % State Total Rate Per 100,000 Cases % State Total Rate Per 100,000 By Gender Male 6956 41.7 211.1 7329 43.9 222.42 14285 85.6 433.52 Female 1309 7.8 39.29 1095 6.6 32.87 2404 14.4 72.16 TOTAL 8265 49.5 124.72 8424 50.5 127.12 16689 100 251.85 By Age Under 2 2 0 0 0 0 0 0 0 0 2 to 12 51 0.3 5.13 11 0.1 1.11 62 0.4 6.24 13 to 19 75 0.4 11.83 14 0.1 2.21 89 0.5 14.03 20 to 24 359 2.2 74.07 77 0.5 15.89 436 2.6 89.95 25 to 29 693 4.2 157.02 269 1.6 60.95 962 5.8 217.97 30 to 34 832 5 188.88 449 2.7 101.93 1281 7.7 290.82 35 to 39 876 5.2 214.38 698 4.2 170.82 1574 9.4 385.2 40 to 44 1066 6.4 253.11 1053 6.3 250.03 2119 12.7 503.14 45 to 49 1199 7.2 294.56 1590 9.5 390.62 2789 16.7 685.18 50 to 54 1321 7.9 307.8 1824 10.9 425.01 3145 18.8 732.81 55 to 59 844 5.1 207.94 1162 7 286.29 2006 12 494.24 60 to 64 484 2.9 130.47 721 4.3 194.35 1205 7.2 324.82 65 and Above 446 2.7 43.77 556 3.3 54.57 1002 4.5 71.54 Age Unknown 19 0.1 NA 0 0 NA 19 0.1 NA TOTAL 8265 49.5 124.72 8424 50.5 127.12 16689 100 251.85 By Race/Ethnicity White Non-Hispanic 4366 26.2 114.27 4622 27.7 120.97 8988 53.9 235.24 Black Non-Hispanic 1113 6.7 375.67 1018 6.1 343.61 2131 12.8 719.28 Hispanic 2208 13.2 110.12 2254 13.5 112.41 4462 26.7 222.53 *A/PI/H Non-Hispanic 135 0.8 60.18 107 0.6 47.7 242 1.5 107.88 **AI/AN Non-Hispanic 279 1.7 99.61 336 2 119.96 615 3.7 219.57 ***MR/O Non-Hispanic 164 1 N/A 87 0.5 N/A 251 1.5 N/A TOTAL 8265 49.5 124.72 8424 50.5 127.12 16689 100 251.85 By Mode of Transmission + MSM 4977 29.8 N/A 5080 30.4 N/A 10057 60.3 N/A ++ IDU 767 4.6 N/A 910 5.5 N/A 1677 10 N/A MSM / IDU 535 3.2 N/A 856 5.1 N/A 1391 8.3 N/A Heterosexual 921 5.5 N/A 910 5.5 N/A 1831 11 N/A +++ O/H/TF/TPR 121 0.7 N/A 96 0.6 N/A 217 1.3 N/A ++++ NRR/UR 944 5.7 N/A 572 3.4 N/A 1516 9.1 N/A TOTAL 8265 49.5 124.72 8424 50.5 127.12 16689 100 251.85 TABLE 5 Arizona Estimated Prevalence 2015
  • 30.
    22 HIV Risk Factors 2015Youth Risk Behavior Surveillance System (YRBSS) data for Arizona reports 39% of youth have had sex and among those who were sexually active 45% did not use a condom during last sexual intercourse. Arizona does not use the YRBSS to survey youth about HIV, intravenous drug use, or partner violence through the YRBSS. In 2015, the Ryan White Part A and B Programs, with assistance from the HIV Prevention Program, conducted a survey of 65 newly diagnosed individuals to better understand risks and inform strategies. Participants were 71% male, 29% female, 35% aged 18 to 24, 39% 39 to 44, 17% 45 to 54, 9% 55+, 43% White, 35% African American/Black, 11% Native American, 2% Asian or Pacific Islander, 8% Other, 32% Hispanic/Latino, 49% Men who have Sex with Men (MSM), 34% Heterosexual, 6% Injection Drug User, 9% Other, and 1% Men who have Sex with Men and Injection Drug User. Of MSM respondents, 64% use web applications for sex. Of those, 52% are seeking sex 5+ days a week, 24% 3 to 4 days a week and 24% 1 to 2 days a week. Overwhelmingly, participants reported receiving their HIV information from their doctors and internet searches (Google, Bing, etc.) with limited use of school and social media resources. FIGURE 3 Arizona 5-Year Emergent HIV/AIDS Case Rate Trend
  • 31.
    23 FIGURE 4 Arizona Emergent HIV/AIDSCase Trend by Single Year Figure 2 shows the five-year average rates, which have less year-on-year variance than the single-year rates. The five-year emergent HIV/AIDS case rate declined steadily throughout the 1990s, leveling off from the 1998- 2002 time period and began to decline slightly again starting with the 2003 to 2007 time period. The five-year rates have had an overall decline for the past decade. The 2009 to 2013 five-year rates are 23% lower than the rate for 2003 to 2007. The single-year rates have fluctuated more than the five-year rates, but a similar pattern is present (Figure 3). These rates also declined through the 1990’s. The 2014 single-year rate is 13% lower than the rate for the year 2000, however, the rate for 2014 (11.5 per 100,000) is slightly higher than in 2013 (11.02 per 100,000). According to the most recent estimates of the Centers for Disease Control and Prevention, the 2011 estimated HIV/AIDS diagnosis rate for Arizona was under the national rate of 11.9 per 100,000 population (CDC Diagnoses of HIV Infection in the United States and Dependent Areas, 2014 (http://www.cdc.gov/hiv/pdf/library/reports/ surveillance/cdc-hiv-surveillance-report-us.pdf).
  • 32.
    24 FIGURE 5 Arizona HIV/AIDS PrevalenceTrend Figure 4 shows the number of HIV/AIDS cases in Arizona. Arizona is currently considered a moderate morbidity state, with CDC-estimated prevalence in the middle rate category among states with well-established confidential name-based HIV reporting. Prevalence numbers have continued to rise in Arizona, but this is expected given the population of Arizona has been increasing every year for the past decade. As of December 2014, prevalence of reported HIV infection is 250.63 cases per 100,000 persons. Currently, there are 16,608 persons living with HIV/AIDS in Arizona, a rise of 23% in five years. The increase in prevalence rates may be due to the efficacy of multi-drug treatments for HIV infection, which have sharply reduced the number of HIV-related deaths. Of the 13,447 prevalent cases in the state five years ago, only 12.3% reported residing in another state, or had died in another state. Among prevalent cases, 25.5 % were diagnosed in another state. In June 2009, the number of persons living with AIDS in Arizona surpassed the number of persons with HIV infection who have not been diagnosed with AIDS (Figure 3). Because the burden of HIV-related disease is greater among persons with AIDS, treatment, utilization, and continuity of care are an increasingly critical issues. Among all the risk groups in Figure 6, Men who have Sex with Men (MSM) account for the largest proportion of emergent HIV/AIDS cases in Arizona. In 2014, the proportion of emergent cases that were MSM-related was
  • 33.
    25 FIGURE 6 Arizona Percentageof Emergent Cases by Reported Risk Behavior, 1990 to 2014 Key MSM: Men who have Sex with Men IDU: Injection Drug User HRH: High-Risk Heterosexual NRR: No Reported Risk FIGURE 7 Estimated Single-Year Emergent HIV/AIDS Rates by Risk 1990 to 2014 KEY MSM: Men who have Sex with Men IDU: Injection Drug User HRH: High-Risk Heterosexual NRR: No Reported Risk 61.8%, the highest among all risk groups. The single-year MSM rate, however has declined from 64.5% in 2013 to 61.8% in 2014. The downward trend in rates among MSM has been mirrored by a similar upward trend among persons with No Reported Risk (NRR), which has decreased from 17.5% in 2013 to 15.7% in 2014. Rates of HIV/AIDS prevalence and emergence differ sharply between Black Non-Hispanics and other racial/ethnic groups in Arizona. According to the 2014 single-year rates (Figure 6), the rate of HIV/AIDS emergence in Black Non-Hispanics have increased from 80% from 2010 to 2014. The 2014
  • 34.
    26 emergent HIV/AIDS rateamong Black Non-Hispanics in Arizona is 273% greater than the statewide average. These results are consistent with national data. The CDC estimates Black Non-Hispanics made up 46% of new 2011 HIV diagnoses despite composing only 12% of the overall population (CDC slide set, HIV Surveillance by race/ethnicity, through 2011 data http://www.cdc.gov/hiv/topics/surveillance/resources/slides/general/ index.ht). 2015 Survey of Newly Diagnosed Clients for Ryan White Parts A and B Since 2014, the HIV Prevention Program and Ryan White Part A and B Programs have collaborated on needs assessment activities. The 2015 Survey of Newly Diagnosed Clients was commissioned to gain a better understand 1) The experiences of individuals who have been recently diagnosed, and how organizational systems and processes enhanced or challenged their entry into care, 2) The client-centric issues (mindset, stigma, support systems, etc.) that enhanced or challenged entry-to-care for these individuals, 3) The knowledge/awareness/perceptions of HIV that these individuals had prior to being diagnosed, including a retrospective “hindsight” analysis of what changes in their knowledge, choices, actions, etc. might have minimized their risk of contracting HIV, and 4) How these individuals find, access and navigate systems of HIV care. Table 6 summarizes the results of this survey.
  • 35.
    27 Received Prior HIV Prevention Messages Knew anHIV+ Person Prior to Diagnosis Never Tested Before Diagnosis Diagnosis Location Know of PrEP Undetectable at Time of Survey Gender Male 67% 37% 48% 52% Clinic or HIV testing site 30% 52% Female 68% 11% 42% 42% Doctor’s Office 0% 79% Age Group 18 to 24 78% 22% 43% 57% Clinic or HIV testing site 30% 57% 25 to 44 56% 68% 40% 56% Clinic or HIV testing site 28% 72% 45 to 54 64% 36% 63% 55% Emergency Department/Hospital 0% 73% 55+ 83% 33% 50% 83% Doctor’s Office 0% 83% Race/Ethnicity White 64% 36% 29% 39% Clinic or HIV testing site 18% 64% Hispanic/Latino 62% 14% 38% 48% Clinic or HIV testing site 29% 57% African American or Black 65% 30% 39% 61% Clinic or HIV testing facility 30% 74% Native American 86% 29% 100% 43% Emergency Department/Hospital 0% 57% Asian/Pacific Islander 100% 0% 100% 100% Clinic or HIV testing site 0% 100% Risk Factor MSM 75% 38% 41% 59% Clinic or HIV testing site 41% 53% Heterosexual 68% 5% 50% 36% Clinic or HIV testing site 0% 82% IDU 50% 50% 50% 50% Doctor’s Office 50% Emergency Dept. 0% 50% TABLE 6 2015 Survey of Newly Diagnosed Clients for Ryan White Parts A and B
  • 36.
    28 The Arizona HIV CareContinuum The HIV Continuum of Care—sometimes also referred to as the HIV treatment cascade—is a model that is used by federal, state, and local agencies to identify issues and opportunities related to improving the delivery of services to people living with HIV across the entire continuum of care. The Arizona HIV Continuum of Care was created using data from eHARS (electronic HIV/AIDS Reporting System), an analysis of unmet needs, and ADAP (AIDS Drug Assistance Program) information. The definitions were agreed upon by the Arizona Regional Quality Group, composed of HIV Prevention, all Ryan White Parts in Arizona and HIV Surveillance. As shown in Figure 8, in 2014 there were 16,769 HIV infected individuals in Arizona: an estimated 1,641 who are unaware of their HIV status, and 16,769 individuals who have been diagnosed as being HIV positive. Of the 16,769 who are aware of their status, 10,590 were linked to care. Of that number, 8,105 are retained in care. 8,270 HIV positive individuals are on Antiretroviral Therapy. Finally, only 8,003 HIV positive individuals have an undetectable viral load. The percentages of HIV cases in Arizona, as shown in Figure 9, indicate just over half of all individuals diagnosed with HIV (aware of their HIV status) are linked to care (63%), but less than half (48%) are retained in care. 48% of individuals in Arizona who are aware of their HIV status have an undetectable viral load. When 100% of HIV positive Arizonans are linked to and retained in care, a greater number of individuals will be on Antiretroviral Therapy, which will increase the percentage of individuals with an undetectable viral load. Data suggest that HIV positive individuals with an undetectable viral load are less infectious, and are less likely to transmit HIV via sexual contact. Continuum of Care Definitions HIV-Diagnosed: Prevalent cases that have been diagnosed Linked to HIV Care: Prevalent cases with a documented lab test, doctor visit or medication use in the calendar year Incidence Linked to HIV Care: Incident cases for the year of the spectrum that were linked with a documented lab test, doctor visit or medication use within 90 days of their diagnosis, but not on the same day of the diagnosis. If a person has their first CD4, viral load or genotype on the same day as their diagnostic test the date of second CD4, viral load or genotype will be used as the linkage Retained in HIV Care: Prevalent cases with a documented lab test, doctor visit or antiretroviral (ARV) use in the first and second six months of the year On ARV Therapy: Prevalent cases with documented ARV use or whose last viral load of the calendar year was undetectable Adherent/Suppressed: Prevalent cases whose last viral load of the calendar year was undetectable (<200 C/mL)
  • 37.
    29 Continuum Disparities Arizona utilizesa diagnosed based continuum. Continuum definitions can be found to the left. All columns were evaluated utilizing the 2014 calendar year data and with one exception, include a denominator of all the 2014 clients in the eHARs data system. The HIV Surveillance Program has provided Arizona and regional continuum data dissected by race, gender, and risk. In evaluating the Arizona continuums, American Indians have some of the strongest outcomes with 85% of new cases linked and 60% virally suppressed. African American/Black and Hispanic populations report some of the lowest viral load suppression rates at 43% compared to 48% statewide. Men who have Sex with Men and Injection Drug User risk factors consistently scores the lowest with a linkage rate of 61%, retention rate of 45% and viral load suppression rate of 66%.The highest risk factor for viral load suppression is held by the Perinatal/Blood/Other group at 75%, followed by Men who have Sex with Men at 73%. 16769 10590 8105 80038270 541 of 762 FIGURE 8 2014 Arizona HIV Continuum of Care
  • 38.
    30 Ryan White Programshave supplemented Surveillance continuums with more frequent continuums developed by local CAREWare data. Currently, all Ryan White Programs in Arizona are collecting client lab values through Ryan White eligibility, or for Part C-hosted medical treatment. The Ryan White Programs have developed an Access database which translates CAREWare outcome reports to more easily graphed metrics. The Arizona Ryan White continuums are evaluated by race, gender, risk, housing, payer and service category. The continuums may be dissected by any of the Ryan White HIV/AIDS Program Services Report (RSR) data elements. Of interest are noted disparities among youth with 56% viral load suppression rates versus an 87% viral load suppression rate for adult males in RWPB/ADAP. Unstably housed report 67% viral load suppression rates compared to 92% among those stably housed. Among a review of race and ethnicity outcomes, viral load suppression rates range from 80% for African American/Black clients to 93% for Asian clients. FIGURE 9 Screenshot of Arizona Deep Dive Data Analysis Tool To further understand health disparities, the Arizona Regional Quality Group developed a “deep dive” tool (figure 10) to evaluate health disparities along the continuum. This group is composed of leadership and quality staff from all the Ryan White Programs in Arizona, and the HIV Prevention and HIV Surveillance Programs. This “deep dive” tool evaluates the statistical significance of various factors and translates the likelihood of retention and viral load suppression into a statement such as, “Youth are 1.75 times less likely to be retained in care than the average Ryan White
  • 39.
    31 client” or “Clientswith Ryan White as a primary payer are 3.4 times more likely to be retained and two times more likely to be virally suppressed than the average Ryan White client.” The tool identifies the p-value for each data element, and odds ratio. The Arizona Regional Quality Group has decided to focus on health outcomes for transgender (two times less likely to be retained, two times less likely to be virally suppressed) and youth (1.75 times less likely to be retained and 1.75 times less likely to be virally suppressed). Prevention and Care Programs are receiving CDC-provided technical assistant to design a transgender provider training and a transgender needs assessment for use in 2017. Continuum Planning The HIV Care Continuum is one of Arizona’s primary tools for measuring progress towards ending HIV through viral load suppression in Arizona. Recognizing the importance of comparable continuum data, the Arizona Regional Quality Group established statewide definitions and won a National Quality Award in 2015 for this collaborative regional quality group work. Continuum data has been heavily featured in both Annual HIV Symposiums. These Symposiums were attended by Planning Body members, staff from the HIV Prevention Program, Arizona Ryan White Programs, non-federally funded AIDS Service Organizations and community members. The HIV Prevention Program presented on the alignment of its activities across the care continuum, including promotion of routine HIV testing, and the use of evidence-based behavioral interventions to support treatment as prevention. Within the Ryan White Programs, local continuums are used to drive change at the sub-recipient level. During quarterly monitoring calls, Ryan White Part A and B sub-recipients are given an agency-specific continuums that benchmarks outcomes to the regional and state average. Agency- specific continuums include evaluation by race/ethnicity, age, housing status, and a variety of factors. To further impact the continuum, the Ryan White Programs will be developing related, client named reports to distribute to sub-recipients, so they can follow up on individuals who are not virally suppressed or retained in care. Analysis of continuum data is leading to a transgender assessment and youth focused activities in 2017.
  • 40.
    32 Due to thesharing of multiple sub-recipient agencies, the HIV Prevention Program and Ryan White Part B Program participate in joint quarterly monitoring calls for the 15 agencies funded outside of Maricopa and Pinal counties. The Ryan White Part A Quality Committee directs all sub- recipient quality improvement activities for linkage, retention or viral load suppression. The recently formed Ryan White Part B/HIV Prevention Program Quality Committee will soon guide similar quality initiatives. Some continuum-focused successes include a workgroup of the HIV Prevention Program, Maricopa County Department of Public Health, and the Ryan White Part A Program that implemented activities that decreased linkage to care timeframes from an average of 58 days to 32 days. Related processes have evaluated and streamlined required paperwork, adjusted client scheduling approaches, and guided increased allocation of resources for newly diagnosed clients. Continuum data is also being used to engage a larger, non-federally funded community. The Ryan White Part B Program is exploring opportunities to use rebate funds to help private HIV clinicians develop data reporting tools that would allow private clinicians to compare their practice to regional averages and Ryan White clinic performance. A group of private physicians have petitioned the Mayor of Phoenix to have the city designated as the 10th North American UNAIDS 90-90-90 Fast-Track City. The 90% aware, 90% retained, and 90% virally suppressed goals of the Fast-Track Cities Initiative is a variation of the continuum data that is being tweaked and integrated into the larger Integrated Plan framework. Due to the continuum’s ability to show the story of how the community is moving closer or further from the end of the HIV epidemic, development of a community facing ‘continuum report card’ is currently in the works.
  • 41.
    33 Financial and Human ResourcesInventory HIV Workforce Capacity and Impact on Prevention and Care Systems The Arizona HIV Workforce Capacity was ascertained by surveying providers statewide to determine present capacity and identify gaps in capacity. The workforce was identified as follows: HIV Specialists, Physicians, Nurse Practitioners, Physician Assistants, Registered Nurses, Licensed Practical Nurses, Medical Assistants, Nutritional Counselors, Psychiatrists, Psychologists, Licensed Clinical Social Workers, Medical Case Manager, Support Case Managers, Dentists, Dental Hygienists, and Administrative Support staff. The workforce impacts HIV prevention and care service delivery system by providing adequate availability of care and the quality of that care. Inadequate staffing could have a negative impact on services available to clients. Additional staff was identified as necessary and ways to address this issue are outlined in Table 8. Different funding sources interact via partnership between the Arizona Ryan White Programs, the HIV Prevention Program, local agencies and organizations, and providers working together to ensure services complement each other and are not duplicated. HIV Resources Inventory Arizona partners funded by the Health Services and Resources Administration, The Centers for Disease Control and Prevention, the Substance Abuse and Mental Health Services Administration, Housing Opportunities for Persons Living with AIDS, the National Institutes of Health, Indian Health Services, Arizona State Department of Health Service, and Arizona Medicaid, as well as those receiving from private sources, foundations, donations, and fees provided resource information via a comprehensive survey. Table 9 provides a high level summary of the $112,066,332 of HIV funding in Arizona. Table 10 identifies the services and correlation to phases of the continuum of care. Tables 11 to 16 detail the agency funding sources, Catalog of Federal Domestic Assistance numbers, dollar amounts per award or private funding source, and how the sources are being used. Detailed funding sources are located at the end of the Financial and Human Resources Inventory Section.
  • 42.
    34 Funding Source Interaction TheArizona Ryan White Programs and the HIV Prevention Programs grant participate in a monthly conference call to discuss collaborative issues, which include program updates, grant issues, and funding priorities. This regular meeting provides an opportunity for the recipients to share information on issues that may require assistance from the other Arizona programs. The Ryan White Part B program has availability of rebate funds Identified Need Number of Staff Number Providing HIV Care Additional Resources Identified by Participants HIV Specialist 23 23 16 Physician (non-HIV specialist) 21 17 14 Nurse Practitioner 24 18 14 Physician Assistant 22 18 13 Registered Nurse 24 19 14 Licensed Practical Nurse 20 16 13 Medical Assistant 23 19 14 Nutritional Counselor 22 16 15 Psychiatrist 19 17 13 Psychologist 22 18 13 Licensed Clinical Social Worker 18 15 15 Medical Case Manager 23 19 17 Support Case Manager 21 19 16 Dentist 20 16 13 Dental Hygienist 20 16 13 Administrative Support 26 19 15 TABLE 7 2016 HIV Workforce Capacity
  • 43.
    35 through the AIDSDrug Assistance Program, and has established mechanisms for the other Arizona recipients to request rebate funds for allowable HIV services that are needed, but not currently funded through grant funding. Several projects have been funded through rebate funds in 2015, including housing, medical services for newly diagnosed individuals, data system improvements, medical case management, trauma informed care training, and expanded core and support services. All of the recipients participate in the Arizona Regional Quality Group, which analyzes statewide and regional data. This collaboration has resulted in identification of gaps in service that may be resolved through additional funding. The Ryan White Part B, C and D Programs, the HIV Prevention Program, and Arizona’s Medicaid Program have representation on the Phoenix EMA Ryan White Planning Council, and these representatives participate in the Council’s annual Priority Setting and Resource Allocations process. Additionally, the Ryan White Part B and HIV Prevention Programs collaborate with the Las Vegas TGA Part A Program, which is responsible for funding HIV services in Mohave County, Arizona to ensure adequate funding is available for the needs of people living with HIV in this region. Needed Resources The Financial and HIV Workforce Capacity Inventories identified the following resources needed to meet the Statewide goal of ending the HIV epidemic by 2021. The Arizona recipients and sub-recipients will evaluate progress on improvement in each of these identified need areas on an annual basis as part of the monitoring and evaluation process outlined in the Integrated HIV Prevention and Care Plan. The Workforce Inventory Survey participants identified the following changes could assist in addressing workforce gaps: 53% improved reimbursement for clinical services, 48% additional state funding, 44% additional federal funding, and 20% other.
  • 44.
    36 Identified Need Stepsto Secure Resources Timeline Additional HIV Medical Providers Training and preceptorship by AETC 2017to 2021 Increased Federal Funding for HIV Prevention Annual needs assessment to identify priorities 2017 to 2021 Increased Federal Funding for HIV Services Annual Priority and Resource Setting Allocation process to identify priorities and funding levels 2017 to 2021 Improved Reimbursement Rate by Medicaid Continued discussion with Medicaid on establishing rates specific for HIV care and services 2017 to 2021 HIV Prevention and Service Needs Assessment Update needs assessment every two years 2017 to 2021 Increased Partner Services HIV Prevention Program to identify resources that could be allocated to increase partner services 2017 to 2021 Increased Number of Test Sites HIV Prevention Program in partnership with Ryan White Care Sites 2017 to 2021 Improved health literacy Ryan White Parts A and B to fund health literacy initiatives 2017 to 2021 Improved Treatment Adherence Ryan White Programs to evaluate as part of continuum focused activities 2017 to 2021 Increased Resources for Housing Ryan White Part B to meet with partners and identify resources 2017 to 2021 Education/Awareness campaigns for Underserved Populations HIV leadership to plan with community input 2017 to 2021 Provide Services in More Culturally Competent Manner Planning Bodies to inform cultural competency training. 2017 to 2021 TABLE 8 2016 HIV Workforce Capacity Additional Staff Needed and Steps to Secure Resources
  • 45.
  • 46.
  • 47.
  • 48.
  • 49.
  • 50.
  • 51.
  • 52.
  • 53.
  • 54.
  • 55.
  • 56.
    48 Assessing Needs, Gaps, andBarriers Process Description for Identifying HIV Prevention and Care Needs Since 2014, HIV Prevention and Ryan White Parts A and B have collaborated on the development of needs assessments. This partnership has informed assessment design, timing, and cross promotion of assessments. Prevention and Care assessments are both presented to the Statewide Advisory Group and Phoenix EMA Planning Council. The 2014 Arizona Statewide Needs Assessment for PWLHA was commissioned to provide consumer driven data with regard to needs, use, barriers, and gaps in care within the Phoenix, Arizona Eligible Metropolitan Area (Ryan White Part A) and the State (Ryan White Part B and HIV Prevention Programs). A total of 774 Arizona Ryan White clients responded to a survey as part of the assessment, representing 5% of the 2012 prevalence statistics for Arizona. In order to survey 5% of the population a framework was developed that defined the counts by region, gender, age, race/ethnicity, risk factor, and new diagnosis vs. ongoing diagnosis. All regions responded with surveys that met or exceeded their sample size. Findings were further detailed by six severe need groups: 1. Newly Diagnosed; 2. Men who have Sex with Men; 3. Hispanics; 4. African Americans/Blacks; 5: American Indians/Alaska Natives; and 6. Youth- Adolescence and Young Adults (age 13 to 24). Specific topics studied included an analysis of client level data to show the client utilization/impact of the Affordable Care Act, a final report and database of the survey data as a PowerPoint presentation, and Needs Assessment document with an Executive Summary in English and Spanish. Also included is a comparison of the current findings to prior reports and a stratification of data and findings by regions. The benefits of the needs assessment include: 1. Ability to integrate planning based on the findings of the 2014 Arizona Statewide Needs Assessment for people living with HIV (Barriers and Gaps in Care Continuum Completion) 2. Assessing the impact of Affordable Care Act implementation on people living with HIV receiving services in Arizona
  • 57.
    49 3. Analyzing findingsto inform Annual Priority Setting and Resource Allocation Process based on impact of Affordable Care Act 4. Creating a “Roadmap” for delivery of Ryan White services for Statewide HIV Care Continuum completion 5. Benchmarking Arizona to other states’ HIV Care Continuum and impact of Affordable Care Act 6. Using statewide data for policy decision makers to identify the continued/new role for Ryan White services 7. Updating client data to inform the Ryan White Program’s competitive grant applications, comprehensive plans and Statewide Coordinated Statement of Need; and 8. Utilizing data to inform HIV Prevention Program activities, based on information provided by Newly Diagnosed survey respondents. The report can be accessed at: http://www.maricopa.gov/rwpc/docs/ StatewideNeedsAssessment2014.pdf. The HIV Prevention Program conducted a statewide health prevention survey with the goal of improving health outcomes for Arizonans. 203 community members completed the needs assessment. The data was used to help guide targeted prevention programs throughout the state to help Arizonans live healthier lives. The assessment included internet surveys during November and December of 2015. Multiple methods for deploying the survey to the general public were used including flyers, emails, listserv, palm cards, and multiple organizational websites linking to the survey. Key interest areas were libraries, colleges and universities, local bars and night clubs, gay and lesbian organizations, and multiple social media streams such as Facebook, Grindr, Jack’d and Craigslist. The methodology for conducting this special study included the following areas: 1) documentation review; 2) data collection and analysis; and 3) the production of a final report. The data collection process utilized an online survey instrument that adhered to the topics determined and approved by the HIV Prevention Program. Also in this process, the partnering consultant created survey tools and scripts to evaluate the patterns of where newly HIV diagnosed clients might socialize and social media trends used to communicate and find sexual partners. The survey assessed sexual practices such as using alcohol during sexual encounters (46% responded often and sometimes). 25% reported using drugs during sexual
  • 58.
    50 encounters, 28% neverhave protected sex, and 47% hadn’t heard of Pre- Exposure Prophylaxis. These tools were closely linked to elements utilized by HIV Prevention Program staff as insights into the community’s sexual habits. This information will further guide Arizona’s strategies and will be used to develop targeted HIV prevention programs throughout the state. Strategies for Including Stakeholders and Participants That Reflect the HIV Epidemic The HIV Statewide Advisory Group (SWAG) and the Phoenix EMA Planning Council (Planning Council) have multiple members that represent people living with HIV and those at high risk for acquiring HIV. The Planning Council is composed of a diverse group of institutional, sub-recipient, and consumer members who provide guidance to the program on policy and priorities for all service categories and reflect the demographics of the local epidemic. The consumer members who serve on the Planning Council take an active role in identifying priorities on behalf of the community and participate in informing and educating the community on health issues. In 2015, the Planning Council and the SWAG hosted a Leadership Academy, designed to empower the community members of both Planning Bodies to take on expanded leadership roles in the community and among peers. The HIV Statewide Advisory Group (SWAG) has diverse makeup but fewer community members. The SWAG has supported community engagement by 1) hosting mobile meetings throughout Arizona to make it easier for clients and community members to participate in the planning process and 2) engaging sub-recipients to help recruit community members for the planning process. During community planning sessions, 22 potential partnering agencies were identified. Some of the agencies include the Arizona Alliance of Communities, one•n•ten youth groups, and the National Association of Social Workers. As part of the plan development, recipients identified a framework to host regional meetings two to three times a year, and solicit partner invitations in advance. During the regional meetings, participants will review evidence-based prevention and care practices for mental health, substance abuse, and homelessness, and select practices that would work for their community to begin planning implementation of selected practices. The regional meetings will likely be paired with a mobile town hall or other opportunity for local community engagement.
  • 59.
    51 The Arizona RyanWhite Program collaborate to share information gathered through their Community Advisory Boards and consumer surveys and incorporates this input into the planning process. These Boards meet regularly to discuss clinic initiatives, aggregate client outcomes, and give input on strategies to improve health for people living with HIV. Summary of Needs, Gaps and Barriers by Subpopulation The following is a summary of the top three needs, gaps and barriers for selected populations. “1” is the most significant need, gap, or barrier and “3” reflects the third most significant need, gap or barrier. Subpopulations were informed by the Early Identification of Individuals with HIV/AIDS (EIIHA) subpopulations and Arizona’s epidemiology reports. Additional analysis and subpopulations can be found in the full 2014 Needs Assessment Report at http://www.maricopa.gov/rwpc/docs/ StatewideNeedsAssessment2014.pdf. TABLE 17 HIV Prevention and Care Service Needs, Gaps and Barriers by Designated Populations
  • 60.
    52 Prevention and CareService Needs Figure 11 illustrates the three highest ranking need service categories for the Northern, Central and Southern Regions of Arizona. The assessment also evaluated condom distribution with recommendations to expand efforts with a social marketing campaign. The assessment reported participants would feel comfortable accessing condoms from their doctor/clinic (72%), HIV Organization (60%), Case Manager (49%), and Pharmacy (49%). In 2014, the HIV Prevention Program used this information to inform a creative Pharmacy-based free condom distribution program. FIGURE 10 Arizona Prevention and Care Needs Southern Region Needs 1.Outpatient/Ambulatory Medical Care 2.Medication Assistance 3.Nutrition Assistance Central Region Needs 1.Outpatient/Ambulatory Medical Care 2.Medication Assistance 3.Nutrition Assistance Northern Region Needs 1.Medication Assistance 2.Outpatient/Ambulatory Medical Care 3.Nutrition Assistance
  • 61.
    53 FIGURE 11 Service Gapsfor Prevention and Care In Arizona Southern Region Gaps 1.Vision Care 2.Transportation 3.Housing Assistance Central Region Gaps 1.Transportation 2.Housing Assistance 3.Nutrition Assistance Northern Region Gaps 1.Vision Care 2.Holistic/Alternative Therapy 3.Exercise Barriers to HIV Prevention In 2015, HIV Prevention and the Ryan White program conducted a needs assessment of individuals that had been newly diagnosed within the past year. This survey followed the participant through the continuum and identified demographic data, where participants receive their HIV information, continuum outcomes, HIV testing practices and knowledge of Pre-Exposure Prophylaxis (PrEP). Highlighted results can be found in Section 1. Notably, only 41% of respondents who identified as Men who have Sex with Men knew about PrEP. Stigma continues to be high—71% of the newly diagnosed report that they did not know anyone with HIV.
  • 62.
    54 The full reportcan be found at: http://www.maricopa.gov/rwpc/docs/ PhoenixEMA_Newly_Dx_Survey20Results_FINALREPORT_02292016.pdf. In a community assessment conducted by the HIV Prevention Program, which was predominantly completed by HIV negative individuals, 47% had not heard of PrEP in the past 12 months. Social and Structural Barriers Arizona experiences many of the common social and structural barriers as the census bureau reports that 18% of Arizonans are at or below 100% of the federal poverty level (FPL) and approximately 44% of Ryan White Part A and B clients are under 100% FPL. Arizona is 31% Latino, 5% African American/Black and 5% Native American. The Latino and African American communities face similar stigma and cultural challenges around homosexuality and HIV. The Latino population has faced challenges related to Arizona SB 1070 legislation, which was identified as one of the strictest anti-illegal immigration legislations of its time. Arizona’s sex education is predominantly limited to abstinence-only programs, and Arizona one of eight states that has banned schools from portraying “homosexuality as a positive alternative life-style… suggests that some methods of sex are safe methods of homosexual sex” AZ Rev. Stat. § 15-716(c). Homelessness The prevalence of homelessness is 1% to 2% among people living with HIV in the Central Region, although 34% cited they have ‘ever’ been homeless in the 2014 Comprehensive Statewide Needs Assessment . Over 65% of the homeless respondents report mental, physical, and/or substance abuse disabilities (Homeless in Arizona – Annual Report 2014). A Point-In-Time study conducted for the Housing and Urban Development grant determined Maricopa County has 8,000 chronically homeless individuals. Homelessness has been shown to result in premature mortality, with lifespans typically shortened by 25 years. Challenges with discontinuous care, significant co-morbidities including cardiac, podiatric, respiratory, and infectious disease processes often result in the homeless individuals using emergency departments for medical care. This use of emergency services costs and average of $39,000 per person annually. A Healthcare for the Homeless Program in Boston, Massachusetts tracked chronically homeless individuals for five years and determined their average medical cost per year was $28,346. In the 2014 Comprehensive Statewide Needs Assessment, 9% (n=49) of respondents report being currently homeless,
  • 63.
    55 9% (n=52) havebeen homeless in the past two years, but not now, and 16% (n=91) have been homeless over two years ago, but not now. It is noteworthy Phoenix is recognized as the first city in the nation to eradicate homelessness among veterans (HUD, 2014). Previous Incarceration Stigma associated with the formerly incarcerated often cloud individual’s prioritization of HIV medical care. Barriers to housing access, employment, transportation, and other base subsistence needs result in the inability to function without significant case management to clear these obstacles. These are often complicated by custody issues, and either past or current substance use, which led to their incarceration. Legal support is often required to assist this group. A total of 110 incarcerated/recently released persons were served by Ryan White Part A medical programs in 2014. Of those 110, 10 were new, 84 continuing, and 16 returning to care. In the 2014 Comprehensive Statewide Needs Assessment, 28 recently released HIV positive prisoners responded. This group listed Housing Assistance as their priority need and service. This was followed by a tie of numerous services including emergency financial assistance, oral health, transportation, non-HIV medications, and vision care. Backgrounder 2014 found 20% of inmates in jails and 15% of inmates in state prisons have serious mental illness. Social instability, depression, as well as other mental illnesses including anxiety disorders is associated with difficulty adhering to anti-retroviral therapy. Serious Mental Illness According to the 2014 Comprehensive Statewide Needs Assessment, 64% of clients surveyed stated that they had received mental or behavioral health services since HIV diagnosis. More than 50% of people with Major Depression, the most prevalent treatable mental illness, have not been clinically diagnosed. For people living with HIV who have been evaluated for Major Depressive Disorder, at least half are inadequately or not treated. This is particularly true for individuals with triple diagnoses (mental illness, substance use disorder, and HIV) who demonstrate poor clinical outcomes. Underlying mental illness among those with HIV is a significant barrier to entering drug treatment. Serious mental illness results in average costs of $14,000 per year. The Agency for Healthcare Research and Quality cites a cost of $57.5 billion in 2006 for mental health care in the US, equivalent to the cost of cancer care. Unlike cancer, much of the economic
  • 64.
    56 burden of mentalillness is not the cost of care, but the loss of income due to unemployment, expenses for social supports, and a range of indirect costs due to a chronic disability which begins early in life (NIMH, 2011). Substance Abuse Substance abuse, in particular IV-injection drugs, contributes to the spread of the epidemic when users trade sex for drugs or money, or when they engage in risky sexual behaviors they might not engage in when sober. Mohave County, which has shared service delivery among the HIV Prevention Program, Arizona Ryan White Part B Program, and Las Vegas TGA Ryan White Part A Program was flagged by the Centers for Disease Control and Prevention as a potential place for an HIV and Hepatitis Outbreak, due to high injection drug use in the area. Two particular drugs of concern in the Central Region include use of crystal methamphetamine, particularly among Men who have Sex with Men, and growing dependence on illegal prescription drugs. The Central Region rate of 18% injection drug use among people living with HIV is lower than the 22% national rate in 2011 (Source: Center for Disease Control & Prevention, IDU Fact Sheet). Hepatitis C In the 2010 Needs Assessment 21% of the 500 survey respondents reported a history of, or treatment for Hepatitis C. In the 2014 Needs Assessment 15% of the 578 survey respondents reported a history of, or treatment for Hepatitis C. While Hepatitis C is now curable due to pharmaceutical advancements, the $100,000 average cost per client is extremely prohibitive. In July 2015, the Arizona AIDS Drug Assistance Program (ADAP) became the first ADAP in the nation to cover Hepatitis C treatment medications for all ADAP-eligible clients in Arizona. Although Arizona does not have any legal barriers or regulations regarding who may test and how to offer counseling, the testing of pregnant women continues to be opt-in, which requires additional steps on the part of the tester and tested. Arizona’s Ryan White Part D Program staff helped 18 of 21 hospitals throughout Maricopa and Pinal Counties establish protocols for testing of high-risk pregnant women and treatment for any found positives. The Ryan White Part C Program in Maricopa county conducted a multi-part campaign to educate the community when HIV testing in the Maricopa County Hospital’s Emergency Room transitioned to an opt-out model. The Ryan White program has worked with ADHS’s Border Health Office, the Arizona Mexico Commission, and the Maricopa County Sheriff’s
  • 65.
    57 Department to identifycommunity needs around access to and retention in care of HIV positive undocumented individuals. An HIV indicator is integrated in the US-Mexico health plan. Health Department Barriers The Arizona Department of Health Services continues to operate under a hiring freeze for all non mission-critical staff. The hiring freeze is extended to employees and contract staff. The other Arizona Ryan White Programs do not have the same limitations. Infrastructure at the sub-recipient agencies is well established. Technical assistance is provided on an ongoing and as- needed basis. Program Barriers Arizona Department of Health Services shares data under the Arizona Public Health Law and does not consider the Ryan White Program a HIPAA covered entity. This has created some challenges with sharing of Ryan White data between the state and some of the HIV clinics. Data sharing agreements are being discussed. Service Provider Barriers The Integrated HIV Prevention and Care Plan identifies opportunities to further include private physicians, community groups, and additional stakeholders. Integrating planning into a large symposium model was successful in engaging 225 individuals in the planning process. Participating stakeholders include rural and urban clinicians, federally funded service providers, Planning Body members, and community members. With input from 1042 clients and a conservatively estimated 2,692 man-hours from key stakeholders, the 2017 to 2021 Integrated HIV Prevention and Care Plan is the most inclusive HIV-specific plan completed within Arizona. To further extend the reach, the HIV Statewide Advisory Group is developing 1) business cases and tools to communicate the value of HIV prevention and care programs, and 2) a call to action for our new partners which will move the community closer to the audacious goal of ending HIV in Arizona.
  • 66.
    58 FIGURE 12 Client-Identified Barriersfor HIV Prevention and Care Needs Southern Region Barriers 1.Transportation 2.Oral Health Care 3.Vision Care Central Region Barriers 1.Vision Care 2.Housing Assistance 3.Medication Assistance Northern Region Barriers 1.Transportation 2.Support Groups (tie) Insurance (tie) Specialty Doctors (tie) Vision Care (tie)
  • 67.
    59 Data: Access, Sources AndSystems Main Data Sources Arizona continuum data is based on the eHARS data collected through lab feeds. Local Ryan White continuum data is collected through CAREWare. Ryan White Parts A and B have separate, parallel CAREWare systems and share the same CAREWare consultant. Both systems require viral load data as part of a client’s six month eligibility renewal. The lab data is entered into CAREWare and can be accessed through CAREWare’s Health Resources and Services Administration and HIV/AIDS Bureau performance reports, or custom reports. These reports are then manipulated through a separate access database that allows generation of continuum reports comparing regional and state averages. This data can also be bisected by data collected for Ryan White reporting needs or other CAREWare data. Additional data is collected through:  Patient Reporting Investigation Surveillance Manager (PRISM): PRISM provides a unique approach, and robust technical architecture to complete real-time monitoring of HIV/STD disease burden, identification of emerging outbreaks, monitoring and assurance of appropriate treatments, and quality of data for epidemiologic analysis and reporting. The Arizona HIV Prevention and STD Control Programs use PRISM to collect data related to disease investigation and partner services activities.  CAREWare Data: The Ryan White Programs have a robust CAREWare system that allows for analysis beyond required Ryan White reporting, including costs per client service at aggregate and agency levels, multitude of custom reports, eligibility status, and communication  Use of a Central Eligibility model and web application tools has been effective in supporting compliance to RSR data elements  Qualitative Data from client feedback surveys and needs assessments  Surveillance Data compiled by the HIV Surveillance Program
  • 68.
    60 Data Policies thatFacilitate/Serve as a Barrier Arizona may be the last state in the country that does not legally mandate the reporting of virally suppressed HIV labs. The Arizona Surveillance program is working closely with the Rule-Writing Committee and anticipates a public comment period soon and implementation in 2017. The program currently receives almost all of the reports because an inclusive batch process has been preferred by the lab companies. Arizona continues to work with its legal team to review Ryan White Part B’s status as an uncovered entity and data sharing agreement opportunities with local partners. An established data sharing agreement will be fundamental to establishment of any integrated data systems to support linkage to care and service coordination for newly diagnosed individuals. Data Desired by Planning Groups That Was Unavailable The Prevention and Care programs have an overwhelming amount of data and data analysis available for discussion. During the process, an intentional effort was made to minimize the paperwork and data provided, while having all the data resources available on a thumb drive if any questions arose. One debated data element was the use of aspirational versus realistic objective measures and the associated costs required to reach either measure. During the planning process, a detailed analysis identified it could cost $32 million for Arizona to reach the 90% awareness of positive HIV status goal set by the National HIV/AIDS Strategy. The mathematical modeling of the costs and potential impact was challenging to identify for all the goals and objectives. Ultimately the planning bodies decided to keep the national goals and targets with a local decision to either increase or decrease the impacted area by an undeclared amount.
  • 69.
  • 70.
    62 An Inclusive, Collaborative PlanningProcess How People Involved in Planning Are Reflective the Local Epidemic The 2017 to 2021 Integrated HIV Prevention and Care Plan is the most inclusive planning effort ever undertaken by Arizona’s HIV community. Participants in the planning process represent all target populations identified in each region, and a diverse array of program partners and key stakeholders. Participation of Planning Body Members More than 60 Planning Body members and guests contributed 1,209 man hours to developing local activities and resources for the regional plans. Members from both Planning Bodies have attended each others’ planning meetings. Multiple regional planning sessions occurred, with Planning Body members travelling to each region to meet with stakeholders. How People Living with HIV Contributed to the Plan People living with HIV participated in all four stages of planning. A statewide needs assessment was completed by 5% of all people living with HIV in Arizona. Foundational data was also collected from high risk negatives. People living with HIV were included in HIV Symposium and Planning Body activities over the past two years. The Phoenix EMA Ryan White Planning Council and HIV Statewide Advisory Group each meet the federal mandates for representation of people living with HIV and affected community members. Each Planning Body has regular stakeholder attendance at meetings. Community Participation in HIV Symposium Planning Sessions Arizona HIV Programs co-host 2-day HIV symposiums each year. The second day of these symposiums is been dedicated to planning. More than 225 unduplicated consumers, providers, stakeholders, Ryan White Program recipients and sub-recipients, and others contributed 1,483 man hours to HIV planning. In the first year, this group identified 1) What needs to happen in the next five years to end the HIV epidemic in Arizona? and
  • 71.
    63 2) What arethe barriers that might stop us from achieving this audacious goal? In the second year, the Symposium participants voted for regional goals and objectives, and then worked in teams to identify strategies and activities. Community Participation in Prevention and Care Needs Assessments Arizona’s HIV Programs continue to identify and reach out to populations disproportionately impacted by HIV. Statewide assessments are completed every three years, along with yearly regional assessments of target populations. Additional input is gathered at Planning Body and community advisory board meetings, at community events, and from focus groups and client feedback surveys.  774 people living with HIV informed the 2014 statewide needs assessment on needs, gaps and barriers across the prevention and care continuum. This represents 5% of all people living with HIV in Arizona  203 community members participated in an HIV prevention assessment, sharing information about sexual habits, STD testing practices and knowledge of Pre-Exposure Prophylaxis  65 Newly Diagnosed individuals reflected on their experiences being tested for HIV, coping with receiving their diagnosis, and getting linked to medical care People at high risk for contracting HIV are engaged in yearly needs assessments conducted by the HIV Prevention Program, The HIV Prevention Program has also established work groups to guide social marketing initiatives and service delivery. Participants of the work groups include representatives of people living with HIV, people at-risk for acquiring HIV, human equity groups, youth groups, English and Spanish- language media entities, non-elected community leaders, and non-federally funded partners. Participation of Program Leadership The development of the Integrated HIV Prevention and Care Plan was guided by the Program leads for the HIV Prevention Program, Arizona’s Ryan White Programs, the Arizona AIDS Education and Train Center and the HIV Surveillance and STD Control Programs, in collaboration with the Planning Body Chairs. Many of these programs are lead by or employ people living with HIV.
  • 72.
    64 How Impacted CommunitiesWill Remain Engaged in Planning and Provide Critical Insight Into Developing Solutions Arizona considers the integrated Plan a living document that will evolve with continued input from impacted communities. The HIV Statewide Advisory Group and the Phoenix EMA Ryan White Planning Council will be implementing a variety of community engagement methods, above and beyond collection of needs assessment data and recruitment to Planning Bodies. Some of the methods include:  Mobile town halls throughout Arizona (two to three per year)  Client/Community member orientation sessions  Graphic facilitation of community engagement sessions  Use of internet-based feedback solutions, such as social media engagement, online surveys, webinars, etc. Stakeholders and Partners Who Were Not Involved in the Planning Process, But Who are Needed During the planning process, an additional 22 agencies and special interest groups were identified by participants for future inclusion in planning efforts. These entities include the Arizona Alliance of Community Health Centers, Black Chamber of Commerce, youth leadership from the Black Lives Matter – Tucson chapter, and Latino Clinic Amistades, among others. The HIV Prevention and Ryan White Part B Programs are to develop Region -specific communication strategies utilizing new and traditional media to educate the public on HIV prevention and care initiatives and the progress of the Integrated HIV Prevention and Care Plan, and promote engagement of new individuals in planning efforts.
  • 73.
  • 74.
    66 Stakeholder Group Contributionsto Plan Development People Living with HIV  774 individuals (5% of all of Arizona’s people living with HIV) participated in 2014 needs assessment identifying needs, gaps, and barriers  65 newly diagnosed individuals were surveyed about their HIV testing and linkage to care experiences  Planning Bodies include people living with HIV as both members and public participants. These individuals contributed to all Planning Body activities related to Plan development  Government entities and community-based organizations hire people living with HIV, and many have HIV positive leadership  Participated in Symposium planning Community Members  203 people participated in HIV Prevention-focused assessments  Multiple community members on both Planning Bodies Non-traditional Partner Agencies  Multiple non-government funded agencies participated in Symposium Planning  Human Equity Groups have informed HIV Prevention and Care Planning, and have facilitated relationship building with community leadership to begin planning and implementing initiatives to address HIV in communities of color  Cox and Univision, two large media entities, and print/radio/online media partners have promoted HIV initiatives to the public, and reported on HIV issues  Representatives of media companies, news and lifestyle magazines/newspapers, radio, and social media/marketing have participated in work groups to guide HIV-related social marketing initiatives HIV Statewide Advisory Group  Oversaw the completion of comprehensive statewide needs assessments  Participated in the planning and presentation of annual HIV Symposium planning sessions  Review, revise and finalize all strategies and activities for Arizona’s Regional plans  Statewide Advisory Group leadership travelled to take part in planning sessions that occurred outside of metropolitan Phoenix Phoenix EMA Ryan White Planning Council  Oversaw the completion of comprehensive statewide needs assessment of people living with HIV and Ryan White clients, in collaboration with other HIV Prevention and Care Programs  Participated in both Symposium planning sessions  Responsible for the development of care-centric strategies and activities for the Central Region plan HIV Prevention Program  Co-designed comprehensive statewide needs assessments of people living with HIV and high risk, impacted communities  Co-wrote the Plan. Lead partner for integrating all community and planning body input into the Regional Plans  Co-hosted the HIV Symposiums  Contributed data for the Statewide Coordinated Statement of Need Phoenix EMA Ryan White Part A Program  Lead the small government leadership team for the Integrated Plan  Co-designed comprehensive statewide needs assessments of people living with HIV and high risk populations  Co-wrote the Plan. Lead for the Financial and Human Resources Inventory  Co-hosted the HIV Symposiums  Contributed data for the Statewide Coordinated Statement of Need
  • 75.
    67 Stakeholder Group Contributionsto Plan Development Arizona Ryan White Part B Care and Services Program  Co-designed comprehensive statewide needs assessments of people living with HIV and high risk, impacted communities  Co-wrote the Plan. Lead program for the development of the Statewide Coordinated Statement of Need  Co-hosted the HIV Symposiums  Contributed data for the Statewide Coordinated Statement of Need  Supports allowable programs with rebate funds throughout Arizona Arizona Ryan White Part C Programs  Co-designed comprehensive statewide needs assessments of people living with HIV and high risk, impacted communities  Co-hosted the HIV Symposiums  Contributed data for the Statewide Coordinated Statement of Need  Supported Central and Southern Region activities to inform planning efforts Arizona Ryan White Part D Program  Co-designed comprehensive statewide needs assessments of people living with HIV and high risk, impacted communities  Co-hosted the HIV Symposiums  Contributed data for the Statewide Coordinated Statement of Need  Supported Central Region activities to inform planning efforts Arizona AIDS Education and Training Center  Provided HIV training to stakeholders engaged in the development of the Plan  Coordinated Southern Region stakeholder engagement and planning sessions  Participated in the Financial and HIV Workforce Capacity Survey  Membership on the HIV Statewide Advisory Group  Provided technical assistance during Plan development  Conducted a Pre-Exposure Prophylaxis readiness assessment of providers and consumers Arizona Regional Quality Group  Participated in HIV Symposiums  Participated in the regional plan writing  Approved the statewide definitions for use in the continuums developed by HIV Surveillance  Regularly monitor health outcomes for all Arizona Ryan White Programs Last Vegas TGA Ryan White Part A Program  Supported Northern Region Needs Assessment activities, and conducted regional focus groups to inform planning efforts  Participated in HIV Symposium planning sessions  Solicited feedback from Las Vegas medical providers and community-based organizations related to the medical care and supportive service needs of Mohave county clients accessing care in Las Vegas HIV Surveillance Program  Co-wrote the Plan. Lead program for conducting an epidemiology overview  Developed and continuum data for the Plan  Participated in HIV Symposium planning sessions  Assisted with cost analysis for achievement of outcomes STD Control Program  Participated in HIV Symposium planning sessions  Assisted with cost analysis for achievement of outcomes  Developed data capture and export methodologies, to provide data for planning
  • 76.
    68 Stakeholder Group Contributionsto Plan Development Community Health Centers  Participated in the Financial and HIV Workforce Capacity Survey  Representatives have joined both Planning Bodies  Federally Qualified Health Center (FQHC) and FQHC look-a-like participation in HIV Symposiums  Southern Community Health Centers have hosted local community sessions for developing the integrated plan Medicaid  Membership on the Phoenix EMA Ryan White Planning Council  Provided data for the Statewide Coordinated Statement of Need  Participated in Financial and HIV Workforce Capacity Survey  Allocates resources for HIV medications for eligible clients in the community Medicare  Participated in Financial and HIV Workforce Capacity Survey  Allocates resources for HIV medications for eligible clients in the community Veterans Health Administration  Contributed to Statewide Coordinated Statement of Need  Allocates resources for HIV medications for eligible clients in the community Housing and Urban Development  Representation on the Planning Bodies  Actively participated in the development of the plans for the Central and Southern Regions  Participated in the Financial and HIV Workforce Capacity Survey  Allocates resources for HIV medications for eligible clients in the community
  • 77.
  • 78.
    70 NORTHERN ARIZONA TheNorthern Region Target Populations  Men who have Sex with Men (MSM), especially youth and MSM of Color  Hispanics, regardless of gender  American Indians, regardless of gender  Injection Drug Users Activity Highlights  Implementation of Pre-Exposure Prophylaxis (PrEP) Engagement Assistance programming, and efforts to increase consumer use of PrEP  Increased collaboration with mental health/substance abuse providers  Increased HIV testing, and diversification of HIV testing locations, including opt-out HIV testing in hospital settings  Strengthening of partnerships with providers, correctional facilities, and hospital systems to improve linkage to care timeframes  Evaluation and implementation of innovative linkage to care/retention in care service models specific adapted to rural communities The Northern Region includes Mohave, Coconino, Yavapai, Gila, Navajo, and Apache counties. This region is 47,890 square miles, with a population of 792,935 in 2014. Much of the Northern Region is tribal land and/or national forest, and is largely rural outside of the cities of Flagstaff, Prescott and Sedona. Major HIV issues in the Northern Region include rural health care delivery concerns and disparities, transportation, stigma, limited service delivery areas by county and other health departments or providers due to population density, and access to resources. Federally- funded HIV prevention and care services in Mohave county are provided by both the HIV Prevention Program, the Arizona Ryan White Part B Program, and the Las Vegas TGA Ryan White Part A Program. The 2015 Arizona Department of Health Services Epidemiology Report shows the Northern Region had 12% of the state population, 7% of the new HIV cases, and 6% of the ongoing HIV cases. 2015 census data for Northern Arizona reports a higher percentage of Native Americans than the other two Regions, particularly in Apache County (74%), Navajo County (45%), and Coconino County (27%). CONTINUUM OF CARE DEFINITIONS HIV-Diagnosed: Prevalent cases that have been diagnosed Linked to HIV Care: Prevalent cases with a documented lab test, doctor visit or medication use in the calendar year Incidence Linked to HIV Care: Incident cases for the year of the spectrum that were linked with a documented lab test, doctor visit or medication use within 90 days of their diagnosis, but not on the same day of the diagnosis. If a person has their first CD4, viral load or genotype on the same day as their diagnostic test the date of second CD4, viral load or genotype will be used as the linkage Retained in HIV Care: Prevalent cases with a documented lab test, doctor visit or antiretroviral (ARV) use in the first and second six months of the year On ARV Therapy: Prevalent cases with documented ARV use or whose last viral load of the calendar year was undetectable Adherent/Suppressed: Prevalent cases whose last viral load of the calendar year was undetectable (<200 C/mL)
  • 79.
    NORTHERN ARIZONA 71 In2014, HIV incidence dropped to 39 (22 case reduction from previous year), while prevalence increased by 64, indicating that at least 25 HIV positive people who were not diagnosed in Northern Arizona moved into the region. Review of continuum data in Figure 15 by race/ethnicity shows that African American/Black clients in Northern Arizona have the highest viral load suppression at 57%, followed by American Indians/Alaskan Natives at 54%. Latinos have the lowest rates of linkage (55%) and viral load suppression (44%). In Figure 17, the most frequently reported risk factors for Northern Arizona are Men who have Sex with Men (319 people), Injection Drug Users (207 people), and Men who have Sex with Men who are Injection Drug Users (98 people). FIGURE 13 2014 Northern Arizona HIV Continuum of Care 676 331 424 345 353 26 of 31
  • 80.
    72 NORTHERN ARIZONA FIGURE14 2014 Northern Arizona HIV Continuum of Care by Race/Ethnicity FIGURE 15 2014 Northern Arizona HIV Continuum of Care by Gender
  • 81.
    NORTHERN ARIZONA 73 FIGURE16 2014 Northern Arizona HIV Continuum of Care by Risk Category KEY MSM: Men who have Sex with Men IDU: Injection Drug User HRH: High-Risk Heterosexual NRR: No Reported Risk TABLE 18 Comparison of Northern Region Incidence and Prevalence Totals by Year Year Prevalence Incidence 2005 562 44 2006 606 27 2007 652 42 2008 706 39 2009 740 40 2010 747 45 2011 795 36 2012 896 33 2013 939 61 2014 1003 39
  • 82.
    74 NORTHERN ARIZONA TABLE19 Northern Arizona Regional Incidence 2009 to 2013 Emergent HIV Emergent AIDS Emergent HIV & AIDS Cases % State Total Rate Per 100,000 Cases % State Total Rate Per 100,000 Cases % State Total Rate Per 100,000 By Gender Male 100 46.5 5.16 82 38.1 4.23 182 84.7 9.40 Female 22 10.2 1.12 11 5.1 0.56 33 15.3 1.67 TOTAL 122 56.7 3.12 93 43.3 2.38 215 100.0 5.50 By Age Under 2 0 0.0 0.00 0 0.0 0.00 0 0.0 0.00 2 to 12 0 0.0 0.00 0 0.0 0.00 0 0.0 0.00 13 to 19 1 0.5 0.27 1 0.5 0.27 2 0.9 0.53 20 to 24 18 8.4 6.82 6 2.8 2.27 24 11.2 9.09 25 to 29 25 11.6 12.16 11 5.1 5.35 36 16.7 17.51 30 to 34 14 6.5 7.35 8 3.7 4.20 22 10.2 11.56 35 to 39 17 7.9 8.94 12 5.6 6.31 29 13.5 15.25 40 to 44 12 5.6 5.77 13 6.0 6.25 25 11.6 12.02 45 to 49 19 8.8 7.79 9 4.2 3.69 28 13.0 11.48 50 to 54 7 3.3 2.52 11 5.1 3.96 18 8.4 6.48 55 to 59 6 2.8 2.10 11 5.1 3.86 17 7.9 5.96 60 to 64 2 0.9 0.70 6 2.8 2.11 8 3.7 2.82 65 and Above 1 0.5 0.13 5 2.3 0.66 6 2.8 0.79 Age Unknown 0 0.0 NA 0 0.0 NA 0 0.0 NA TOTAL 122 56.7 3.12 93 43.3 2.38 215 100.0 5.50 By Race/Ethnicity White Non-Hispanic 46 21.4 1.81 38 17.7 1.49 84 39.1 3.30 Black Non-Hispanic 3 1.4 6.61 4 1.9 8.81 7 3.3 15.42 Hispanic 11 5.1 2.13 8 3.7 1.55 19 8.8 3.68 *A/PI/H Non-Hispanic 1 0.5 2.27 0 0.0 0.00 1 0.5 2.27 **AI/AN Non-Hispanic 58 27.0 7.65 41 19.1 5.41 99 46.0 13.06 ***MR/O Non-Hispanic 3 1.4 NA 2 0.9 NA 5 2.3 NA TOTAL 122 56.7 3.12 93 43.3 2.38 215 100.0 5.50 By Mode of Transmission + MSM 52 24.2 NA 44 20.5 NA 96 44.7 NA ++ IDU 26 12.1 NA 13 6.0 NA 39 18.1 NA MSM / IDU 13 6.0 NA 14 6.5 NA 27 12.6 NA Heterosexual 17 7.9 NA 4 1.9 NA 21 9.8 NA +++ O/H/TF/TPR 0 0.0 NA 0 0.0 NA 0 0.0 NA ++++ NRR/UR 14 6.5 NA 18 8.4 NA 32 14.9 NA TOTAL 122 56.7 3.12 93 43.3 2.38 215 100.0 5.50 * Asian Pacific/Islander/Hawaiian + Men having Sex with Men ++++ No Reported Risk/Unknown Risk ** American Indian/Alaskan Native ++ Injection Drug Use *** Multiple Race/Other Race +++ Other/Hemophilia/Transfusion and Blood Products/Transplant Recipient
  • 83.
    NORTHERN ARIZONA 75 TABLE20 Northern Arizona Prevalence 2014 Prevalent HIV Prevalent AIDS Prevalent HIV & AIDS Cases % State Total Rate Per 100,000 Cases % State Total Rate Per 100,000 Cases % State Total Rate Per 100,000 By Gender Male 346 34.5 88.62 473 47.2 121.5 819 81.7 209.77 Female 90 9.0 22.69 94 9.4 23.70 184 18.3 46.40 TOTAL 436 43.5 55.40 567 56.5 72.04 1003 100.0 127.44 By Age Under 2 0 0.0 0.00 0 0.0 0.00 0 0.0 0.00 2 to 12 1 0.1 0.97 1 0.1 0.97 2 0.2 1.93 13 to 19 6 0.6 8.32 2 0.2 2.77 8 0.8 11.09 20 to 24 17 1.7 31.17 5 0.5 9.17 22 2.2 40.34 25 to 29 27 2.7 64.08 14 1.4 33.23 41 4.1 97.31 30 to 34 35 3.5 87.33 26 2.6 64.87 61 6.1 152.20 35 to 39 36 3.6 96.54 39 3.9 104.58 75 7.5 201.12 40 to 44 66 6.6 163.28 62 6.2 153.38 128 12.8 316.66 45 to 49 62 6.2 139.40 107 10.7 240.58 169 16.8 379.98 50 to 54 81 8.1 149.99 111 11.1 205.55 192 19.1 355.54 55 to 59 53 5.3 91.13 101 10.1 173.66 154 15.4 264.80 60 to 64 25 2.5 42.77 58 5.8 99.23 83 8.3 141.99 65 and Above 27 2.7 16.39 41 4.1 24.89 68 6.8 41.29 Age Unknown 0 0.0 NA 0 0.0 NA 0 0.0 NA TOTAL 436 43.5 55.40 567 56.5 72.04 1003 100.0 127.44 By Race/Ethnicity White Non-Hispanic 267 26.6 52.44 337 33.6 66.19 604 60.2 118.64 Black Non-Hispanic 16 1.6 161.68 18 1.8 181.89 34 3.4 343.57 Hispanic 46 4.6 43.19 57 5.7 53.51 103 10.3 96.70 *A/PI/H Non-Hispanic 8 0.8 84.45 6 0.6 63.34 14 1.4 147.79 **AI/AN Non-Hispanic 90 9.0 59.21 142 14.2 93.42 232 23.1 152.63 ***MR/O Non-Hispanic 9 0.9 NA 7 0.7 NA 16 1.6 NA TOTAL 436 43.5 55.40 567 56.5 72.04 1003 100.0 127.44 By Mode of Transmission + MSM 216 21.5 NA 284 28.3 NA 500 49.9 NA ++ IDU 67 6.7 NA 86 8.6 NA 153 15.3 NA MSM / IDU 46 4.6 NA 89 8.9 NA 135 13.5 NA Heterosexual 57 5.7 NA 70 7.0 NA 127 12.7 NA +++ O/H/TF/TPR 6 0.6 NA 6 0.6 NA 12 1.2 NA ++++ NRR/UR 44 4.4 NA 32 3.2 NA 76 7.6 NA TOTAL 436 43.5 55.40 567 56.5 72.04 1003 100.0 127.44 * Asian Pacific/Islander/Hawaiian + Men having Sex with Men ++++ No Reported Risk/Unknown Risk ** American Indian/Alaskan Native ++ Injection Drug Use *** Multiple Race/Other Race +++ Other/Hemophilia/Transfusion and Blood Products/Transplant Recipient
  • 84.
    76 NORTHERN ARIZONA GOAL1: INCREASE ACCESS TO CARE AND IMPROVE HEALTH OUTCOMES FOR PEOPLE LIVING WITH HIV. Objective 1: Increase the percentage of people living with HIV who know their serostatus to at least 90%. Strategy 1: Community Engagement 1.1.1.1 Establish a formalized processes to engage state, county and tribal entities, local providers and community stakeholders in ongoing dialog and collaboration to improve HIV services. Explore digital methods to conduct this activity. Metric: Establishment of formalized processes Lead Program: HIV Statewide Advisory Group Partners: HIV Prevention Program, Ryan White Part B Program, Arizona AIDS Education and Training Center, State/County Entities, Tribal Entities, Community-Based Organizations, Community Stakeholders Start/End: 2018 to 2021 1.1.1.2 Annually present at least one consumer-centric, culturally responsible training designed to engage clients in medical care and supportive services. Activities should be offered using both traditional methods (support groups, peer mentoring, provider talks, etc.) and digital methods (online forums, video webinars, etc.). Metric: At least one training is presented each year Lead Program: HIV Prevention Program Partners: Ryan White Part B Program, State/County Entities, Tribal Entities, Indian Health Service, Community-Based Organizations, Community Stakeholders Start/End: 2017 to 2019
  • 85.
    NORTHERN ARIZONA 77 Strategy1: Community Engagement continued 1.1.1.3 Engage additional community partners to promote HIV testing/medical care. Metric: The number of additional community partners engaged each year Lead Program: HIV Prevention Program Partners: Ryan White Part B Program, State/County Entities, Tribal Entities, Indian Health Service, Community-Based Organizations, Community Stakeholders Start/End: 2017 to 2019 1.1.1.4 Increase the number of medical providers offering HIV testing as a routine part of care for all clients. Metric: The number of additional medical providers engaged in routine HIV testing each year Lead Program: Ryan White Part B Program Partners: Ryan White Part B Program, State/County Entities, Tribal Entities, Indian Health Service, Community-Based Organizations, Community Stakeholders Start/End: 2017 to 2021
  • 86.
    78 NORTHERN ARIZONA GOAL1: INCREASE ACCESS TO CARE AND IMPROVE HEALTH OUTCOMES FOR PEOPLE LIVING WITH HIV. Objective 1: Increase the percentage of people living with HIV who know their serostatus to at least 90%. Strategy 2: Education 1.1.2.1 Annually, develop and implement at least one social marketing initiative using new media (online ads, in-app ads, etc.) to reach target populations which are designed to engage individuals to be tested for HIV and/or enter medical care. Metric: The implementation of at least one social marketing initiative each year Lead Program: HIV Prevention Program Partners: Ryan White Programs, HIV Prevention Program, State/County Entities, Tribal Entities, Arizona AIDS Education and Training Center, Community-Based Organizations, Community Stakeholders Start/End: 2017 to 2021 1.1.2.2 Biannually, provide at least one regional training for primary medical providers that includes information on HIV, extra-genital STD screening, and retention in care. Metric: At least one training completed every two years Lead Program: Arizona AIDS Education and Training Center Partners: Ryan White Part B Program, State/County Entities, Tribal Entities, Local Medical Providers, HIV Prevention Program, Community-Based Organizations Start/End: 2018 to 2020
  • 87.
    NORTHERN ARIZONA 79 GOAL1: INCREASE ACCESS TO CARE AND IMPROVE HEALTH OUTCOMES FOR PEOPLE LIVING WITH HIV. Objective 1: Increase the percentage of people living with HIV who know their serostatus to at least 90%. Strategy 3: Prevention, Testing & Linkage to Care 1.1.3.1 Engage Flagstaff Medical Center to implement semi-targeted opt-out HIV testing in their emergency department. (semi-targeted: patients at risk, have clinical indications). Metric: Opt-out testing implemented at Flagstaff Medical Center; the number of tests conducted each year Lead Program: Coconino County Health Department Partners: HIV Prevention Program, Ryan White Part B Program, Flagstaff Medical Center, Medical Providers, Arizona AIDS Education and Training Center, Maricopa Integrated Health System Start/End: 2018 to 2021 1.1.3.2 Conduct new, innovative initiatives to improve accessibility to free HIV testing, focusing on getting never-tested people tested. Initiatives might include home test kit delivery, expanded outreach testing, etc. Metric: The number of initiatives implemented each year; the number of new HIV tests each year Lead Program: HIV Prevention Program Partners: Ryan White Part B Program, Arizona AIDS Education and Training Center, State/County Entities, Tribal Entities, Community-Based Organizations Start/End: 2018 to 2021 1.1.3.3 Implement same-day supplemental/confirmatory testing among testing providers, to decrease the time from diagnosis-lab-first medical appointment. Metric: Same-day supplemental/confirmatory testing implemented Lead Program: HIV Prevention Program Partners: Ryan White Part B Program, Arizona AIDS Education and Training Center, State/County Entities, Tribal Entities, Community-Based Organizations Start/End: 2017 to 2020
  • 88.
    80 NORTHERN ARIZONA Strategy1: Prevention, Testing & Linkage to Care continued 1.1.3.4 Annually, develop and implement at least one PrEP-focused social marketing initiative focused on target populations, designed to engage individuals to become educated and engaged in PrEP. Metric: The implementation of at least one social marketing initiative each year Lead Program: HIV Prevention Program Partners: Ryan White Programs, HIV Prevention Program, State/County Entities, Tribal Entities, Community-Based Organizations Start/End: 2017 to 2021 1.1.3.5 Establish the provision of PrEP Evaluation Assistance services by at least two Northern Arizona community-based organizations. PrEP Evaluation Assistance is designed to educate and engage high-risk HIV negative people in the use of Pre-Exposure Prophylaxis as an HIV Prevention Method. Metric: PrEP Evaluation Assistance offered by at least two organizations; utilization and engagement in PrEP monitored and evaluated Lead Program: HIV Prevention Program Partners: Ryan White Programs, State/County Entities, Tribal Entities, Community-Based Organizations Start/End: 2017 to 2021 1.1.3.6 Increase the number of medical providers educated on HIV/PrEP, and ultimately prescribing PrEP, by one provider per year. Metric: The number of providers educated about PrEP, and the prescribing PrEP each year Lead Program: Arizona AIDS Education and Training Center Partners: Ryan White Programs, HIV Prevention Program, State/County Entities, Tribal Entities Start/End: 2017 to 2021
  • 89.
    NORTHERN ARIZONA 81 GOAL1: INCREASE ACCESS TO CARE AND IMPROVE HEALTH OUTCOMES FOR PEOPLE LIVING WITH HIV. Objective 2: Increase the percentage of newly diagnosed persons linked to HIV medical care within one month of their HIV diagnosis to at least 85%. Strategy 1: Funding 1.2.1.1 Increase the availability of support services that assist clients to attend their first medical appointment and lab services. Metric: Increased availability of support services Lead Program: Ryan White Part B Program Partners: Community-Based Organizations Start/End: 2017 to 2021 1.2.1.2 Expand Affordable Care Act benefits navigation services. Metric: Increase in the number of entities providing benefits navigation services Lead Program: Ryan White Part B Program Partners: State/County Entities, Tribal Entities, Community-Based Organizations Start/End: 2017 to 2019 1.2.1.3 Provide community-based organizations with technical assistance regarding grant writing, sustainability, billing capacity, etc. Metric: The number of technical assistance opportunities requested and provided Lead Program: HIV Prevention Program Partners: Ryan White Part B Program, Arizona AIDS Education and Training Center Start/End: 2017 to 2021
  • 90.
    82 NORTHERN ARIZONA GOAL1: INCREASE ACCESS TO CARE AND IMPROVE HEALTH OUTCOMES FOR PEOPLE LIVING WITH HIV. Objective 2: Increase the percentage of newly diagnosed persons linked to HIV medical care within one month of their HIV diagnosis to at least 85%. Strategy 2: Patient-Centered Care 1.2.2.1 Annually, provide at least one training for Ryan White sub-recipients, community-based organizations, and other service providers, focusing on such topics as cultural competency, health equity, disclosure of HIV diagnosis, and/or CLAS training. Explore opportunities to collaborate with other local training opportunities to increase participation. A self- appraisal should be implemented prior to each training. Metric: Presentation of at least one training opportunity each year Lead Program: Ryan White Part B Program Partners: HIV Prevention Program, Arizona AIDS Education and Training Center, State/County Entities, Tribal Entities, Community-Based Organizations, Medical Providers Start/End: 2017 to 2021 1.2.2.2 Annually, implement at least one social marketing initiative to educate clients about seeking HIV care from knowledgeable, culturally appropriate providers, and the ability to switch providers for more comprehensive care. Metric: At least marketing initiative implemented each year Lead Program: HIV Prevention Program Partners: Ryan White Part B Program, Arizona AIDS Education and Training Center, State/County Entities, Tribal Entities, Aunt Rita’s Foundation, Community-Based Organizations Start/End: 2017 to 2021
  • 91.
    NORTHERN ARIZONA 83 Strategy2: Patient-Centered Care continued 1.2.2.3 Create and distribute resources for providers that define step-by-step processes to link HIV positive clients to care, focusing on clients being linked from private medical providers, correctional facilities, emergency departments, and behavioral health/recovery centers. Include promotion of HIVAZ.org as an educational and referral resource. Metric: The step-by-step guide is published and available in traditional and electronic formats Lead Program: Ryan White Part B Program Partners: HIV Prevention Program, Arizona AIDS Education and Training Center, State/County Entities, Tribal Entities, Community-Based Organizations, Medical Providers, Behavioral Health/Substance Use Providers Start/End: 2018to 2019 1.2.2.4 Increase the number of providers offering HIV services in Northern Arizona, including providers offering services via telemedicine. Metric: The number of new providers offering services in Northern Arizona Lead Program: Arizona AIDS Education and Training Center Partners: Ryan White Part B Program, State/County Entities, Tribal Entities, Community-Based Organizations, Medical Providers Start/End: 2018 to 2021 1.2.2.5 Develop and distribute client self-advocacy resources in traditional and electronic formats. Metric: The resources are developed and distributed throughout the community Lead Program: HIV Statewide Advisory Group Partners: HIV Prevention Program, Ryan White Part B Program, State/County Entities, Tribal Entities, Community-Based Organizations, Community Stakeholders Start/End: 2017 to 2021
  • 92.
    84 NORTHERN ARIZONA GOAL1: INCREASE ACCESS TO CARE AND IMPROVE HEALTH OUTCOMES FOR PEOPLE LIVING WITH HIV. Objective 2: Increase the percentage of newly diagnosed persons linked to HIV medical care within one month of their HIV diagnosis to at least 85%. Strategy 3: Streamline Processes 1.2.3.1 Develop methodologies to improve the delivery and success of Early Intervention Services. Metric: Methodologies are defined, implemented and evaluated Lead Program: Ryan White Part B Program Partners: State/County Entities, Tribal Entities, Northern Arizona Healthcare Providers Start/End: 2018 to 2019 1.2.3.2 Establish a common enrollment application for Ryan White Programs, including an online enrollment portal. Metric: Completion of the online enrollment portal and policies and procedures Lead Program: Ryan White Part B Program Partners: Ryan White Programs Start/End: 2017 to 2018 1.2.3.3 Develop reporting methodologies to accurately determine linkage to care timeframes. Metric: The reporting methodologies are developed and utilized Lead Program: Ryan White Part B Program Partners: HIV Prevention Program, HIV Surveillance Program, State/County Entities, Tribal Entities, Northern Arizona Healthcare Providers, Community-Based Organizations Start/End: 2017 to 2019
  • 93.
    NORTHERN ARIZONA 85 GOAL2: INCREASE ACCESS TO CARE AND IMPROVE HEALTH OUTCOMES FOR PEOPLE LIVING WITH HIV. Objective 1: Increase the percentage of newly diagnosed persons linked to HIV medical care within one month of their HIV diagnosis to at least 85%. Strategy 1: Prevention, Testing & Linkage to Care 2.1.1.1 Annually, present at least one HIV testing and linkage to care training, designed to increase dialog among providers to reduce linkage to care timeframes. Metric: At least one training is presented each year Lead Program: Arizona AIDS Education and Training Center Partners: Ryan White Part B Program, HIV Prevention Program, State/County Entities, Tribal Entities, Northern Arizona Healthcare Providers, Community-Based Organizations Start/End: 2017 to 2021 2.1.1.2 Identify and evaluate HIV testing, linkage to care, and engagement in care models that have proven successful when implemented in rural areas.. Metric: Identification of service delivery models; evaluation of these models for implementation Lead Program: HIV Prevention Program Partners: Ryan White Part B Program, State/County Entities, Tribal Entities, Medical Providers, Community-Based Organizations, Northern Arizona University Start/End: 2018 to 2021 2.1.1.3 Increase collaboration with substance abuse agencies in northern Arizona to increase HIV testing and linkage to care, and referrals to/from HIV services and substance Abuse programs. Metric: The number of collaborations established. Lead Program: Coconino County Health Department Partners: Ryan White Part B Program, State/County Entities, Tribal Entities, Community-Based Organizations, Substance Abuse Providers Start/End: 2017 to 2021
  • 94.
    86 NORTHERN ARIZONA Strategy1: Prevention, Testing & Linkage to Care continued 2.1.1.4 Develop and implement an annual community-based initiative to promote HIV awareness, testing/linkage to care, and engagement in care that is culturally and linguistically appropriate. Metric: At least one initiative implemented each year; yearly assessment data demonstrating improved knowledge of HIV awareness, use of HIV testing/linkage to care services, and increased engagement in care Lead Program: HIV Prevention Program Partners: Ryan White Part B Program, State/County Entities, Tribal Entities, Community-Based Organizations, Community Stakeholders Start/End: 2017 to 2021
  • 95.
    NORTHERN ARIZONA 87 GOAL2: INCREASE ACCESS TO CARE AND IMPROVE HEALTH OUTCOMES FOR PEOPLE LIVING WITH HIV. Objective 1: Increase the percentage of newly diagnosed persons linked to HIV medical care within one month of their HIV diagnosis to at least 85%. Strategy 2: Streamline Processes 2.1.2.1 Develop and implement activities designed to improve communication between healthcare agencies serving American Indians, state/county entities, healthcare organizations, and community-based organizations. Metric: Activities are developed and implemented, and evaluated annually Lead Program: Ryan White Part B Program Partners: County/State Entities, Tribal Entities, Indian Health Service, Northern Arizona Healthcare Providers, Community-Based Organizations Start/End: 2017 to 2021 2.1.2.2 Clearly identified care navigation processes for all communities. Metric: The navigation processes for each community in the region are defined; processes are distributed in traditional and electronic form Lead Program: Ryan White Part B Program Partners: County/State Entities, Tribal Entities, Indian Health Service, Northern Arizona Healthcare Providers, Community-Based Organizations Start/End: 2018 to 2019 2.1.2.3 Integrate HIV case management services with services offered by mental health and substance abuse providers. Metric: Successful integration of HIV case management services by mental health and substance abuse providers Lead Program: Ryan White Part B Program Partners: County/State Entities, Tribal Entities, Indian Health Service, Northern Arizona Healthcare Providers, Community-Based Organizations, NARBHA Start/End: 2017 to 2019
  • 96.
    88 NORTHERN ARIZONA Strategy2: Streamline Processes continued 2.1.2.4 Identify substance abuse providers and engage them in collaborative efforts to implement an integrated care team approach (internal and external partnerships) to provide comprehensive services that promote access to care and retention in care. Metric: The number of substance abuse providers that adapt an integrated care team approach Lead Program: Arizona AIDS Education and Training Center Partners: Ryan White Part B Program, HIV Prevention Program, Substance Abuse/Behavioral Health Providers, Northland Cares Start/End: 2017 to 2019 2.1.2.5 Beginning in 2018, and then annually, provide training for community health workers/ promotoras on HIV testing, prevention and linkage to care. Metric: The number of trainings provided each year Lead Program: Arizona AIDS Education and Training Center Partners: Ryan White Programs, HIV Prevention Program, Community-Based Organizations Start/End: 2018 to 2021
  • 97.
    NORTHERN ARIZONA 89 GOAL2: INCREASE ACCESS TO CARE AND IMPROVE HEALTH OUTCOMES FOR PEOPLE LIVING WITH HIV. Objective 1: Increase the percentage of newly diagnosed persons linked to HIV medical care within one month of their HIV diagnosis to at least 85%. Strategy 3: Patient-Centered Care 2.1.3.1 Implement a standardized referral process that institutes culturally competent, “warm” referrals between service providers. Metric: The implementation of a standardized referral process Lead Program: Ryan White Part B Program Partners: HIV Prevention Program, County/State Entities, Tribal Entities, Substance Abuse/ Behavioral Health Providers, Correctional Facilities, Community-Based Organizations Start/End: 2017 to 2021 2.1.3.2 Annually, provide at least one training for healthcare and community-based providers that addresses issues such as cultural competency, motivational interviewing, trauma-informed care, treatment adherence etc. Training may be provided in-person or online. Metric: At least one competency training is provided each year. Lead Program: Arizona AIDS Education and Training Center Partners: Ryan White Part B Program, HIV Prevention Program, County/State Entities, Tribal Entities, Community-Based Organizations Start/End: 2017 to 2021 2.1.3.3 Assess the needs of newly diagnosed clients that have co-occurring issues, such as homeless or substance abuse issues. Develop action items based on the evaluation of the assessment Metric: The completion of the assessment; development of action items Lead Program: Ryan White Part B Program Partners: HIV Prevention Program, County/State Entities, Tribal Entities, Community-Based Organizations Start/End: 2018 to 2019
  • 98.
    90 NORTHERN ARIZONA Strategy3: Patient-Centered Care continued 2.1.3.4 Evaluate the capacity of service organizations to enable clients to receive medical and supportive service appointments at their home or other convenient location, when feasible. As an alternative, evaluate the need and ability to provide increased access to transportation services. Metric: Capacity to provide offsite medical and supportive service appointments is evaluated; the need and ability to provide increased transportation services is evaluated; action items developed Lead Program: Ryan White Part B Program Partners: State Entities, Tribal Entities, Community-Based Organizations Start/End: 2018 to 2019
  • 99.
    NORTHERN ARIZONA 91 GOAL2: INCREASE ACCESS TO CARE AND IMPROVE HEALTH OUTCOMES FOR PEOPLE LIVING WITH HIV. Objective 2: Increase the percentage of persons with diagnosed HIV infection who are retained in care to at least 90%. Strategy 1: Patient-Centered Care 2.2.1.1 Identify and evaluate health team models/strategies that would be effective in rural communities. Metric: Models and/or strategies identified and evaluated; action items developed Lead Program: Ryan White Part B Program Partners: Arizona AIDS Education and Training Center, HIV Prevention Program, County/State Entities, Tribal Entities, Community-Based Organizations Start/End: 2019 to2020 2.2.1.2 Assess people living with HIV, at-risk individuals, in target populations, and providers to inform HIV planning, service delivery, and quality improvement initiatives. Metric: The assessment is completed and evaluated; action items are developed Lead Program: Ryan White Part B Program Partners: HIV Prevention Program, State/County Entities, Tribal Entities, Community-Based Organizations, Community Stakeholders Start/End: 2018 to 2019
  • 100.
    92 NORTHERN ARIZONA GOAL2: INCREASE ACCESS TO CARE AND IMPROVE HEALTH OUTCOMES FOR PEOPLE LIVING WITH HIV. Objective 2: Increase the percentage of persons with diagnosed HIV infection who are retained in care to at least 90%. Strategy 2: Funding 2.2.2.1 Evaluate retention-in-care service delivery and funding to include community outreach services. Metric: Service delivery and funding evaluated Lead Program: Ryan White Part B Program Partners: HIV Prevention Program, County/State Entities, Tribal Entities, Community-Based Organizations Start/End: 2018 to 2019 2.2.2.2 Conduct an assessment of the capacity building opportunities for community-based organizations and providers seeking to diversify their funding sources. Metric: Completion of the assessment Lead Program: Ryan White Part B Program Partners: HIV Prevention Program, County/State Entities, Tribal Entities, Community-Based Organizations Start/End: 2017 to 2019 2.2.2.3 Compile data from multiple sources, including continuums of care specific to each target population, to justify the need for funding, and disseminate this information to community partners. Metric: Completion of needs assessment, Key informant interviews Lead Program: Ryan White Part B Program Partners: HIV Prevention Program, County/State Entities, Tribal Entities, Indian Health Service, Arizona AIDS Education and Training Center Start/End: 2017 to 2019
  • 101.
    NORTHERN ARIZONA 93 GOAL2: INCREASE ACCESS TO CARE AND IMPROVE HEALTH OUTCOMES FOR PEOPLE LIVING WITH HIV. Objective 2: Increase the percentage of persons with diagnosed HIV infection who are retained in care to at least 90%. Strategy 3: Data Standardization 2.2.3.1 Reduce paperwork among community providers by establishing a universal enrollment and data-sharing process for non-Ryan White services. Metric: Completion of the universal enrollment process Lead Program: Ryan White Part B Program Partners: Community-Based Organizations Start/End: 2018 to 2019 2.2.3.2 Evaluate the feasibility of implementing a shared data system for prevention and care services, that includes linkage to care information. Metric: An implementation evaluation is completed; action items are developed Lead Program: Ryan White Part B Program Partners: HIV Prevention Program, County/State Entities, Tribal Entities, Community-Based Organizations Start/End: 2017 to 2020
  • 102.
    94 NORTHERN ARIZONA GOAL3: REDUCE HIV-RELATED DISPARITIES AND HEALTH INEQUALITIES. Objective 1: Increase the percentage of people living with HIV who know their serostatus to at least 90%. Strategy 1: Stigma Reduction 3.1.1.1 Conduct an assessment of the HIV knowledge, stigma, behaviors, education and service needs of local target populations most at-risk for contracting HIV, and people who are living with HIV. Metric: Assessment completed Lead Program: HIV Statewide Advisory Group Partners: HIV Prevention Program, Ryan White Part B Program, Arizona AIDS Education and Training Center, State/County Entities, Tribal Entities, Community-Based Organizations Start/End: 2017 to 2019 3.1.1.2 Establish partnerships with community stakeholders and entities that serve target populations to develop and implement strategies to address multiple types of stigma (individual, family, friends, providers, culture, etc.). Metric: The establishment of partnerships Lead Program: HIV Prevention Program Partners: Ryan White Part B Program, Arizona AIDS Education and Training Center, State/County Entities, Tribal Entities, Community-Based Organizations, Community Stakeholders Start/End: 2017 to 2021
  • 103.
    NORTHERN ARIZONA 95 GOAL3: REDUCE HIV-RELATED DISPARITIES AND HEALTH INEQUALITIES. Objective 1: Increase the percentage of people living with HIV who know their serostatus to at least 90%. Strategy 2: Community Engagement 3.1.2.1 Biannually, develop and implement at least one initiative to decrease negative perceptions of HIV and HIV testing. Metric: At least one initiative implemented every two years Lead Program: HIV Prevention Program Partners: Ryan White Part B Program, County/State Entities, Tribal Entities, Community-Based Organizations, Community Stakeholders Start/End: 2017 to 2019 3.1.2.2 Collaborate with American Indian communities to develop culturally appropriate sexual health education and HIV messaging materials. Metric: The development of materials Lead Program: HIV Prevention Program Partners: Arizona AIDS Education and Training Center, County/State Entities, Tribal Health Entities, Indian Health Service Start/End: 2018 to 2020
  • 104.
    96 NORTHERN ARIZONA GOAL3: REDUCE HIV-RELATED DISPARITIES AND HEALTH INEQUALITIES. Objective 1: Increase the percentage of people living with HIV who know their serostatus to at least 90%. Strategy 3: Funding 3.1.3.1 Identify and evaluate methodologies for providers to modify the way they offer HIV/STD/ Hepatitis prevention and care services to create opportunities for third-party billing. Metric: Methodologies identified and evaluated for implementation; action items developed Lead Program: HIV Prevention Program Partners: Ryan White Part B Program, County/State Entities, Tribal Entities, Community-Based Organizations Start/End: 2017 to 2019 3.1.3.2 Identify opportunities to combine programmatic resources to create efficiencies in contracting, improve service integration, and reduce duplication of effort and/or competition for funding. Metric: Successful identification and implementation of new opportunities for efficiency Lead Program: Ryan White Part B Program Partners: HIV Prevention Program, State/County Entities, Tribal Entities, Community-Based Organizations Start/End: 2017 to 2019 3.1.3.3 Assess opportunities to provide free/low cost services for people living with HIV who have co-infections that need to be addressed. Metric: Assessment completed; action items developed Lead Program: HIV Prevention Program Partners: County/State Entities, Tribal Health Entities, Community-Based Organizations Start/End: 2018 to 2019
  • 105.
    NORTHERN ARIZONA 97 GOAL4: ACHIEVE A MORE COORDINATED RESPONSE TO THE HIV EPIDEMIC. Objective 1: Increase the percentage of people living with HIV who know their serostatus to at least 90%. Strategy 1: Community Engagement 4.1.1.1 Recruit people living with HIV and other stakeholders to become to become leaders, advocates, planners and peer mentors for the local HIV community. Metric: The number of people recruited for community leadership each year Lead Program: HIV Statewide Advisory Group Partners: HIV Prevention Program, Ryan White Part B Program, County/State Entities, Tribal Entities, Youth Organizations, Community-Based Organizations Start/End: 2017 to 2018 4.1.1.2 Annually, provide at least one leadership development, advocacy, and other training for HIV community leaders. Metric: At least one training provided each year Lead Program: HIV Statewide Advisory Group Partners: HIV Prevention Program, Ryan White Part B Program, County/State Entities, Tribal Entities, Youth Organizations, Community-Based Organizations Start/End: 2018 to 2021
  • 106.
    98 NORTHERN ARIZONA GOAL4: ACHIEVE A MORE COORDINATED RESPONSE TO THE HIV EPIDEMIC. Objective 1: Increase the percentage of people living with HIV who know their serostatus to at least 90%. Strategy 2: Prevention, Testing & Linkage to Care 4.1.2.1 Develop and implement activities that support the integration of comprehensive sexual health services as a routine part of care, including routine HIV/STD/Hepatitis testing. Metric: The development and implementation of activities Lead Program: HIV Prevention Program Partners: Ryan White Part B Program, Arizona AIDS Education and Training Center, County/State Entities, Tribal Entities, Community-Based Organizations Start/End: 2018 to 2021 4.1.2.2 Coordinate HIV/STD/Hepatitis testing services to ensure equity of service delivery among diverse providers, and appropriateness of services delivered to various age groups and target populations. Metric: The number and types of collaborative activities Lead Program: HIV Prevention Program Partners: Ryan White Part B Program, County/State Entities, Tribal Entities, Community-Based Organizations Start/End: 2018 to 2021
  • 107.
    NORTHERN ARIZONA 99 GOAL4: ACHIEVE A MORE COORDINATED RESPONSE TO THE HIV EPIDEMIC. Objective 1: Increase the percentage of people living with HIV who know their serostatus to at least 90%. Strategy 3: Education 4.1.3.1 Annually, provide at least one fact-based, culturally and linguistically appropriate HIV education opportunity to youth aged 13 to 19, and/or organizations serving youth. Metric: The presentation of one education opportunity each year; the number of youth participants Lead Program: HIV Prevention Program Partners: Ryan White Part B Program, Northern Arizona Providers, County/State Entities, Tribal Entities, Youth Organizations, Community-Based Organizations Start/End: 2017 to 2018 4.1.3.2 Establish a partnership with the Office of Women’s and Children’s Health reproductive health program to include HIV education and testing as a part of its programming. Metric: Partnership established Lead Program: HIV Prevention Program Partners: Ryan White Part B Program, State/County Entities Start/End: 2017 to 2021 4.1.3.3 Establish a partnership with the Northern Arizona Regional Behavioral Health Authority to include HIV education and testing as a part of its programming. Metric: Partnership established Lead Program: HIV Prevention Program Partners: Ryan White Part B Program, State/County Entities, Northern Arizona Regional Behavioral Health Authority Start/End: 2017 to 2021
  • 108.
    100 NORTHERN ARIZONA Strategy3: Education continued 4.1.3.4 Establish a partnership with the University/Colleges to include HIV education as a part of its educational programming. Metric: Partnership established Lead Program: HIV Prevention Program Partners: Ryan White Part B Program, State/County Entities Start/End: 2017 to 2021
  • 109.
    NORTHERN ARIZONA 101 GOAL4: ACHIEVE A MORE COORDINATED RESPONSE TO THE HIV EPIDEMIC. Objective 2: Increase the percentage of newly diagnosed persons linked to HIV medical care within one month of their HIV diagnosis to at least 85%. Strategy 1: Prevention, Testing and Linkage to Care 4.2.1.1 Increase referrals for HIV testing, prevention and linkage to care services from substance abuse providers. Metric: An increase in the number of referrals Lead Program: Ryan White Part B Program Partners: State/County Entities, Substance Abuse Service Providers, Community-Based Organizations Start/End: 2017 to 2021
  • 110.
    102 NORTHERN ARIZONA GOAL4: ACHIEVE A MORE COORDINATED RESPONSE TO THE HIV EPIDEMIC. Objective 2: Increase the percentage of newly diagnosed persons linked to HIV medical care within one month of their HIV diagnosis to at least 85%. Strategy 2: Streamline Processes 4.2.2.1 Develop capacity for substance abuse and behavioral health services to obtain SAMHSA funding assistance for HIV prevention and care services. Metric: The provision of capacity building assistance Lead Program: HIV Prevention Program Partners: County/State entities, Tribal Health entities, Substance abuse/Behavioral Health Services Providers, Community-Based Organizations Start/End: 2018 to 2020
  • 111.
  • 112.
    104 CENTRAL ARIZONA TheCentral Region Target Populations  Men who have Sex with Men (MSM), especially youth and MSM of Color  Hispanics, regardless of gender  African Americans/Blacks, regardless of gender  Transgender Individuals Activity Highlights  Implementation of Pre-Exposure Prophylaxis (PrEP) Engagement Assistance programming, and efforts to increase consumer use of PrEP  Increased HIV testing, and diversification of HIV testing locations, including opt-out HIV testing in hospital settings  Form reduction and process improvements to reduce duplication of effort among funding sources  Quality improvement initiatives designed to reduce linkage to care timeframes  Consumer and provider training related to stigma reduction, cultural competency, and client empowerment  Social marketing initiatives to increase HIV testing and awareness, PrEP engagement, and engagement in care The Central Region is comprised of Maricopa and Pinal counties, and had an estimated population of 4,489,109 in 2014. Federally-funded HIV prevention and care services in the Central Region are provided by the HIV Prevention Program, and Ryan White Part A, B, C and D Programs. The region is 14,566 square miles. The Central Region includes Phoenix, the state’s capitol, which is the sixth most populated city in America at more than 1,563,025 people in 2015. Pinal County is mostly rural. The Central Region accounts for more than 70% of the state’s HIV incidence and prevalence. Major HIV issues affecting the Central Region include ethnic/ racial disparities, especially within the Black community, stigma, lack of sexual health education in schools, and access to care issues. The Central Region defines the geographic service delivery area for the Phoenix EMA Ryan White Part A Program. Ryan White Parts B, C and D, and the HIV Prevention Program also provide services in the Region. CONTINUUM OF CARE DEFINITIONS HIV-Diagnosed: Prevalent cases that have been diagnosed Linked to HIV Care: Prevalent cases with a documented lab test, doctor visit or medication use in the calendar year Incidence Linked to HIV Care: Incident cases for the year of the spectrum that were linked with a documented lab test, doctor visit or medication use within 90 days of their diagnosis, but not on the same day of the diagnosis. If a person has their first CD4, viral load or genotype on the same day as their diagnostic test the date of second CD4, viral load or genotype will be used as the linkage Retained in HIV Care: Prevalent cases with a documented lab test, doctor visit or antiretroviral (ARV) use in the first and second six months of the year On ARV Therapy: Prevalent cases with documented ARV use or whose last viral load of the calendar year was undetectable Adherent/Suppressed: Prevalent cases whose last viral load of the calendar year was undetectable (<200 C/mL)
  • 113.
    CENTRAL ARIZONA 105 The2015 Arizona Department of Health Services Epidemiology Report shows the Central Region had 67% of the state population and 74% of the new HIV cases and 75% of the ongoing HIV cases. Census data from 2015 shows that Central Arizona reports approximately a quarter of people are under 18 years old. The percentage of HIV positive Whites (84%) and Latinos (31%) closely mirror the general state population rates. There is a higher percentage of African Americans/Blacks in Maricopa County (6% vs. statewide average of 5%) and a lower percent of Native Americans (3%) when compared to the statewide average of 5%. In 2014, there were 608 new HIV cases (an increase of 85 cases), while prevalence increased by 192 cases, suggesting an influx of previously diagnosed people living with HIV to the Central Region. FIGURE 17 2014 Central Region HIV Continuum of Care 12196 7574 5945 6530 360 of 516 5711
  • 114.
    106 CENTRAL ARIZONA Reviewof continuum data in Figure 20 by race/ethnicity shows that American Indians/Alaskan Native clients in the Central Region have the highest viral load suppression at 86%, followed by Hispanics at 72%. Latinos have the lowest rates of linkage to care (58%), and Blacks and Asians have the lowest rates of viral load suppression (45%). In Figure 21, the most frequently reported risk factors for the Central Region are Men who have Sex with Men (7,492 people), Injection Drug Users (2,101 people) and High Risk Heterosexuals (1,283 people). FIGURE 18 2014 Central Region HIV Continuum of Care by Race/Ethnicity
  • 115.
    CENTRAL ARIZONA 107 FIGURE19 2014 Central Region HIV Continuum of Care by Gender Year Prevalence Incidence 2005 562 44 2006 606 27 2007 652 42 2008 706 39 2009 740 40 2010 747 45 2011 795 36 2012 896 33 2013 939 61 2014 1003 39 TABLE 21 Comparison of Central Region Incidence and Prevalence Totals by Year
  • 116.
    108 CENTRAL ARIZONA FIGURE20 2014 Central Region HIV Continuum of Care By Risk Category KEY MSM: Men who have Sex with Men IDU: Injection Drug User HRH: High-Risk Heterosexual NRR: No Reported Risk
  • 117.
    CENTRAL ARIZONA 109 TABLE22 Central Arizona Regional Incidence 2009 to 2013 Emergent HIV Emergent AIDS Emergent HIV & AIDS Cases % State Total Rate Per 100,000 Cases % State Total Rate Per 100,000 Cases % State Total Rate Per 100,000 By Gender Male 1544 63.1 14.35 595 24.3 5.53 2139 87.4 19.89 Female 230 9.4 2.13 77 3.1 0.71 307 12.6 2.84 TOTAL 1774 72.5 8.23 672 27.5 3.12 2446 100.0 11.35 By Age Under 2 4 0.2 0.65 0 0.0 0.00 4 0.2 0.65 2 to 12 14 0.6 0.40 0 0.0 0.00 14 0.6 0.40 13 to 19 71 2.9 3.40 5 0.2 0.24 76 3.1 3.64 20 to 24 343 14.0 23.07 41 1.7 2.76 384 15.7 25.83 25 to 29 353 14.4 22.33 81 3.3 5.12 434 17.7 27.45 30 to 34 257 10.5 16.62 92 3.8 5.95 349 14.3 22.57 35 to 39 228 9.3 15.40 95 3.9 6.42 323 13.2 21.82 40 to 44 189 7.7 12.92 108 4.4 7.38 297 12.1 20.30 45 to 49 138 5.6 9.71 79 3.2 5.56 217 8.9 15.27 50 to 54 87 3.6 6.39 89 3.6 6.53 176 7.2 12.92 55 to 59 57 2.3 4.76 34 1.4 2.84 91 3.7 7.60 60 to 64 21 0.9 1.93 31 1.3 2.85 52 2.1 4.79 65 and Above 12 0.5 0.44 17 0.7 0.62 29 1.2 1.06 Age Unknown 0 0.0 NA 0 0.0 N/A 0 0.0 NA TOTAL 1774 72.5 8.23 672 27.5 3.12 2446 100.0 11.35 By Race/Ethnicity White Non-Hispanic 736 30.1 5.80 314 12.8 2.47 1050 42.9 8.27 Black Non-Hispanic 275 11.2 24.77 78 3.2 7.03 353 14.4 31.80 Hispanic 639 26.1 9.83 234 9.6 3.60 873 35.7 13.43 *A/PI/H Non-Hispanic 39 1.6 4.86 14 0.6 1.74 53 2.2 6.60 **AI/AN Non-Hispanic 65 2.7 14.93 30 1.2 6.89 95 3.9 21.82 ***MR/O Non-Hispanic 20 0.8 N/A 2 0.1 N/A 22 0.9 N/A TOTAL 1774 72.5 8.23 672 27.5 3.12 2446 100.0 11.35 By Mode of Transmission + MSM 1142 46.7 N/A 353 14.4 N/A 1495 61.1 N/A ++ IDU 115 4.7 N/A 59 2.4 N/A 174 7.1 N/A MSM / IDU 96 3.9 N/A 30 1.2 N/A 126 5.2 N/A Heterosexual 164 6.7 N/A 79 3.2 N/A 243 9.9 N/A +++ O/H/TF/TPR 16 0.7 N/A 0 0.0 N/A 16 0.7 N/A ++++ NRR/UR 241 9.9 N/A 151 6.2 N/A 392 16.0 N/A TOTAL 1774 72.5 8.23 672 27.5 3.12 2446 100.0 11.35 * Asian Pacific/Islander/Hawaiian + Men having Sex with Men ++++ No Reported Risk/Unknown Risk ** American Indian/Alaskan Native ++ Injection Drug Use *** Multiple Race/Other Race +++ Other/Hemophilia/Transfusion and Blood Products/Transplant Recipient
  • 118.
    110 CENTRAL ARIZONA PrevalentHIV Prevalent AIDS Prevalent HIV & AIDS Cases % State Total Rate Per 100,000 Cases % State Total Rate Per 100,000 Cases % State Total Rate Per 100,000 By Gender Male 5374 43.1 245.69 5359 43.0 245.00 10733 86.1 490.69 Female 971 7.8 43.91 765 6.1 34.59 1736 13.9 78.50 TOTAL 6345 50.9 144.25 6124 49.1 139.22 12469 100.0 283.47 By Age Under 2 0 0.0 0.00 0 0.0 0.00 0 0.0 0.00 2 to 12 38 0.3 5.53 7 0.1 1.02 45 0.4 6.55 13 to 19 54 0.4 12.76 11 0.1 2.60 65 0.5 15.36 20 to 24 292 2.3 94.93 60 0.5 19.51 352 2.8 114.44 25 to 29 578 4.6 186.18 218 1.7 70.22 796 6.4 256.39 30 to 34 684 5.5 220.53 360 2.9 116.07 1044 8.4 336.59 35 to 39 709 5.7 243.66 545 4.4 187.30 1254 10.1 430.95 40 to 44 844 6.8 282.49 791 6.3 264.75 1635 13.1 547.24 45 to 49 929 7.5 331.56 1189 9.5 424.35 2118 17.0 755.91 50 to 54 969 7.8 340.69 1326 10.6 466.21 2295 18.4 806.90 55 to 59 608 4.9 236.87 777 6.2 302.71 1385 11.1 539.57 60 to 64 342 2.7 150.22 465 3.7 204.25 807 6.5 354.47 65 and Above 285 2.3 47.15 375 3.0 62.04 660 5.3 109.19 Age Unknown 13 0.1 N/A 0 0.0 N/A 13 0.1 N/A TOTAL 6345 50.9 144.25 6124 49.1 139.22 12469 100.0 283.47 By Race/Ethnicity White Non-Hispanic 3314 26.6 128.57 3336 26.8 129.42 6650 53.3 257.99 Black Non-Hispanic 923 7.4 388.90 825 6.6 347.61 1748 14.0 736.50 Hispanic 1717 13.8 130.45 1668 13.4 126.73 3385 27.1 257.18 *A/PI/H Non-Hispanic 111 0.9 62.73 78 0.6 44.08 189 1.5 106.81 **AI/AN Non-Hispanic 157 1.3 173.15 159 1.3 175.35 316 2.5 348.50 ***MR/O Non-Hispanic 123 1.0 N/A 58 0.5 N/A 181 1.5 N/A TOTAL 6345 50.9 144.25 6124 49.1 139.22 12469 100.0 283.47 By Mode of Transmission + MSM 3934 31.6 N/A 3756 30.1 N/A 7690 61.7 N/A ++ IDU 532 4.3 N/A 620 5.0 N/A 1152 9.2 N/A MSM / IDU 390 3.1 N/A 599 4.8 N/A 989 7.9 N/A Heterosexual 670 5.4 N/A 635 5.1 N/A 1305 10.5 N/A +++ O/H/TF/TPR 84 0.7 N/A 58 0.5 N/A 142 1.1 N/A ++++ NRR/UR 735 5.9 N/A 456 3.7 N/A 1191 9.6 N/A TOTAL 6345 50.9 144.25 6124 49.1 139.22 12469 100.0 283.47 TABLE 23 Central Arizona Prevalence 2014 * Asian Pacific/Islander/Hawaiian + Men having Sex with Men ++++ No Reported Risk/Unknown Risk ** American Indian/Alaskan Native ++ Injection Drug Use *** Multiple Race/Other Race +++ Other/Hemophilia/Transfusion and Blood Products/Transplant Recipient
  • 119.
    CENTRAL ARIZONA 111 GOAL1: REDUCE NEW HIV INFECTIONS. Objective 1: Increase the percentage of people living with HIV who know their serostatus to at least 90%. Strategy 1: Prevention, Testing & Linkage to Care 1.1.1.1 Annually, increase HIV testing by adding three testing sites and/or testing initiatives, focusing testing on target populations most at-risk for contacting HIV, including MSM, IDU, communities of color and the transgender individuals. Metric: The number of testing sites and/or initiatives added each year. Lead Program: HIV Prevention Program Partners: Arizona AIDS Education and Training Center, Ryan White Programs Start/End: 2017 to 2021 1.1.1.2 Increase the number of medical providers educated on HIV/PrEP, and ultimately prescribing PrEP, by three providers per year. Metric: The number of providers educated about PrEP, and the prescribing PrEP each year Lead Program: Arizona AIDS Education and Training Center Partners: Ryan White Programs, HIV Prevention Program Start/End: 2017 to 2021 1.1.1.3 Annually, increase the number of health care professionals trained in knowledge of 4th generation algorithms for HIV testing by three providers per year. Metric: The number of health care professionals trained in 4th generation HIV testing each year Lead Program: Arizona AIDS Education and Training Center Partners: Ryan White Programs, HIV Prevention Program Start/End: 2017 to 2021
  • 120.
    112 CENTRAL ARIZONA Strategy1: Prevention, Testing & Linkage to Care continued 1.1.1.4 Annually, present at least one linkage to care training, designed to increase collaboration and dialog among HIV agencies to reduce linkage to care timeframes. Metric: The number of linkage to care trainings provided each year Lead Program: Arizona AIDS Education and Training Center Partners: Ryan White Programs, HIV Prevention Program, State/County Entities, Tribal Entities, Community-Based Organizations Start/End: 2017 to 2021 1.1.1.5 Annually, develop and implement at least one social marketing initiative to target populations, designed to engage individuals to be tested for HIV and/or enter medical care. Metric: The implementation of at least one social marketing initiative each year Lead Program: HIV Prevention Program Partners: Ryan White Programs, HIV Prevention Program, State/County Entities, Tribal Entities, Arizona AIDS Education and Training Center, Community-Based Organizations Start/End: 2017 to 2021 1.1.1.6 Conduct a one-year pilot of PrEP Evaluation Assistance at two locations. PrEP Evaluation Assistance is designed to educate and engage high-risk HIV negative people in the use of Pre-Exposure Prophylaxis as an HIV Prevention Method. Monitor and evaluate utilization and engagement. Metric: Pilot Program initiated; utilization and engagement in PrEP monitored and evaluated Lead Program: HIV Prevention Program Partners: HIV Care Directions, Southwest Center for HIV Start/End: 2017 to 2018
  • 121.
    CENTRAL ARIZONA 113 Strategy1: Prevention, Testing & Linkage to Care continued 1.1.1.7 Assess the PrEP Evaluation Assistance pilot program. Based on performance, expand service delivery. Metric: Based on pilot program performance, expand PrEP Evaluation Assistance services. Lead Program: HIV Prevention Program Partners: State/County Entities, Tribal Entities, Community-Based Organizations Start/End: 2018 to 2021 1.1.1.8 Annually, develop and implement at least one PrEP-focused social marketing initiative focused on target populations, designed to engage individuals to become educated and engaged in PrEP. Metric: The implementation of at least one social marketing initiative each year Lead Program: HIV Prevention Program Partners: Ryan White Programs, HIV Prevention Program, State/County Entities, Tribal Entities, Community-Based Organizations Start/End: 2017 to 2021
  • 122.
    114 CENTRAL ARIZONA GOAL1: REDUCE NEW HIV INFECTIONS. Objective 1: Increase the percentage of people living with HIV who know their serostatus to at least 90%. Strategy 2: Education 1.1.2.1 Annually, increase the number of HIV providers in Maricopa and Pinal Counties trained on diagnosis and management of HIV, by six per year statewide Metric: The number of providers trained on the diagnosis and management of HIV each year Lead Program: Arizona AIDS Education and Training Center Partners: Ryan White Programs, HIV Prevention Program, State/County Entities, Tribal Entities Start/End: 2018 to 2021 1.1.2.2 Annually, provide training to Oral Health professionals in Maricopa and Pinal Counties on common oral manifestations as seen in patients with HIV. Metric: The number of dentists trained each year Lead Program: Arizona AIDS Education and Training Center Partners: Ryan White Programs, HIV Prevention Program, State/County Entities, Tribal Entities Start/End: 2017 to 2021 1.1.2.3 Annually, present at least one regional provider training, in collaboration with the California HIV/STD Training Center. Metric: The number of trainings provided each year Lead Program: Arizona AIDS Education and Training Center Partners: Ryan White Programs, HIV Prevention Program, State/County Entities, Tribal Entities, Community-Based Organizations Start/End: 2017 to 2021
  • 123.
    CENTRAL ARIZONA 115 Strategy2: Education continued 1.1.2.4 Beginning in 2018, and then annually, provide training for community health workers/ promotoras on HIV testing, prevention and linkage to care. Metric: The number of trainings provided each year Lead Program: Arizona AIDS Education and Training Center Partners: Ryan White Programs, HIV Prevention Program, Community-Based Organizations Start/End: 2018 to 2021 1.1.2.5 Annually, present at least one regional CBO/provider training on trauma-informed care. Metric: The number of trainings provided each year Lead Program: Ryan White Part A Program Partners: Arizona AIDS Education and Training Center, Other Ryan White Programs, HIV Prevention Program, Community-Based Organizations Start/End: 2018 to 2021
  • 124.
    116 CENTRAL ARIZONA GOAL1: REDUCE NEW HIV INFECTIONS. Objective 1: Increase the percentage of people living with HIV who know their serostatus to at least 90%. Strategy 3: Community Engagement 1.1.3.1 Develop and implement an annual community-based initiative to promote HIV awareness, testing/linkage to care, and engagement in care that is culturally and linguistically appropriate. Metric: At least one initiative implemented each year; yearly assessment data demonstrating improved knowledge of HIV awareness, use of HIV testing/linkage to care services, and increased engagement in care Lead Program: HIV Prevention Program Partners: Ryan White Programs, State/County Entities, Tribal Entities, Community-Based Organizations, Community Stakeholders Start/End: 2017 to 2018 1.1.3.2 Collaboratively develop tools and processes with Immigration and Customs Enforcement and Border Health programs to coordinate HIV care during deportation. Metric: Development of the tools and processes Lead Program: Ryan White Part A Program Partners: Ryan White Programs, Arizona AIDS Education and Training Center, Immigration and Customs Enforcement, Border Health programs, Community-Based Organizations Start/End: 2017 to 2019 1.1.3.3 Annually, present a collaboratively developed HIV Symposium, offering program contractors and community stakeholders opportunities for education on service delivery and quality improvement, as well as engagement in HIV planning activities. Metric: Presentation of the HIV Symposium each year Lead Program: HIV Prevention Program Partners: Ryan White Programs, State/County Entities, Arizona AIDS Education and Training Center, HIV Providers, Community-Based Organizations Start/End: 2017 to 2021
  • 125.
    CENTRAL ARIZONA 117 GOAL1: REDUCE NEW HIV INFECTIONS. Objective 2: Increase the percentage of newly diagnosed persons linked to HIV medical care within one month of their HIV diagnosis to at least 85%. Strategy 1: Streamline Processes 1.2.1.1 Establish a common enrollment application for Ryan White programs, including an online enrollment portal. Metric: Completion of the online enrollment portal, and policies and procedures Lead Program: Ryan White Part B Program Partners: Ryan White Programs Start/End: 2017 to 2018 1.2.1.2 Implement processes that support Ryan White-eligible clients attending their first medical visit with a doctor on the same day as their HIV diagnosis. Metric: The number of newly-diagnosed clients who are offered and attend a same day medical appointment Lead Program: Ryan White Part A Program Partners: Ryan White Programs, State/County Entities, HIV Prevention Program, Community-Based Organizations Start/End: 2017 to 2019
  • 126.
    118 CENTRAL ARIZONA GOAL1: REDUCE NEW HIV INFECTIONS. Objective 2: Increase the percentage of newly diagnosed persons linked to HIV medical care within one month of their HIV diagnosis to at least 85%. Strategy 2: Community Engagement 1.2.2.1 Annually, implement a strategy to engage traditional and non-traditional community partners serving target populations in activities that promote HIV testing, linkage to care, harm reduction and engagement in care. Metric: The number of new, traditional and non-traditional partners engaged each year Lead Program: HIV Prevention Program Partners: Ryan White Programs, State/County Entities, Tribal Entities, Community-Based Organizations Start/End: 2017 to 2021 1.2.2.2 Implement technology resources to expand partner services, in order to improve health and prevention outcomes. Metric: Success of implementing technology that expands partner services Lead Program: HIV Prevention Program Partners: State/County Entities Start/End: 2017 to 2019 1.2.2.3 Annually, assess people living with HIV, at-risk individuals in target populations, and providers to inform HIV planning, service delivery, and quality improvement initiatives. Metric: Completion of a yearly assessment Lead Program: Ryan White Part A Program Partners: Ryan White Programs, HIV Prevention Program Start/End: 2017 to 2021
  • 127.
    CENTRAL ARIZONA 119 GOAL1: REDUCE NEW HIV INFECTIONS. Objective 2: Increase the percentage of newly diagnosed persons linked to HIV medical care within one month of their HIV diagnosis to at least 85%. Strategy 3: Patient-Centered Care 1.2.3.1 Annually, complete at least one quality initiative that drives improvements to decrease entry to care timeframes. Metric: Reduction in entry to care timeframes contributable to the implemented quality initiative Lead Program: Ryan White Part A Program Partners: Ryan White Programs, HIV Prevention Program, State/County Entities, Part A Early Intervention Services sub-recipients, other Part A sub-recipients, Community-Based Organizations Start/End: 2017 to 2021 1.2.3.2 Annually, provide cultural competency, health equity, and/or CLAS trainings to sub- recipients, community-based organizations, and other service providers. Metric: The number of trainings provided each year Lead Program: Ryan White Part A Program Partners: Ryan White Programs, HIV Prevention Program, Ryan White Part A Program sub-recipients Start/End: 2017 to 2021 1.2.3.3 Establish a Spanish language version of HIVAZ.org. Metric: Successful implementation of the Spanish language version of HIVAZ.org Lead Program: HIV Prevention Program Partners: Aunt Rita's Foundation Start/End: 2017 to 2018
  • 128.
    120 CENTRAL ARIZONA GOAL2: INCREASE ACCESS TO CARE AND IMPROVE HEALTH OUTCOMES FOR PEOPLE LIVING WITH HIV. Objective 1: Increase the percentage of newly diagnosed persons linked to HIV medical care within one month of their HIV diagnosis to at least 85%. Strategy 1: Streamline Processes 2.1.1.1 Formalize and implement processes between Part A Early Intervention Services sub- recipients and State and County correctional facilities, to improve linkages to HIV care and supportive services for recently released inmates. Metric: Processes formalized and implemented Lead Program: Ryan White Part A Program Partners: Ryan White Part A sub-recipients for Early Intervention Services, Ryan White Programs, State/County Correctional Entities, HIV Prevention Program Start/End: 2017 to 2018 2.1.1.2 Diversify accessibility to HIV prevention and care services for homeless clients by at least two new providers. Metric: Two new providers offering HIV prevention and care services targeted to homeless people. Lead Program: Ryan White Part A Partners: Ryan White Part A sub-recipients, Ryan White Programs, HIV Prevention Program, HOPWA, Housing Services Providers Start/End: 2017 to 2019 2.1.1.3 Implement HIV prevention strategies in correctional systems. Metric: Successful implementation of HIV Prevention strategies in State/local correctional systems Lead Program: HIV Prevention Program Partners: Ryan White Programs, State/Local Correctional Health Systems, CBOs Start/End: 2018 to 2020
  • 129.
    CENTRAL ARIZONA 121 Strategy1: Streamline Processes continued 2.1.1.4 Evaluate the feasibility of implementing a shared data system for prevention and care services, that includes linkage to care information. Metric: An implementation evaluation is completed; action items are developed Lead Program: Ryan White Part B Program Partners: Ryan White Programs, HIV Prevention Program, Community-Based Organizations Start/End: 2018 to 2019
  • 130.
    122 CENTRAL ARIZONA GOAL2: INCREASE ACCESS TO CARE AND IMPROVE HEALTH OUTCOMES FOR PEOPLE LIVING WITH HIV. Objective 1: Increase the percentage of newly diagnosed persons linked to HIV medical care within one month of their HIV diagnosis to at least 85%. Strategy 2: Education 2.1.2.1 Develop a comprehensive, accessible, and culturally/linguistically appropriate library of health literacy resources for HIV positive and high-risk HIV negative clients, utilizing digital and traditional media formats. Metric: Health literacy resources established Lead Program: Ryan White Part A Partners: Ryan White Programs, HIV Prevention Program, Arizona AIDS Education and Training Center Start/End: 2017 to 2019 2.1.2.2 Annually, provide training to at least five medical providers related to the diagnosis and management of HIV, and trauma-informed care. Metric: At least five HIV medical providers trained each year Lead Program: Arizona AIDS Education and Training Center Partners: Ryan White Programs, HIV Prevention Program Start/End: 2017 to 2021
  • 131.
    CENTRAL ARIZONA 123 GOAL2: INCREASE ACCESS TO CARE AND IMPROVE HEALTH OUTCOMES FOR PEOPLE LIVING WITH HIV. Objective 1: Increase the percentage of newly diagnosed persons linked to HIV medical care within one month of their HIV diagnosis to at least 85%. Strategy 3: Patient-Centered Care 2.1.3.1 By 2018, implement an electronic patient portal in the Ryan White Part C clinic, and provide ongoing education for clients on the use of patient portal technology. Metric: Implementation of the Patient Portal system by 2018; the number of clients utilizing the system each year from 2019-on Lead Program: Ryan White Part C Program Partners: Ryan White Programs, HIV Prevention Program Start/End: 2017 to 2018 2.1.3.2 Annually, conduct quarterly reviews of Part A sub-recipient quality improvement initiatives that address linkage to care timeframes. Metric: Reviews conducted each quarter Lead Program: Ryan White Part A Program Clinical Quality Management Committee Partners: Ryan White Programs, HIV Prevention Program Start/End: 2017 to 2021 2.1.3.3 Establish a baseline for culturally and linguistically appropriate patient-centered care for those who are HIV negative, including services related to PrEP, harm reduction, condom distribution, behavioral interventions, and other prevention interventions. Metric: Baseline established Lead Program: HIV Prevention Program Partners: HIV Statewide Advisory Committee, Part A Planning Council’s Community Health Planning and Strategies Committee Start/End: 2018 to 2021
  • 132.
    124 CENTRAL ARIZONA GOAL2: INCREASE ACCESS TO CARE AND IMPROVE HEALTH OUTCOMES FOR PEOPLE LIVING WITH HIV. Objective 2: Increase the percentage of persons diagnose with HIV infection who are virally suppressed to at least 80%. Strategy 1: Patient-Centered Care 2.2.1.1 Annually, conduct quarterly reviews of viral load suppression data provided by Part A sub- recipient quality improvement initiatives designed to increase viral load suppression rates. Metric: Quarterly reviews of viral load suppression data conducted Lead Program: Ryan White Part A Program Clinical Quality Management Committee Partners: Ryan White Programs, HIV Prevention Program Start/End: 2017 to 2021 2.2.1.2 Develop and implement a strategy to expand Part A-funded treatment adherence services, to improve viral load suppression rates among Ryan White Part A clients. Metric: The development and implementation of the strategy Lead Program: Ryan White Part A Program Partners: Other Ryan White Programs, HIV Prevention Program Start/End: 2017 to 2019 2.2.1.3 Develop and implement an HIV prevention strategy for HIV positive individuals, focusing on retention in care, treatment adherence, and viral suppression. Metric: The development and implementation of the strategy Lead Program: HIV Prevention Program Partners: Ryan White Programs, State/County Entities, Tribal Entities, Community-Based Organizations Start/End: 2017 to 2018
  • 133.
    CENTRAL ARIZONA 125 GOAL2: INCREASE ACCESS TO CARE AND IMPROVE HEALTH OUTCOMES FOR PEOPLE LIVING WITH HIV. Objective 2: Increase the percentage of persons diagnose with HIV infection who are virally suppressed to at least 80%. Strategy 2: Community Engagement 2.2.2.1 Biannually, conduct a culturally responsive media initiative that promotes retention in care and viral suppression to people living with HIV. Metric: Completion of the media initiative every two years Lead Program: HIV Prevention Program Partners: Ryan White Programs, HIV Statewide Advisory Group, Part A Planning Council’s Community Health Planning and Strategies Committee, Ryan White Part C Consumer Advisory Board Start/End: 2018 to 2020 2.2.2.2 Annually, expand the utilization of HIV care, prevention, and PrEP continuum of care models by at least one non-Ryan White funded medical practice. Metric: At least one non-Ryan White medical practices engages in the use of continuum of care models each year Lead Program: Ryan White Part B Program Partners: Ryan White Programs, Arizona AIDS Education and Training Center Start/End: 2018 to 2021
  • 134.
    126 CENTRAL ARIZONA GOAL2: INCREASE ACCESS TO CARE AND IMPROVE HEALTH OUTCOMES FOR PEOPLE LIVING WITH HIV. Objective 2: Increase the percentage of persons diagnose with HIV infection who are virally suppressed to at least 80%. Strategy 3: Streamline Processes 2.2.3.1 Establish baseline data that identifies the number of newly diagnosed clients that are virally suppressed within 180 days of entry to medical care, and develop a strategy to increase the number of clients that achieve viral suppression within this timeframe. Metric: The baseline data is established, and a strategy to increase the number of clients is developed Lead Program: Ryan White Part A Program Partners: Ryan White Programs, HIV Surveillance Program, Arizona Regional Quality Group Start/End: 2017 to 2019 2.2.3.2 Implement the proposed strategy to increase the percentage of newly diagnosed clients that are virally suppressed within 180 days of their first medical appointment. Metric: The strategy is implemented; percentage change in the number of newly diagnosed clients that are virally suppressed within 180 of their first medical appointment Lead Program: Ryan White Part A Program Partners: Ryan White Programs, HIV Surveillance Program, Arizona Regional Quality Group Start/End: 2019 to 2021
  • 135.
    CENTRAL ARIZONA 127 GOAL3: REDUCE HIV-RELATED DISPARITIES AND HEALTH INEQUALITIES. Objective 1: Reduce disparities in the rate of new diagnosis by at least 15% in the following groups: gay and bisexual men, young Black gay and bisexual men, and Black females. Strategy 1: Funding 3.1.1.1 Conduct an assessment of the capacity building opportunities for community-based organizations and providers seeking to diversify their funding sources. Metric: Completion of the assessment Lead Program: Ryan White Part A Program Partners: Ryan White Programs, HIV Prevention Program, Community-Based Organizations Start/End: 2017 3.1.1.2 Annually, provide at least one capacity building opportunities to CBOs/providers seeking to diversify their funding sources. Metric: At least one capacity building opportunity provided each year Lead Program: Ryan White Part A Program Partners: Ryan White Programs, HIV Prevention Program, Community-Based Organizations Start/End: 2018 to 2021 3.1.1.3 Compile data from multiple sources, including continuums of care specific to each target population, to justify the need for funding, and disseminate this information to community partners. Metric: The data is compiled, published and distributed to community partners Lead Program: Arizona Regional Quality Group Partners: Ryan White Programs, HIV Prevention Program, Surveillance, State/County Entities, Tribal Entities, Community-Based Organizations Start/End: 2018 to 2021
  • 136.
    128 CENTRAL ARIZONA Strategy1: Funding continued 3.1.1.4 Develop and implement an action plan to address disparities in populations that are most affected by HIV, with consideration for traditional and non-traditional funding sources. Metric: Development and Implementation of the action plan Lead Program: HIV Statewide Advisory Group Partners: Ryan White Part A Planning Council, Community-Based Organizations Start/End: 2019 to 2021
  • 137.
    CENTRAL ARIZONA 129 GOAL3: REDUCE HIV-RELATED DISPARITIES AND HEALTH INEQUALITIES. Objective 1: Reduce disparities in the rate of new diagnosis by at least 15% in the following groups: gay and bisexual men, young Black gay and bisexual men, and Black females. Strategy 2: Patient-Centered Care 3.1.2.1 Annually, train at least three non-Ryan White medical providers to enhance their knowledge of, and ability to link clients to Ryan White and Prevention services. Metric: Three or more providers are trained each year Lead Program: Arizona AIDS Education and Training Center Partners: Ryan White Programs, HIV Prevention Program Start/End: 2017 to 2021 3.1.2.2 Annually, provide at least one training for funded and non-funded entities related to culturally and linguistically appropriate HIV care and prevention services. Metric: At least one training provided each year Lead Program: Arizona AIDS Education and Training Center Partners: Ryan White Programs, HIV Prevention Program, Community-Based Organizations Start/End: 2017 to 2021
  • 138.
    130 CENTRAL ARIZONA GOAL3: REDUCE HIV-RELATED DISPARITIES AND HEALTH INEQUALITIES. Objective 1: Reduce disparities in the rate of new diagnosis by at least 15% in the following groups: gay and bisexual men, young Black gay and bisexual men, and Black females. Strategy 3: Stigma Reduction 3.1.3.1 Annually, implement at least one HIV stigma reduction social marketing initiative each year, utilizing new and traditional media. Metric: At least one stigma reduction social marketing initiative implemented each year Lead Program: HIV Prevention Program Partners: Part A Planning Council, HIV Statewide Advisory Group, Ryan White Programs, Community-Based Organizations Start/End: 2017 to 2021
  • 139.
    CENTRAL ARIZONA 131 GOAL3: REDUCE HIV-RELATED DISPARITIES AND HEALTH INEQUALITIES. Objective 1: Reduce disparities in the rate of new diagnosis by at least 15% in the following groups: gay and bisexual men, young Black gay and bisexual men, and Black females. Strategy 4: Population-Specific Assessment & Strategy Development 3.1.4.1 Conduct an assessment of the health disparities, and HIV prevention and care needs of gay and bisexual men, young Black gay and bisexual men and Black females. Metric: Completion of the assessment Lead Program: HIV Prevention Program Partners: Ryan White Programs, Part A Planning Council, HIV Statewide Advisory Group, Arizona AIDS Education and Training Center, Community-Based Organizations, National Association of State and Territorial AIDS Directors, HRSA technical consultants Start/End: 2018 3.1.4.2 Develop and implement a strategy to address issues identified in the assessment. Establish advisory bodies, comprised of each target population, to inform activities and monitor outcomes. Metric: Strategies developed and implemented Lead Program: HIV Prevention Program Partners: Ryan White Programs, Part A Planning Council, HIV Statewide Advisory Group, Community-Based Organizations Start/End: 2018 to 2021 3.1.4.3 Annually, monitor and revise the strategy. Metric: Strategies monitored and revised, as needed Lead Program: HIV Prevention Program Partners: Ryan White Programs, Part A Planning Council, HIV Statewide Advisory Group, Community-Based Organizations Start/End: 2019 to 2021
  • 140.
    132 CENTRAL ARIZONA GOAL3: REDUCE HIV-RELATED DISPARITIES AND HEALTH INEQUALITIES. Objective 2: Reduce the percentage of persons in HIV medical care who are homeless to no more than 5%. Strategy 1: Community Engagement 3.2.1.1 Establish referral mechanisms and MOUs with the centralized homeless housing hubs, such as CASS Welcome Center, UMOM Family Housing Hub, and Mesa Family Housing Hub for referrals to Ryan White and HOPWA services. Metric: Referral mechanisms are defined, and MOUs are established Lead Program: Ryan White Part A Program Partners: Local Housing Coordinators, HOPWA Start/End: 2017 to 2018 3.2.1.2 Develop and implement a strategy that defines a more holistic approach to serving homeless individuals who are HIV positive (i.e., housing, mental health and substance abuse services, HIV care). Metric: The strategy is developed and implemented Lead Program: HIV Statewide Advisory Group Partners: HIV Prevention Program, Ryan White Part A Program, HOPWA, Housing Providers, Community-Based Organizations Start/End: 2018 to 2021
  • 141.
    CENTRAL ARIZONA 133 GOAL3: REDUCE HIV-RELATED DISPARITIES AND HEALTH INEQUALITIES. Objective 2: Reduce the percentage of persons in HIV medical care who are homeless to no more than 5%. Strategy 2: Funding 3.2.2.1 Determine partnership opportunities with HOPWA to seek additional funding sources. Metric: Partnership opportunities are determined Lead Program: Ryan White Part B Program Partners: Ryan White Programs, HOPWA Start/End: 2018 to 2019 3.2.2.2 Explore opportunities to use Ryan White Part B rebate funds for housing services. Implement activities as funding allows. Metric: Opportunities identified, activities initiated Lead Program: Ryan White Part B Program Partners: Ryan White Programs, HOPWA Start/End: 2017 to 2018
  • 142.
    134 CENTRAL ARIZONA GOAL3: REDUCE HIV-RELATED DISPARITIES AND HEALTH INEQUALITIES. Objective 2: Reduce the percentage of persons in HIV medical care who are homeless to no more than 5%. Strategy 3: Patient-Centered Care 3.2.3.1 Develop and implement a strategy to increase housing opportunities for HIV clients with increased challenges in obtaining housing such as a history of past felonies, disabilities, mental health issues and/or substance abuse. Metric: Strategy developed and implemented Lead Program: Ryan White Part A Program Partners: Ryan White Programs, HOPWA, Community-Based Organizations Start/End: 2017 to 2018 3.2.3.2 Identify emergency housing options for homeless individuals. Metric: Emergency housing options identified Lead Program: Ryan White Part A Program Partners: Ryan White Programs, HOPWA, Community-Based Organizations Start/End: 2018 3.2.3.3 Collaborate with the Southern Arizona AIDS Foundation Harm Reduction Program, other harm reduction programs, and HIV housing programs to evaluate and adopt best practices statewide. Metric: Best practices evaluated and implemented as appropriate Lead Program: Ryan White Part A Program Partners: Ryan White Programs, HOPWA, HIV Prevention Program, Community-Based Organizations Start/End: 2018 to 2021
  • 143.
    CENTRAL ARIZONA 135 GOAL4: ACHIEVE A MORE COORDINATED RESPONSE TO THE HIV EPIDEMIC. Objective 1: Reduce disparities in the rate of new diagnosis by at least 15% in the following groups: gay and bisexual men, young Black gay and bisexual men, and Black females. Strategy 1: Coordinated Data Collection & Dissemination 4.1.1.1 Identify and assess each Program’s target populations related to health disparities, then develop and implement a strategy to reduce these disparities. Metric: Strategy developed and implemented Lead Program: Arizona Regional Quality Group Partners: Ryan White Programs, HIV Prevention Program, HIV Surveillance Start/End: 2017 to 2018 4.1.1.2 Share data among programs and providers to increase collaboration and maximize available funding to better address health disparities. Metric: Data sharing agreements in place, and data sharing has begun Lead Program: Arizona Regional Quality Group Partners: Ryan White Programs, HIV Prevention Program, HIV Surveillance Start/End: 2018 to 2021 4.1.1.3 Use data to identify and implement capacity building opportunities among new and traditional partners to address disparities in target populations. Metric: Capacity-building opportunities identified and implemented Lead Program: Arizona Regional Quality Group Partners: Ryan White Programs, HIV Prevention Program, Medicaid Start/End: 2018 to 2021
  • 144.
    136 CENTRAL ARIZONA GOAL4: ACHIEVE A MORE COORDINATED RESPONSE TO THE HIV EPIDEMIC. Objective 1: Reduce disparities in the rate of new diagnosis by at least 15% in the following groups: gay and bisexual men, young Black gay and bisexual men, and Black females. Strategy 2: Patient-Centered Care 4.1.2.1 Annually, complete at least one quality initiative that drives improvements to decrease entry to care timeframes. Metric: At least one quality initiative completed each year Lead Program: Ryan White Part A Program Continuous Quality Management Committee Partners: Ryan White Programs, HIV Prevention Program, State/County Entities, Tribal Entities Start/End: 2017 to 2021 4.1.2.2 Annually, collect and analyze needs assessment data to identify and implement strategies to improve patient centered care provided to Ryan White clients. Metric: Data collected and analyzed; strategies developed and implemented Lead Program: Ryan White Part A Planning Council Partners: Ryan White Part A Program/Part A Continuous Quality Management Committee, HIV Statewide Advisory Group, Ryan White Programs, HIV Prevention Program Start/End: 2017 to 2021 4.1.2.3 Annually, utilize consumer feedback to inform Ryan White Program quality improvement projects. Metric: Consumer feedback activities completed, projects implemented based on analysis Lead Program: Part A Continuous Quality Management Committee Partners: Part A Planning Council, Ryan White Part A Program Start/End: 2017 to 2021
  • 145.
    CENTRAL ARIZONA 137 GOAL4: ACHIEVE A MORE COORDINATED RESPONSE TO THE HIV EPIDEMIC. Objective 1: Reduce disparities in the rate of new diagnosis by at least 15% in the following groups: gay and bisexual men, young Black gay and bisexual men, and Black females. Strategy 3: Stigma Reduction 4.1.3.1 Establish partnerships with community stakeholders and entities that serve target populations to develop and implement strategies to address multiple types of stigma (individual, family, friends, providers, culture, etc.). Metric: Partnerships Established Lead Program: HIV Prevention Program Partners: Ryan White Programs, Part A Planning Council, HIV Statewide Advisory Group, State/ County Entities, Community-Based Organizations Start/End: 2018 to 2021 4.1.3.2 Annually, implement at least one stigma reduction initiative each year, utilizing new and traditional media. Assess success and adjust strategies based on data. Metric: At least one stigma reduction initiative implemented each year Lead Program: HIV Prevention Program Partners: Ryan White Programs, Part A Planning Council, HIV Statewide Advisory Group, State/ County Entities, Community-Based Organizations Start/End: 2018 to 2021
  • 146.
    138 CENTRAL ARIZONA GOAL4: ACHIEVE A MORE COORDINATED RESPONSE TO THE HIV EPIDEMIC. Objective 2: Reduce the percentage of persons in HIV medical care who are homeless to no more than 5%. Strategy 1: Funding 4.2.2.1 Assess opportunities to use rebate funds for housing services, and implement any strategies that are identified. Metric: Opportunities assessed, and strategies implemented Lead Program: Ryan White Part B Program Partners: Ryan White Programs, HOPWA, Community-Based Organizations Start/End: 2017 to 2018 4.2.2.2 Identify opportunities to combine programmatic resources to create efficiencies in contracting, improve service integration, and reduce duplication of effort and/or competition for funding. Metric: Successful identification and implementation of new opportunities for efficiency Lead Program: Ryan White Part B Program Partners: All other Ryan White Programs, HIV Prevention Program Start/End: 2018
  • 147.
  • 148.
    140 SOUTHERN ARIZONA TheSouthern Region Target Populations  Men who have Sex with Men (MSM), especially youth and MSM of Color  Hispanics, regardless of gender  African Americans/Blacks regardless of gender  Injection Drug Users Activity Highlights  Implementation of Pre-Exposure Prophylaxis (PrEP) Engagement Assistance programming, and efforts to increase consumer use of PrEP  Increased HIV testing, and diversification of HIV testing locations, including opt-out HIV testing in hospital settings  Engagement of community stakeholders and policy makers in advocacy for expanded HIV education, increased local HIV funding, and other HIV- centric issues  Strengthening partnerships with providers, correctional facilities, and community-based organizations to expand availability and accessibility of quality housing for people living with HIV  Consumer and provider training related to stigma reduction, cultural competency, and client empowerment  Social marketing initiatives to increase HIV testing and awareness, PrEP engagement, and engagement in care The Southern Region includes Yuma, Pima, Santa Cruz, Cochise, Graham, Greenlee, and La Paz counties. The 2014 population for this Region was 1,449,440. Pima County has the state’s second highest prevalence (16%) and is home to Tucson, the state’s second largest city. Four counties (Yuma, Pima, Santa Cruz, and Cochise) border Mexico. Hispanics account for a large percentage of the population of Southern Region counties, with the largest concentration being in counties along the international border. The Tohono O’odham Nation is the largest tribal area in Southern Arizona. Major HIV prevention issues in the Southern Region include rural health care delivery concerns and disparities, transportation, stigma, limited service delivery areas by county and other health departments or providers due to population density, access to resources, and border issues. The HIV Prevention and Ryan White Part B and C Programs provide HIV prevention and care services in the Southern Region. CONTINUUM OF CARE DEFINITIONS HIV-Diagnosed: Prevalent cases that have been diagnosed Linked to HIV Care: Prevalent cases with a documented lab test, doctor visit or medication use in the calendar year Incidence Linked to HIV Care: Incident cases for the year of the spectrum that were linked with a documented lab test, doctor visit or medication use within 90 days of their diagnosis, but not on the same day of the diagnosis. If a person has their first CD4, viral load or genotype on the same day as their diagnostic test the date of second CD4, viral load or genotype will be used as the linkage Retained in HIV Care: Prevalent cases with a documented lab test, doctor visit or antiretroviral (ARV) use in the first and second six months of the year On ARV Therapy: Prevalent cases with documented ARV use or whose last viral load of the calendar year was undetectable Adherent/Suppressed: Prevalent cases whose last viral load of the calendar year was undetectable (<200 C/mL)
  • 149.
    SOUTHERN ARIZONA 141 2556 1350 1622 13411416 74 of 96 FIGURE 21 2014 Pima County HIV Continuum of Care FIGURE 22 2014 Remaining Southern Region HIV Continuum of Care 594 240 306 240 254 12 of 16
  • 150.
    142 SOUTHERN ARIZONA The2015 Arizona Department of Health Services Epidemiology Report shows the Southern Region had 22% of the state population, 19% of the new HIV cases, and 19% of the ongoing HIV cases. Census data from 2015 shows that Southern Arizona has a higher than average percentage of Hispanics or Latinos in Santa Cruz County (83%), Greenlee County (46%) and Cochise County (35%). In 2014, the new cases dropped to 115 (19 case reduction from previous year), while prevalence increased by 142, indicating that at least 27 HIV positive people who were not diagnosed in Southern Arizona moved to the region. FIGURE 23 2014 Pima County HIV Continuum of Care by Race/Ethnicity
  • 151.
    SOUTHERN ARIZONA 143 FIGURE24 2014 Remaining Southern Region HIV Continuum of Care by Race/Ethnicity TABLE 24 Comparison of Pima County and All Southern Region Incidence and Prevalence by Year, 2005 to 2014 Pima County Breakout All Southern Region (including Pima County) Year Prevalence Incidence Year Prevalence Incidence 2005 562 44 2005 2226 163 2006 606 27 2006 2428 157 2007 652 42 2007 2558 156 2008 706 39 2008 2681 125 2009 740 40 2009 2758 142 2010 747 45 2010 2785 149 2011 795 36 2011 2879 120 2012 896 33 2012 2964 95 2013 939 61 2013 3075 134 2014 1003 39 2014 3217 115
  • 152.
    144 SOUTHERN ARIZONA FIGURE26 2014 Remaining Southern Region HIV Continuum of Care by Gender FIGURE 25 2014 Pima County HIV Continuum of Care by Gender
  • 153.
    SOUTHERN ARIZONA 145 FIGURE27 2014 Pima County HIV Continuum of Care by Risk Category FIGURE 28 2014 Remaining Southern HIV Continuum of Care by Risk Category KEY MSM: Men who have Sex with Men IDU: Injection Drug User HRH: High-Risk Heterosexual NRR: No Reported Risk KEY MSM: Men who have Sex with Men IDU: Injection Drug User HRH: High-Risk Heterosexual NRR: No Reported Risk
  • 154.
    146 SOUTHERN ARIZONA TABLE25 Pima County Breakout Incidence 2009 to 2013 Emergent HIV Emergent AIDS Emergent HIV & AIDS Cases % State Total Rate Per 100,000 Cases % State Total Rate Per 100,000 Cases % State Total Rate Per 100,000 By Gender Male 216 50.9 8.83 140 33.0 5.72 356 84.0 14.55 Female 50 11.8 1.98 18 4.2 0.71 68 16.0 2.69 TOTAL 266 62.7 5.34 158 37.3 3.17 424 100.0 8.52 By Age Under 2 1 0.2 0.81 0 0.0 0.00 1 0.2 0.81 2 to 12 1 0.2 0.14 0 0.0 0.00 1 0.2 0.14 13 to 19 18 4.2 3.87 3 0.7 0.65 21 5.0 4.52 20 to 24 30 7.1 7.66 9 2.1 2.30 39 9.2 9.96 25 to 29 46 10.8 13.59 14 3.3 4.14 60 14.2 17.72 30 to 34 29 6.8 9.15 14 3.3 4.42 43 10.1 13.57 35 to 39 32 7.5 11.00 30 7.1 10.31 62 14.6 21.30 40 to 44 19 4.5 6.52 28 6.6 9.60 47 11.1 16.12 45 to 49 33 7.8 10.55 30 7.1 9.59 63 14.9 20.14 50 to 54 28 6.6 8.37 13 3.1 3.89 41 9.7 12.26 55 to 59 13 3.1 4.01 11 2.6 3.39 24 5.7 7.40 60 to 64 8 1.9 2.67 2 0.5 0.67 10 2.4 3.34 65 and Above 8 1.9 1.00 4 0.9 0.50 12 2.8 1.51 Age Unknown 0 0.0 NA 0 0.0 NA 0 0.0 NA TOTAL 266 62.7 5.34 158 37.3 3.17 424 100.0 8.52 By Race/Ethnicity White Non-Hispanic 120 28.3 4.32 63 14.9 2.27 183 43.2 6.59 Black Non-Hispanic 37 8.7 19.98 18 4.2 9.72 55 13.0 29.70 Hispanic 94 22.2 5.41 63 14.9 3.63 157 37.0 9.04 *A/PI/H Non-Hispanic 3 0.7 2.04 6 1.4 4.08 9 2.1 6.11 **AI/AN Non-Hispanic 7 1.7 5.36 7 1.7 5.36 14 3.3 10.71 ***MR/O Non-Hispanic 5 1.2 NA 1 0.2 NA 6 1.4 NA TOTAL 266 62.7 5.34 158 37.3 3.17 424 100.0 8.52 By Mode of Transmission + MSM 152 35.8 NA 78 18.4 NA 230 54.2 NA ++ IDU 18 4.2 NA 9 2.1 NA 27 6.4 NA MSM / IDU 7 1.7 NA 3 0.7 NA 10 2.4 NA Heterosexual 47 11.1 NA 43 10.1 NA 90 21.2 NA +++ O/H/TF/TPR 3 0.7 NA 0 0.0 NA 3 0.7 NA ++++ NRR/UR 39 9.2 NA 25 5.9 NA 64 15.1 NA TOTAL 266 62.7 5.34 158 37.3 3.17 424 100.0 8.52 * Asian Pacific/Islander/Hawaiian + Men having Sex with Men ++++ No Reported Risk/Unknown Risk ** American Indian/Alaskan Native ++ Injection Drug Use *** Multiple Race/Other Race +++ Other/Hemophilia/Transfusion and Blood Products/Transplant Recipient
  • 155.
    SOUTHERN ARIZONA 147 TABLE26 Pima County Breakout Prevalence 2014 Prevalent HIV Prevalent AIDS Prevalent HIV & AIDS Cases % State Total Rate Per 100,000 Cases % State Total Rate Per 100,000 Cases % State Total Rate Per 100,000 By Gender Male 1008 38.6 205.43 1219 46.7 248.43 2227 85.3 453.86 Female 191 7.3 37.76 193 7.4 38.15 384 14.7 75.91 TOTAL 1199 45.9 120.31 1412 54.1 141.69 2611 100.0 262.00 By Age Under 2 0 0.0 0.00 0 0.0 0.00 0 0.0 0.00 2 to 12 9 0.3 6.69 3 0.1 2.23 12 0.5 8.92 13 to 19 13 0.5 13.85 0 0.0 0.00 13 0.5 13.85 20 to 24 46 1.8 51.76 9 0.3 10.13 55 2.1 61.89 25 to 29 63 2.4 105.05 30 1.1 50.03 93 3.6 155.08 30 to 34 84 3.2 133.15 52 2.0 82.43 136 5.2 215.58 35 to 39 96 3.7 170.18 83 3.2 147.13 179 6.9 317.31 40 to 44 131 5.0 227.13 164 6.3 284.35 295 11.3 511.48 45 to 49 160 6.1 278.92 245 9.4 427.09 405 15.5 706.01 50 to 54 228 8.7 354.10 331 12.7 514.06 559 21.4 868.16 55 to 59 156 6.0 240.36 230 8.8 354.38 386 14.8 594.74 60 to 64 103 3.9 168.89 157 6.0 257.43 260 10.0 426.32 65 and Above 105 4.0 61.36 108 4.1 63.11 213 8.2 124.47 Age Unknown 5 0.2 NA 0 0.0 NA 5 0.2 NA TOTAL 1199 45.9 120.31 1412 54.1 141.69 2611 100.0 262.00 By Race/Ethnicity White Non-Hispanic 657 25.2 120.31 790 30.3 144.66 1447 55.4 264.97 Black Non-Hispanic 137 5.2 365.58 151 5.8 402.94 288 11.0 768.51 Hispanic 340 13.0 95.58 401 15.4 112.72 741 28.4 208.30 *A/PI/H Non-Hispanic 14 0.5 45.04 23 0.9 74.00 37 1.4 119.04 **AI/AN Non-Hispanic 25 1.0 95.56 28 1.1 107.03 53 2.0 202.59 ***MR/O Non-Hispanic 26 1.0 NA 19 0.7 NA 45 1.7 NA TOTAL 1199 45.9 120.31 1412 54.1 141.69 2611 100.0 262.00 By Mode of Transmission + MSM 690 26.4 NA 870 33.3 NA 1560 59.7 NA ++ IDU 137 5.2 NA 156 6.0 NA 293 11.2 NA MSM / IDU 78 3.0 NA 126 4.8 NA 204 7.8 NA Heterosexual 150 5.7 NA 165 6.3 NA 315 12.1 NA +++ O/H/TF/TPR 26 1.0 NA 26 1.0 NA 52 2.0 NA ++++ NRR/UR 118 4.5 NA 69 2.6 NA 187 7.2 NA TOTAL 1199 45.9 120.31 1412 54.1 141.69 2611 100.0 262.00 * Asian Pacific/Islander/Hawaiian + Men having Sex with Men ++++ No Reported Risk/Unknown Risk ** American Indian/Alaskan Native ++ Injection Drug Use *** Multiple Race/Other Race +++ Other/Hemophilia/Transfusion and Blood Products/Transplant Recipient
  • 156.
    148 SOUTHERN ARIZONA TABLE27 All Southern Arizona Regional Incidence (including Pima County) 2009 to 2013 Emergent HIV Emergent AIDS Emergent HIV & AIDS Cases % State Total Rate Per 100,000 Cases % State Total Rate Per 100,000 Cases % State Total Rate Per 100,000 By Gender Male 278 51.3 7.79 179 33.0 5.02 457 84.3 12.81 Female 63 11.6 1.74 22 4.1 0.61 85 15.7 2.34 TOTAL 341 62.9 4.74 201 37.1 2.79 542 100.0 7.53 By Age Under 2 1 0.2 0.53 0 0.0 0.00 1 0.2 0.53 2 to 12 1 0.2 0.10 0 0.0 0.00 1 0.2 0.10 13 to 19 18 3.3 2.58 4 0.7 0.57 22 4.1 3.15 20 to 24 39 7.2 7.07 10 1.8 1.81 49 9.0 8.88 25 to 29 65 12.0 13.61 21 3.9 4.40 86 15.9 18.01 30 to 34 43 7.9 9.71 18 3.3 4.06 61 11.3 13.77 35 to 39 37 6.8 8.98 37 6.8 8.98 74 13.7 17.96 40 to 44 25 4.6 6.00 32 5.9 7.68 57 10.5 13.68 45 to 49 41 7.6 9.23 34 6.3 7.66 75 13.8 16.89 50 to 54 38 7.0 8.09 19 3.5 4.05 57 10.5 12.14 55 to 59 15 2.8 3.31 14 2.6 3.09 29 5.4 6.41 60 to 64 9 1.7 2.15 4 0.7 0.95 13 2.4 3.10 65 and Above 9 1.7 0.77 8 1.5 0.68 17 3.1 1.45 Age Unknown 0 0.0 NA 0 0.0 NA 0 0.0 NA TOTAL 341 62.9 4.74 201 37.1 2.79 542 100.0 7.53 By Race/Ethnicity White Non-Hispanic 149 27.5 3.98 74 13.7 1.98 223 41.1 5.96 Black Non-Hispanic 46 8.5 18.92 20 3.7 8.23 66 12.2 27.14 Hispanic 127 23.4 4.47 90 16.6 3.17 217 40.0 7.64 *A/PI/H Non-Hispanic 4 0.7 2.22 7 1.3 3.89 11 2.0 6.11 **AI/AN Non-Hispanic 10 1.8 5.35 9 1.7 4.81 19 3.5 10.16 ***MR/O Non-Hispanic 5 0.9 NA 1 0.2 NA 6 1.1 NA TOTAL 341 62.9 4.74 201 37.1 2.79 542 100.0 7.53 By Mode of Transmission + MSM 190 35.1 NA 96 17.7 NA 286 52.8 NA ++ IDU 30 5.5 NA 16 3.0 NA 46 8.5 NA MSM / IDU 12 2.2 NA 7 1.3 NA 19 3.5 NA Heterosexual 54 10.0 NA 52 9.6 NA 106 19.6 NA +++ O/H/TF/TPR 3 0.6 NA 0 0.0 NA 3 0.6 NA ++++ NRR/UR 52 9.6 NA 30 5.5 NA 82 15.1 NA TOTAL 341 62.9 4.74 201 37.1 2.79 542 100.0 7.53 * Asian Pacific/Islander/Hawaiian + Men having Sex with Men ++++ No Reported Risk/Unknown Risk ** American Indian/Alaskan Native ++ Injection Drug Use *** Multiple Race/Other Race +++ Other/Hemophilia/Transfusion and Blood Products/Transplant Recipient
  • 157.
    SOUTHERN ARIZONA 149 TABLE28 All Southern Arizona Regional Prevalence (including Pima County) 2014 Prevalent HIV Prevalent AIDS Prevalent HIV & AIDS Cases % State Total Rate Per 100,000 Cases % State Total Rate Per 100,000 Cases % State Total Rate Per 100,000 By Gender Male 1236 38.4 172.30 1497 46.5 208.69 2733 85.0 380.99 Female 248 7.7 34.28 236 7.3 32.62 484 15.0 66.90 TOTAL 1484 46.1 102.99 1733 53.9 120.28 3217 100.0 223.27 By Age Under 2 0 0.0 0.00 0 0.0 0.00 0 0.0 0.00 2 to 12 12 0.4 5.89 3 0.1 1.47 15 0.5 7.37 13 to 19 15 0.5 10.81 1 0.0 0.72 16 0.5 11.53 20 to 24 50 1.6 40.79 12 0.4 9.79 62 1.9 50.58 25 to 29 88 2.7 99.15 37 1.2 41.69 125 3.9 140.84 30 to 34 113 3.5 125.23 63 2.0 69.82 176 5.5 195.05 35 to 39 131 4.1 163.05 114 3.5 141.89 245 7.6 304.94 40 to 44 156 4.8 190.33 200 6.2 244.02 356 11.1 434.35 45 to 49 208 6.5 252.49 294 9.1 356.89 502 15.6 609.39 50 to 54 271 8.4 298.63 387 12.0 426.46 658 20.5 725.09 55 to 59 183 5.7 201.02 284 8.8 311.97 467 14.5 512.99 60 to 64 117 3.6 137.88 198 6.2 233.34 315 9.8 371.22 65 and Above 134 4.2 53.66 140 4.4 56.06 274 8.5 109.72 Age Unknown 6 0.2 N/A 0 0.0 N/A 6 0.2 N/A TOTAL 1484 46.1 102.99 1733 53.9 120.28 3217 100.0 223.27 By Race/Ethnicity White Non-Hispanic 785 24.4 106.94 949 29.5 129.28 1734 53.9 236.22 Black Non-Hispanic 174 5.4 354.84 175 5.4 356.88 349 10.8 711.72 Hispanic 445 13.8 76.41 529 16.4 90.83 974 30.3 167.23 *A/PI/H Non-Hispanic 16 0.5 42.20 23 0.7 60.66 39 1.2 102.86 **AI/AN Non-Hispanic 32 1.0 85.53 35 1.1 93.55 67 2.1 179.09 ***MR/O Non-Hispanic 32 1.0 N/A 22 0.7 N/A 54 1.7 N/A TOTAL 1484 46.1 102.99 1733 53.9 120.28 3217 100.0 223.27 By Mode of Transmission + MSM 827 25.7 N/A 1040 32.3 N/A 1867 58.0 N/A ++ IDU 168 5.2 N/A 204 6.3 N/A 372 11.6 N/A MSM / IDU 99 3.1 N/A 168 5.2 N/A 267 8.3 N/A Heterosexual 194 6.0 N/A 205 6.4 N/A 399 12.4 N/A +++ O/H/TF/TPR 31 1.0 N/A 32 1.0 N/A 63 2.0 N/A ++++ NRR/UR 165 5.1 N/A 84 2.6 N/A 249 7.7 N/A TOTAL 1484 46.1 102.99 1733 53.9 120.28 3217 100.0 223.27 * Asian Pacific/Islander/Hawaiian + Men having Sex with Men ++++ No Reported Risk/Unknown Risk ** American Indian/Alaskan Native ++ Injection Drug Use *** Multiple Race/Other Race +++ Other/Hemophilia/Transfusion and Blood Products/Transplant Recipient
  • 158.
    150 SOUTHERN ARIZONA GOAL1: REDUCE NEW HIV INFECTIONS. Objective 1: Increase the percentage of people living with HIV who know their serostatus to at least 90%. Strategy 1: Prevention, Testing & Linkage to Care 1.1.1.1 Create renewed interest in HIV by implementing at least two targeted strategies (social marketing, town halls, etc.) designed to educate the community, foster conversation, and engage people to get tested for HIV and/or engage in medical care. Metric: The number of strategies implemented each year; the number of new HIV tests each year and/or the number of people engaged to enter medical care Lead Program: HIV Prevention Program Partners: State/County Entities, Tribal Entities, Community-based Organizations Start/End: 2017 to 2021 1.1.1.2 Conduct new, innovative initiatives to improve accessibility to free HIV testing, focusing on getting never-tested people tested. Initiatives might include home test kit delivery, routine HIV testing in medical centers, etc. Metric: The number of initiatives implemented each year; the number of new HIV tests each year Lead Program: HIV Prevention Program Partners: All Ryan White Programs, Arizona AIDS Education and Training Center, State/County Entities, Tribal Entities, Community-Based Organizations Start/End: 2018 to 2021 1.1.1.3 Conduct a one-year pilot of PrEP Evaluation Assistance at Pima County Health Department. PrEP Evaluation Assistance is designed to educate and engage high-risk HIV negative people in the use of Pre-Exposure Prophylaxis . Metric: Pilot Program initiated; utilization and engagement in PrEP monitored and evaluated. Lead Program: Pima County Health Department Partners: HIV Prevention Program Start/End: 2017 to 2018
  • 159.
    SOUTHERN ARIZONA 151 Strategy1: Prevention, Testing & Linkage to Care continued 1.1.1.4 Assess the Pima County Health Department PrEP Evaluation Assistance pilot program. Based on performance, expand service delivery to additional entities. Metric: Based on pilot program performance, expand PrEP Evaluation Assistance services. Lead Program: HIV Prevention Program Partners: State/County Entities, Tribal Entities, Community-Based Organizations Start/End: 2018 to 2021 1.1.1.5 Annually, develop and implement at least one PrEP-focused social marketing initiative focused on target populations, designed to engage individuals to become educated and engaged in PrEP. Metric: The implementation of at least one social marketing initiative each year Lead Program: HIV Prevention Program Partners: Ryan White Programs, HIV Prevention Program, State/County Entities, Tribal Entities, Community-Based Organizations Start/End: 2017 to 2021
  • 160.
    152 SOUTHERN ARIZONA GOAL1: REDUCE NEW HIV INFECTIONS. Objective 1: Increase the percentage of people living with HIV who know their serostatus to at least 90%. Strategy 2: Education 1.1.2.1 Annually, provide at least one fact-based, culturally and linguistically appropriate HIV education opportunity to youth aged 13 to 19, and/or organizations serving youth. Metric: The presentation of one education opportunity each year; the number of youth participants Lead Program: HIV Prevention Program Partners: Community-Based Organizations, Youth Organizations, School Boards Start/End: 2019 to 2021 1.1.2.2 Annually, educate policy makers on the need to expand HIV/STD/pregnancy prevention education to youth. Metric: Thee presentation of HIV/STD/pregnancy prevention information to policy makers each year; number of policy makers educated Lead Program: HIV Statewide Advisory Group Partners: Political Action Entities, State/County Entities, Tribal Entities, Community-Based Organizations Start/End: 2019 to 2021 1.1.2.3 Identify local partners to advocate for increased support for HIV prevention initiatives, including syringe access. Metric: The number of partners identified Lead Program: HIV Statewide Advisory Group Partners: State/County Entities, Tribal Entities, Community-Based Organizations Start/End: 2018 to 2019
  • 161.
    SOUTHERN ARIZONA 153 Strategy2: Education continued 1.1.2.4 Biannually, present on HIV-related topics (HIV testing update, PrEP& PEP, initiating ARV therapy, continuity of care for patients returning to Mexico) to the Yuma Family Medicine Residency program. Metric: One presentation completed every two years Lead Program: Arizona AIDS Education and Training Center Partners: Yuma Family Medicine Residency Program Start/End: 2018 to 2020 1.1.2.5 Yearly, provide at least one education presentation to promotoras programs on HIV, including general HIV knowledge, HIV testing, PrEP, stigma reduction, and connecting patients to HIV care in Mexico. Metric: At least one education presentation provided each year Lead Program: Arizona AIDS Education and Training Center Partners: Promotoras Programs, State/County Entities, Tribal Entities, Border Health Programs, Community-Based Organizations Start/End: 2017 to 2021 1.1.2.6 Yearly, provide at least one education presentation on HIV and opioids. Metric: At least one education presentation completed each year Lead Program: Arizona AIDS Education and Training Center Partners: State/County Entities, Tribal Entities, Community-Based Organizations Start/End: 2017 to 2018
  • 162.
    154 SOUTHERN ARIZONA GOAL1: REDUCE NEW HIV INFECTIONS. Objective 1: Increase the percentage of people living with HIV who know their serostatus to at least 90%. Strategy 3: Stigma Reduction 1.1.3.1 Conduct an assessment of the HIV knowledge, stigma, behaviors, education and service needs of local target populations most at-risk for contracting HIV, and people who are living with HIV. Metric: Completion of the assessment Lead Program: HIV Statewide Advisory Group Partners: HIV Prevention Program, Ryan White Programs, Arizona AIDS Education and Training Center, State/County Entities, Tribal Entities, Community-Based Organizations Start/End: 2017 to 2018 1.1.3.2 Annually, implement at least two social marketing initiatives that address issues identified in the assessment, using local input to guide the implementation (campaign development, populations to target, methodologies, etc.). Metric: At least two social marketing initiatives are implemented each year Lead Program: HIV Prevention Program Partners: Ryan White Programs, Arizona AIDS Education and Training Center, State/County Entities, Tribal Entities, Community-Based Organizations, Community Stakeholders Start/End: 2018 to 2021 1.1.3.3 Annually, implement at least one initiative (training, social marketing, provider update, etc.) that addresses internal/external HIV stigma reduction, including stigma among heterosexual people living with HIV. Metric: At least one initiative implemented each year Lead Program: Ryan White Part B Program Partners: Ryan White Programs, Arizona AIDS Education and Training Center, State/County Entities, Tribal Entities, Community-Based Organizations, Community Stakeholders Start/End: 2019 to 2021
  • 163.
    SOUTHERN ARIZONA 155 Strategy3: Stigma Reduction continued 1.1.3.4 Assess systematic and provider behaviors related to HIV stigma when accessing/providing services, and develop a strategy to address identified issues. Metric: Assessment completed; strategy developed Lead Program: Ryan White Part B Program Partners: Ryan White Programs, Arizona AIDS Education and Training Center, State/County Entities, Tribal Entities, Community-Based Organizations, Community Stakeholders Start/End: 2018
  • 164.
    156 SOUTHERN ARIZONA GOAL1: REDUCE NEW HIV INFECTIONS. Objective 2: Increase the percentage of persons with diagnosed HIV infection who are virally suppressed to at least 80%. Strategy 1: Patient-Centered Care 1.2.1.1 Develop and implement activities designed to provide newly diagnosed and returning-to- care clients with easy, rapid access to medication therapy, to eliminate delays to starting anti-retroviral therapy (ART) while waiting for program enrollment. Metric: Activities developed and implemented; decrease in the average number of days it takes newly diagnosed clients to enter medical care Lead Program: Ryan White Part B Program Partners: Ryan White Programs, Arizona AIDS Education and Training Center, Community-Based Organizations, Local Health Providers/Pharmacists Start/End: 2019 to 2021 1.2.1.2 Create and distribute guidelines to define and standardize HIV referral processes, focusing people living with HIV who are recently released from jail, identified in hospital emergency departments, and by primary care providers. Metric: Guidelines developed and distributed; the number of entities/sites that receive the guidelines Lead Program: Ryan White Part B Program Partners: Ryan White Programs, Arizona AIDS Education and Training Center, Correctional Programs, Community-Based Organizations, Local Hospitals and Health Providers Start/End: 2018 to 2019
  • 165.
    SOUTHERN ARIZONA 157 GOAL1: REDUCE NEW HIV INFECTIONS. Objective 2: Increase the percentage of persons with diagnosed HIV infection who are virally suppressed to at least 80%. Strategy 2: Streamline Processes 1.2.2.1 Establish a statewide 24-hour telephone hotline for HIV information and referrals. Metric: The hotline is established; the number of calls the hotline receives each year Lead Program: HIV Prevention Program Partners: Ryan White Programs, State/County Entities, Tribal Entities, Community-Based Organizations Start/End: 2018 to 2021 1.2.2.2 Reduce paperwork among community providers by establishing a universal enrollment and data-sharing process for non-Ryan White services. Metric: Completion of the universal enrollment process Lead Program: Ryan White Part B Program Partners: Community-Based Organizations Start/End: 2018 to 2019 1.2.2.3 Establish a common enrollment application for Ryan White programs, including an online enrollment portal. Metric: Completion of the common enrollment, online portal, and policies and procedures Lead Program: Ryan White Part B Program Partners: Ryan White Programs Start/End: 2017 to 2018
  • 166.
    158 SOUTHERN ARIZONA GOAL1: REDUCE NEW HIV INFECTIONS. Objective 2: Increase the percentage of persons with diagnosed HIV infection who are virally suppressed to at least 80%. Strategy 3: Incentives for Care 1.2.3.1 Develop and implement an incentive program for new patients who achieve viral suppression within a specific timeframe, and continue adherence for one year. Possible activities include expanding Club 95 (95% treatment adherence, treated to a nice dinner) and Club MedBox (create weekly med box, get free lunch), as well as other methodologies. Metric: The incentive program developed and implemented; the number of clients who received and incentive Lead Program: Ryan White Part B Program Partners: Case Management Providers, State/County Entities, Community-Based Organizations Start/End: 2018 to 2019 1.2.3.2 Develop and implement incentive programs for HIV testing that appeals to target populations most at risk for acquiring HIV. Metric: The incentive program developed and implemented; the number of clients receiving an incentive Lead Program: HIV Prevention Program Partners: Ryan White Programs, State/County Entities, Community-Based Organizations, Community Stakeholders Start/End: 2018 to 2021
  • 167.
    SOUTHERN ARIZONA 159 GOAL1: REDUCE NEW HIV INFECTIONS. Objective 2: Increase the percentage of persons with diagnosed HIV infection who are virally suppressed to at least 80%. Strategy 4: Stigma Reduction 1.2.4.1 Annually, implement at least one strategy to increase retention in care and normalize care for people living with HIV. Metric: At least one strategy is implemented each year Lead Program: Ryan White Part B Program Partners: Arizona AIDS Education and Training Center, HIV Prevention Program, State/County Entities, Tribal Entities, Community-Based Organizations Start/End: 2017 to 2019 1.2.4.2 Annually, provide at least one training for medical providers focused on eliminating systemic and individual behaviors that cause stigma against HIV clients when they access services. Metric: At least one training is provided each year Lead Program: Ryan White Part B Program Partners: Arizona AIDS Education and Training Center, HIV Prevention Program, State/County Entities, Tribal Entities, Community-Based Organizations, Medical Provider Organizations Start/End: 2017 to 2021
  • 168.
    160 SOUTHERN ARIZONA GOAL2: INCREASE ACCESS TO CARE AND IMPROVE HEALTH OUTCOMES FOR PEOPLE LIVING WITH HIV. Objective 1: Increase the percentage of newly diagnosed persons linked to HIV medical care within one month of their HIV diagnosis to at least 85%. Strategy 1: Patient-Centered Care 2.1.1.1 Identify informal opportunities to expand peer-driven navigation and support for engagement in care/retention in care that are not agency-driven, such as an syringe exchange model used in Phoenix, the Tucson Interfaith HIV/AIDS Network volunteer model, and/or other models. Metric: Service models and peer participants are identified; models are implemented Lead Program: Ryan White Part B Program Partners: Arizona AIDS Education and Training Center, HIV Prevention Program, State/County Entities, Tribal Entities, Community-Based Organizations Start/End: 2018 to 2019 2.1.1.2 Annually, provide at least one training for point-of-entry providers, that addresses issues such developing supportive relationships with coworkers and clients, addressing compassion exhaustion, "freshness", and providing high-quality services. Metric: At least one training provided each year; the number of providers trained Lead Program: Arizona AIDS Education and Training Center Partners: Ryan White Part B Program, HIV Prevention Program, State/County Entities, Tribal Entities, Community-Based Organizations, Medical Provider Organizations Start/End: 2017 to 2021
  • 169.
    SOUTHERN ARIZONA 161 GOAL2: INCREASE ACCESS TO CARE AND IMPROVE HEALTH OUTCOMES FOR PEOPLE LIVING WITH HIV. Objective 1: Increase the percentage of newly diagnosed persons linked to HIV medical care within one month of their HIV diagnosis to at least 85%. Strategy 2: Community Engagement 2.1.2.1 Develop and implement outreach strategies that improve collaboration and communication with private medical providers and the Veterans Administration related to reporting of new HIV diagnoses and lab results for HIV clients. Metric: Outreach strategies developed and implemented; evaluation of improvements in reporting Lead Program: HIV Surveillance Program Partners: Ryan White Programs, Arizona AIDS Education and Training Center, Private Medical Providers Start/End: 2017 to 2021 2.1.2.2 Develop and implement a community-led initiative to establish informal and formal methodologies to educate private providers regarding HIV reporting and HIV care. Metric: The development and implementation of the initiative; the number of providers educated Lead Program: Arizona AIDS Education and Training Center Partners: Ryan White Programs, State/County Entities, Tribal Entities, Private Medical Providers, Community-Based Organizations Start/End: 2017 to 2019
  • 170.
    162 SOUTHERN ARIZONA GOAL2: INCREASE ACCESS TO CARE AND IMPROVE HEALTH OUTCOMES FOR PEOPLE LIVING WITH HIV. Objective 1: Increase the percentage of newly diagnosed persons linked to HIV medical care within one month of their HIV diagnosis to at least 85%. Strategy 3: Prevention, Testing and Linkage to Care 2.1.3.1 Annually, provide at least one training opportunity each year, designed to increase communication between HIV agencies to improve linkage to care/retention in care. Metric: Presentation of at least one training each year. Lead Program: HIV Prevention Program Partners: Ryan White Programs, Arizona AIDS Education and Training Center, State/County Entities, Tribal Entities, Community-Based Organizations Start/End: 2018 to 2021
  • 171.
    SOUTHERN ARIZONA 163 GOAL2: INCREASE ACCESS TO CARE AND IMPROVE HEALTH OUTCOMES FOR PEOPLE LIVING WITH HIV. Objective 2 Increase the percentage of persons with diagnosed HIV infection who are retained in care to at least 90%. Strategy 1: Streamline Processes 2.2.1.1 Assess the ability of Pima County Health Department and community providers to increase availability of Benefits Navigation services, in order to decrease the number of clients who drop out of care due to difficulties navigating their benefits enrollment/re-enrollment and/ or insurance coverage. Metric: Completion of the assessment and implementation of Benefits Navigation services Lead Program: Ryan White Part B Program Partners: State/County Entities, Community-Based Organizations Start/End: 2017 to 2018 2.2.1.2 Implement an acuity-focused service delivery model for case management services, designed to improve care coordination of clients erratically engaged in care, and empower clients to transition from case-managed care to self-managed care. Metric: Implementation of the service delivery model Lead Program: Ryan White Part B Program Partners: Case Management Providers, Community-Based Organizations, Ryan White Clients Start/End: 2018 to 2019 2.2.1.3 Identify three-to-four Benefits Navigators to assist with off-season insurance enrollment. Metric: Navigators identified and contracted Lead Program: Ryan White Part B Program Partners: State/County Entities, Existing Benefits Navigators, Community-Based Organizations Start/End: 2017 to 2019
  • 172.
    164 SOUTHERN ARIZONA GOAL2: INCREASE ACCESS TO CARE AND IMPROVE HEALTH OUTCOMES FOR PEOPLE LIVING WITH HIV. Objective 2 Increase the percentage of persons with diagnosed HIV infection who are retained in care to at least 90%. Strategy 2: Patient-Centered Care 2.2.2.1 Establish workgroups to evaluate service delivery models for mental health, substance use, and housing/homeless services, and post-incarceration engagement in care services. Metric: The workgroups are established; an evaluation is completed Lead Program: HIV Statewide Advisory Group Partners: Ryan White Part B Program, State/County Entities, Tribal Entities, Community-Based Organizations, Community Stakeholders Start/End: 2018 to 2021 2.2.2.2 Develop and implement strategies to strengthen referral processes for people living with HIV who are recently-released from jail, identified in emergency departments, etc. Metric: The strategies are developed and implemented Lead Program: Ryan White Part B Program Partners: State/County Entities, Tribal Entities, Correctional Facilities, Hospitals, Community-Based Organizations, Community Stakeholders Start/End: 2018 to 2021 2.2.2.3 Evaluate and implement methods to incentivize people living with HIV who are released from correctional facilities to become engage in care. Metric: Methods are evaluated and implemented; the number of clients receiving an incentive Lead Program: Ryan White Part B Program Partners: State/County Entities, Tribal Entities, Correctional Facilities, Community-Based Organizations, Community Stakeholders Start/End: 2018 to 2021
  • 173.
    SOUTHERN ARIZONA 165 Strategy2: Patient-Centered Care continued 2.2.2.4 Educate private providers about the availability of Ryan-White funded HIV services, other HIV services available in the community, and the importance of referring clients to these services (better health outcomes, engagement in care, etc.). Metric: The number of providers educated Lead Program: Ryan White Part B Program Partners: Private Medical Provider Networks, County/State Entities, Tribal Entities, Arizona AIDS Education and Training Center, Correctional Facilities, Community-Based Organizations Start/End: 2018 to 2020
  • 174.
    166 SOUTHERN ARIZONA GOAL2: INCREASE ACCESS TO CARE AND IMPROVE HEALTH OUTCOMES FOR PEOPLE LIVING WITH HIV. Objective 2 Increase the percentage of persons with diagnosed HIV infection who are retained in care to at least 90%. Strategy 3: Data Standardization 2.2.3.1 Assess the ability to develop and implement a universal database/data sharing process among HIV partners. Metric: Completion of the assessment; action items identified Lead Program: Ryan White Part B Program Partners: Ryan White Programs, County/State Entities, Tribal Entities, Arizona AIDS Education and Training Center, Correctional Facilities, Community-Based Organizations Start/End: 2017 to 2019 2.2.3.2 Annually, expand the utilization of HIV care, prevention, and PrEP continuum of care models by at least one non-Ryan White funded medical provider Metric: At least one non-Ryan White medical provider engages in the use of continuum of care models each year Lead Program: Ryan White Part B Program Partners: Ryan White Programs, Arizona AIDS Education and Training Center Start/End: 2018 to 2021
  • 175.
    SOUTHERN ARIZONA 167 GOAL2: INCREASE ACCESS TO CARE AND IMPROVE HEALTH OUTCOMES FOR PEOPLE LIVING WITH HIV. Objective 2 Increase the percentage of persons with diagnosed HIV infection who are retained in care to at least 90%. Strategy 4: Education 2.2.4.1 Biannually, provide at least one regional training for primary medical providers that includes information on HIV, extra-genital STD screening, and retention in care. Metric: At least one training completed every two years Lead Program: Arizona AIDS Education and Training Center Partners: Ryan White Part B Program, State/County Entities, Tribal Entities, Local Medical Providers, HIV Prevention Program, Community-Based Organizations Start/End: 2018 to 2020 2.2.4.2 Increase the number of HIV providers who are trained in the diagnosis, treatment and management of HIV. Metric: The number of providers trained each year Lead Program: Arizona AIDS Education and Training Center Partners: Ryan White Part B Program, State/County Entities, Tribal Entities, Local Medical Providers, HIV Prevention Program, Community-Based Organizations Start/End: 2017 to 2021 2.2.4.3 Annually, present at least one regional provider training, in collaboration with national providers. Metric: The completion of at least one regional provider training each year Lead Program: Ryan White Part B Program Partners: Arizona AIDS Education and Training Center, State/County Entities, Tribal Entities, Local Medical Providers, HIV Prevention Program, Community-Based Organizations Start/End: 2017 to 2020
  • 176.
    168 SOUTHERN ARIZONA GOAL3: INCREASE ACCESS TO CARE AND IMPROVE HEALTH OUTCOMES FOR PEOPLE LIVING WITH HIV. Objective 1: Reduce the percentage of persons in HIV medical care who are homeless to no more than 5%. Strategy 1: Funding 3.1.1.1 Complete an assessment of the housing needs of people living with HIV in Pima County. Metric: The completion of the assessment; action items identified Lead Program: HIV Statewide Advisory Group Partners: Ryan White Part B Program, State/County Entities, Tribal Entities, Local Medical Providers, HIV Prevention Program, HOPWA, Housing Providers, Correctional Facilities, Community- Based Organizations, Community Stakeholders Start/End: 2017 to 2018 3.1.1.2 Identify resources to address medication storage at safe spaces for people living with HIV who are homeless. Metric: Identification of resources; information distributed to community stakeholders Lead Program: HIV Statewide Advisory Group Partners: Ryan White Part B Program, State/County Entities, Tribal Entities, Local Medical Providers, HIV Prevention Program, HOPWA, Housing Providers, Correctional Facilities, Community- Based Organizations, Community Stakeholders Start/End: 2018 to 2019
  • 177.
    SOUTHERN ARIZONA 169 GOAL3: INCREASE ACCESS TO CARE AND IMPROVE HEALTH OUTCOMES FOR PEOPLE LIVING WITH HIV. Objective 1: Reduce the percentage of persons in HIV medical care who are homeless to no more than 5%. Strategy 2: Quality Housing 3.1.2.1 Collaborate with community partners to improve referral mechanisms and partnerships, in order to increase the ability of people living with HIV to find and obtain quality housing. Metric: Referral mechanisms and partnerships evaluated; improvement activities completed Lead Program: Ryan White Part B Program Partners: State/County Entities, Tribal Entities, Local Medical Providers, HIV Prevention Program, HOPWA, Housing Providers, Correctional Facilities, Community-Based Organizations, Community Stakeholders Start/End: 2018 to 2019
  • 178.
    170 SOUTHERN ARIZONA GOAL3: INCREASE ACCESS TO CARE AND IMPROVE HEALTH OUTCOMES FOR PEOPLE LIVING WITH HIV. Objective 1: Reduce the percentage of persons in HIV medical care who are homeless to no more than 5%. Strategy 3: Community Engagement 3.1.3.1 Create a resource list of housing services providers. Metric: Resource list completed and distributed to community stakeholders Lead Program: HIV Statewide Advisory Group Partners: Primavera Foundation, State/County Entities, Tribal Entities, Local Medical Providers, HIV Prevention Program, HOPWA, Housing Providers, Correctional Facilities, Community-Based Organizations, Community Stakeholders Start/End: 2017 to 2019 3.1.3.2 Identify key partners outside of the HIV community that can support people living with HIV to enter/engage in housing services, and promote the availability of HIV services to these entities. Metric: Identification of partners Lead Program: HIV Statewide Advisory Group Partners: Primavera Foundation, State/County Entities, Tribal Entities, Local Medical Providers, HIV Prevention Program, HOPWA, Housing Providers, Correctional Facilities, Community- Based Organizations, Community Stakeholders Start/End: 2018 to 2019
  • 179.
    SOUTHERN ARIZONA 171 GOAL3: INCREASE ACCESS TO CARE AND IMPROVE HEALTH OUTCOMES FOR PEOPLE LIVING WITH HIV. Objective 2: Reduce disparities in the rate of new diagnoses by at least 15% in the following groups: gay and bisexual men, young Black gay and bisexual men, and Black females. Strategy 1: Community Engagement 3.2.1.1 Assess, and then establish collaboration and service delivery among health-based and non- health-based community entities that “goes to the community” rather than expecting target populations to come to existing services. Metric: Completion of the assessment; partnerships and service delivery revisions implemented Lead Program: Ryan White Part B Program Partners: HIV Prevention Program, State/County Entities, Tribal Entities, Community-Based Organizations, African American Health Coalition, NAACP, Black Lives Matter, Clinica Amistad, Hispanic Chamber of Commerce, UofA Mobile Clinic, Tribes, Tucson Indian Center, Border Health Network Start/End: 2017 to 2021 3.2.1.2 Establish collaborations with colleges, fraternities/sororities, faith-based organizations/ coalitions, organizations serving communities of color, etc. to provide education and awareness of HIV, engagement in HIV testing among target populations, and community mobilization to address issues that hinder communities of color from addressing HIV issues. Metric: The number of collaborations established Lead Program: HIV Prevention Program Partners: Ryan White Part B Program, State/County Entities, Tribal Entities, Community-Based Organizations, African American Health Coalition, NAACP, Black Lives Matter, Clinica Amistad, Hispanic Chamber of Commerce, UofA Mobile Clinic, Tribes, Tucson Indian Center, Border Health Network Start/End: 2017 to 2019
  • 180.
    172 SOUTHERN ARIZONA Strategy1: Community Engagement continued 3.2.1.3 Establish HIV Statewide Advisory Group workgroups to address the service needs of target communities, and health disparities and social justice issues that affect entry to, and engagement in medical care. Recruit community partners to take participate in planning efforts and implementation of activities. Metric: The establishment of workgroups and recruitment of community partners Lead Program: HIV Statewide Advisory Group Partners: Ryan White Part B Program, State/County Entities, Tribal Entities, Community-Based Organizations, Social Justice Groups, African American Health Coalition, NAACP, Black Lives Matter, Clinica Amistad, Hispanic Chamber of Commerce, UofA Mobile Clinic, Tribes, Tucson Indian Center, Border Health Network Start/End: 2017 to 2021
  • 181.
    SOUTHERN ARIZONA 173 GOAL3: INCREASE ACCESS TO CARE AND IMPROVE HEALTH OUTCOMES FOR PEOPLE LIVING WITH HIV. Objective 2: Reduce disparities in the rate of new diagnoses by at least 15% in the following groups: gay and bisexual men, young Black gay and bisexual men, and Black females. Strategy 2: Education 3.2.2.1 Develop an Arizona-specific cultural competency training plan, with an expanded focus to include how intersections between homophobia, misogyny, racism, law enforcement interaction, and hiring practices impact HIV service delivery. Metric: The development of the plan Lead Program: Ryan White Part B Program Partners: HIV Prevention Program, State/County Entities, Tribal Entities, Community-Based Organizations, African American Health Coalition, NAACP, Black Lives Matter, Clinica Amistad, Hispanic Chamber of Commerce, UofA Mobile Clinic, Tribes, Tucson Indian Center, Border Health Network Start/End: 2018 to 2019 3.2.2.2 Annually, conduct at least one cultural-competency training according to the Arizona- specific plan. Metric: At least one training conducted each year Lead Program: Ryan White Part B Program Partners: HIV Prevention Program, State/County Entities, Tribal Entities, Community-Based Organizations, African American Health Coalition, NAACP, Black Lives Matter, Clinica Amistad, Hispanic Chamber of Commerce, UofA Mobile Clinic, Tribes, Tucson Indian Center, Border Health Network Start/End: 2019 to 2021
  • 182.
    174 SOUTHERN ARIZONA GOAL3: INCREASE ACCESS TO CARE AND IMPROVE HEALTH OUTCOMES FOR PEOPLE LIVING WITH HIV. Objective 2: Reduce disparities in the rate of new diagnoses by at least 15% in the following groups: gay and bisexual men, young Black gay and bisexual men, and Black females. Strategy 3: Stigma Reduction 3.2.3.1 Annually, implement at least one peer-to-peer activity designed to reduce internal stigma among people living with HIV, and/or address wrap-around stigma (family members, friends, social networks, etc.). Metric: At least one activity conducted each year Lead Program: Ryan White Part B Program Partners: HIV Prevention Program, Arizona AIDS Education and Training Center, State/County Entities, Tribal Entities, Community-Based Organizations, Community Stakeholders Start/End: 2018 to 2021 3.2.3.2 Annually, present at least one training for HIV care and prevention providers related to stigma reduction and trauma-informed care. Ideally, training should coincide with medical and/or other service delivery training. Metric: At least one training is presented each year Lead Program: Ryan White Part B Program Partners: HIV Prevention Program, Arizona AIDS Education and Training Center, State/County Entities, Tribal Entities, Community-Based Organizations, Community Stakeholders Start/End: 2018 to 2021
  • 183.
    SOUTHERN ARIZONA 175 Strategy3: Stigma Reduction continued 3.2.3.3 Complete an assessment of HIV knowledge, stigma, trauma-informed care, behaviors, and education needs targeting communities of color and transmission routes. Metric: The completion of the assessment Lead Program: HIV Statewide Advisory Group Partners: State/County Entities, Tribal Entities, Local Medical Providers, HIV Prevention Program, Community-Based Organizations, Social Justice Groups Start/End: 2017 to 2019 3.2.3.4 Establish partner HIV testing as a standard of service delivery for HIV testing providers. Metric: Partner HIV testing is established and adopted as a service delivery standard Lead Program: HIV Prevention Program Partners: Ryan White Part B Program, State/County Entities, Tribal Entities, Local Medical Providers, HIV Prevention Program, Community-Based Organizations Start/End: 2018 to 2021 3.2.3.4 State and local entities collaboratively develop HIV prevention and care messaging that appropriately addresses target populations. Metric: Population-specific messaging developed Lead Program: HIV Prevention Program Partners: Ryan White Part B Program, State/County Entities, Tribal Entities, Community-Based Organizations, Community Stakeholders Start/End: 2018 to 2021
  • 184.
    176 SOUTHERN ARIZONA GOAL3: INCREASE ACCESS TO CARE AND IMPROVE HEALTH OUTCOMES FOR PEOPLE LIVING WITH HIV. Objective 3: Increase the percentage of youth and persons who inject drugs with diagnosed HIV infection who are virally suppressed to at least 80%. Strategy 1: Education 3.3.1.1 Identify and evaluate existing and needed resources that can be utilized to improve service delivery, self-efficacy and engagement in care among youth who inject drugs. Metric: Resources are identified and evaluated Lead Program: HIV Prevention Program Partners: Ryan White Part B Program, State/County Entities, Tribal Entities, Community-Based Organizations, Youth Organizations, Substance Use Providers, Case Management Providers Start/End: 2018 to 2019 3.3.1.2 Develop and implement strategies to improve service delivery, self-efficacy and engagement in care among youth who inject drugs. Metric: The strategies are implemented Lead Program: HIV Statewide Advisory Group Partners: HIV Prevention Program, Ryan White Part B Program, State/County Entities, Tribal Entities, Community-Based Organizations, Youth Organizations, Substance Use Providers, Case Management Providers Start/End: 2019 to 2021
  • 185.
    SOUTHERN ARIZONA 177 GOAL3: INCREASE ACCESS TO CARE AND IMPROVE HEALTH OUTCOMES FOR PEOPLE LIVING WITH HIV. Objective 3: Increase the percentage of youth and persons who inject drugs with diagnosed HIV infection who are virally suppressed to at least 80%. Strategy 2: Prevention, Testing & Linkage to Care 3.3.2.1 Biannually, implement at least one outreach initiatives to youth and persons who inject drugs, designed to engage individuals to be tested for HIV and/or enter medical care. Metric: The implementation of at least one outreach initiative every two years Lead Program: HIV Prevention Program Partners: Ryan White Part B Program, State/County Entities, Tribal Entities, Community-Based Organizations, Youth Organizations, Substance Use Providers, Case Management Providers Start/End: 2018 to 2020 3.3.2.2 Increase HIV testing sites for the youth and persons who inject drugs. Metric: An increase in the number of HIV testing sites that provide services for youth and persons who inject drugs. Lead Program: HIV Prevention Program Partners: Ryan White Part B Program, State/County Entities, Tribal Entities, Community-Based Organizations, Youth Organizations, Substance Use Providers, Case Management Providers Start/End: 2017 to 2021
  • 186.
    178 SOUTHERN ARIZONA GOAL3: INCREASE ACCESS TO CARE AND IMPROVE HEALTH OUTCOMES FOR PEOPLE LIVING WITH HIV. Objective 3: Increase the percentage of youth and persons who inject drugs with diagnosed HIV infection who are virally suppressed to at least 80%. Strategy 3: Community Engagement 3.3.3.1 Establish a formalized processes to engage state, county and tribal entities, local providers and community stakeholders in ongoing dialog and collaboration to improve HIV services. Explore digital methods to conduct this activity. Metric: Establishment of formalized processes Lead Program: HIV Statewide Advisory Group Partners: HIV Prevention Program, Ryan White Part B Program, Arizona AIDS Education and Training Center, State/County Entities, Tribal Entities, Community-Based Organizations, Community Stakeholders Start/End: 2018 to 2021 3.3.3.2 Develop and implement county-specific plans to obtain community engagement. Metric: Specific community engagement plans are established for each County in the southern Region Lead Program: HIV Prevention Program Partners: Ryan White Part B Program, Arizona AIDS Education and Training Center, State/County Entities, Tribal Entities, Community-Based Organizations, Community Stakeholders Start/End: 2017 to 2021
  • 187.
    SOUTHERN ARIZONA 179 GOAL4: ACHIEVE A MORE COORDINATED RESPONSE TO THE HIV EPIDEMIC. Objective 1: Increase the percentage of newly diagnosed persons linked to HIV medical care within one month of their HIV diagnosis to at least 85%. Strategy 1: Funding 4.1.1.1 Assess the availability of diverse funding opportunities, such as non-federal funding for Community-Based Organizations, and/or third-party reimbursement, for HIV prevention and care services. Metric: The completion of the assessment; utilization of information to obtain non-federal funding Lead Program: HIV Prevention Program Partners: Ryan White Part B Program, Arizona AIDS Education and Training Center, State/County Entities, Tribal Entities, Community-Based Organizations, Community Stakeholders Start/End: 2018 to 2021
  • 188.
    180 SOUTHERN ARIZONA GOAL4: ACHIEVE A MORE COORDINATED RESPONSE TO THE HIV EPIDEMIC. Objective 1: Increase the percentage of newly diagnosed persons linked to HIV medical care within one month of their HIV diagnosis to at least 85%. Strategy 2: Community Engagement 4.1.2.1 Biannually, present at least one training to community stakeholders on how to advocate for healthcare initiatives. Metric: The presentation of at least one training every two years Lead Program: HIV Statewide Advisory Group Partners: HIV Prevention Program, Ryan White Part B Program, Arizona AIDS Education and Training Center, State/County Entities, Tribal Entities, Community-Based Organizations, Community Stakeholders Start/End: 2018 to 2020 4.1.2.2 Expand partnerships, especially with non-HIV providers, to increase HIV awareness and diversify HIV services for people living with HIV and those at high-risk for acquiring HIV. Metric: Expansion of partnerships, as possible Lead Program: HIV Prevention Program Partners: Ryan White Part B Program, Arizona AIDS Education and Training Center, State/County Entities, Tribal Entities, Correctional Facilities, Community-Based Organizations, Community Stakeholders Start/End: 2017 to 2021
  • 189.
    SOUTHERN ARIZONA 181 GOAL4: ACHIEVE A MORE COORDINATED RESPONSE TO THE HIV EPIDEMIC. Objective 1: Increase the percentage of newly diagnosed persons linked to HIV medical care within one month of their HIV diagnosis to at least 85%. Strategy 3: Policy Development 4.1.3.1 Promote routine, opt-out testing as a standard of medical care. Metric: The number of opportunities for promotion that occurred Lead Program: Arizona AIDS Education and Training Center Partners: Arizona Alliance of Community Health Centers, Hospitals, HIV Prevention Program, Ryan White Part B Program, Community-Based Organizations, Other Medical Organizations Start/End: 2017 to 2021 4.1.3.2 Establish a community coalition to address HIV-related policy issues and educate policy makers on HIV issues. Metric: Establishment of a community coalition Lead Program: HIV Statewide Advisory Group Partners: HIV Prevention Program, Ryan White Part B Program, State/County Entities, Tribal Entities, Community-Based Organizations, Health Advocacy Groups Start/End: 2018 to 2021
  • 190.
    182 SOUTHERN ARIZONA Strategy3: Policy Development continued 4.1.3.3 Annually, collaborate with community partners to present cat least one comprehensive sexual education program in a school and/or to youth groups. Metric: The presentation of at least one comprehensive sexual education program each year Lead Program: HIV Statewide Advisory Group Partners: HIV Prevention Program, Ryan White Part B Program, State/County Entities, Tribal Entities, Education Entities, Community-Based Organizations, Health Advocacy Groups Start/End: 2018 to 2021
  • 191.
    SOUTHERN ARIZONA 183 GOAL4: ACHIEVE A MORE COORDINATED RESPONSE TO THE HIV EPIDEMIC. Objective 1: Increase the percentage of newly diagnosed persons linked to HIV medical care within one month of their HIV diagnosis to at least 85%. Strategy 4: Prevention, Testing & Linkage to Care 4.1.4.1 Establish same-day supplemental/confirmatory testing among testing providers, to decrease the timeframe between initial diagnosis, first labs, and first medical appointment. Metric: Same-day confirmatory testing is established Lead Program: HIV Prevention Program Partners: HIV Prevention Program, Ryan White Part B Program, State/County Entities, Tribal Entities, Community-Based Organizations Start/End: 2017 to 2021
  • 192.
    184 SOUTHERN ARIZONA GOAL4: ACHIEVE A MORE COORDINATED RESPONSE TO THE HIV EPIDEMIC. Objective 2: Increase the percentage of persons with diagnosed HIV infection who are retained in HIV medical care to at least 90%. Strategy 1: Patient-Centered Care 4.2.1.1 Provide at least one training each year to healthcare providers, medical associations, and healthcare students to engage support and commitment for patient-centered care. Metric: The presentation of at least one training per year; the number of participants Lead Program: Arizona AIDS Education and Training Center Partners: Local Healthcare Providers, Medical Schools, Colleges/Universities, Community-Based Organizations, Ryan White Part B Program, HIV Prevention Program Start/End: 2017 to 2021 4.2.1.2 Assess community capacity to expand the availability of alternative, holistic approaches to HIV care. Metric: The assessment is completed; action items are defined Lead Program: Ryan White Part B Program Partners: Local Healthcare Providers, Medical Schools, Colleges/Universities, Community-Based Organizations, HIV Prevention Program Start/End: 2019 to 2021
  • 193.
    SOUTHERN ARIZONA 185 Strategy1: Patient-Centered Care continued 4.2.1.4 Promote harm-reduction approaches to medical care to community providers. Metric: Documentation that promotion activities occurred Lead Program: Ryan White Part B Program Partners: Arizona AIDS Education and Training Center, Local Healthcare Providers, Medical Schools, Colleges/Universities, Community-Based Organizations, HIV Prevention Program Start/End: 2018 to 2021 4.2.1.5 Complete an assessment of patient-centered barriers to accessing medical care and supportive services. Metric: The assessment is completed; action items developed Lead Program: HIV Statewide Advisory Group Partners: HIV Prevention Program, Ryan White Part B Program, County/State Entities, Tribal Entities, Correctional Entities, Community-Based Organizations Start/End: 2019 to 2020
  • 194.
    186 SOUTHERN ARIZONA GOAL4: ACHIEVE A MORE COORDINATED RESPONSE TO THE HIV EPIDEMIC. Objective 2: Increase the percentage of persons with diagnosed HIV infection who are retained in HIV medical care to at least 90%. Strategy 2: Streamline Processes 4.2.2.1 Evaluate the ability for client enrollment in the Ryan White Program and ADAP to be completed by HIV testing staff, to allow for data submission and the scheduling of an initial medical appointment to occur at the time of diagnosis. Metric: The completion of an evaluation; action steps defined Lead Program: Ryan White Part B Program Partners: HIV Prevention Program, State/County Entities, Tribal Entities, Community-Based Organizations Start/End: 2019 to 2021
  • 195.
    SOUTHERN ARIZONA 187 Section3 Monitoring and Evaluation
  • 196.
    188 Monitoring and Evaluation Monitoringthe Integrated HIV Prevention and Care Plan will assist Programs and Planning Bodies with identifying ways to measure progress toward goals and objectives, selecting strategies for collecting information, and analyzing information to inform decision-making, ultimately improving HIV prevention, care, and treatment efforts. Updating Planning Bodies The Ryan White Part A Planning Council, the HIV Statewide Advisory Group, the Ryan White Part C and D Community Advisory Boards, and the Ryan White and HIV Prevention Program sub-recipients will be updated on the progress of the implementation of the Plan. Surveillance and epidemiological data will be presented on a regular basis to the Planning Bodies, to assist in following trends, and planning activities and initiatives. The Planning Bodies have dedicated time on their meeting schedules to review the Plan implementation, and solicit feedback from members and stakeholders. The Planning Bodies will provide feedback to the Ryan White and HIV Prevention Program recipients. Soliciting Feedback Each year, the HIV Prevention and Ryan White Programs host an annual HIV Symposium. In addition to general stakeholder attendance, all Program sub-recipients are required to have representatives attend. During this meeting, the Programs will provide updates on the Plan’s activities, and solicit feedback from participants. The HIV Prevention and Ryan White Programs conduct regular community advisory board meetings, focus groups, and needs assessments of target populations. These activities will be used to gain feedback from people living with HIV, and those at-risk for acquiring HIV. The Programs are collaborating on the development of a web-based feedback component on the Ending HIV in Arizona page of HIVAZ.org, the state’s comprehensive online HIV resource. This web page will be updated on Plan progress, and an email response component will allow for continuous feedback from site visitors. Feedback will be compiled quarterly and provided to the Planning Bodies for review and action.
  • 197.
    189 Monitoring and Evaluatingthe Goals and Objectives of This Plan Programs work together to monitor service utilization, develop new tracking mechanisms for acute and stage zero cases, and use geo-mapped epidemiological data to target service delivery. Information gathered from Ryan White sub-recipients, collaborative partners, and other local and national sources are also used to assess and improve health outcomes along the HIV care continuum. The HIV Statewide Advisory Group will meet quarterly to review the progress of strategies and activities defined in the plan. The Community Health Planning & Strategies Committee of the Phoenix EMA Ryan White Planning Council meets monthly, and will conduct similar reviews. These Planning Bodies will meet jointly at least once per year to collectively evaluate the Plan. The HIV Prevention and Ryan White Programs will utilize the National Quality Center’s Arizona Regional Quality Group meetings, which are held quarterly, to conduct evaluations that help to improve the quality of the HIV service delivery system across all Arizona HIV programs. Use of Surveillance and Program Data to Assess and Improve Health Outcomes The HIV Prevention and Ryan White Programs collaborate with the HIV Surveillance Program, the STD Control Program, private laboratories, and the Arizona Department of Health Services state laboratory to assure that the most current, relevant data available is available for use to drive programmatic development, monitoring and evaluation. Surveillance data and HIV testing and Partner Services data are used to monitor trends and positivity rates, and track acute cases of HIV. Electronic lab reporting data is also evaluated.
  • 198.
    We’re going toend the HIV epidemic in Arizona. You can help. Learn more at: