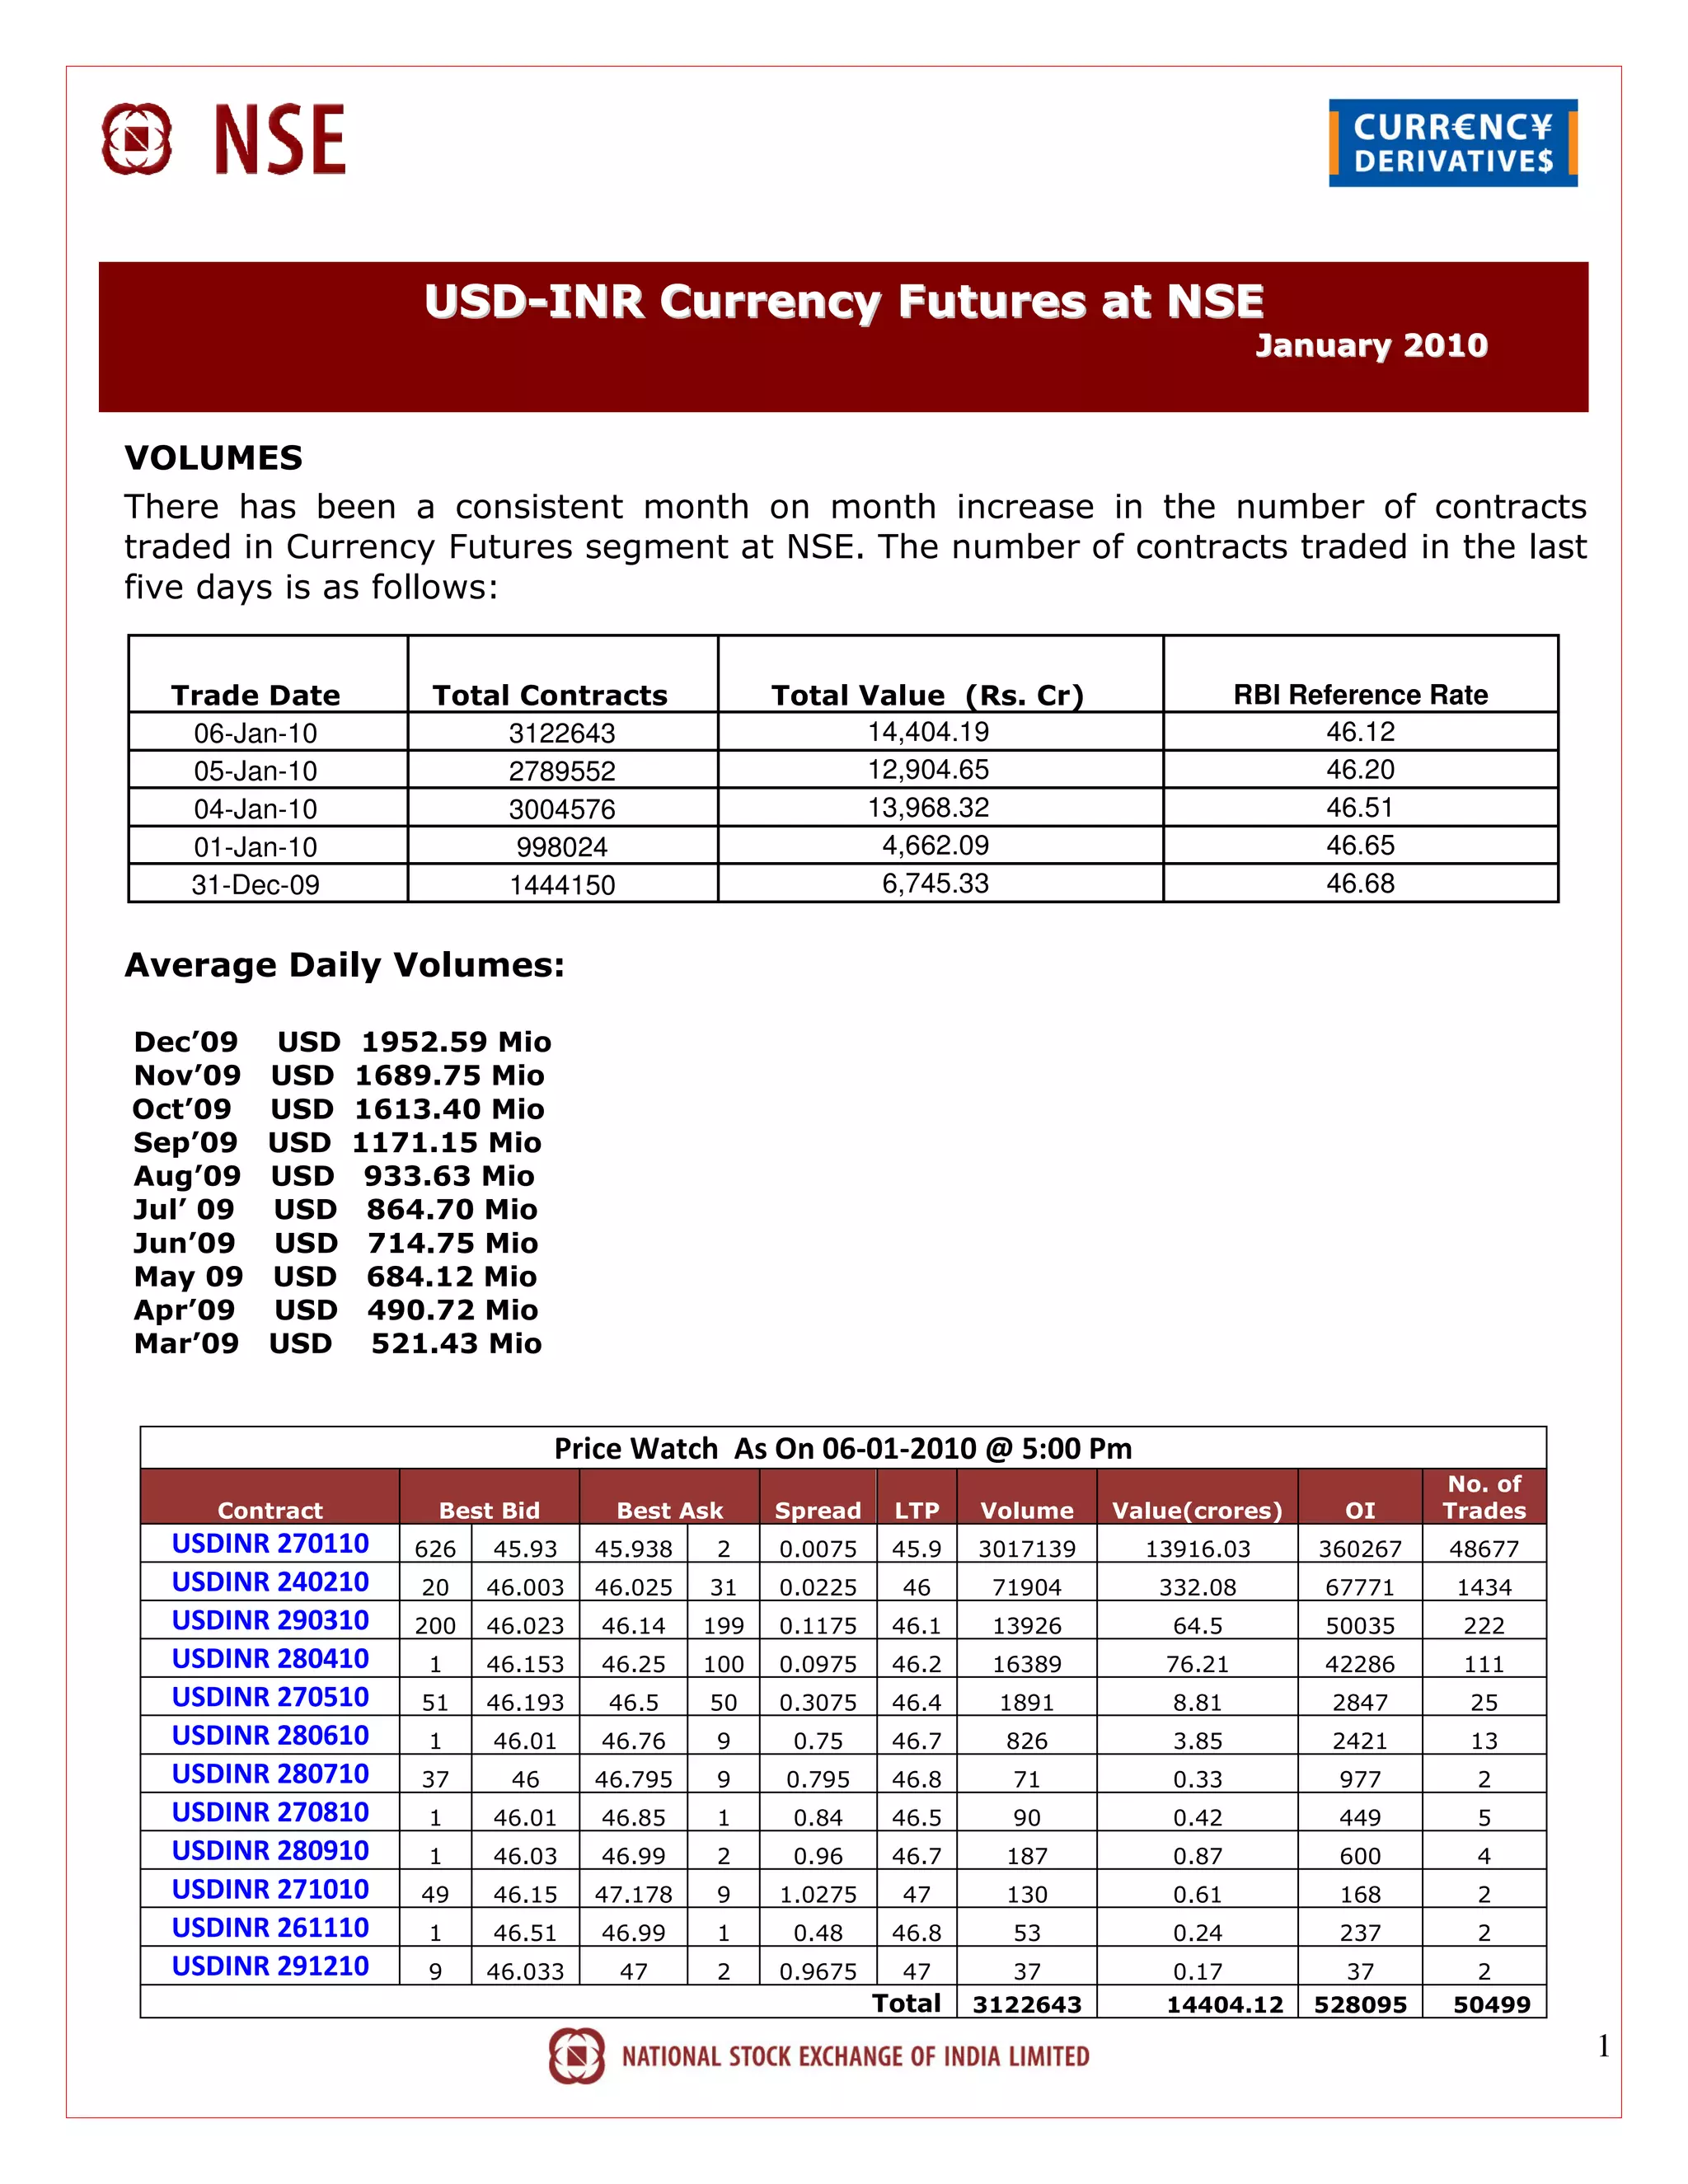
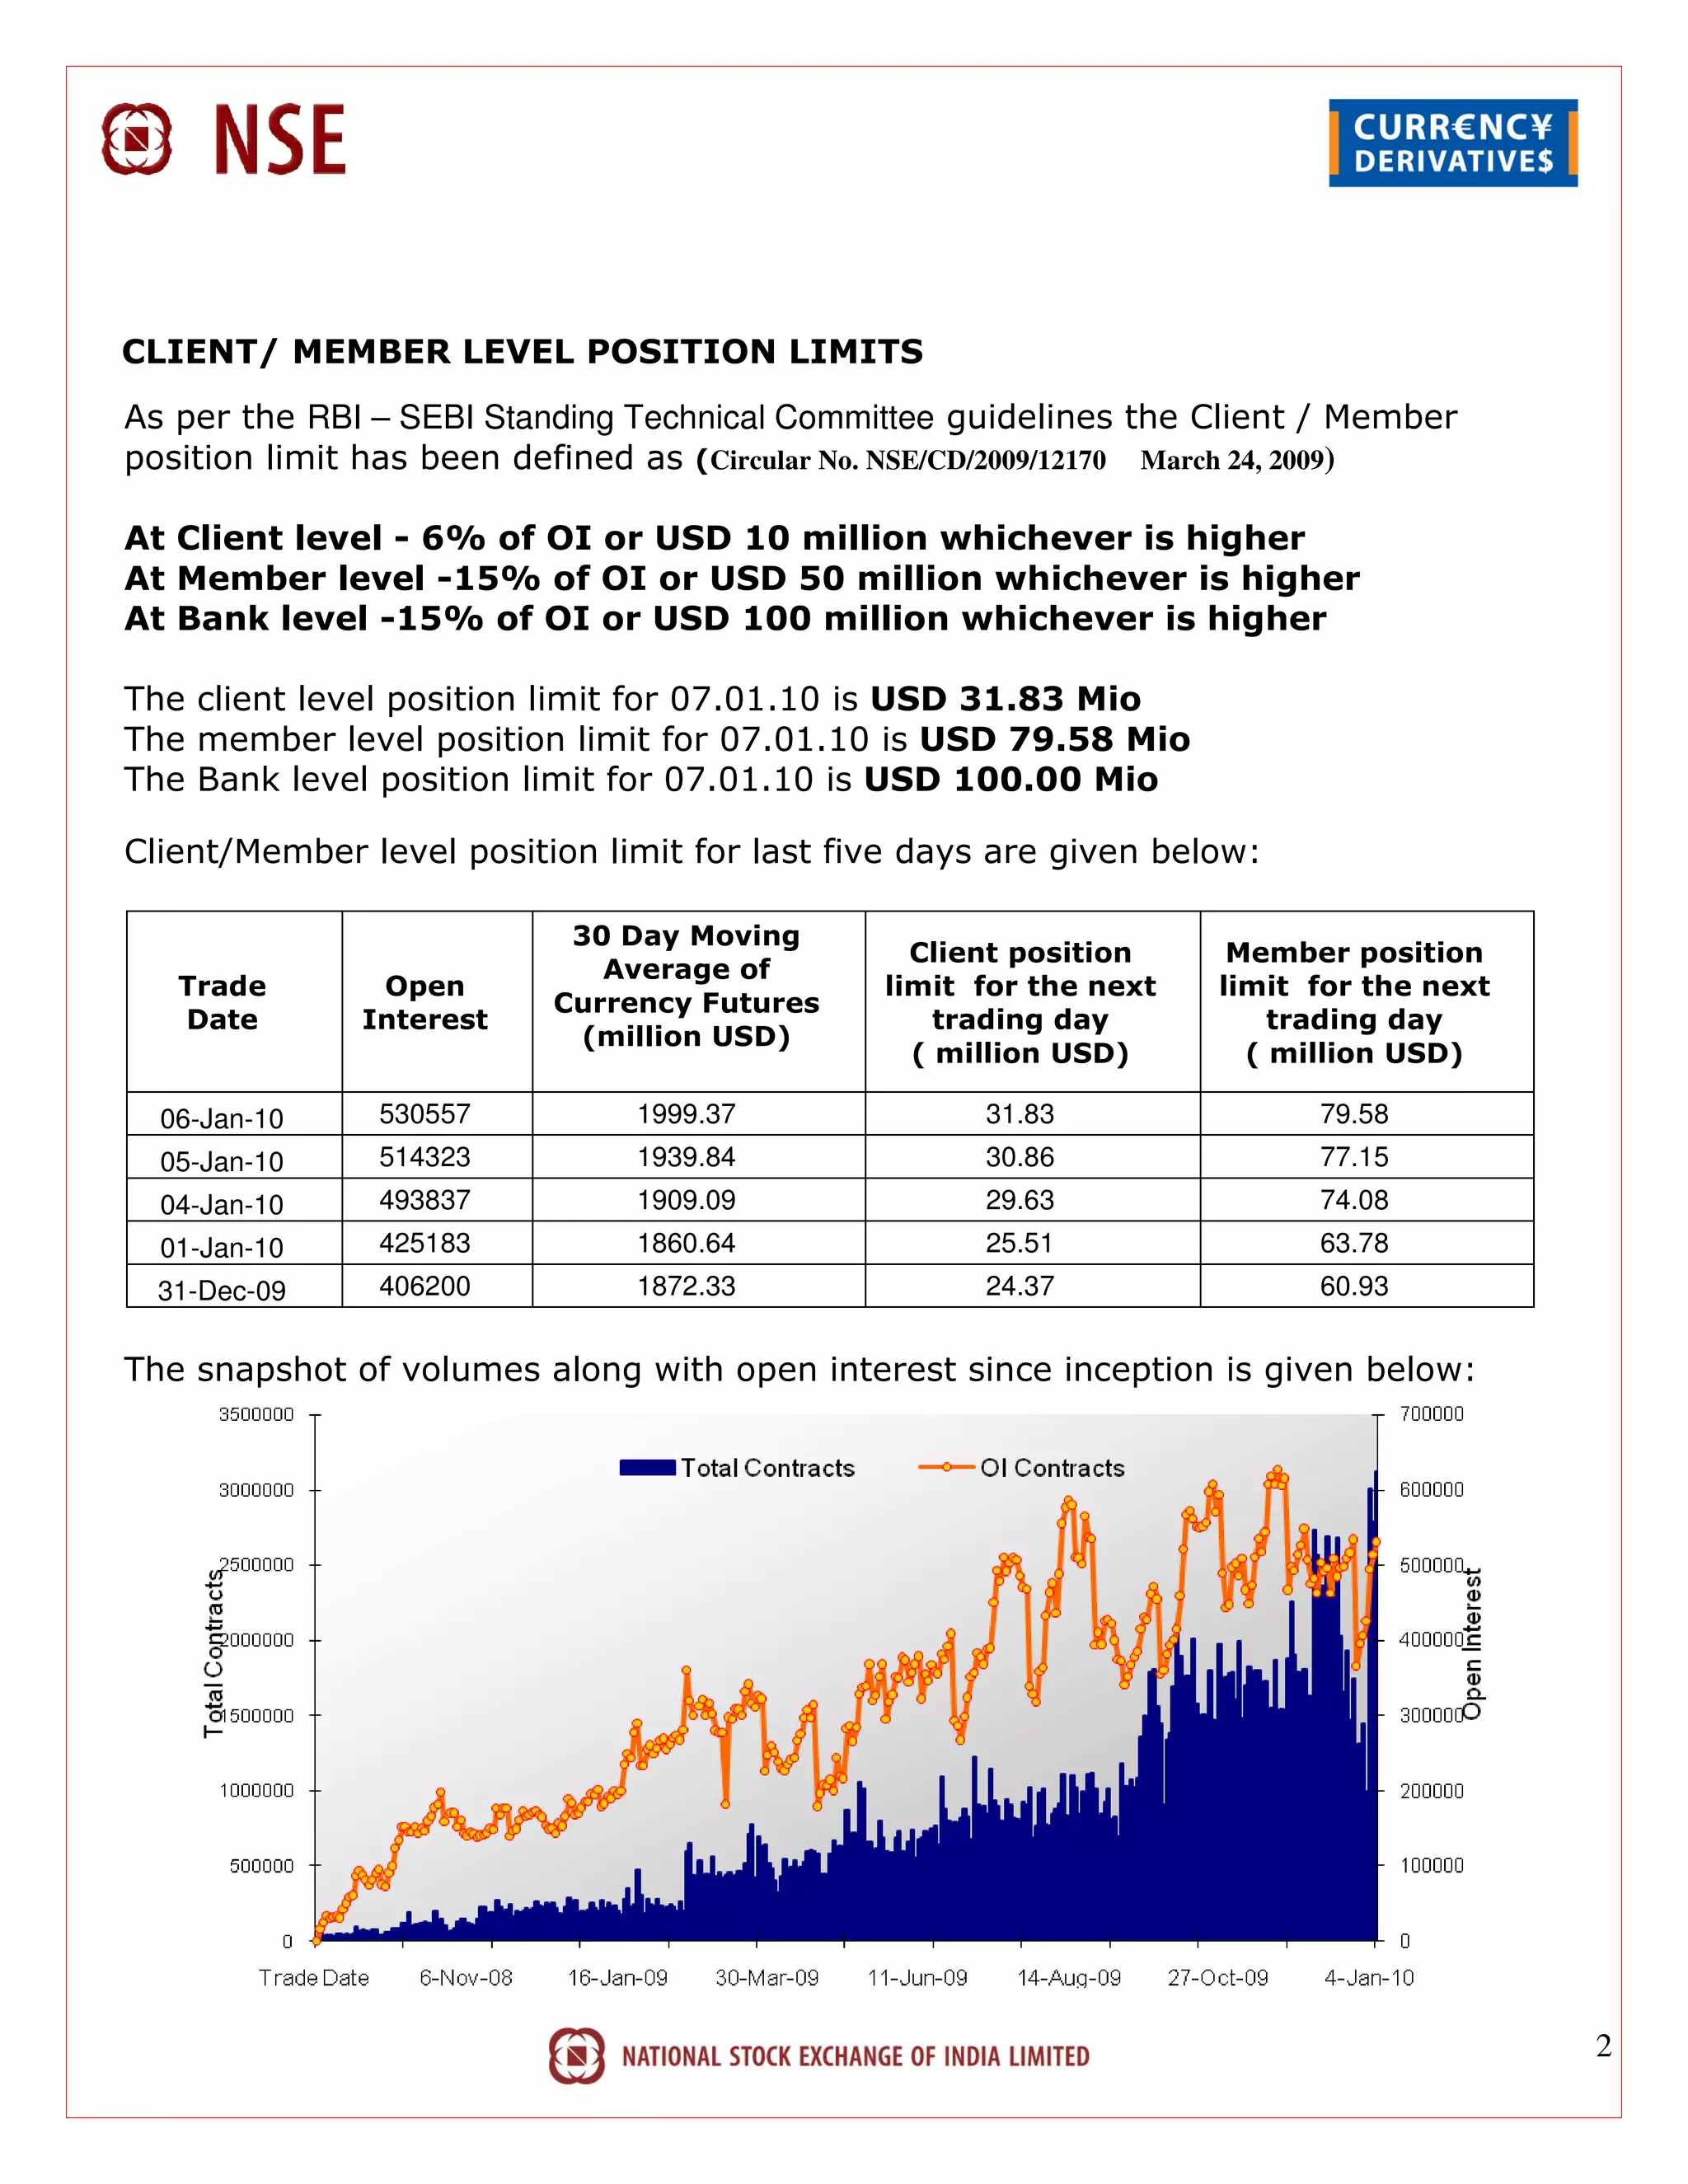
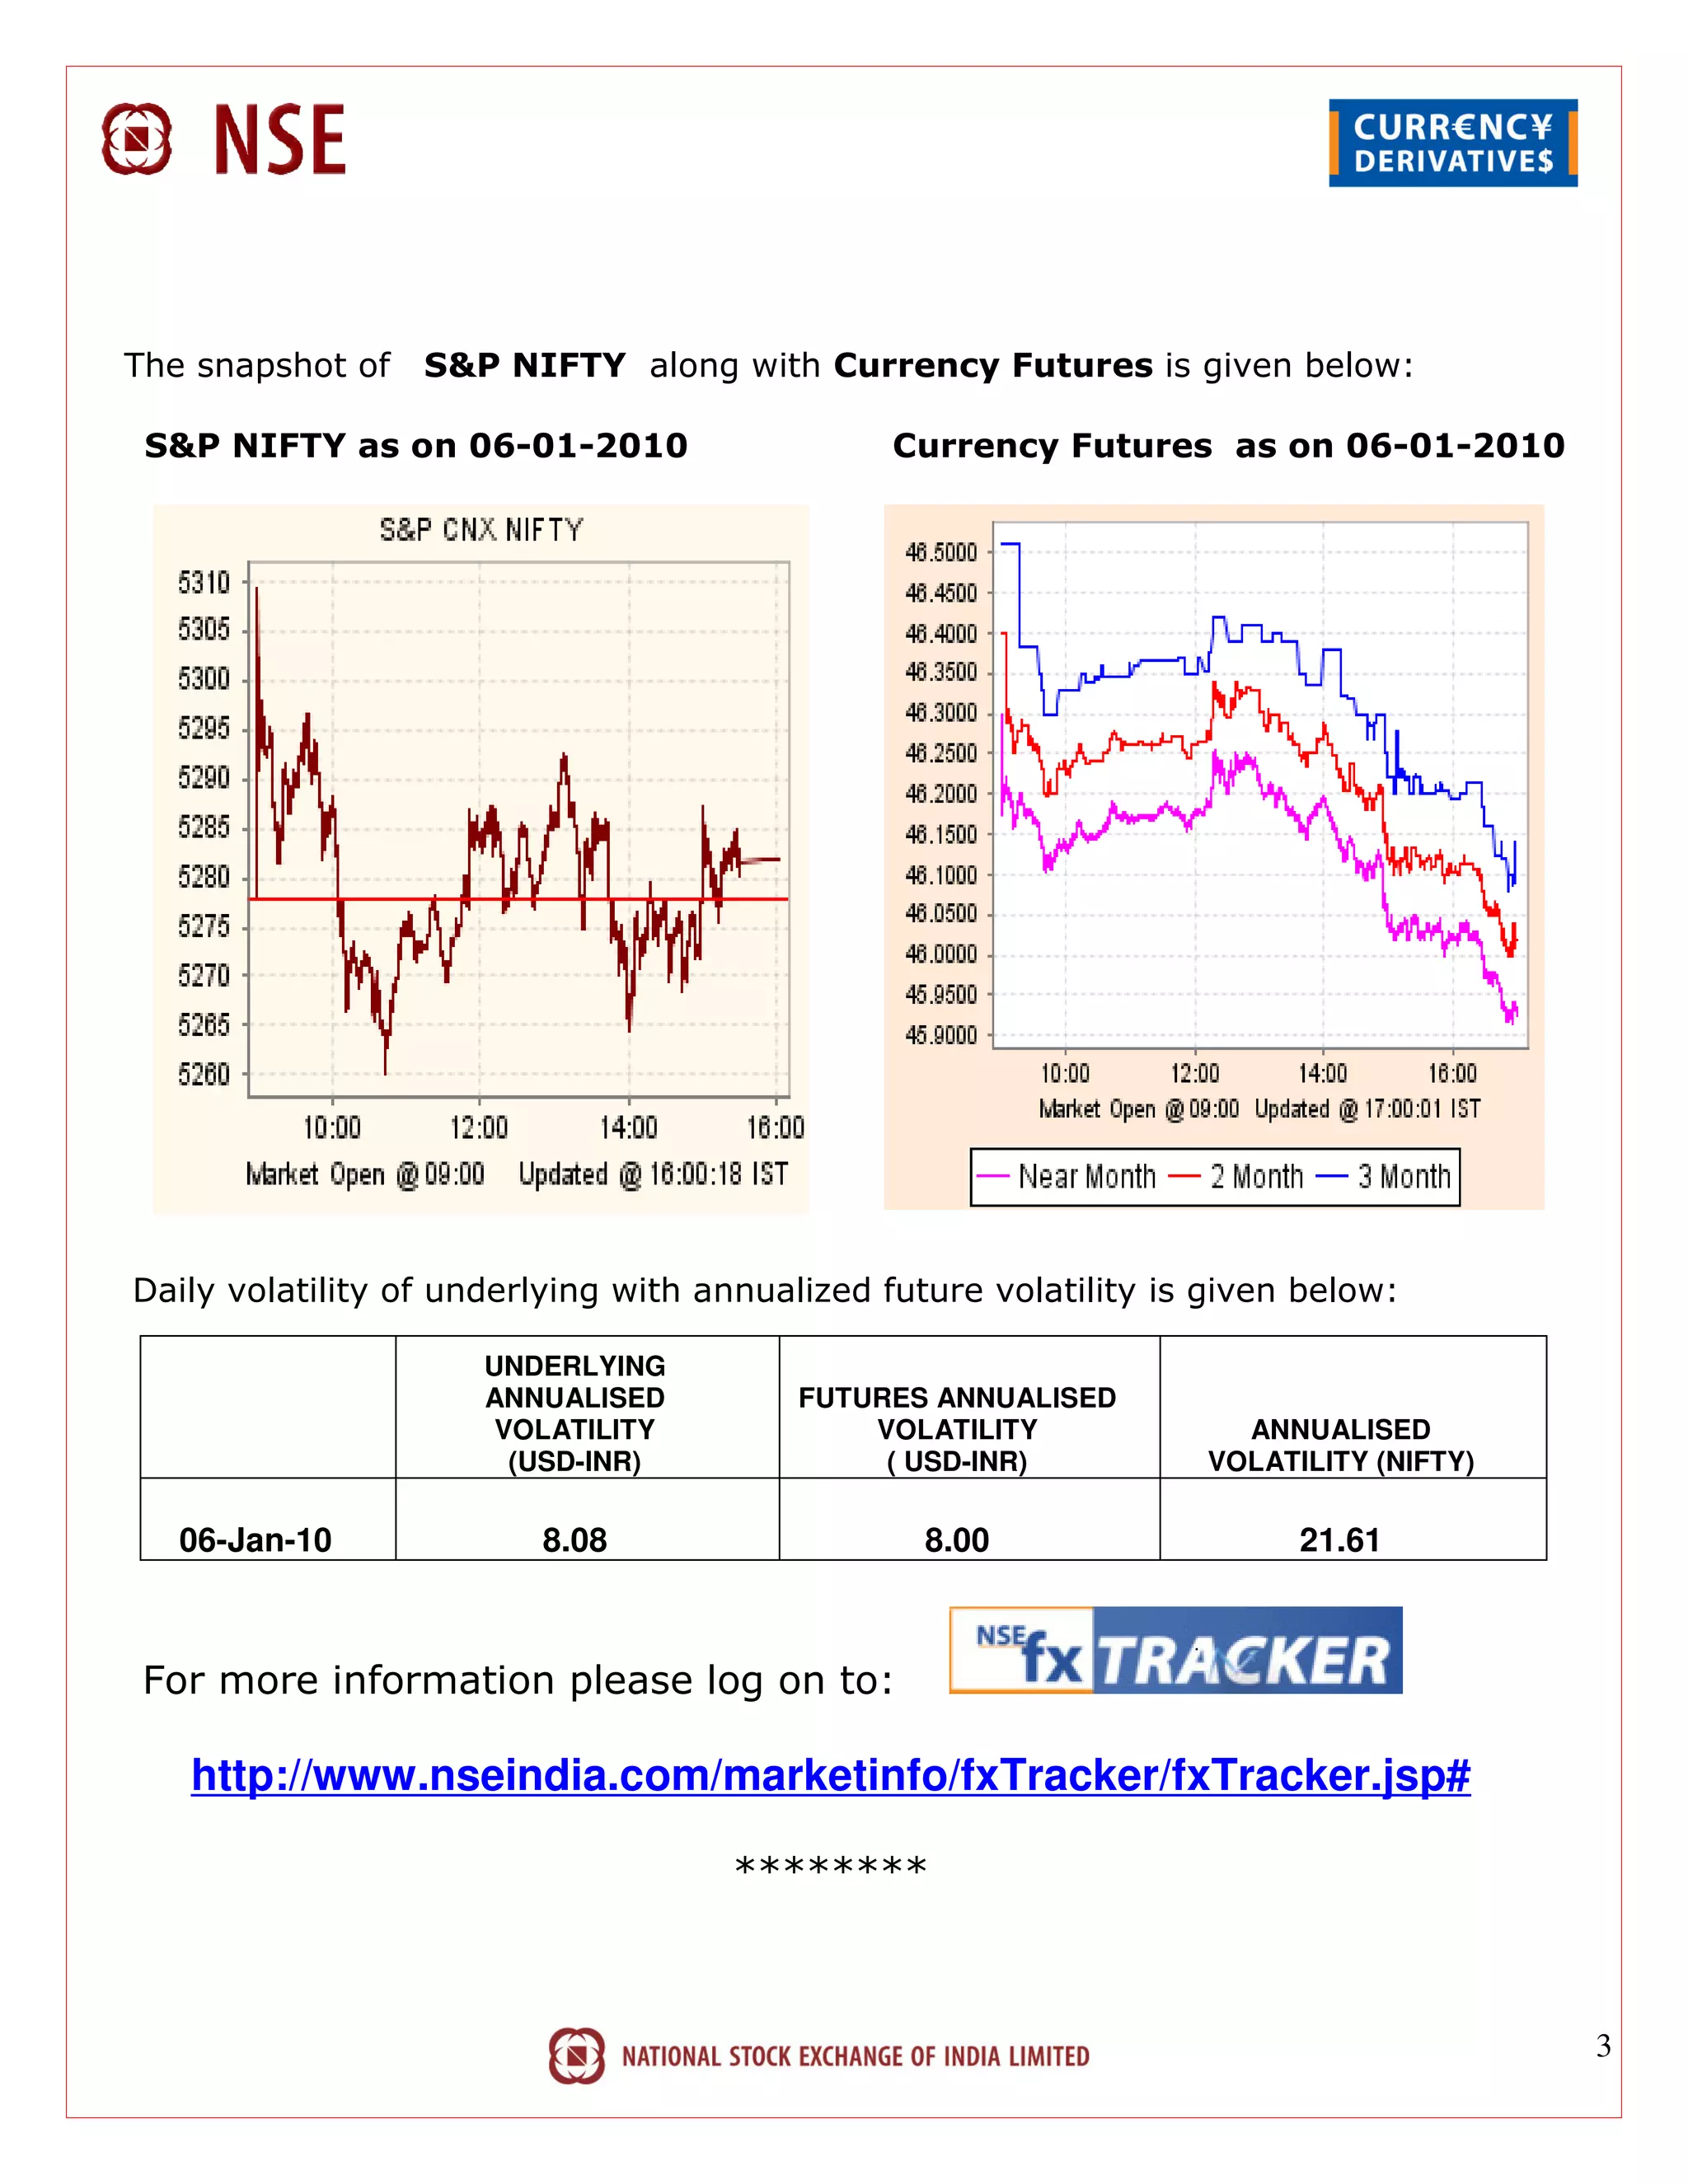
USD-INR Currency Futures at NSE
                                                                                         January 2010


VOLUMES
There has been a consistent month on month increase in the number of contracts
traded in Currency Futures segment at NSE. The number of contracts traded in the last
five days is as follows:


  Trade Date        Total Contracts              Total Value (Rs. Cr)                   RBI Reference Rate
   06-Jan-10             3122643                       14,404.19                              46.12
   05-Jan-10             2789552                       12,904.65                              46.20
   04-Jan-10             3004576                       13,968.32                              46.51
   01-Jan-10              998024                        4,662.09                              46.65
   31-Dec-09             1444150                        6,745.33                              46.68


Average Daily Volumes:

Dec’09    USD   1952.59 Mio
Nov’09    USD   1689.75 Mio
Oct’09    USD   1613.40 Mio
Sep’09    USD   1171.15 Mio
Aug’09    USD    933.63 Mio
Jul’ 09   USD    864.70 Mio
Jun’09    USD    714.75 Mio
May 09    USD    684.12 Mio
Apr’09    USD    490.72 Mio
Mar’09    USD    521.43 Mio


                               Price Watch As On 06-01-2010 @ 5:00 Pm
                                                                                                      No. of
     Contract       Best Bid       Best Ask      Spread    LTP    Volume    Value(crores)      OI     Trades
  USDINR 270110    626   45.93    45.938    2    0.0075    45.9   3017139     13916.03       360267    48677
  USDINR 240210    20    46.003   46.025   31    0.0225     46     71904       332.08         67771    1434
  USDINR 290310    200   46.023   46.14    199   0.1175    46.1    13926        64.5          50035     222
  USDINR 280410     1    46.153   46.25    100   0.0975    46.2    16389        76.21         42286     111
  USDINR 270510    51    46.193    46.5    50    0.3075    46.4    1891         8.81          2847      25
  USDINR 280610     1    46.01    46.76     9     0.75     46.7     826         3.85          2421      13
  USDINR 280710    37     46      46.795    9    0.795     46.8     71          0.33           977       2
  USDINR 270810     1    46.01    46.85     1     0.84     46.5     90          0.42           449       5
  USDINR 280910     1    46.03    46.99     2     0.96     46.7     187         0.87           600       4
  USDINR 271010    49    46.15    47.178    9    1.0275     47      130         0.61           168       2
  USDINR 261110     1    46.51    46.99     1     0.48     46.8     53          0.24           237       2
  USDINR 291210     9    46.033    47       2    0.9675     47       37         0.17           37        2
                                                          Total   3122643       14404.12     528095    50499
                                                                                                               1
CLIENT/ MEMBER LEVEL POSITION LIMITS
As per the RBI – SEBI Standing Technical Committee guidelines the Client / Member
position limit has been defined as (Circular No. NSE/CD/2009/12170 March 24, 2009)

At Client level - 6% of OI or USD 10 million whichever is higher
At Member level -15% of OI or USD 50 million whichever is higher
At Bank level -15% of OI or USD 100 million whichever is higher

The client level position limit for 07.01.10 is USD 31.83 Mio
The member level position limit for 07.01.10 is USD 79.58 Mio
The Bank level position limit for 07.01.10 is USD 100.00 Mio

Client/Member level position limit for last five days are given below:

                           30 Day Moving
                                                Client position     Member position
                             Average of
   Trade       Open                           limit for the next   limit for the next
                          Currency Futures
   Date       Interest                            trading day          trading day
                           (million USD)
                                                ( million USD)       ( million USD)

  06-Jan-10    530557          1999.37               31.83               79.58
  05-Jan-10    514323          1939.84               30.86               77.15
  04-Jan-10    493837          1909.09               29.63               74.08
  01-Jan-10    425183          1860.64               25.51               63.78
  31-Dec-09    406200          1872.33               24.37               60.93


The snapshot of volumes along with open interest since inception is given below:


                                                                                        2
The snapshot of   S&P NIFTY along with Currency Futures is given below:

 S&P NIFTY as on 06-01-2010                    Currency Futures as on 06-01-2010


Daily volatility of underlying with annualized future volatility is given below:

                      UNDERLYING
                      ANNUALISED          FUTURES ANNUALISED
                       VOLATILITY             VOLATILITY             ANNUALISED
                        (USD-INR)              ( USD-INR)          VOLATILITY (NIFTY)

   06-Jan-10             8.08                     8.00                   21.61


 For more information please log on to:

   http://www.nseindia.com/marketinfo/fxTracker/fxTracker.jsp#

                                     ********


                                                                                        3

06 01 2010 Fx Report

  • 1.
    USD-INR Currency Futuresat NSE January 2010 VOLUMES There has been a consistent month on month increase in the number of contracts traded in Currency Futures segment at NSE. The number of contracts traded in the last five days is as follows: Trade Date Total Contracts Total Value (Rs. Cr) RBI Reference Rate 06-Jan-10 3122643 14,404.19 46.12 05-Jan-10 2789552 12,904.65 46.20 04-Jan-10 3004576 13,968.32 46.51 01-Jan-10 998024 4,662.09 46.65 31-Dec-09 1444150 6,745.33 46.68 Average Daily Volumes: Dec’09 USD 1952.59 Mio Nov’09 USD 1689.75 Mio Oct’09 USD 1613.40 Mio Sep’09 USD 1171.15 Mio Aug’09 USD 933.63 Mio Jul’ 09 USD 864.70 Mio Jun’09 USD 714.75 Mio May 09 USD 684.12 Mio Apr’09 USD 490.72 Mio Mar’09 USD 521.43 Mio Price Watch As On 06-01-2010 @ 5:00 Pm No. of Contract Best Bid Best Ask Spread LTP Volume Value(crores) OI Trades USDINR 270110 626 45.93 45.938 2 0.0075 45.9 3017139 13916.03 360267 48677 USDINR 240210 20 46.003 46.025 31 0.0225 46 71904 332.08 67771 1434 USDINR 290310 200 46.023 46.14 199 0.1175 46.1 13926 64.5 50035 222 USDINR 280410 1 46.153 46.25 100 0.0975 46.2 16389 76.21 42286 111 USDINR 270510 51 46.193 46.5 50 0.3075 46.4 1891 8.81 2847 25 USDINR 280610 1 46.01 46.76 9 0.75 46.7 826 3.85 2421 13 USDINR 280710 37 46 46.795 9 0.795 46.8 71 0.33 977 2 USDINR 270810 1 46.01 46.85 1 0.84 46.5 90 0.42 449 5 USDINR 280910 1 46.03 46.99 2 0.96 46.7 187 0.87 600 4 USDINR 271010 49 46.15 47.178 9 1.0275 47 130 0.61 168 2 USDINR 261110 1 46.51 46.99 1 0.48 46.8 53 0.24 237 2 USDINR 291210 9 46.033 47 2 0.9675 47 37 0.17 37 2 Total 3122643 14404.12 528095 50499 1
  • 2.
    CLIENT/ MEMBER LEVELPOSITION LIMITS As per the RBI – SEBI Standing Technical Committee guidelines the Client / Member position limit has been defined as (Circular No. NSE/CD/2009/12170 March 24, 2009) At Client level - 6% of OI or USD 10 million whichever is higher At Member level -15% of OI or USD 50 million whichever is higher At Bank level -15% of OI or USD 100 million whichever is higher The client level position limit for 07.01.10 is USD 31.83 Mio The member level position limit for 07.01.10 is USD 79.58 Mio The Bank level position limit for 07.01.10 is USD 100.00 Mio Client/Member level position limit for last five days are given below: 30 Day Moving Client position Member position Average of Trade Open limit for the next limit for the next Currency Futures Date Interest trading day trading day (million USD) ( million USD) ( million USD) 06-Jan-10 530557 1999.37 31.83 79.58 05-Jan-10 514323 1939.84 30.86 77.15 04-Jan-10 493837 1909.09 29.63 74.08 01-Jan-10 425183 1860.64 25.51 63.78 31-Dec-09 406200 1872.33 24.37 60.93 The snapshot of volumes along with open interest since inception is given below: 2
  • 3.
    The snapshot of S&P NIFTY along with Currency Futures is given below: S&P NIFTY as on 06-01-2010 Currency Futures as on 06-01-2010 Daily volatility of underlying with annualized future volatility is given below: UNDERLYING ANNUALISED FUTURES ANNUALISED VOLATILITY VOLATILITY ANNUALISED (USD-INR) ( USD-INR) VOLATILITY (NIFTY) 06-Jan-10 8.08 8.00 21.61 For more information please log on to: http://www.nseindia.com/marketinfo/fxTracker/fxTracker.jsp# ******** 3