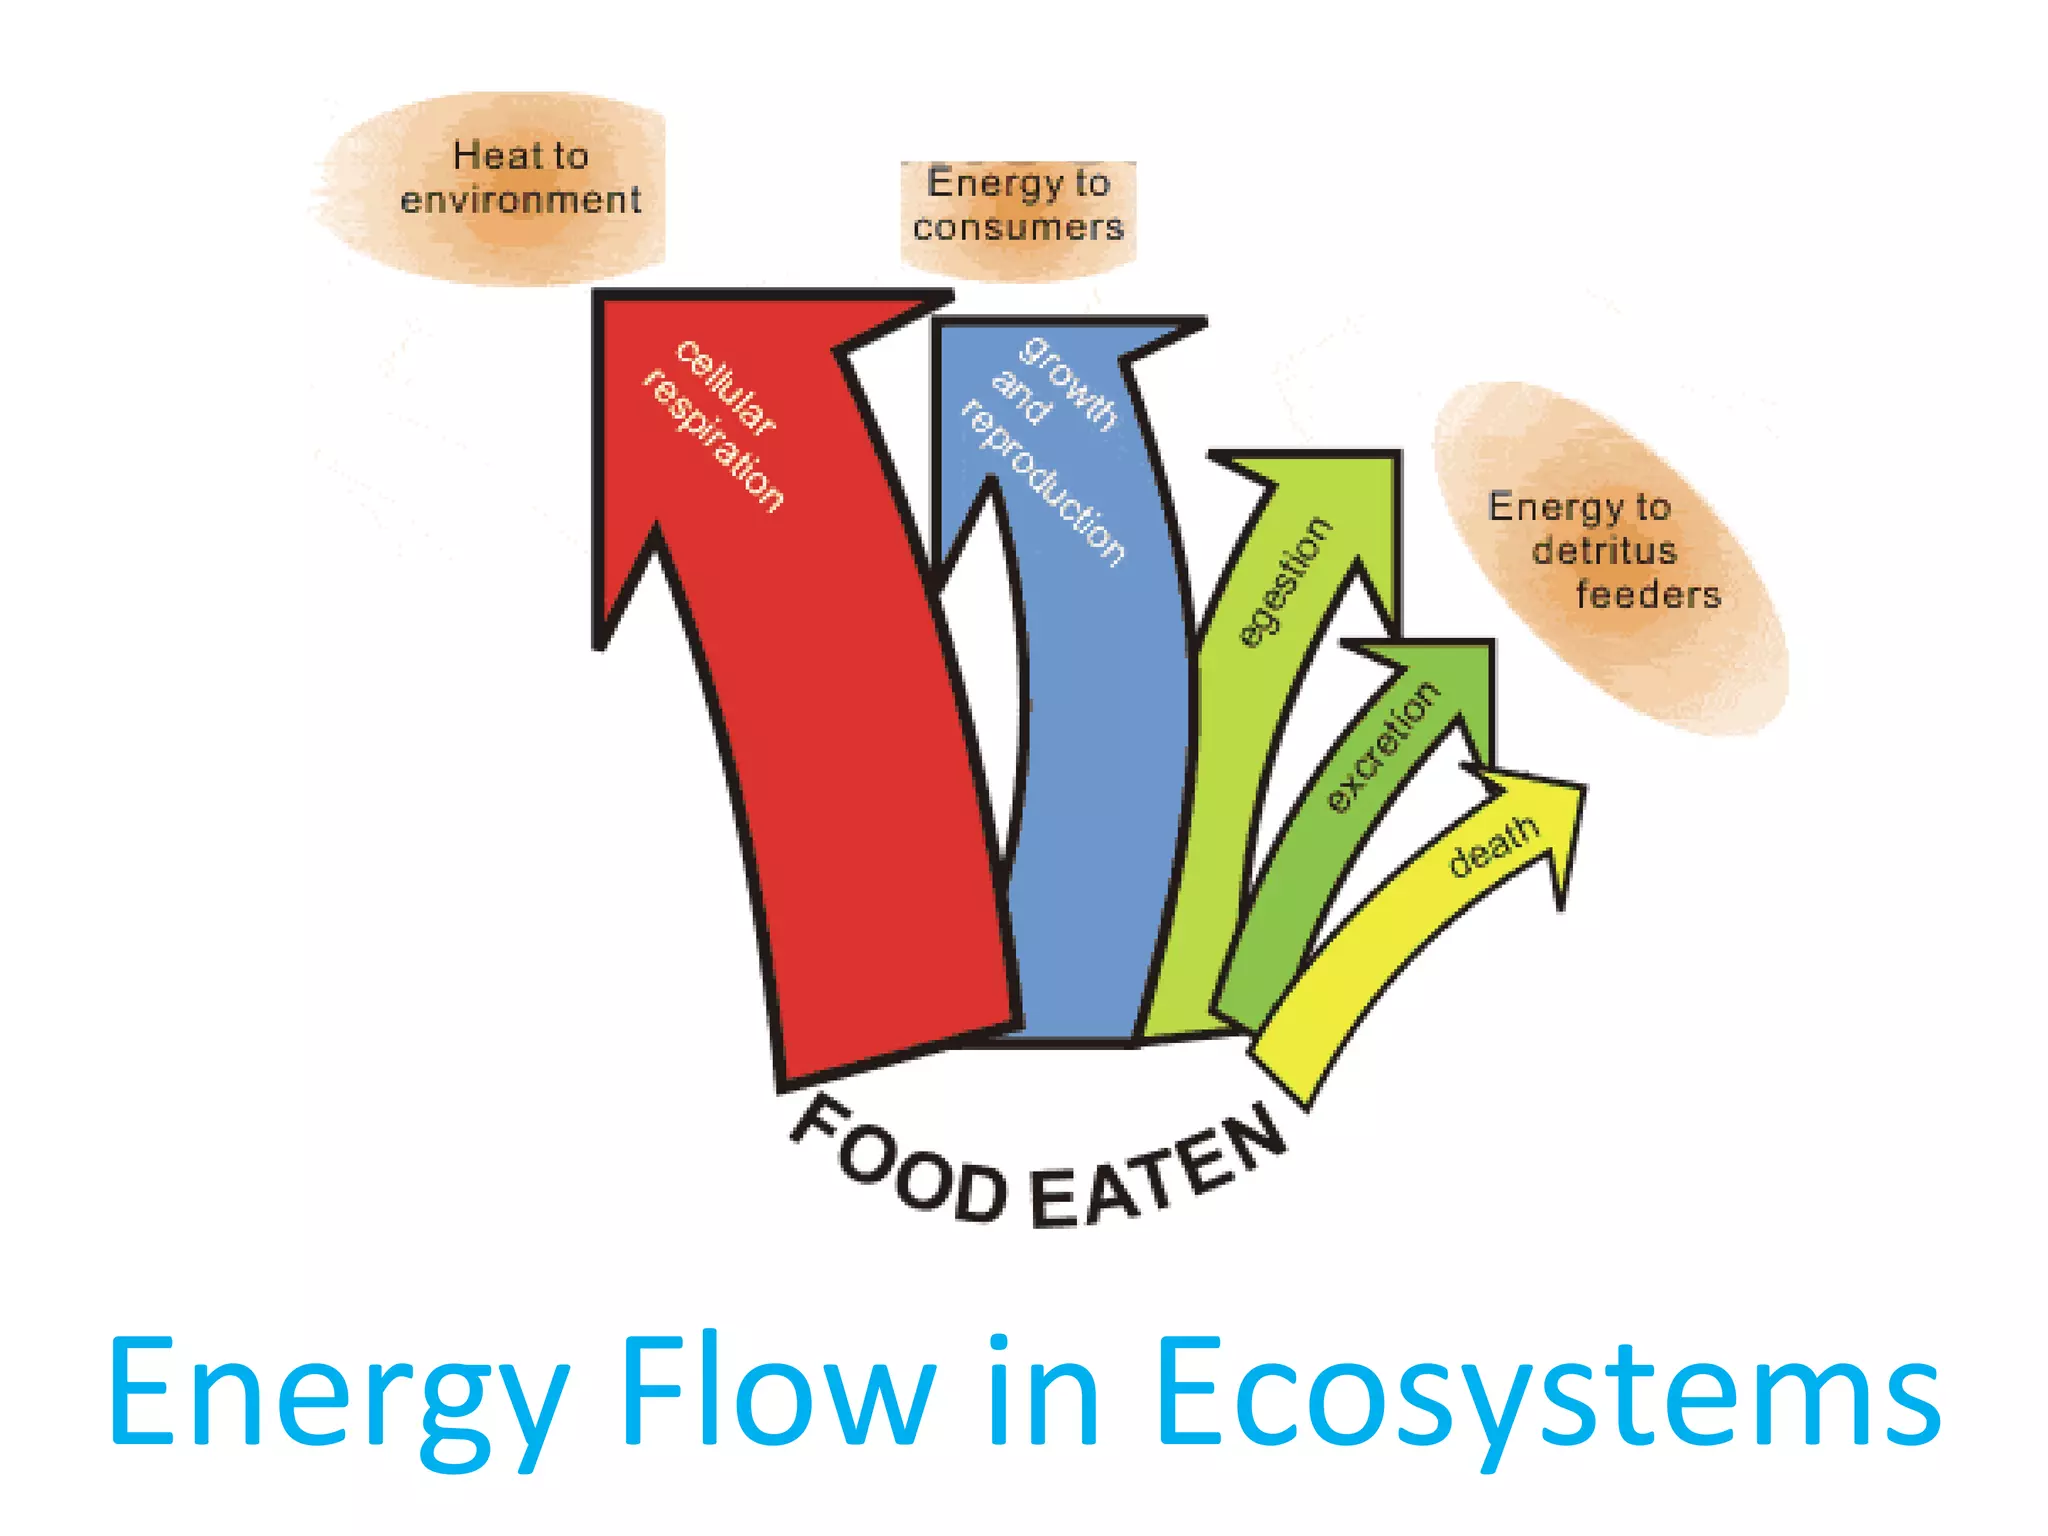
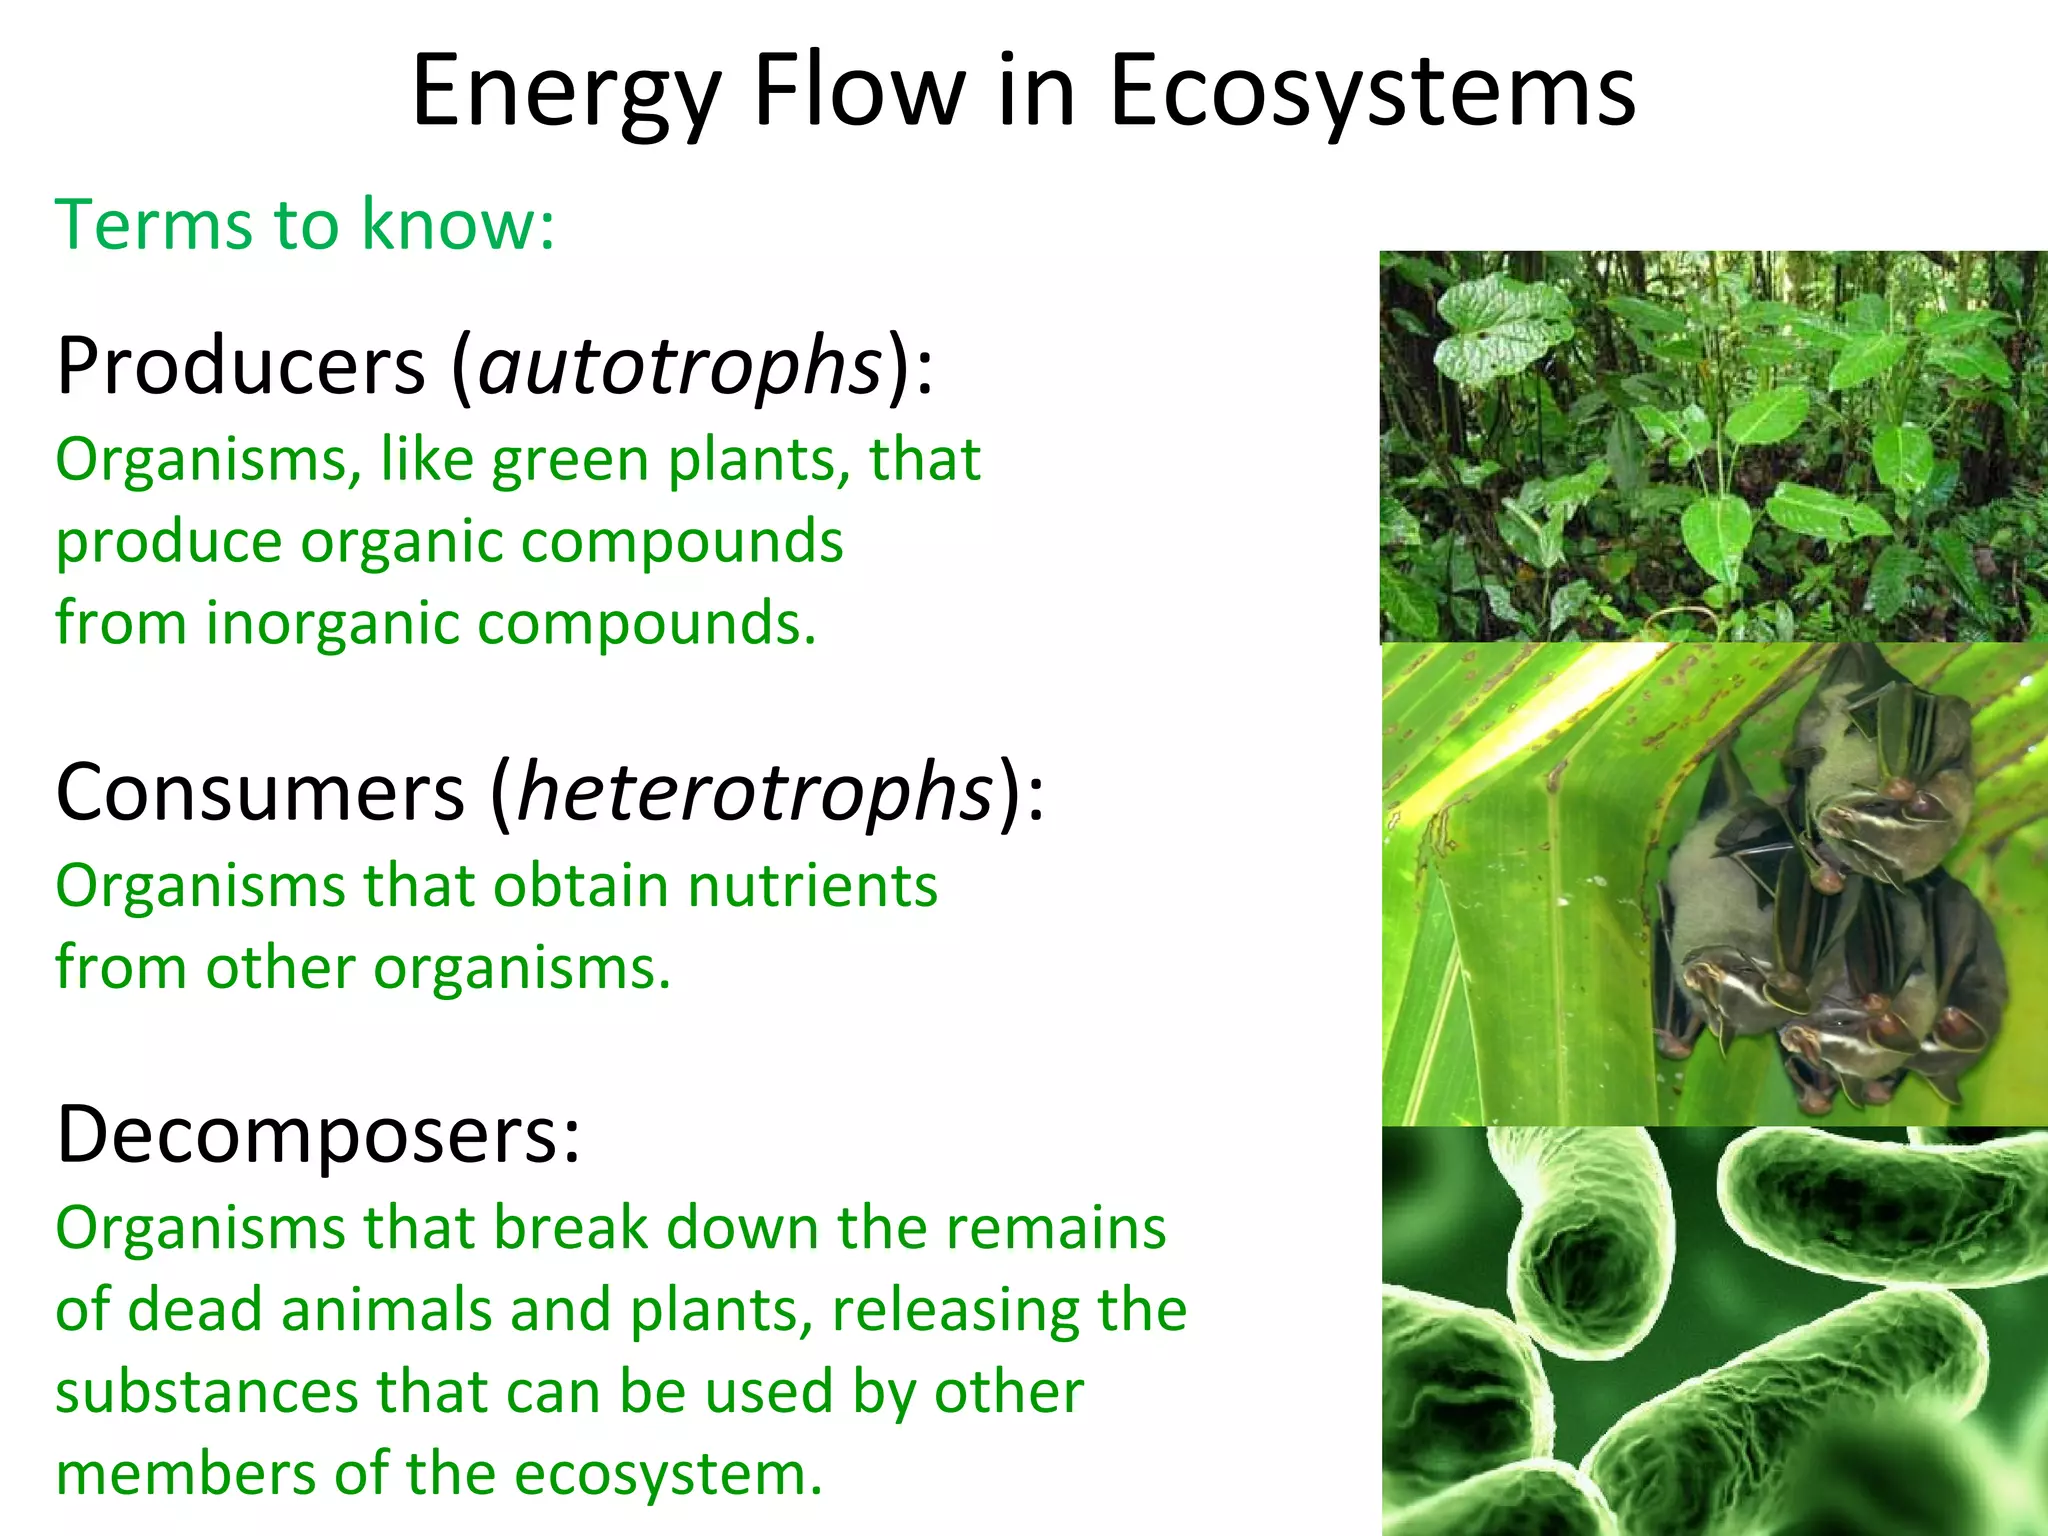
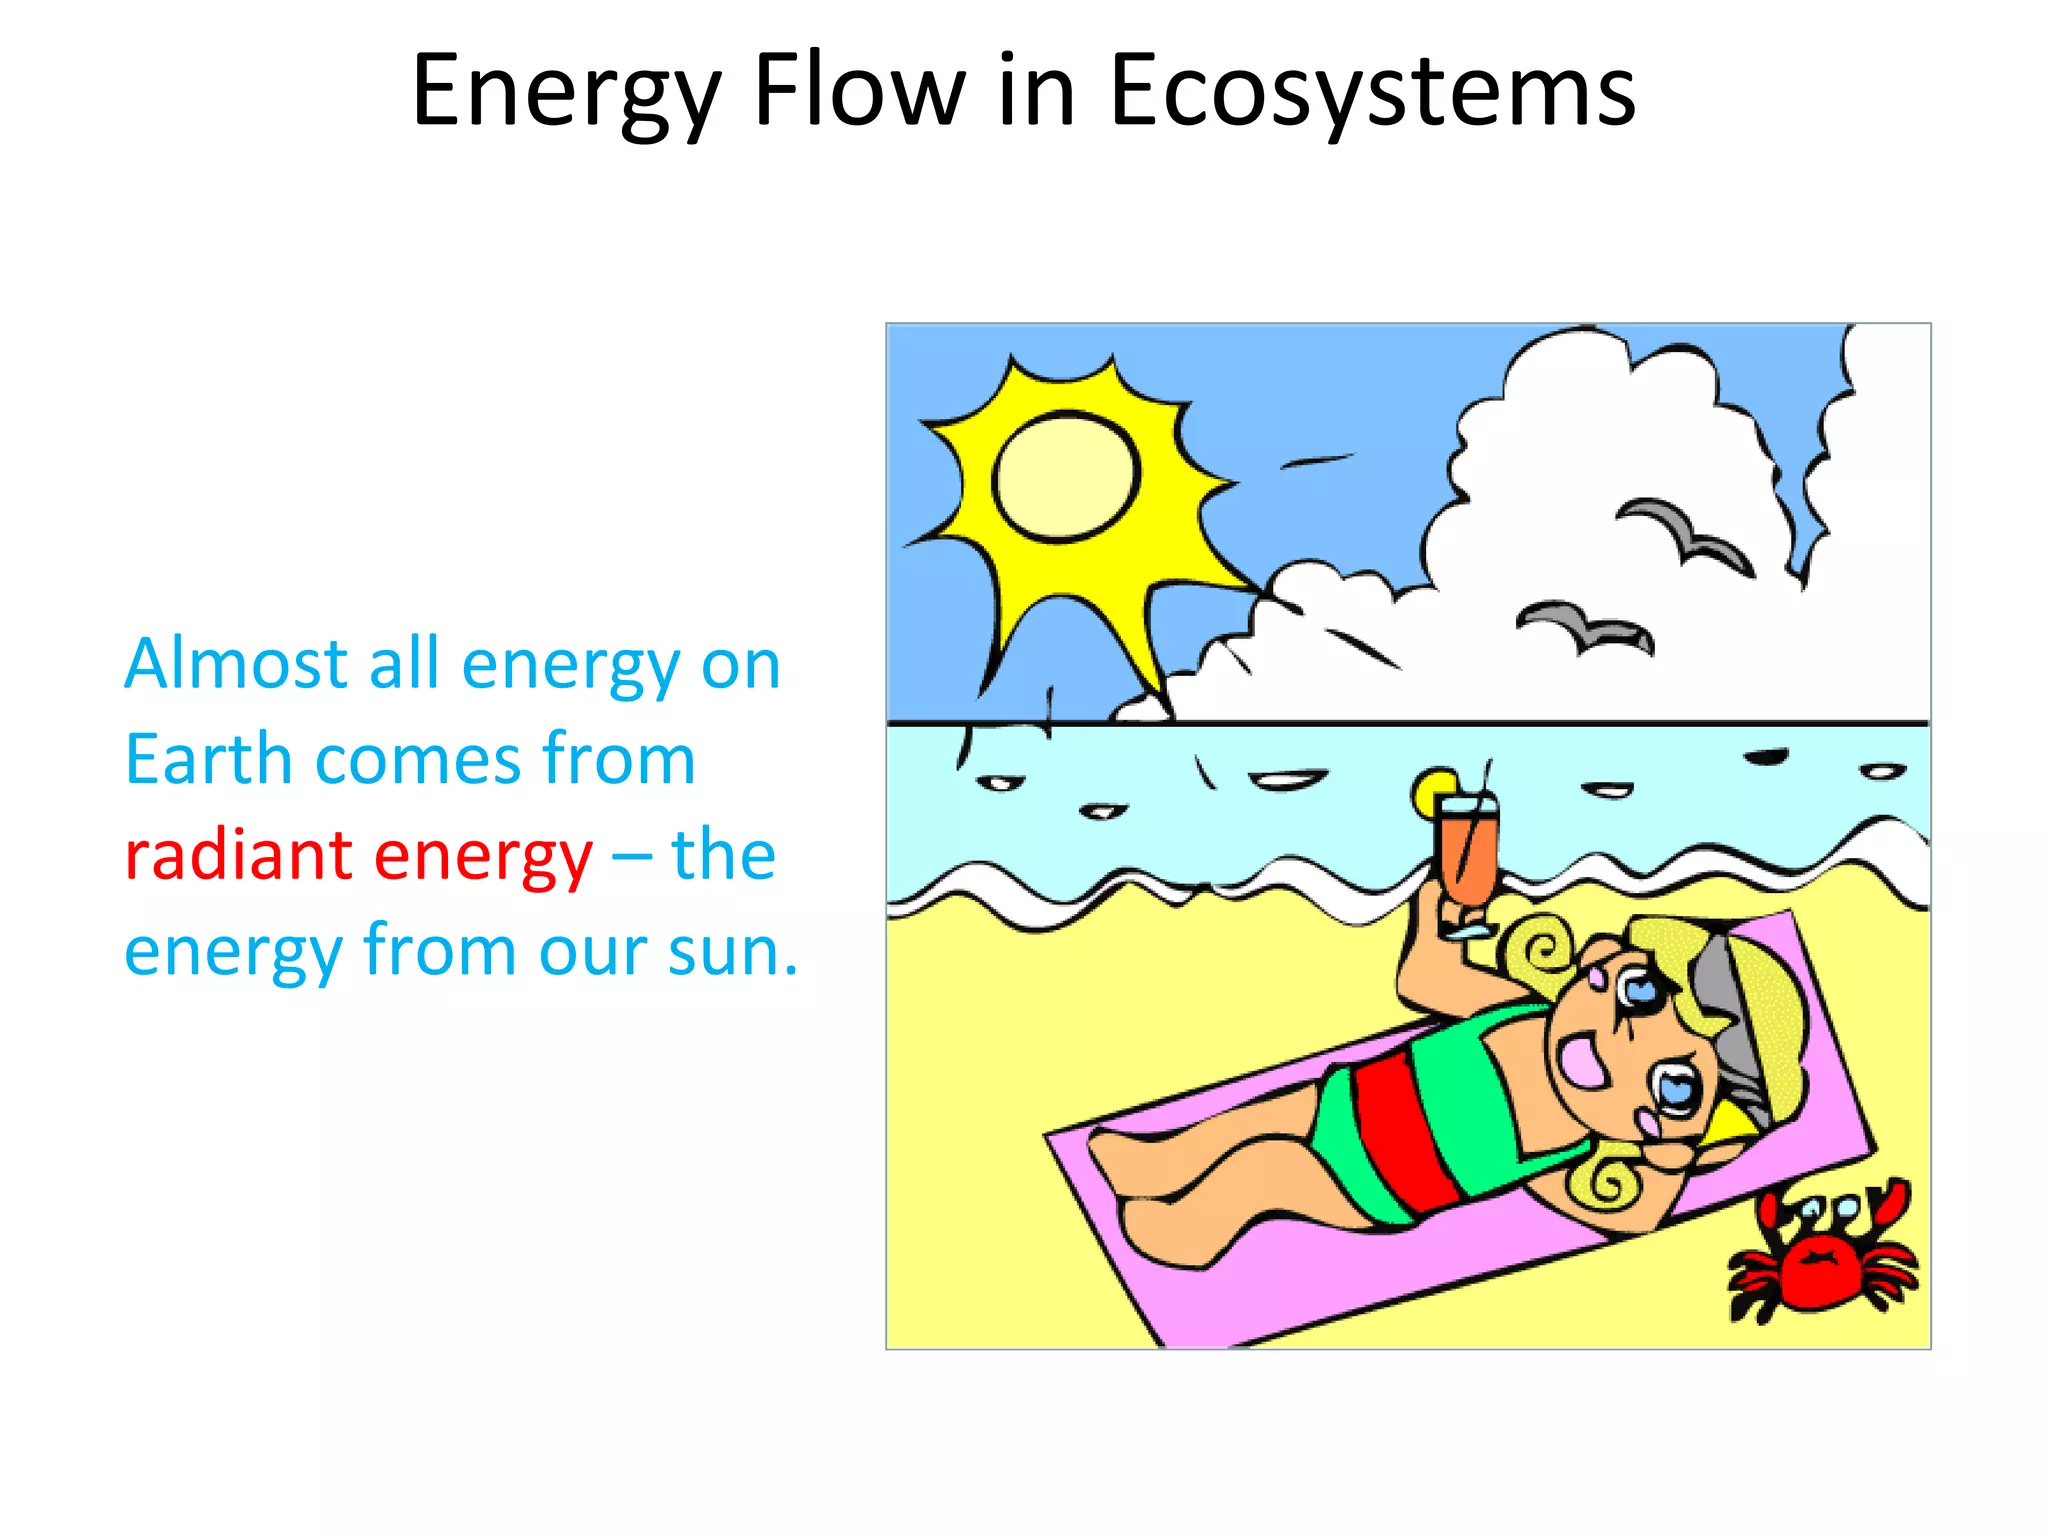
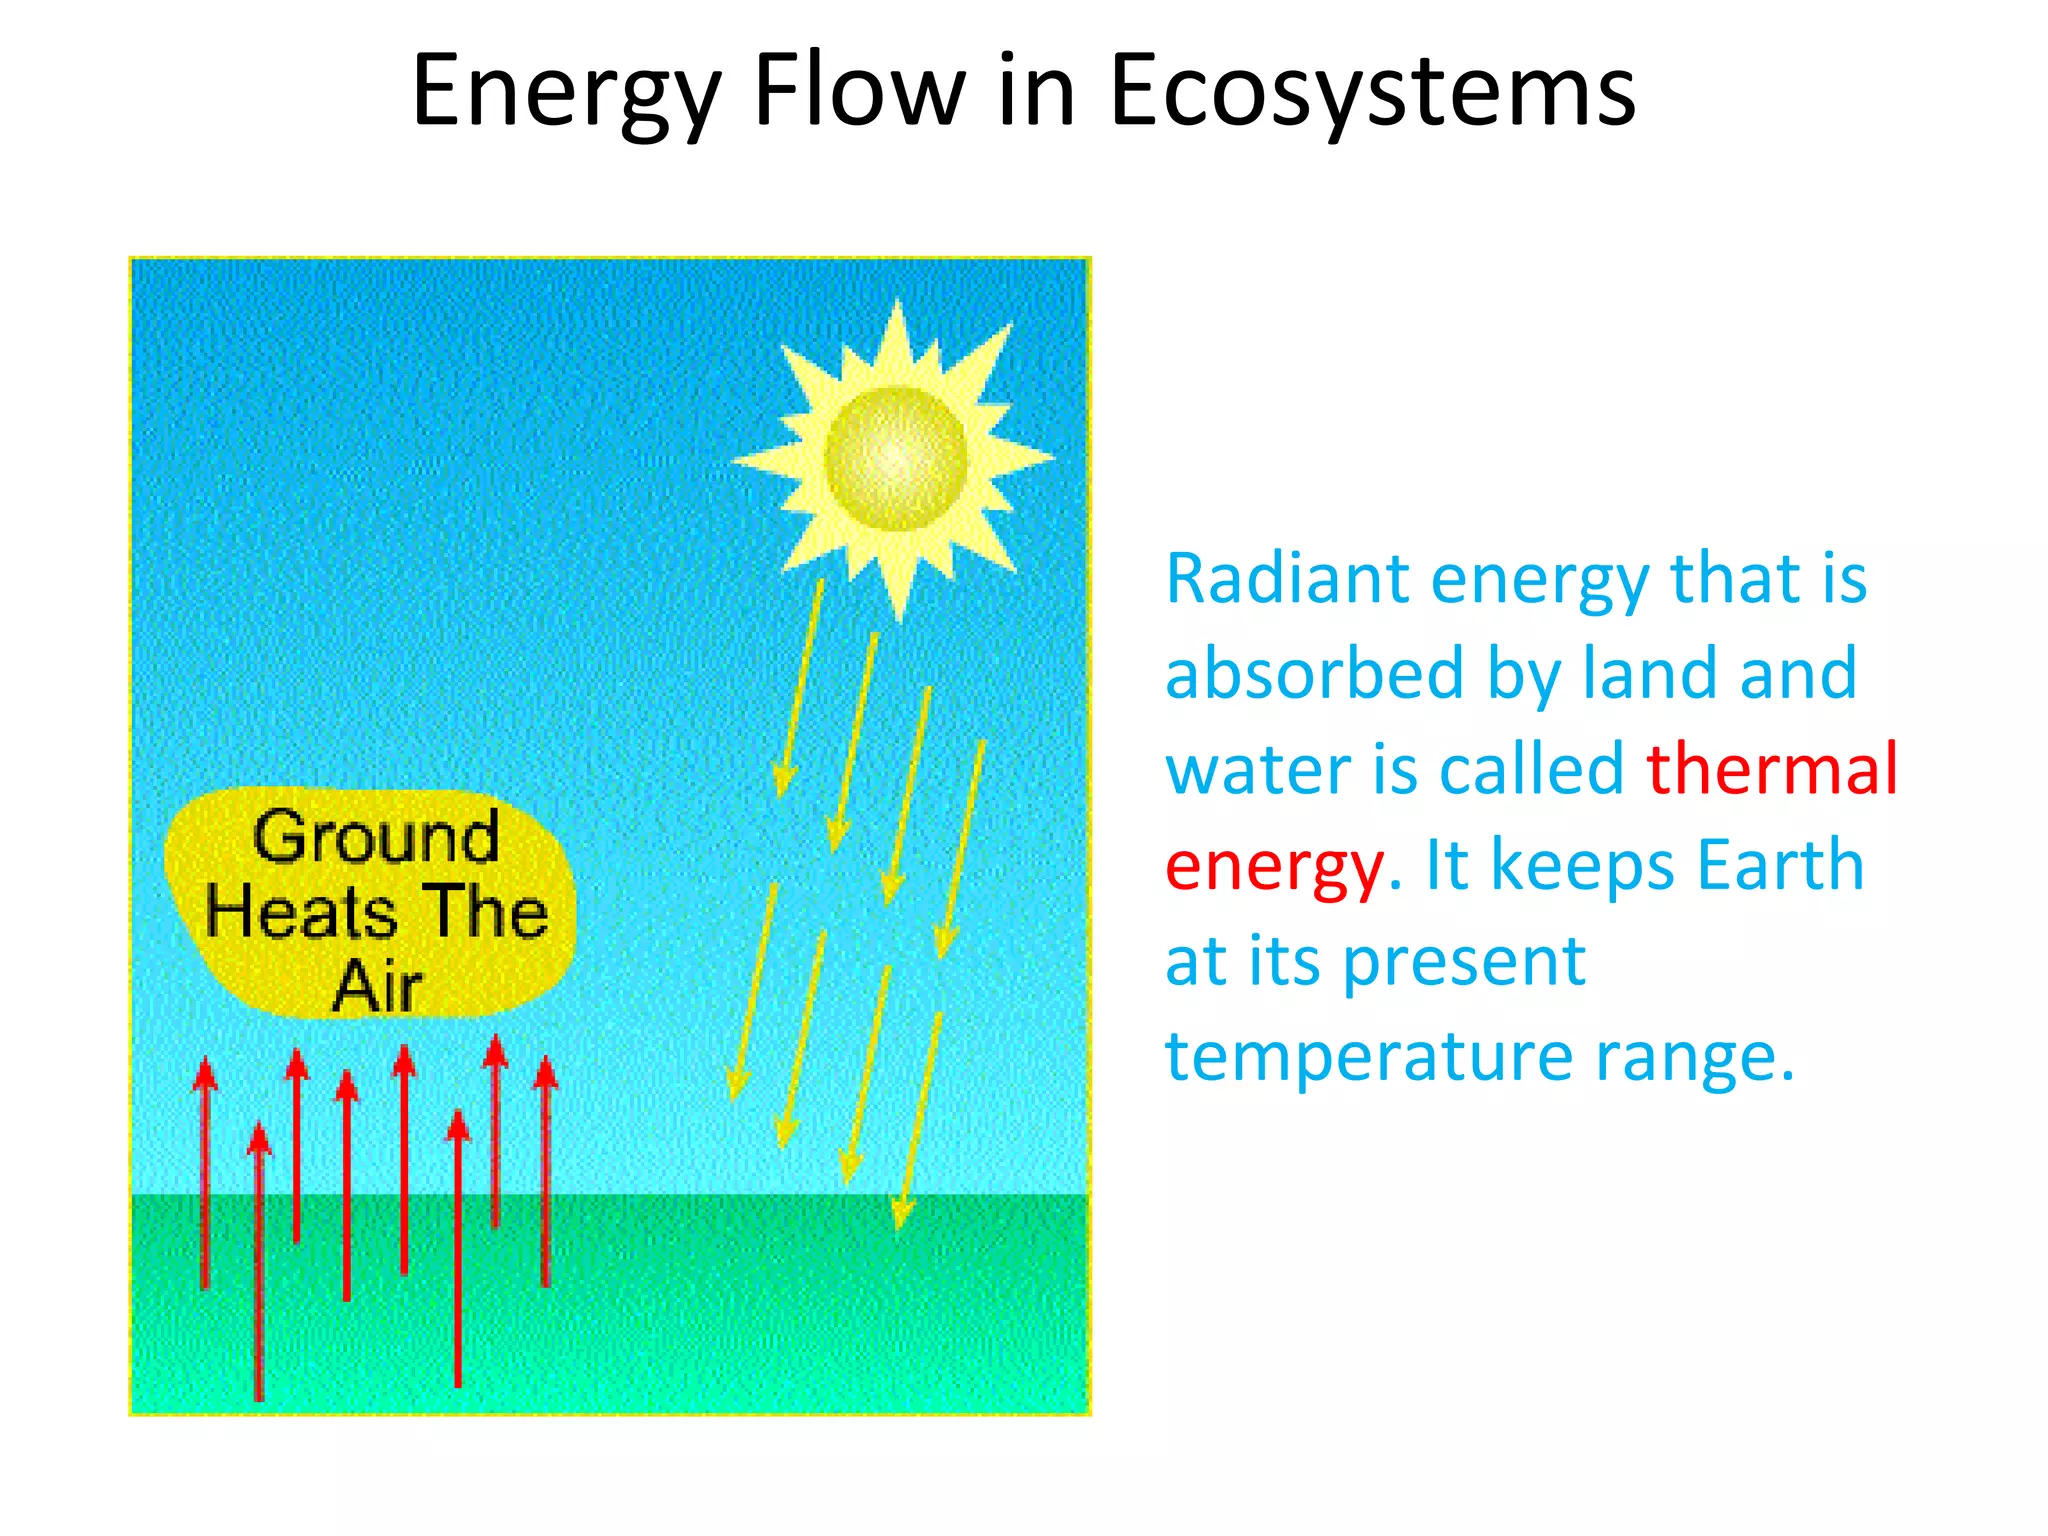
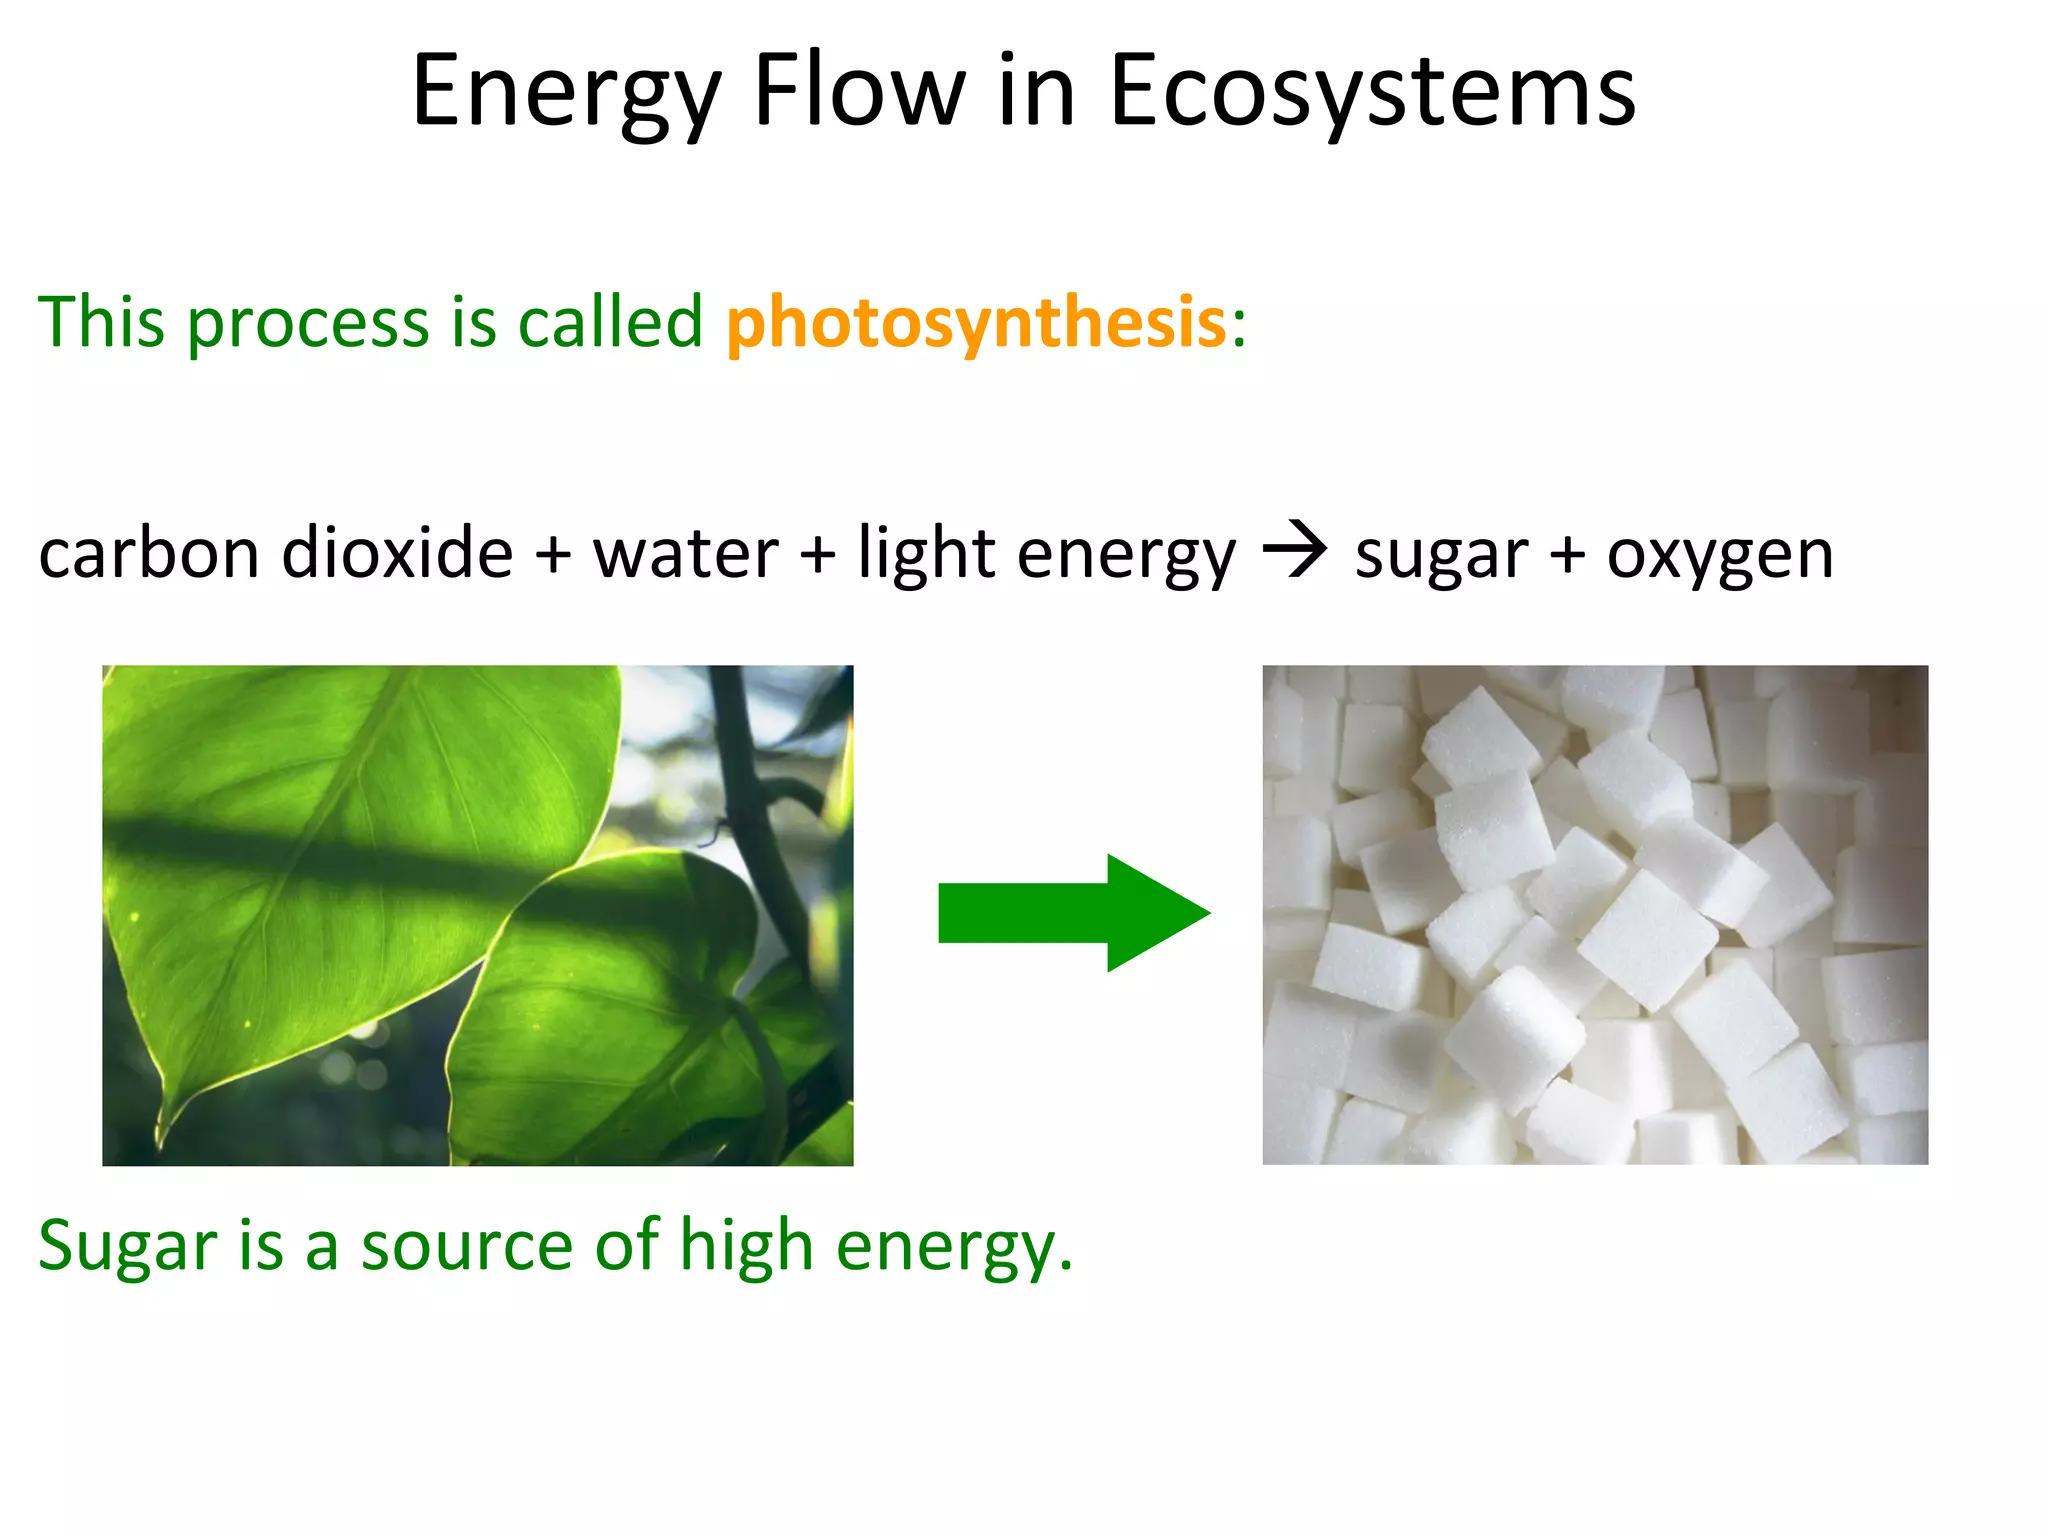
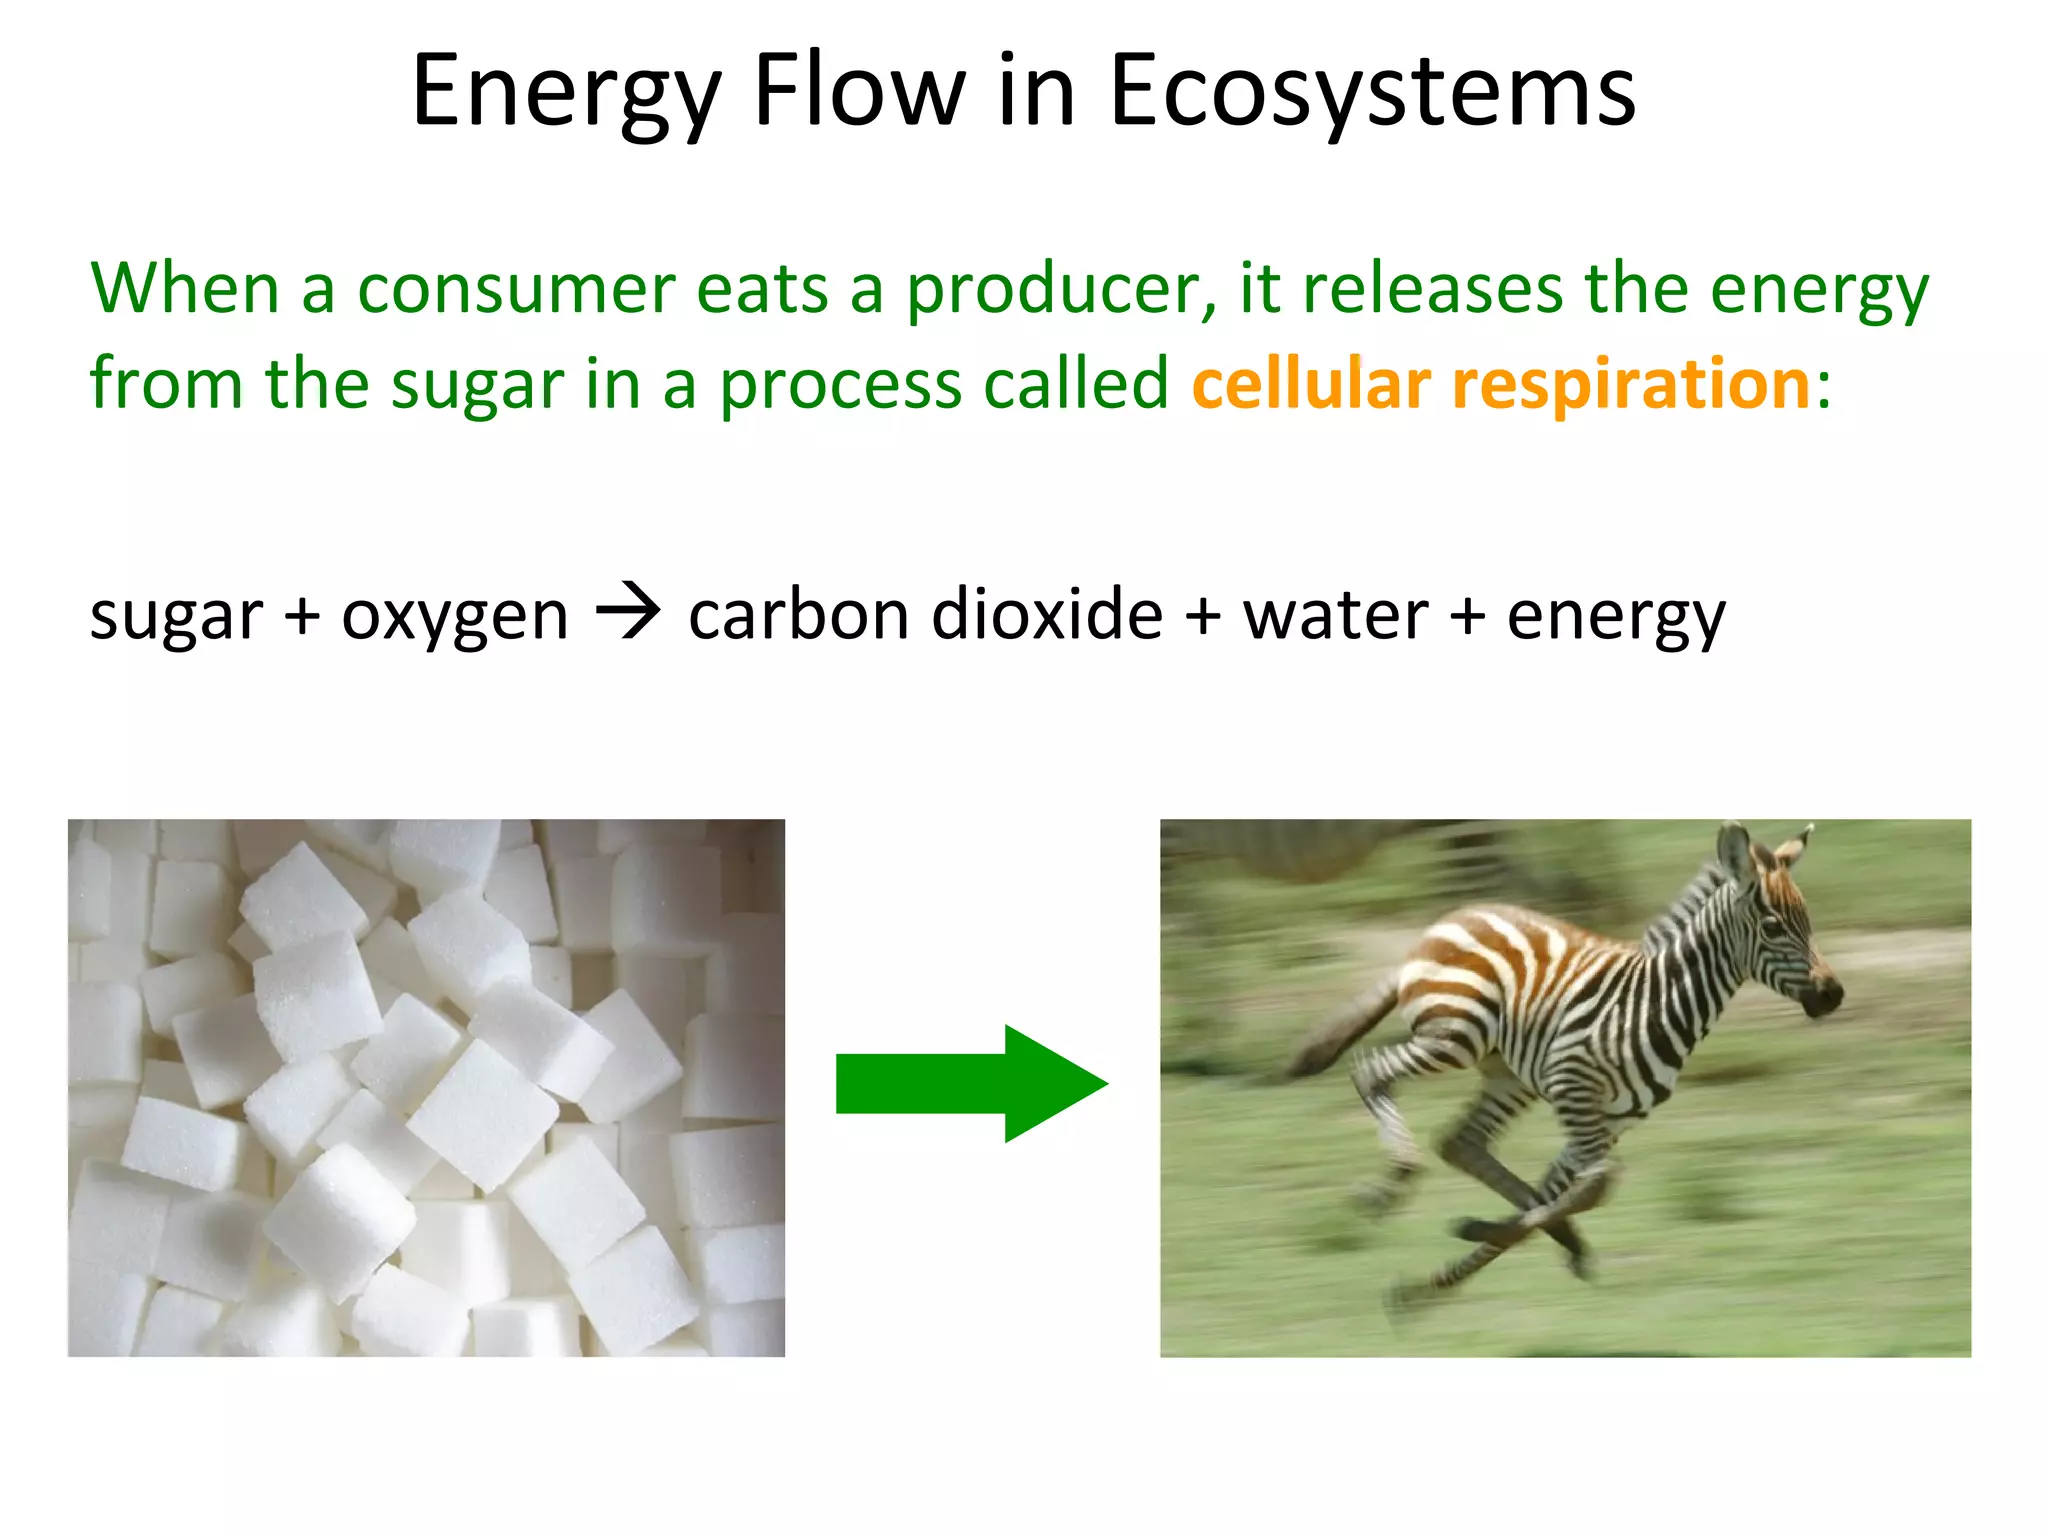
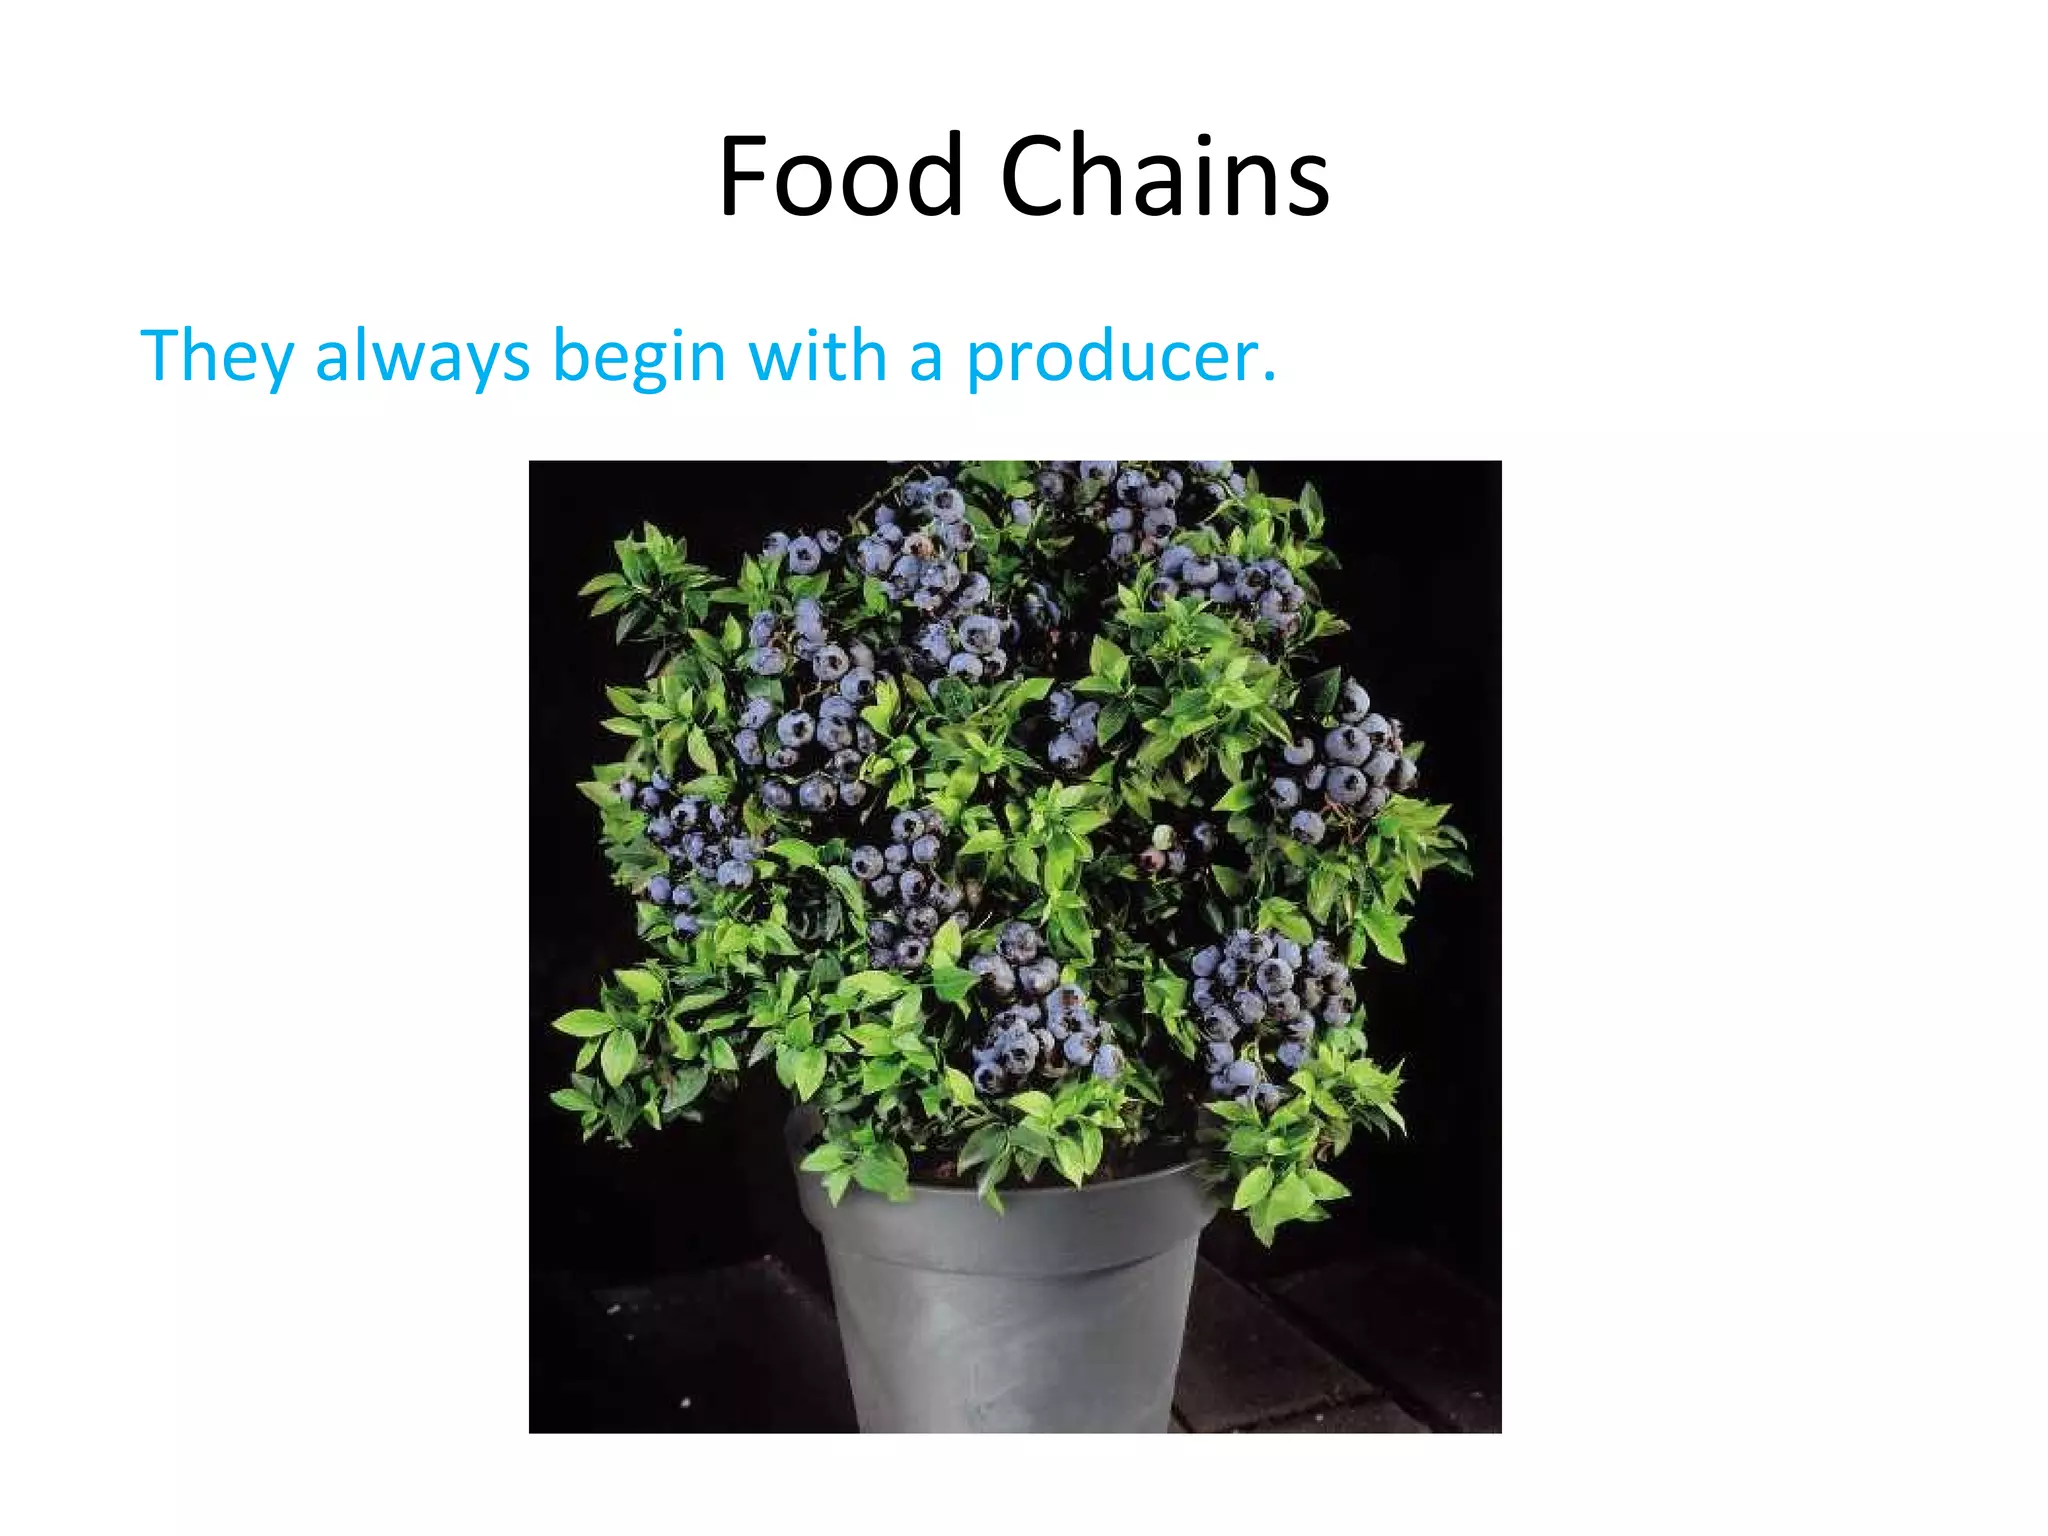
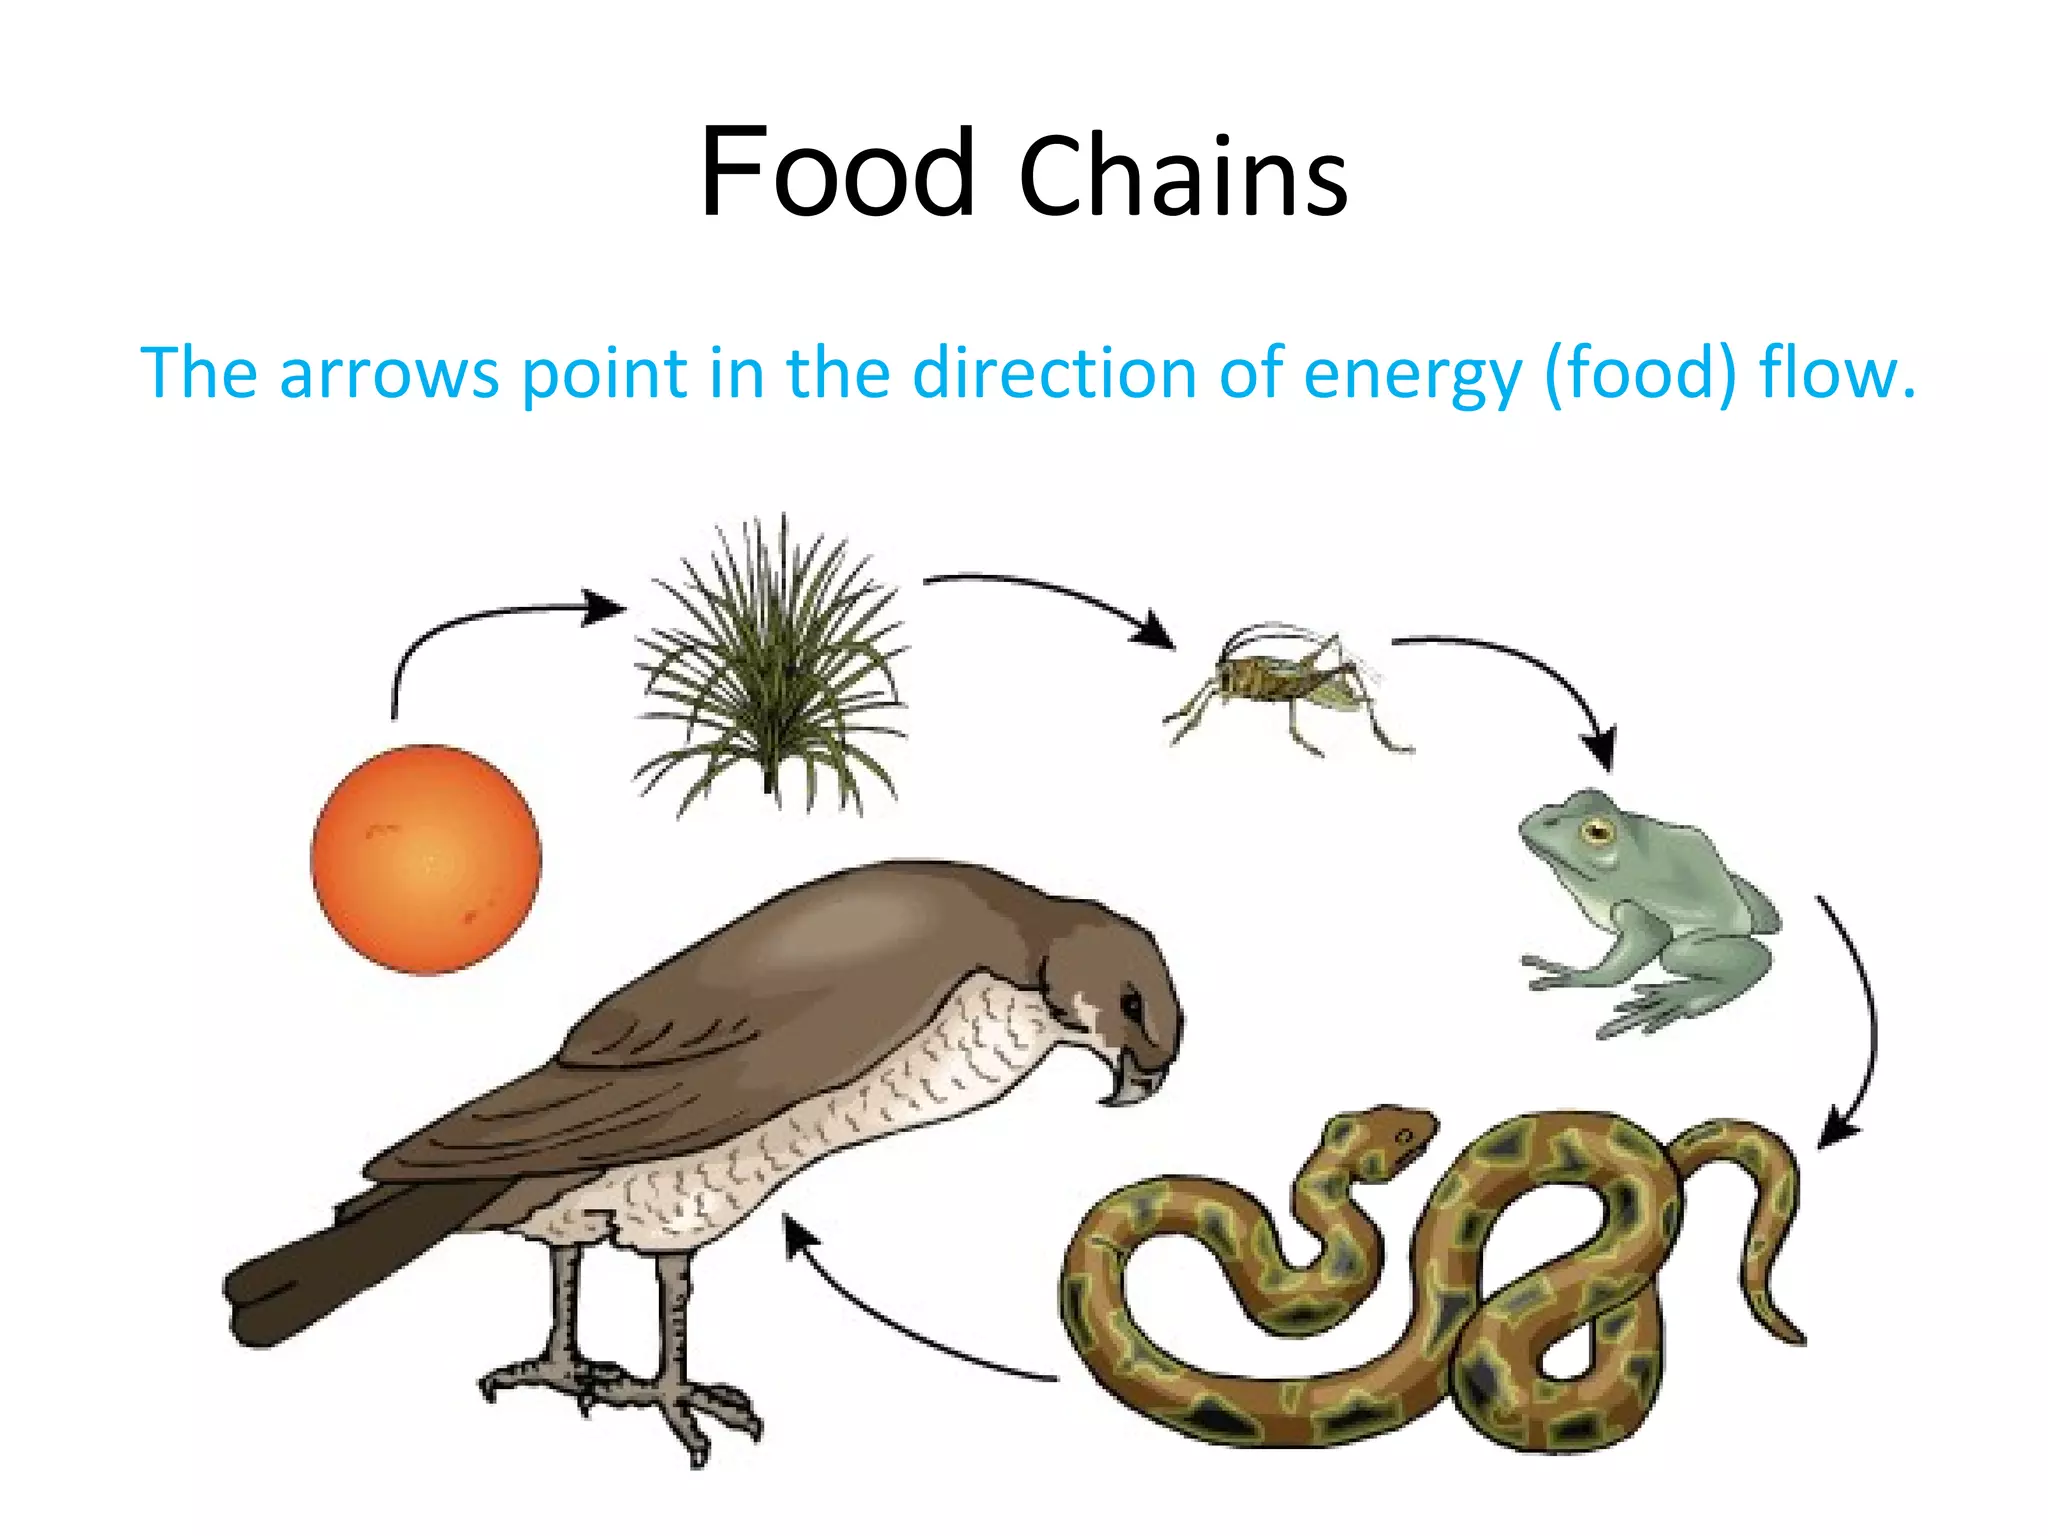
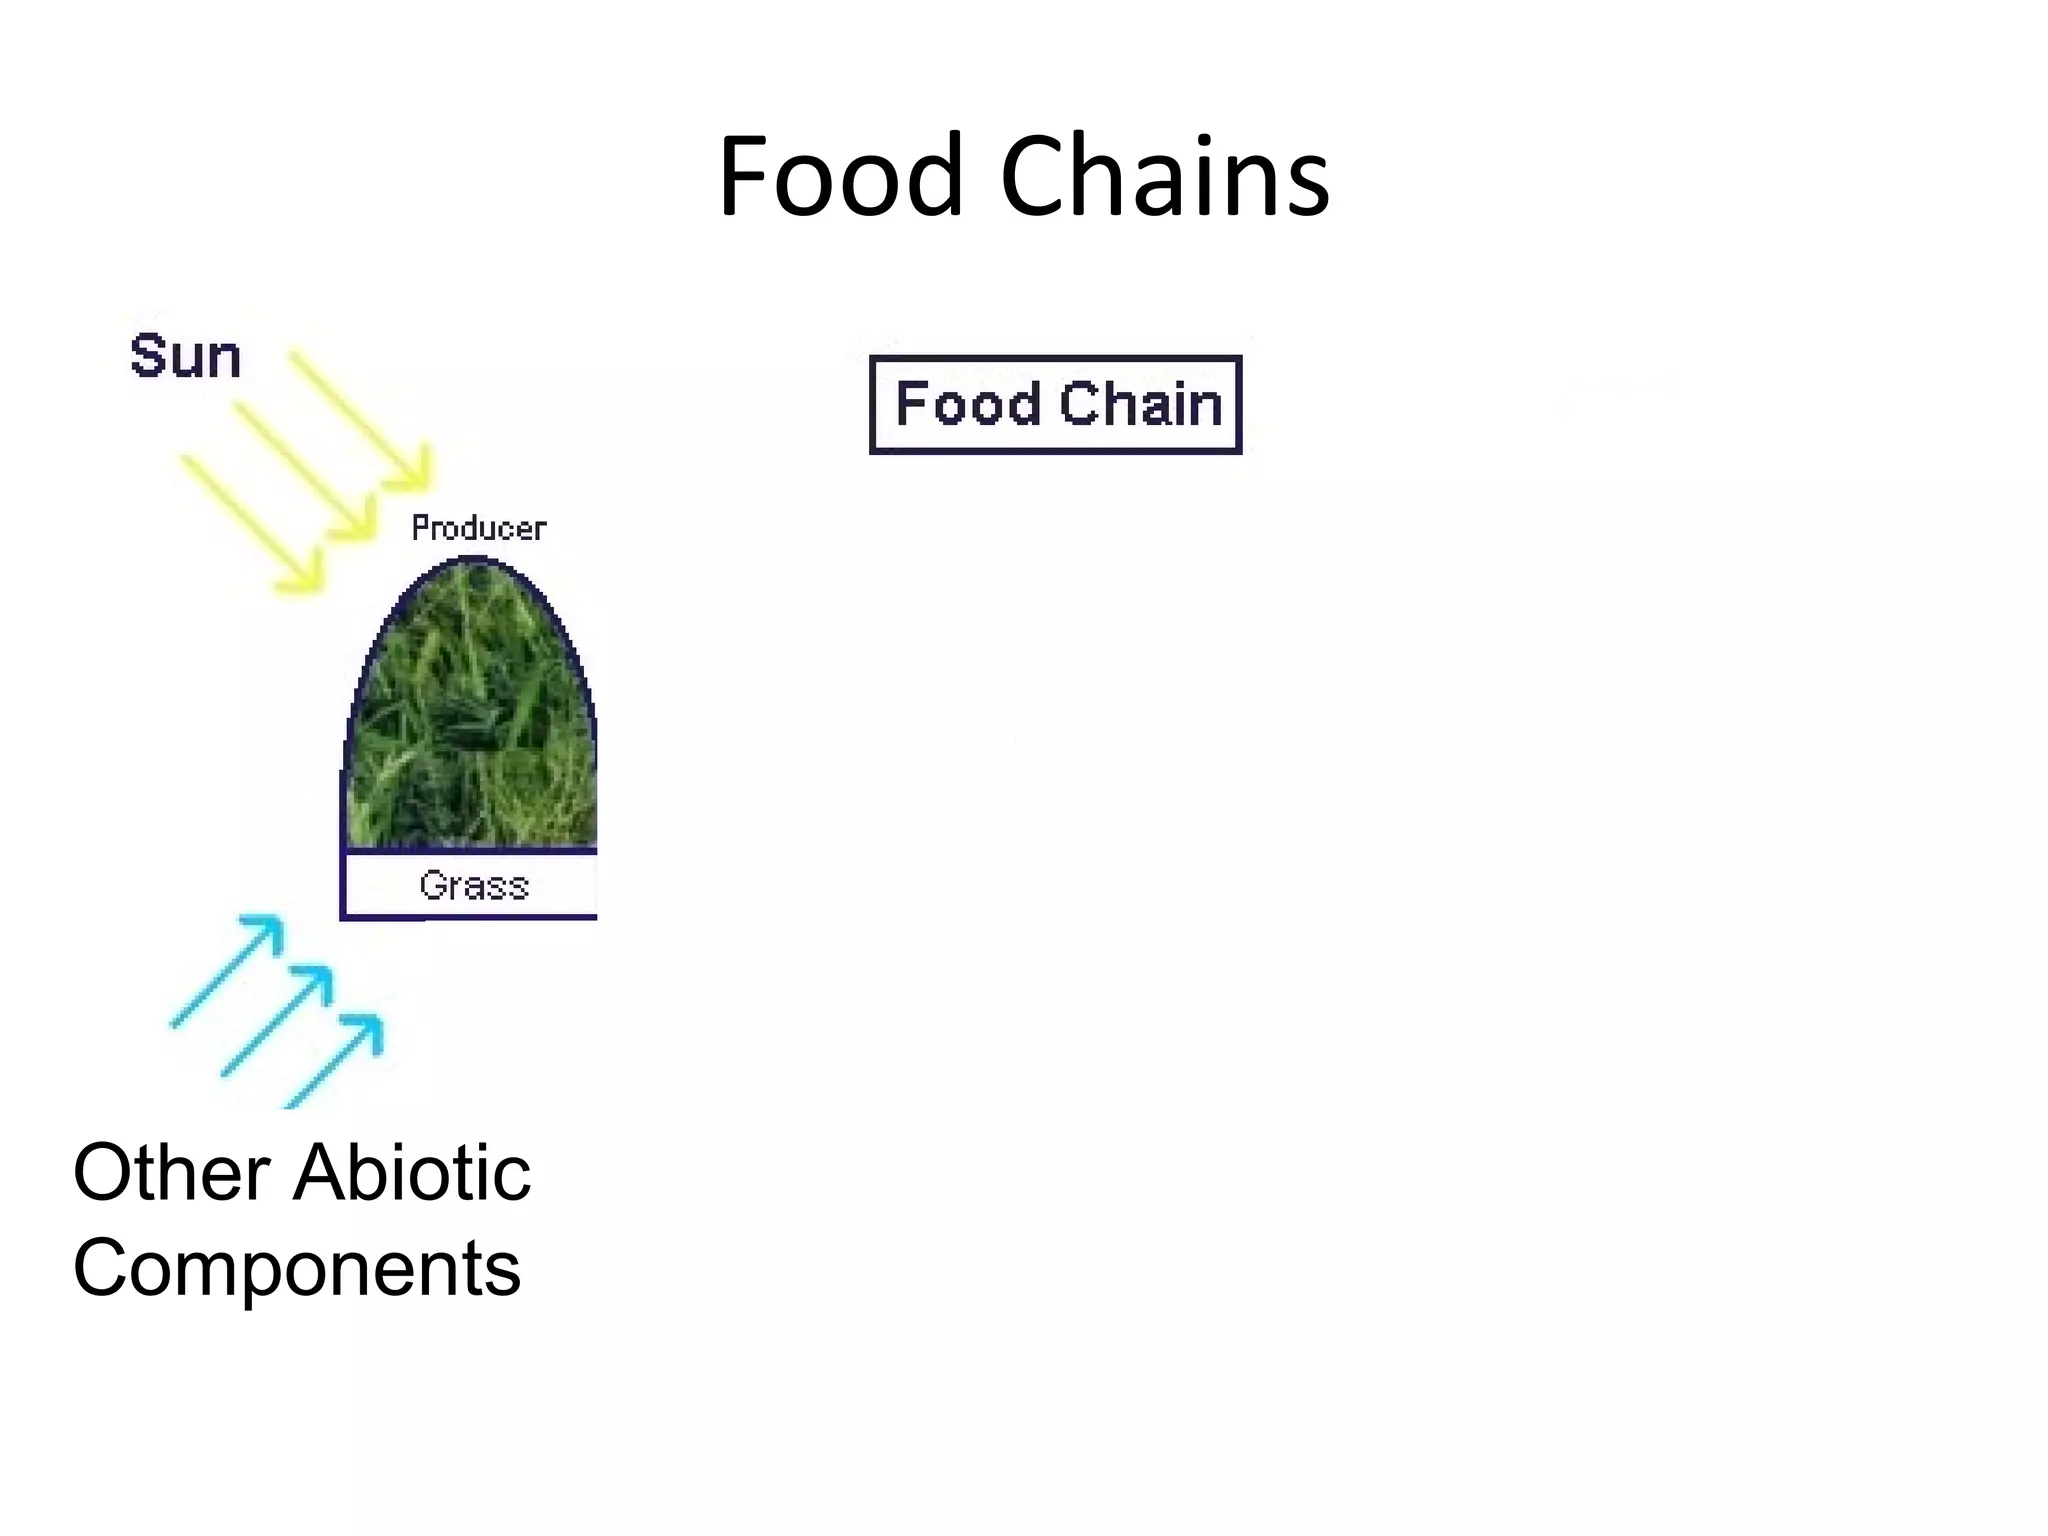
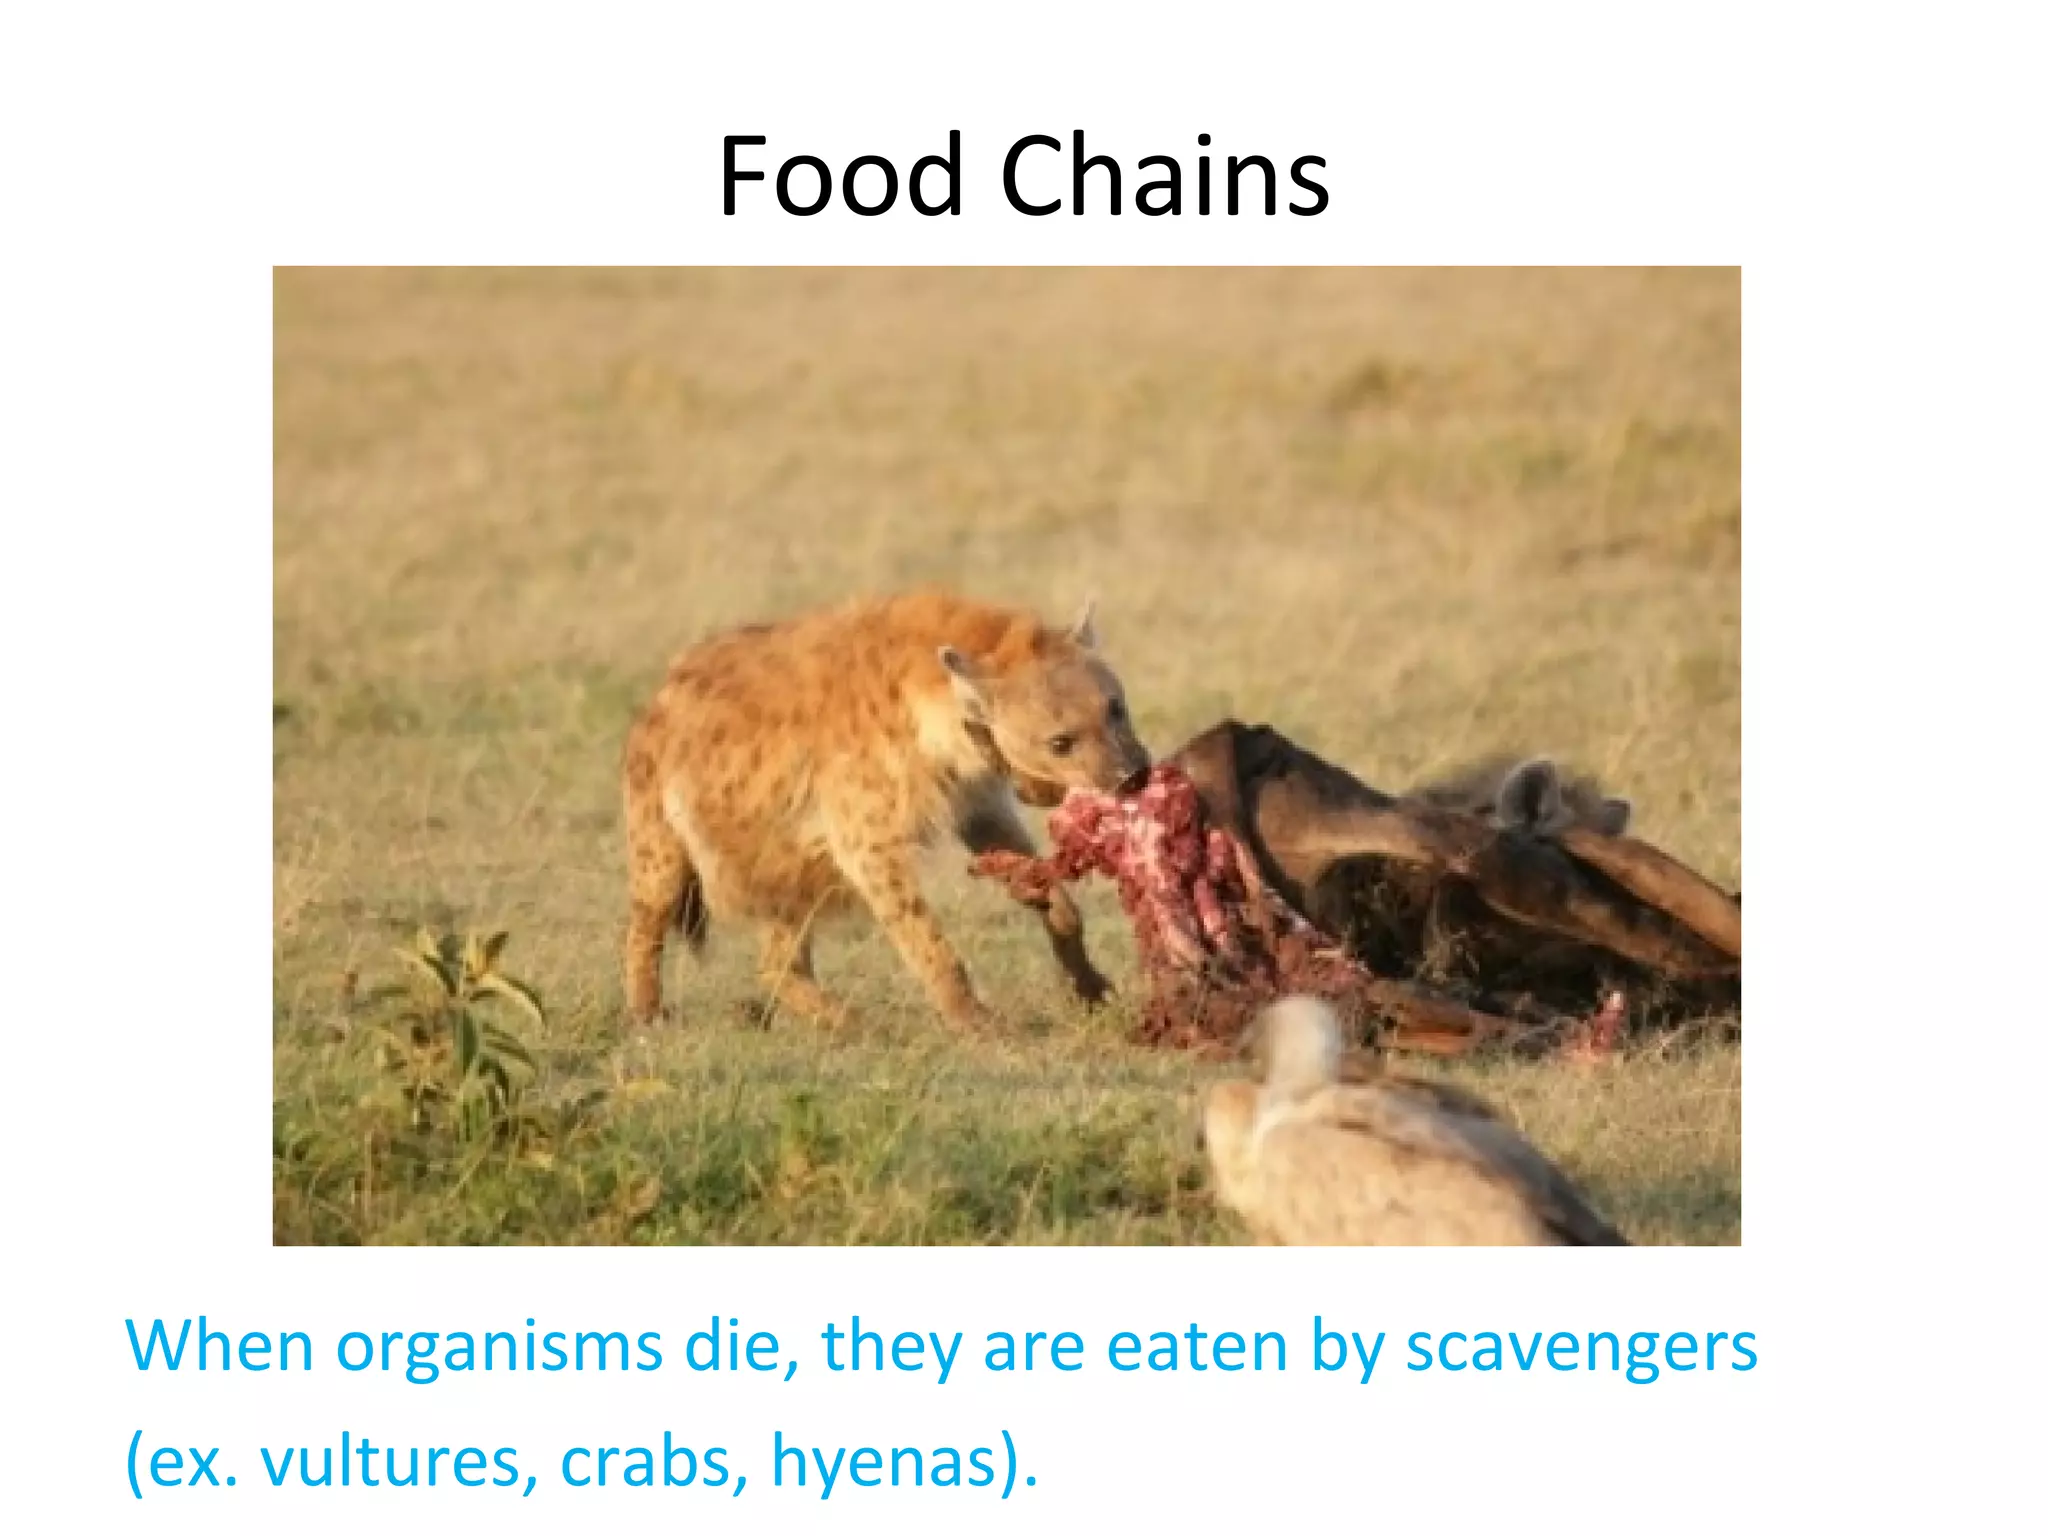
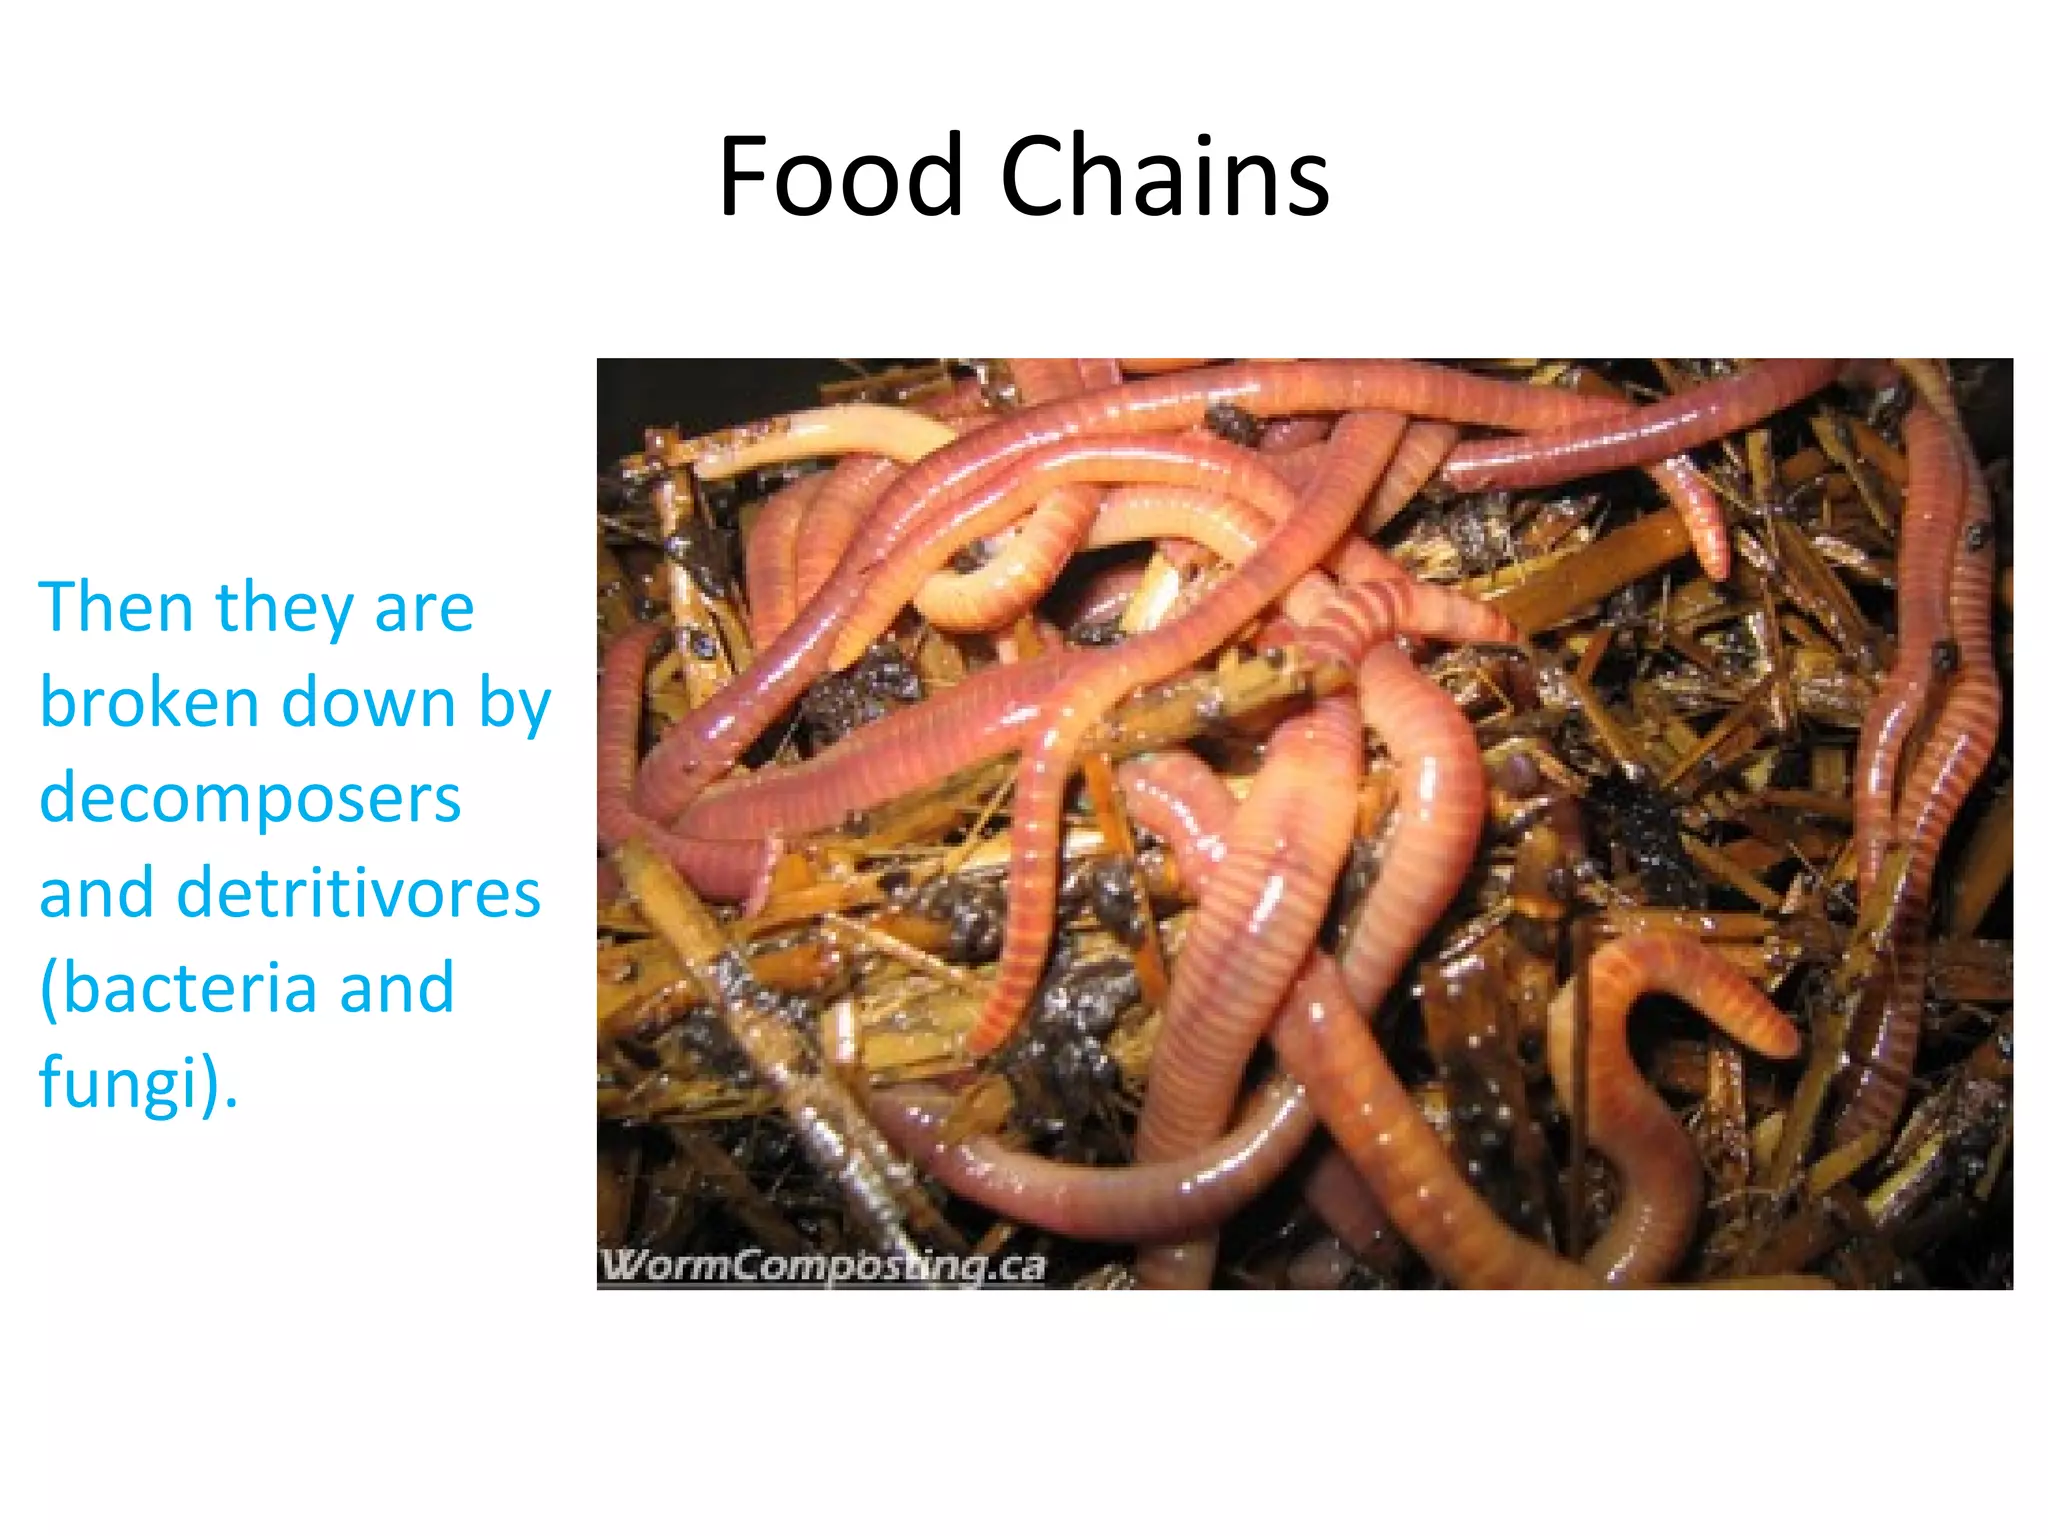
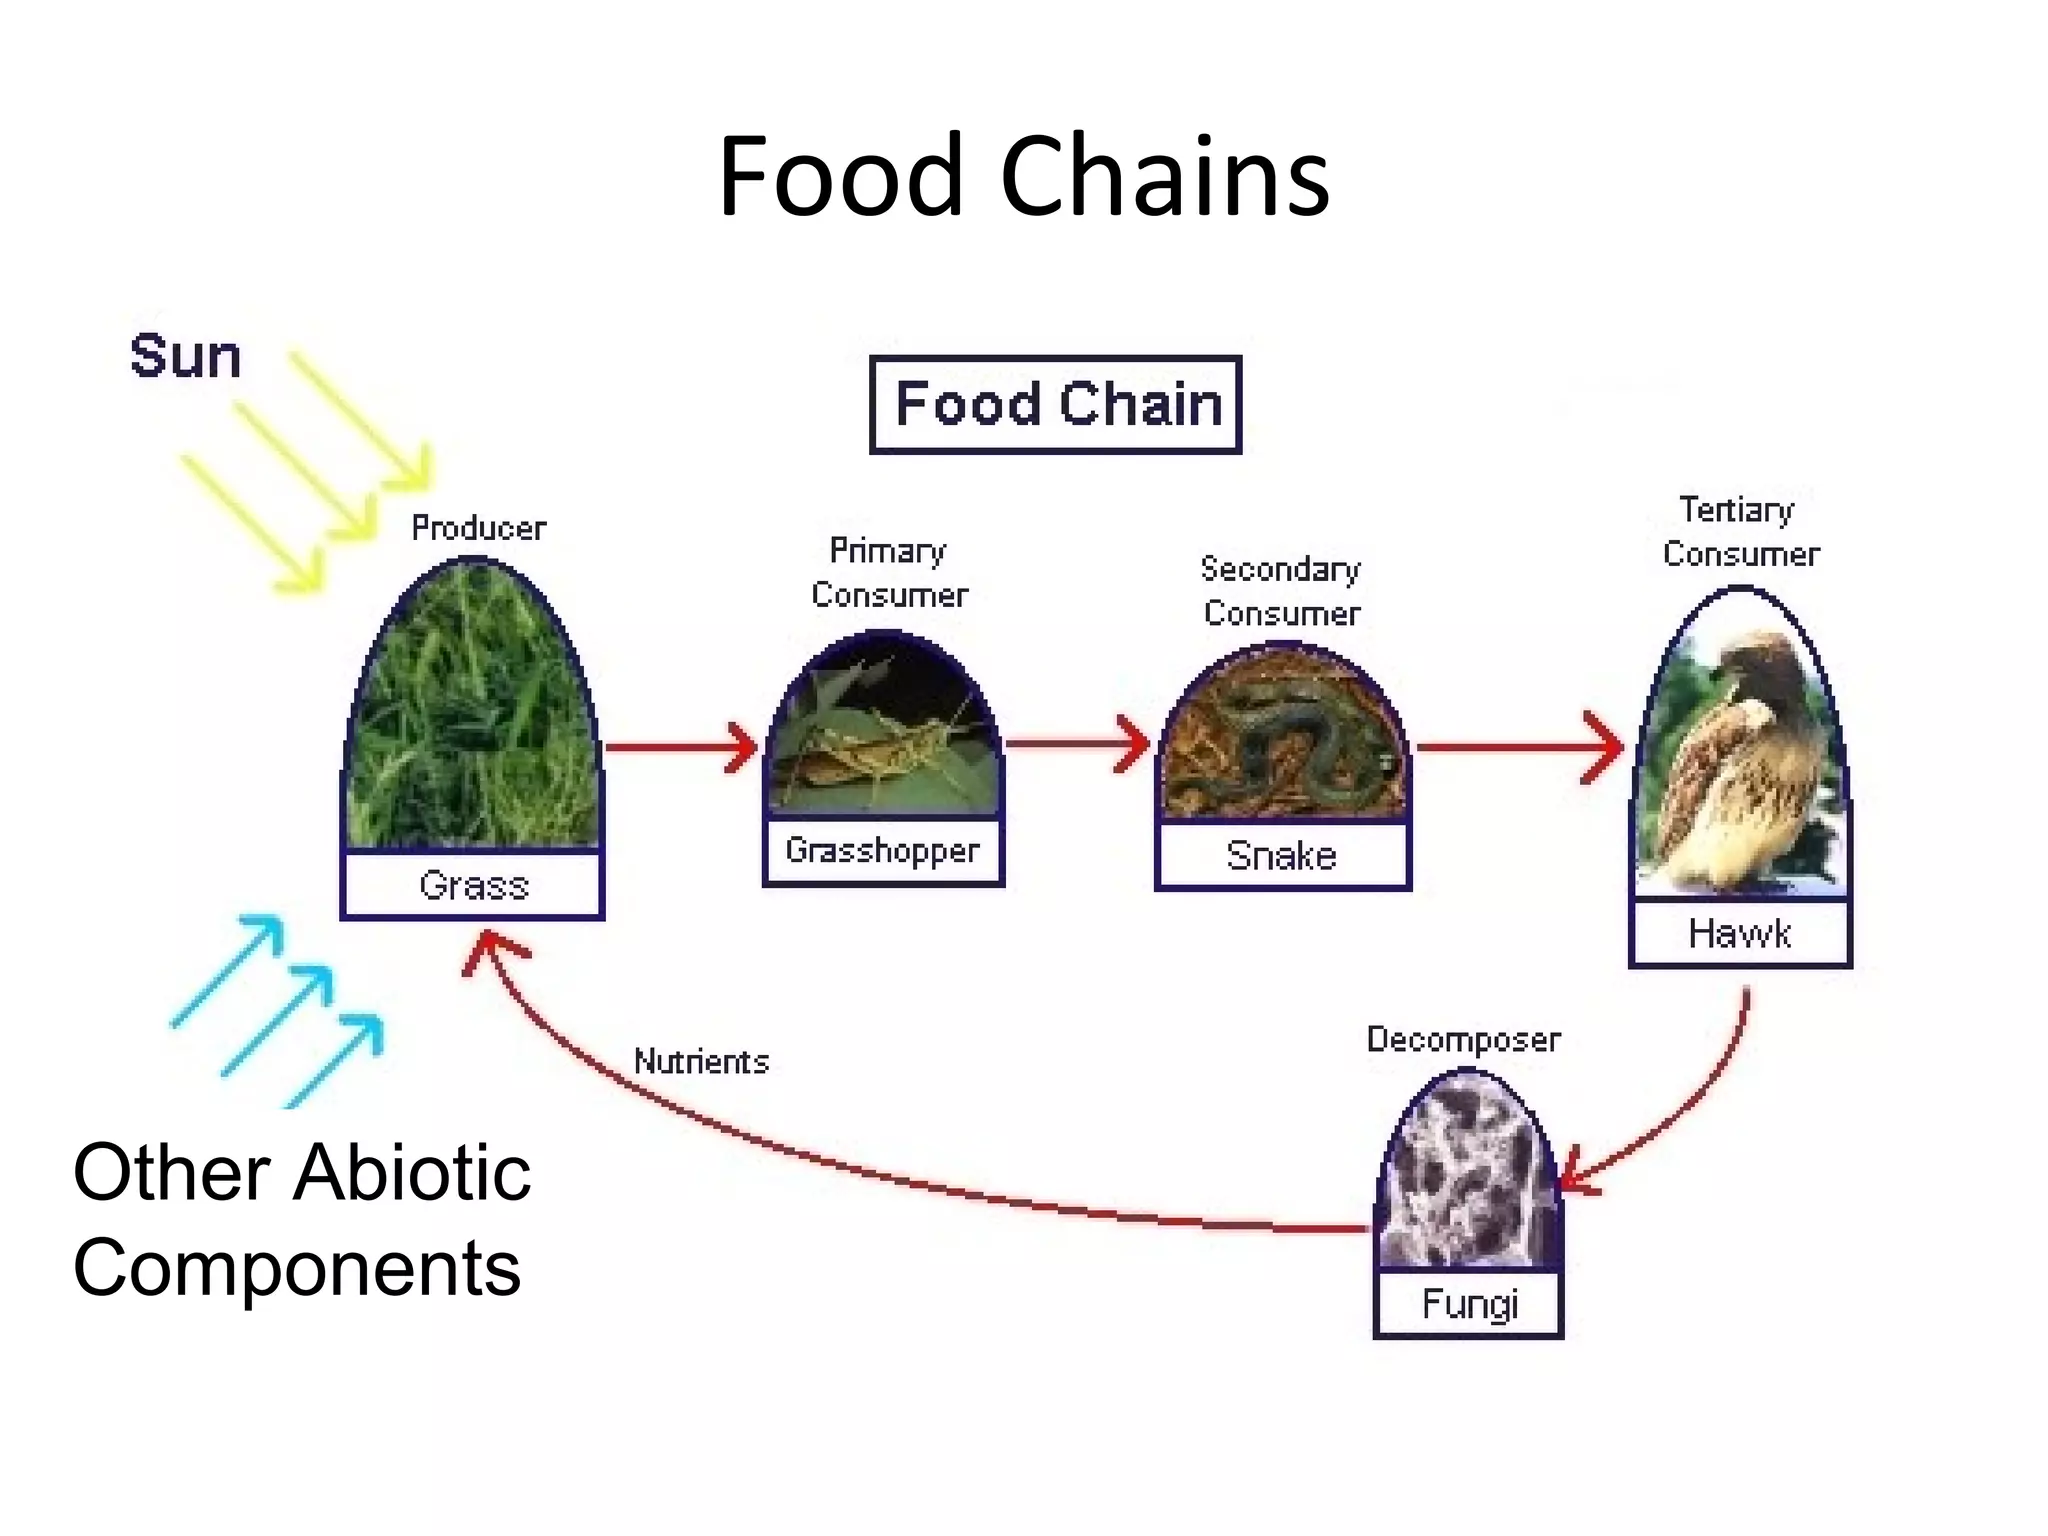
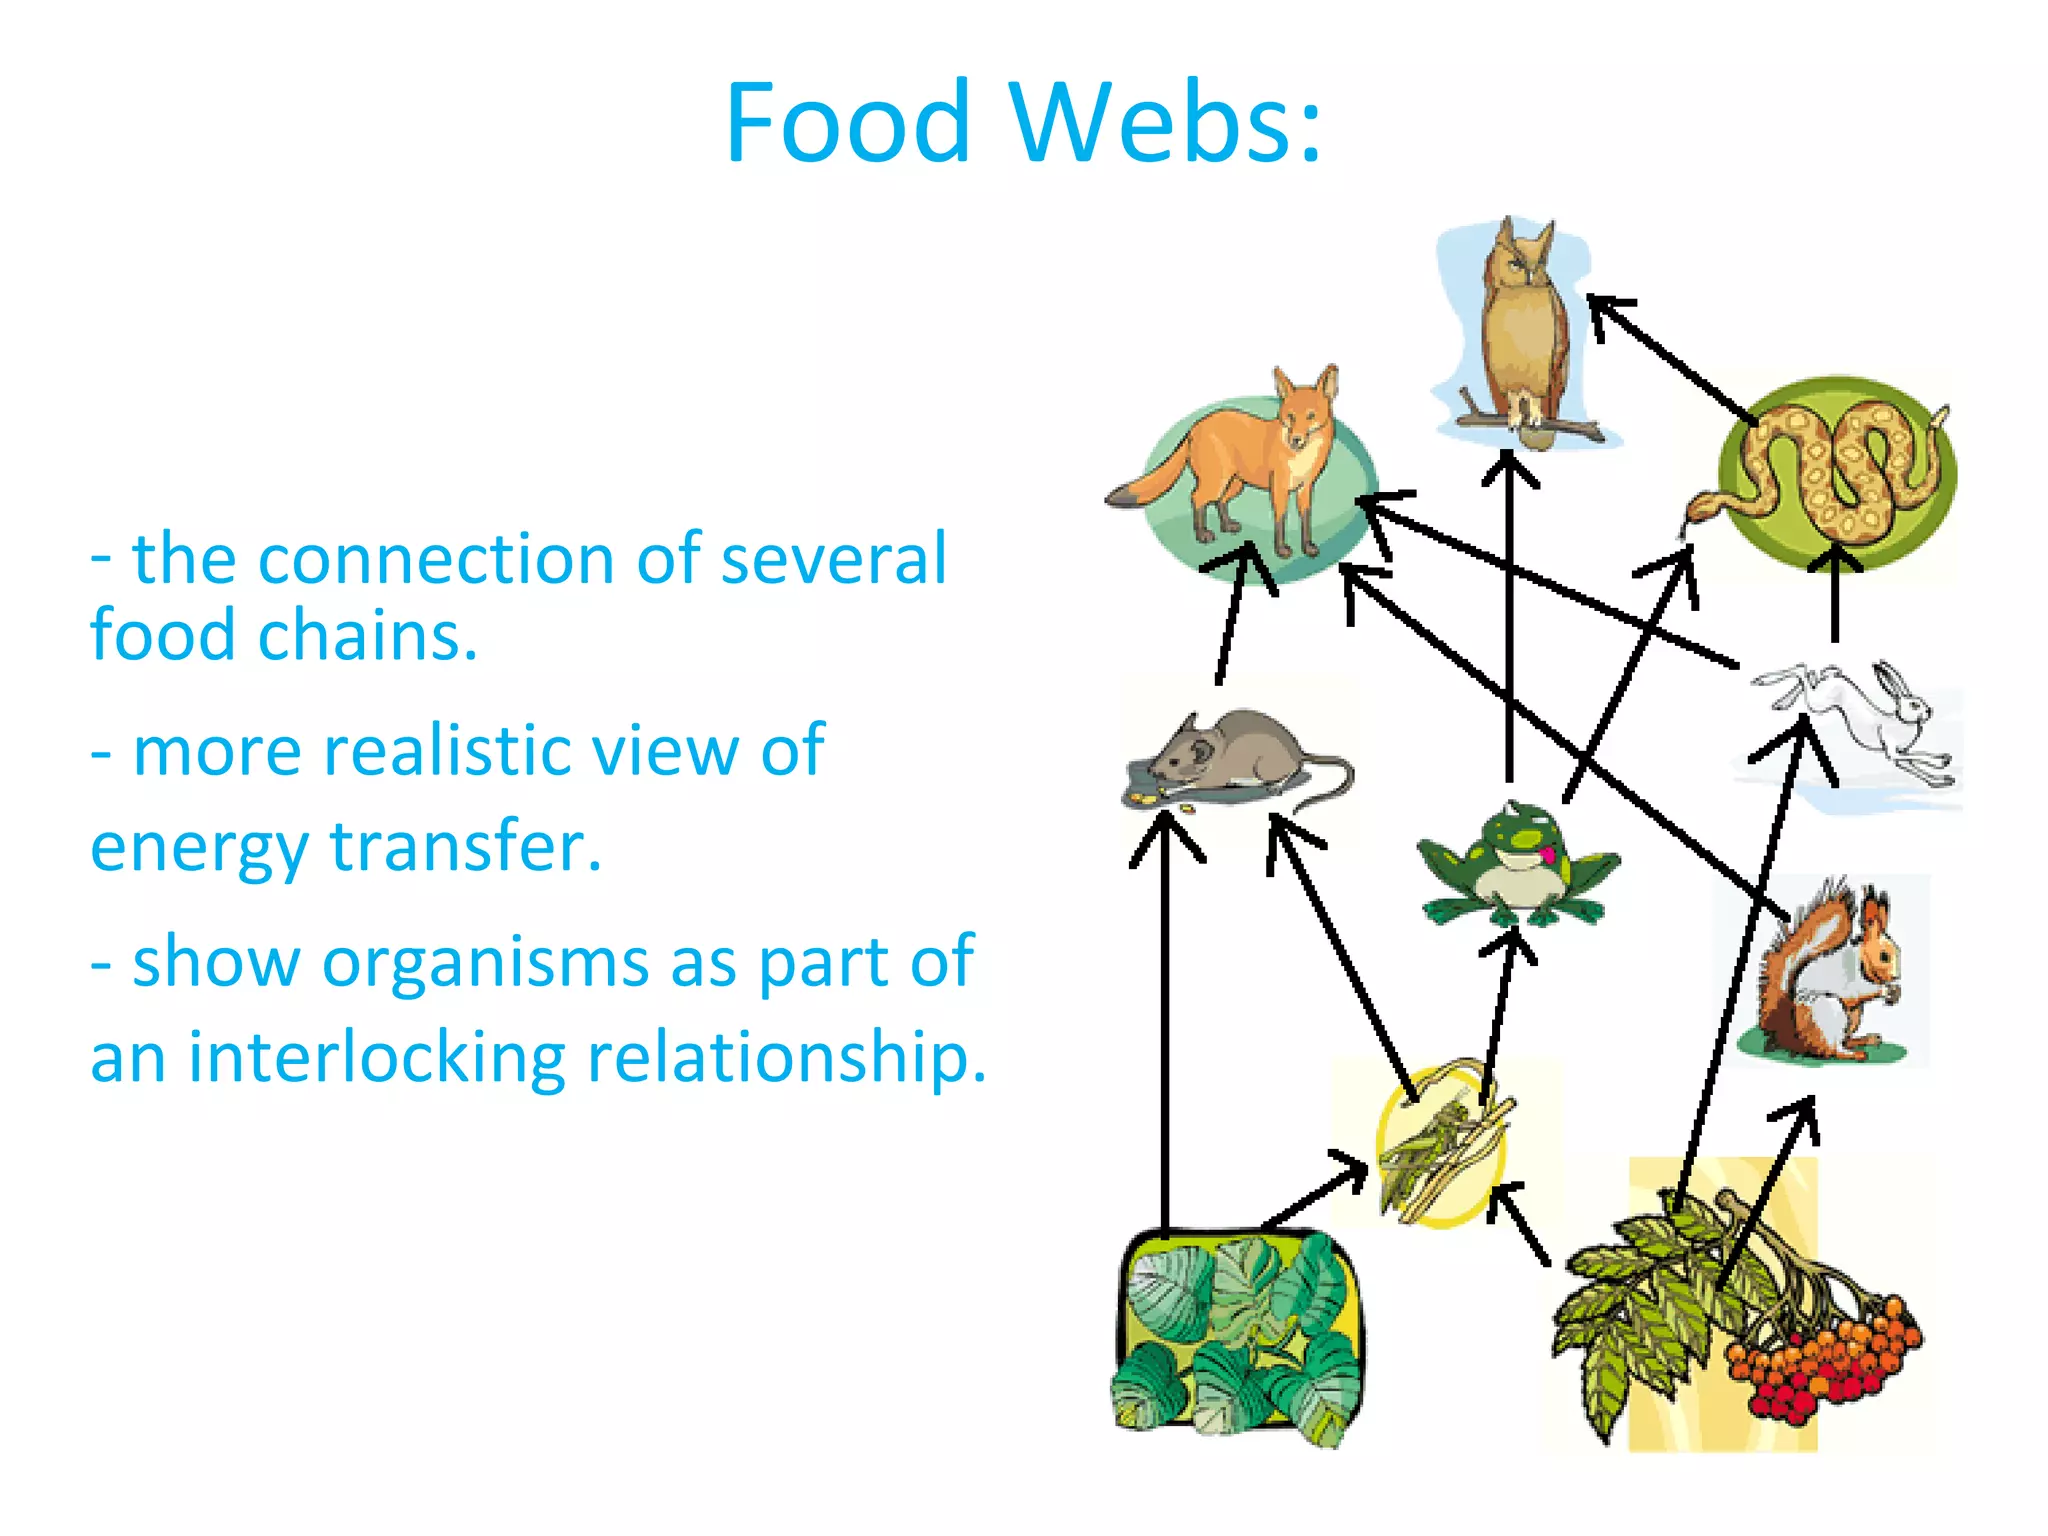
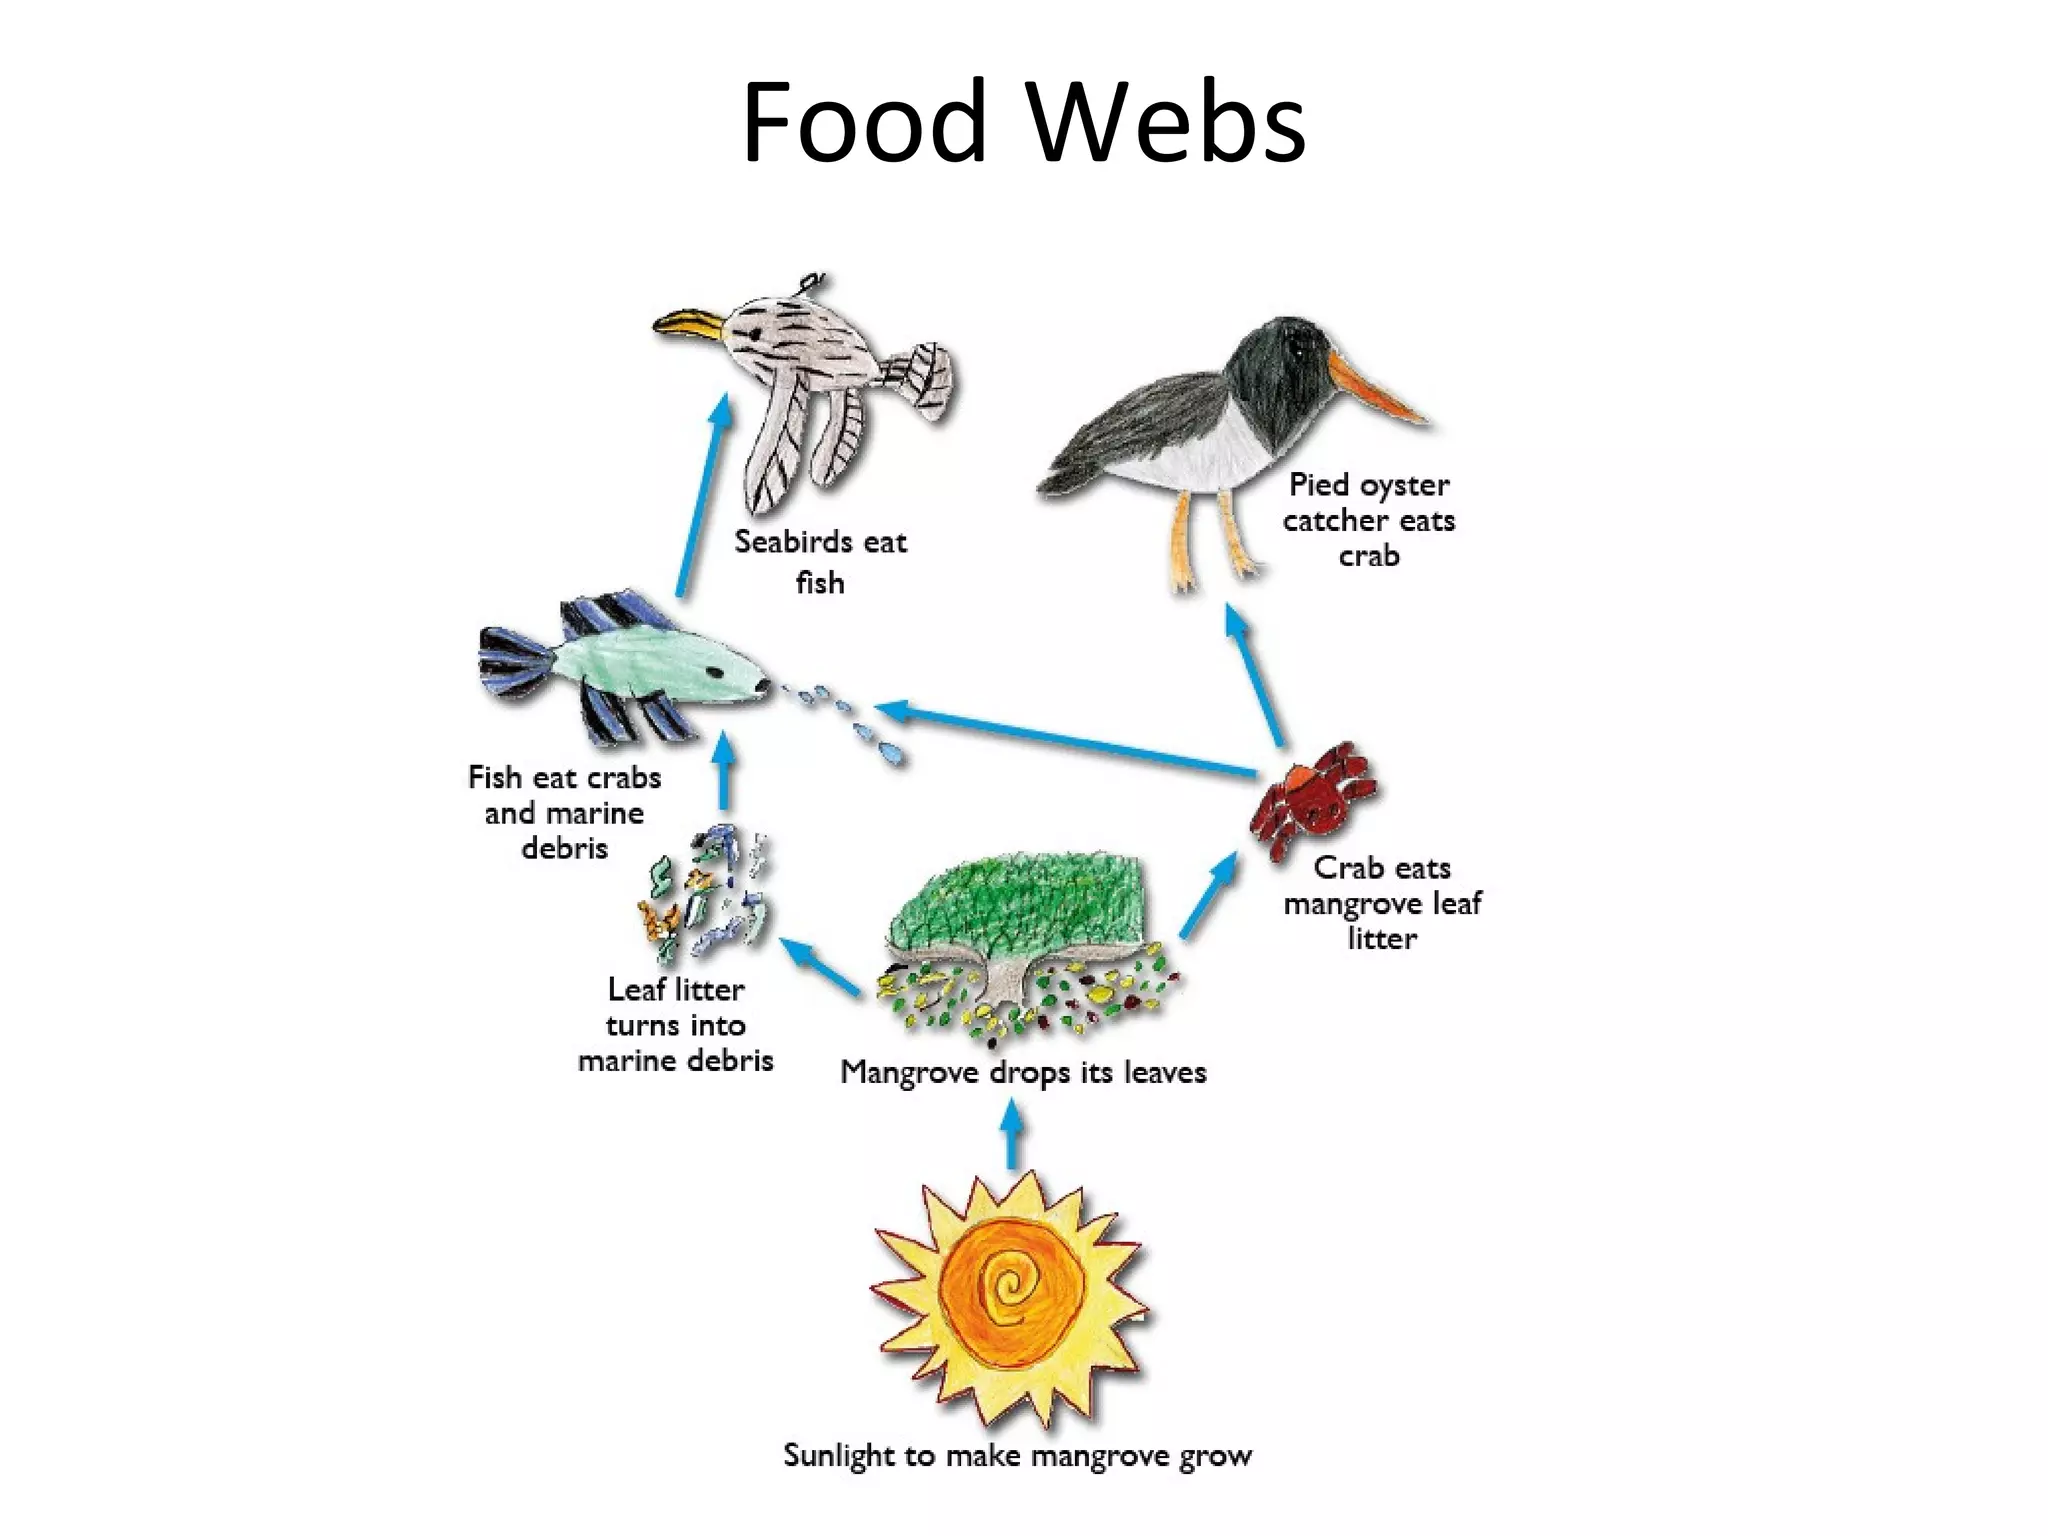
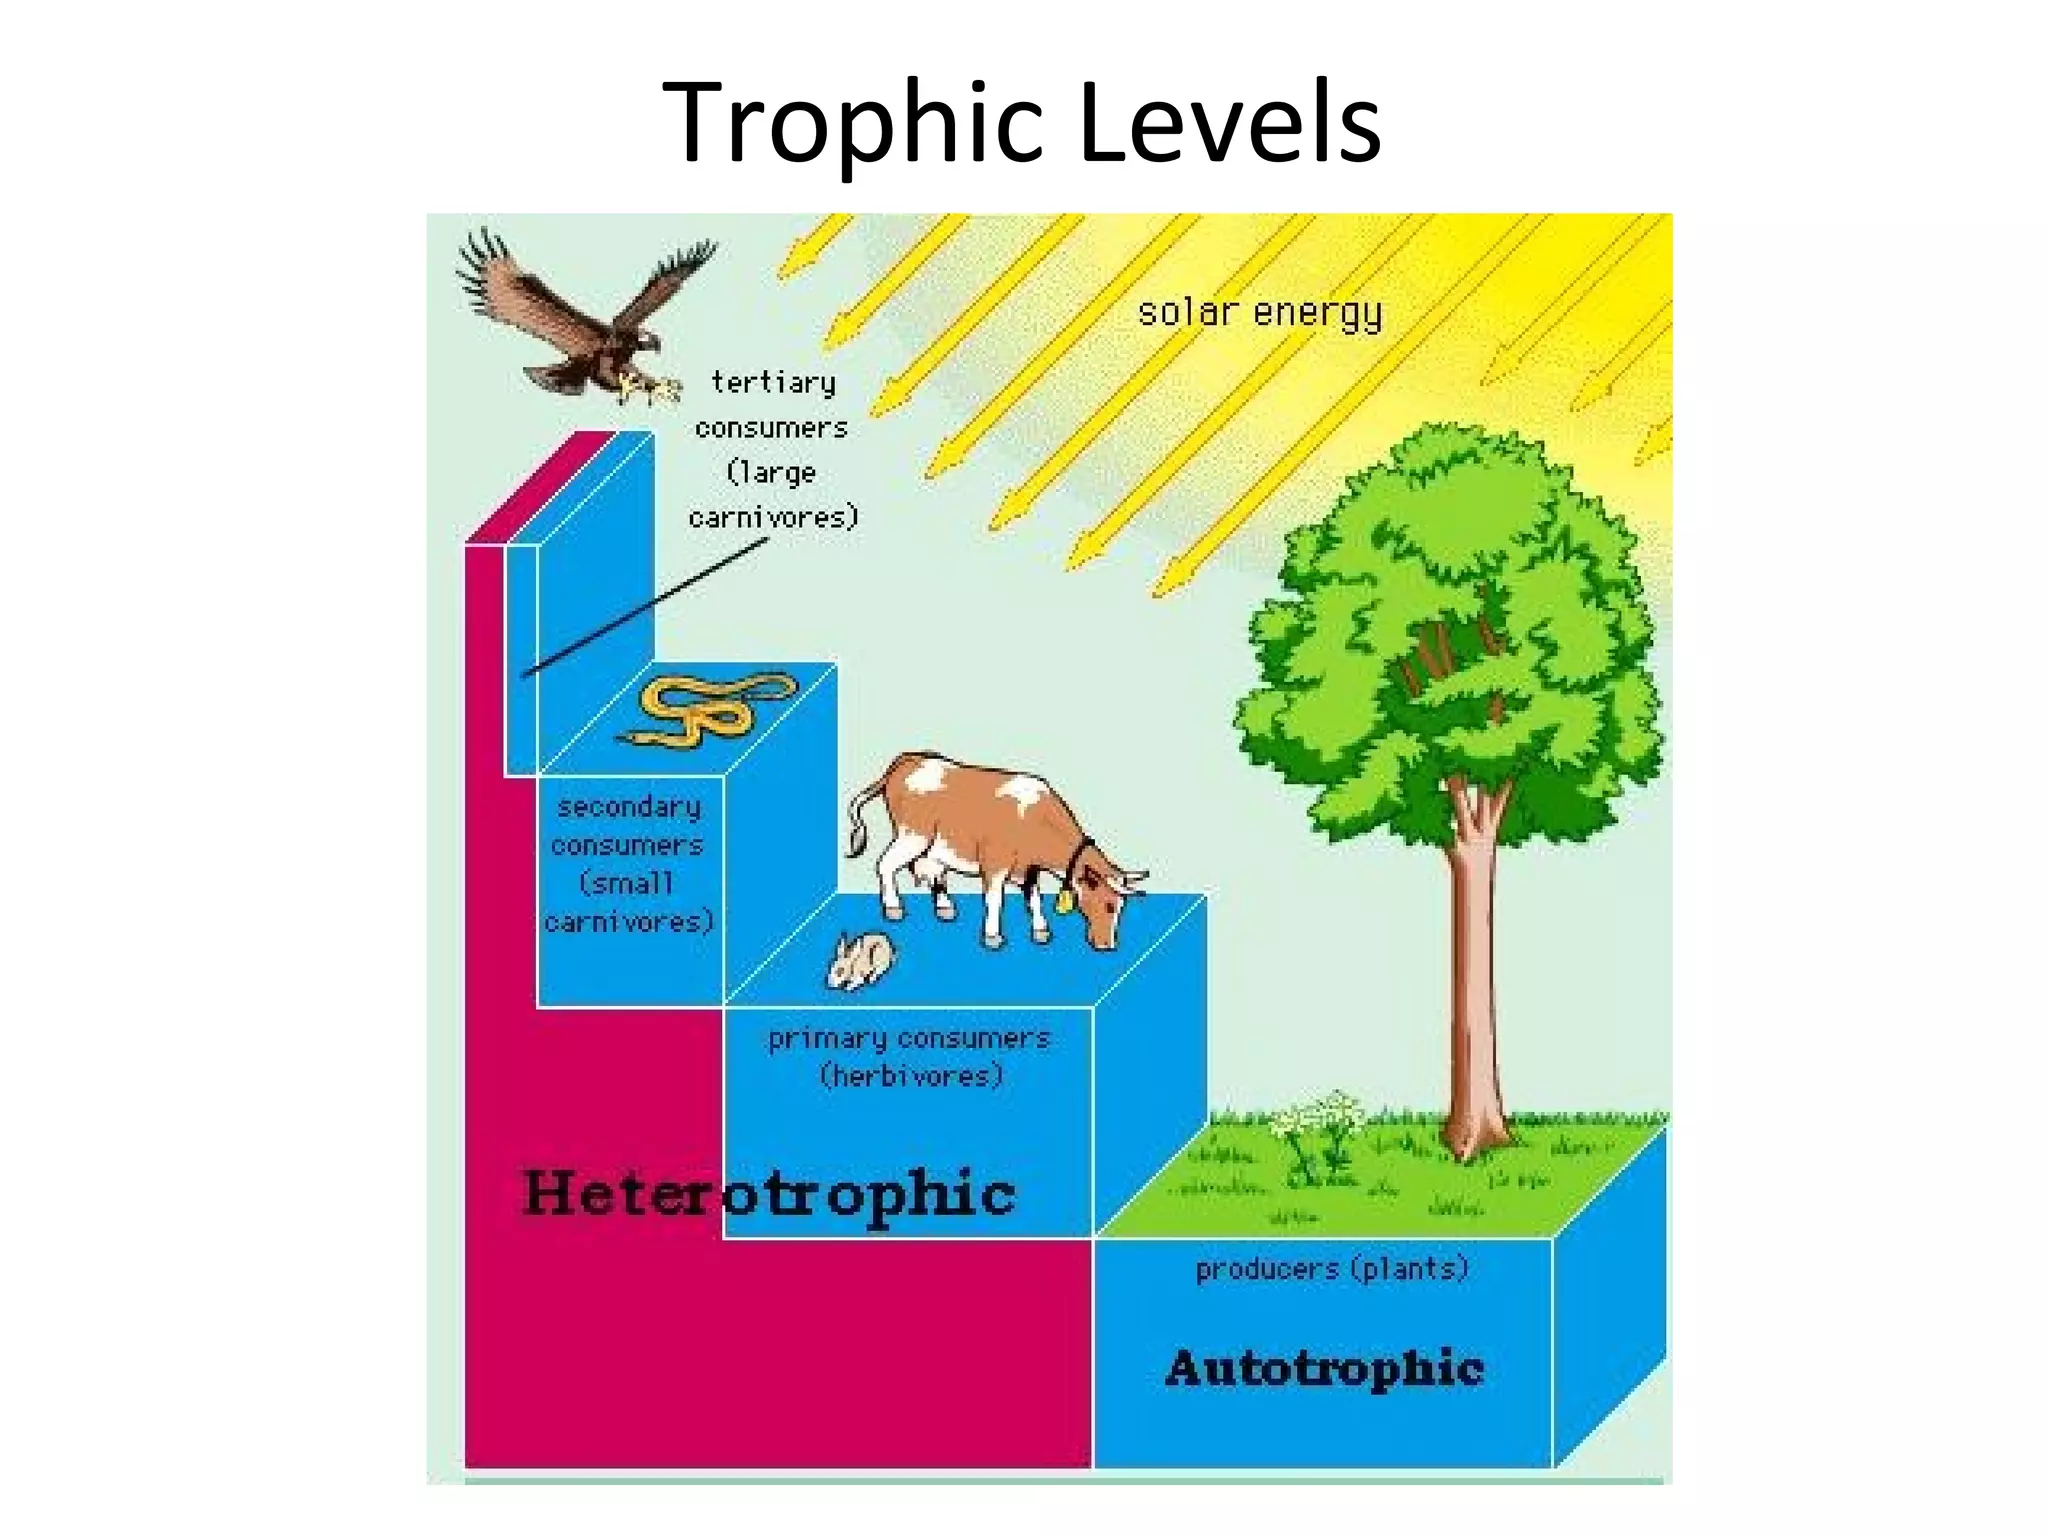
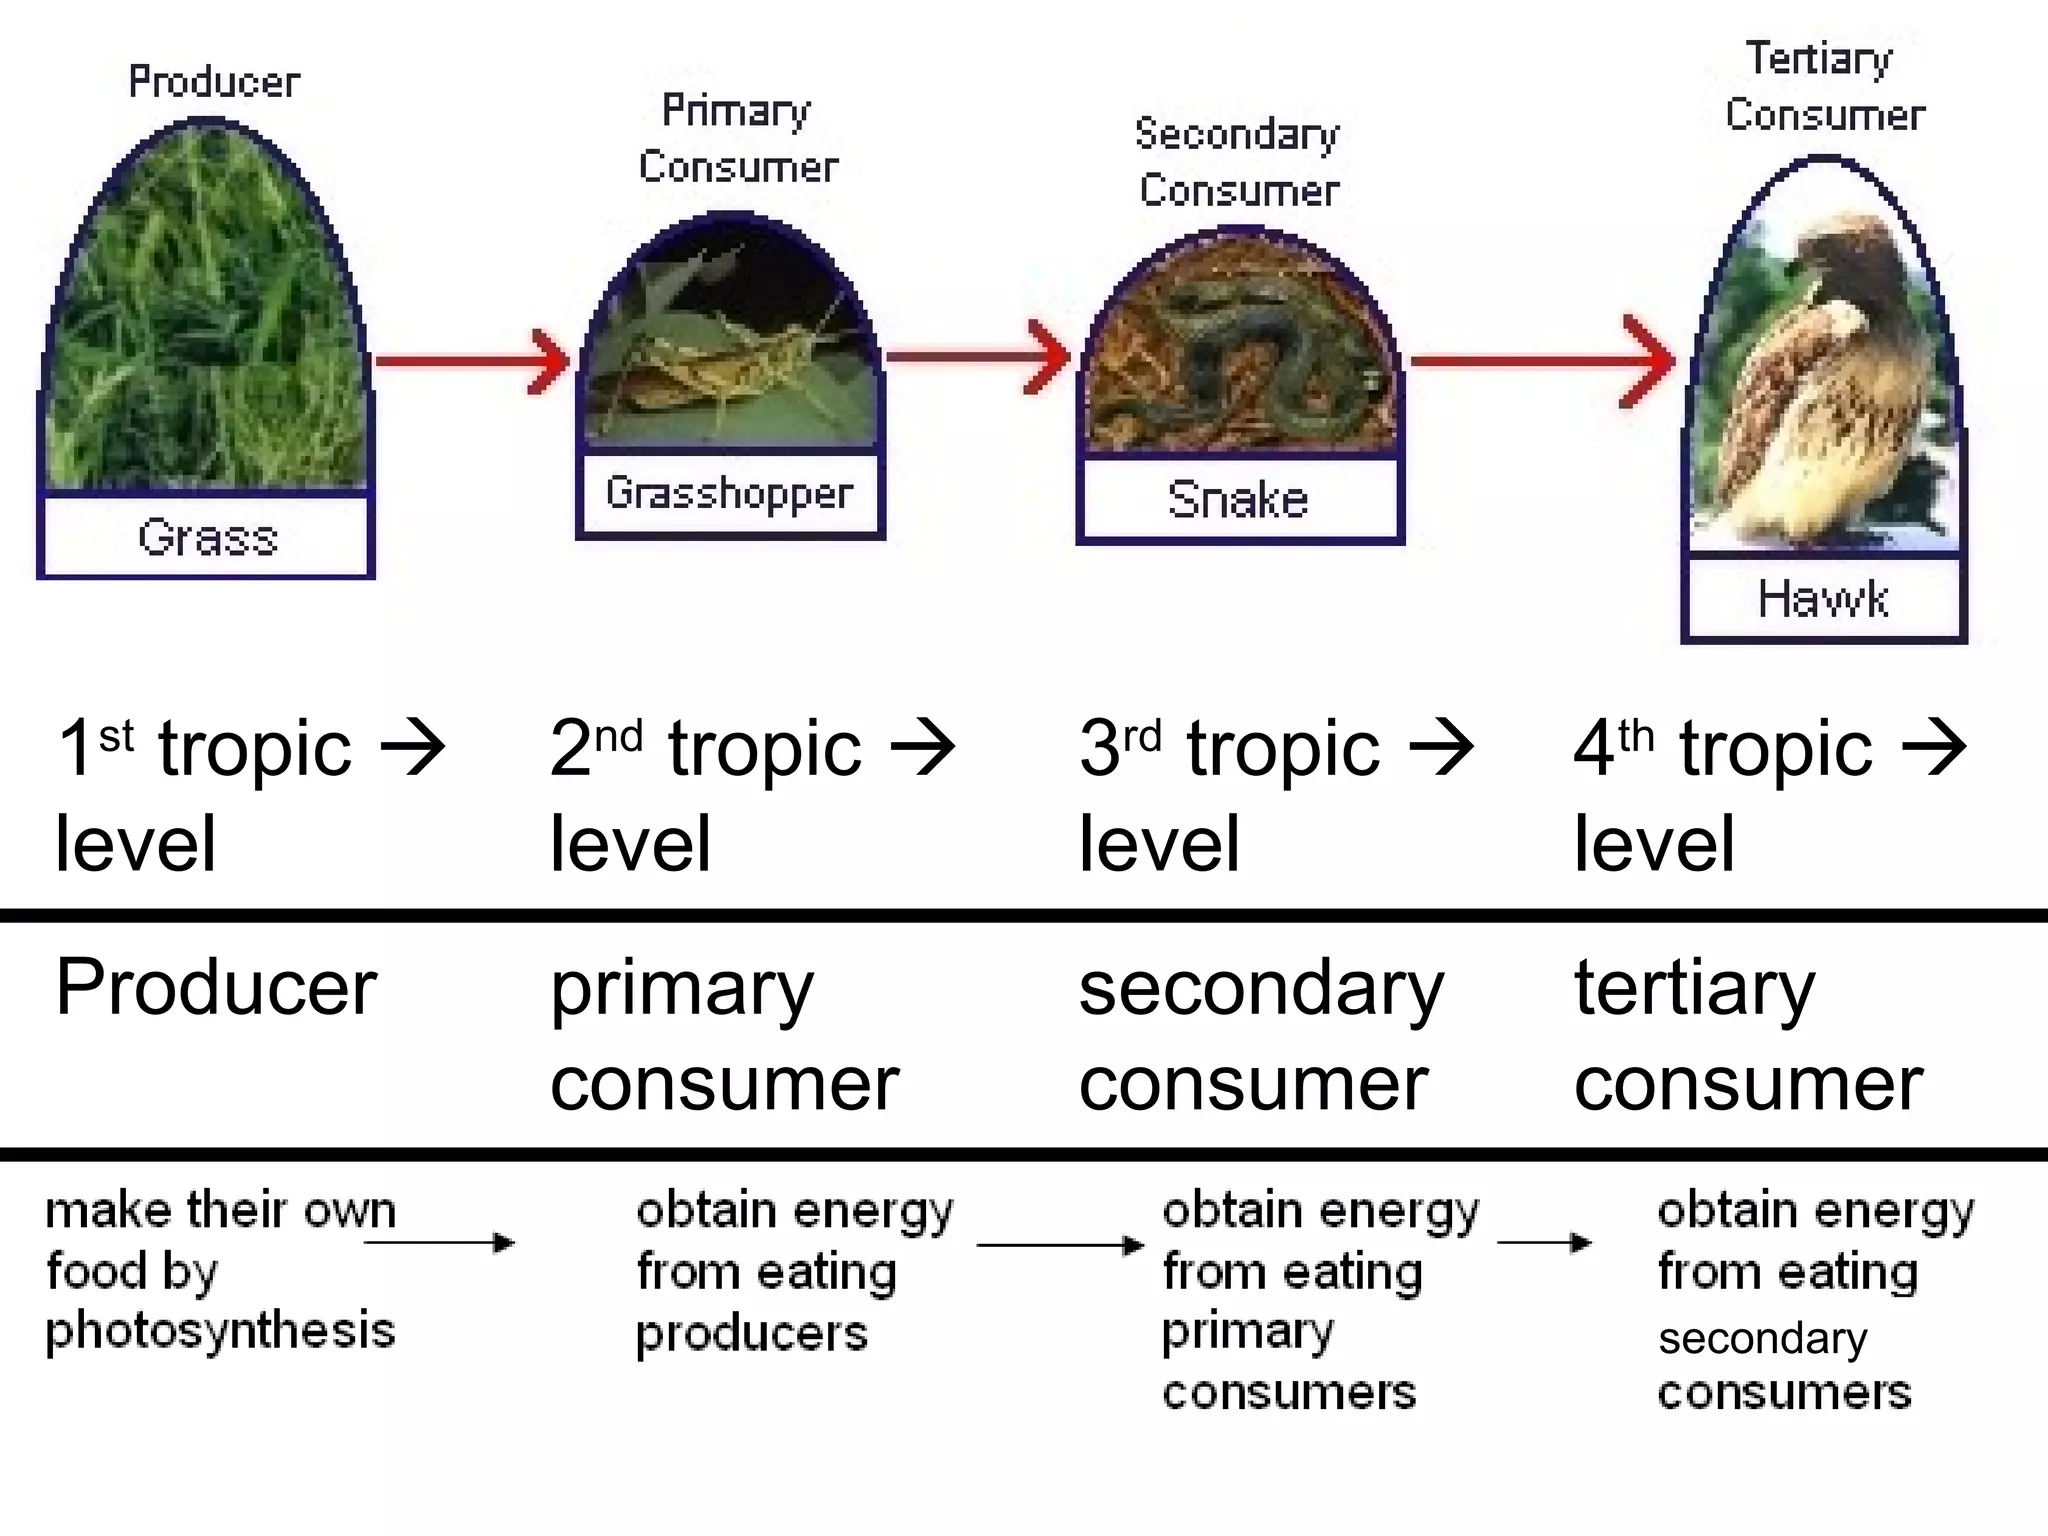
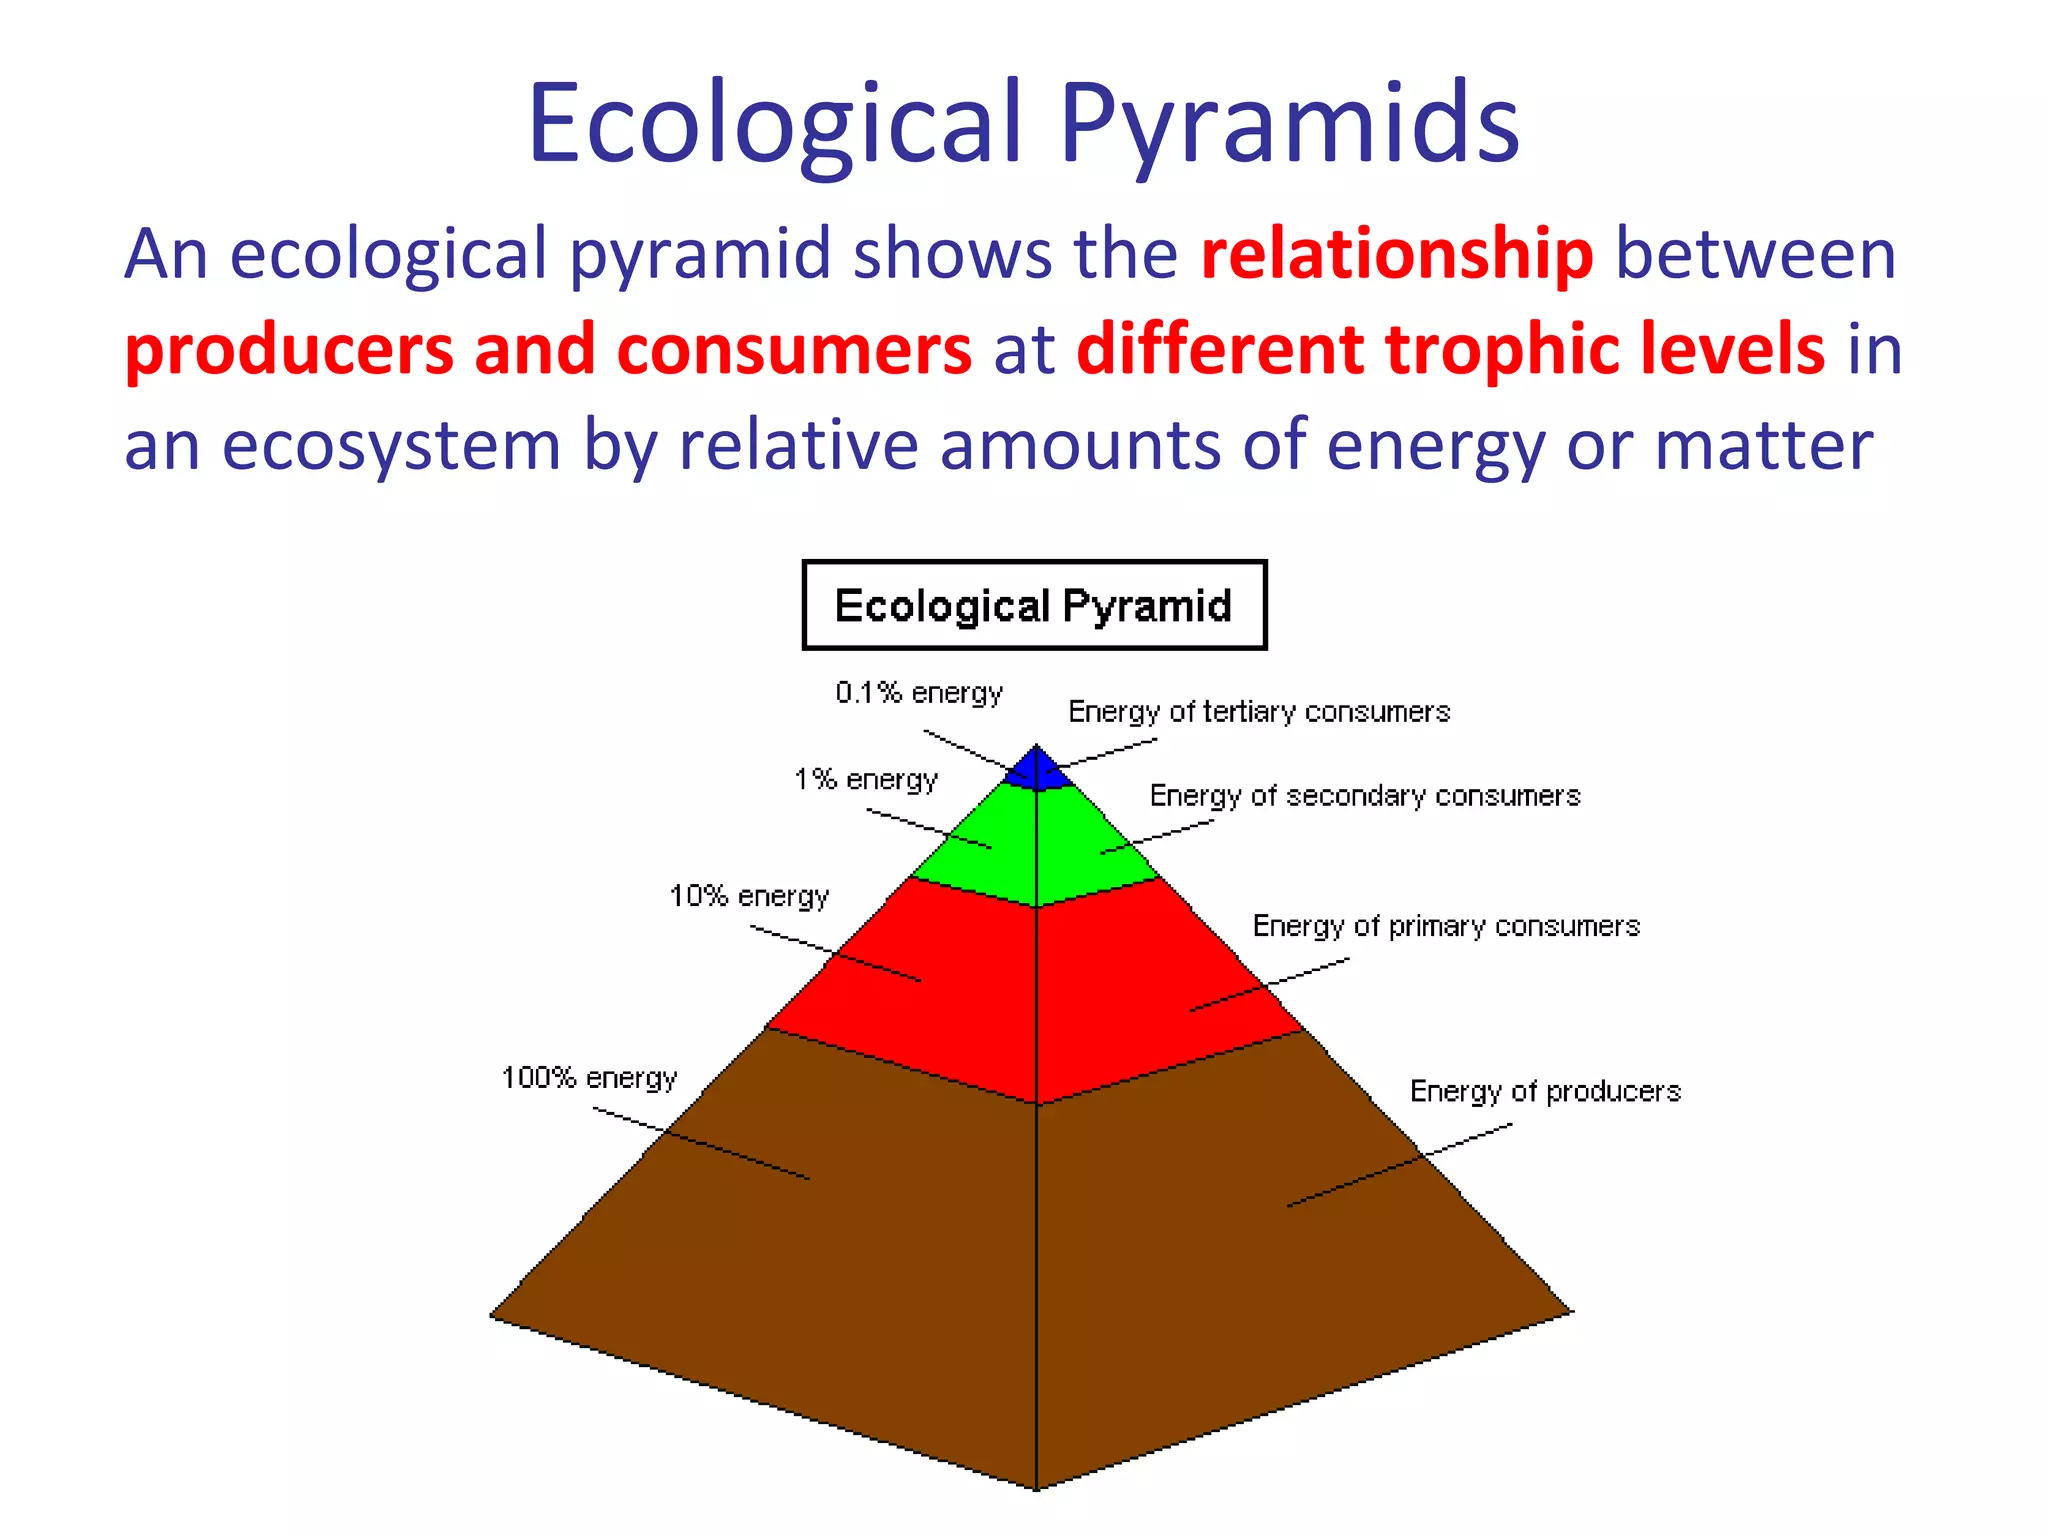
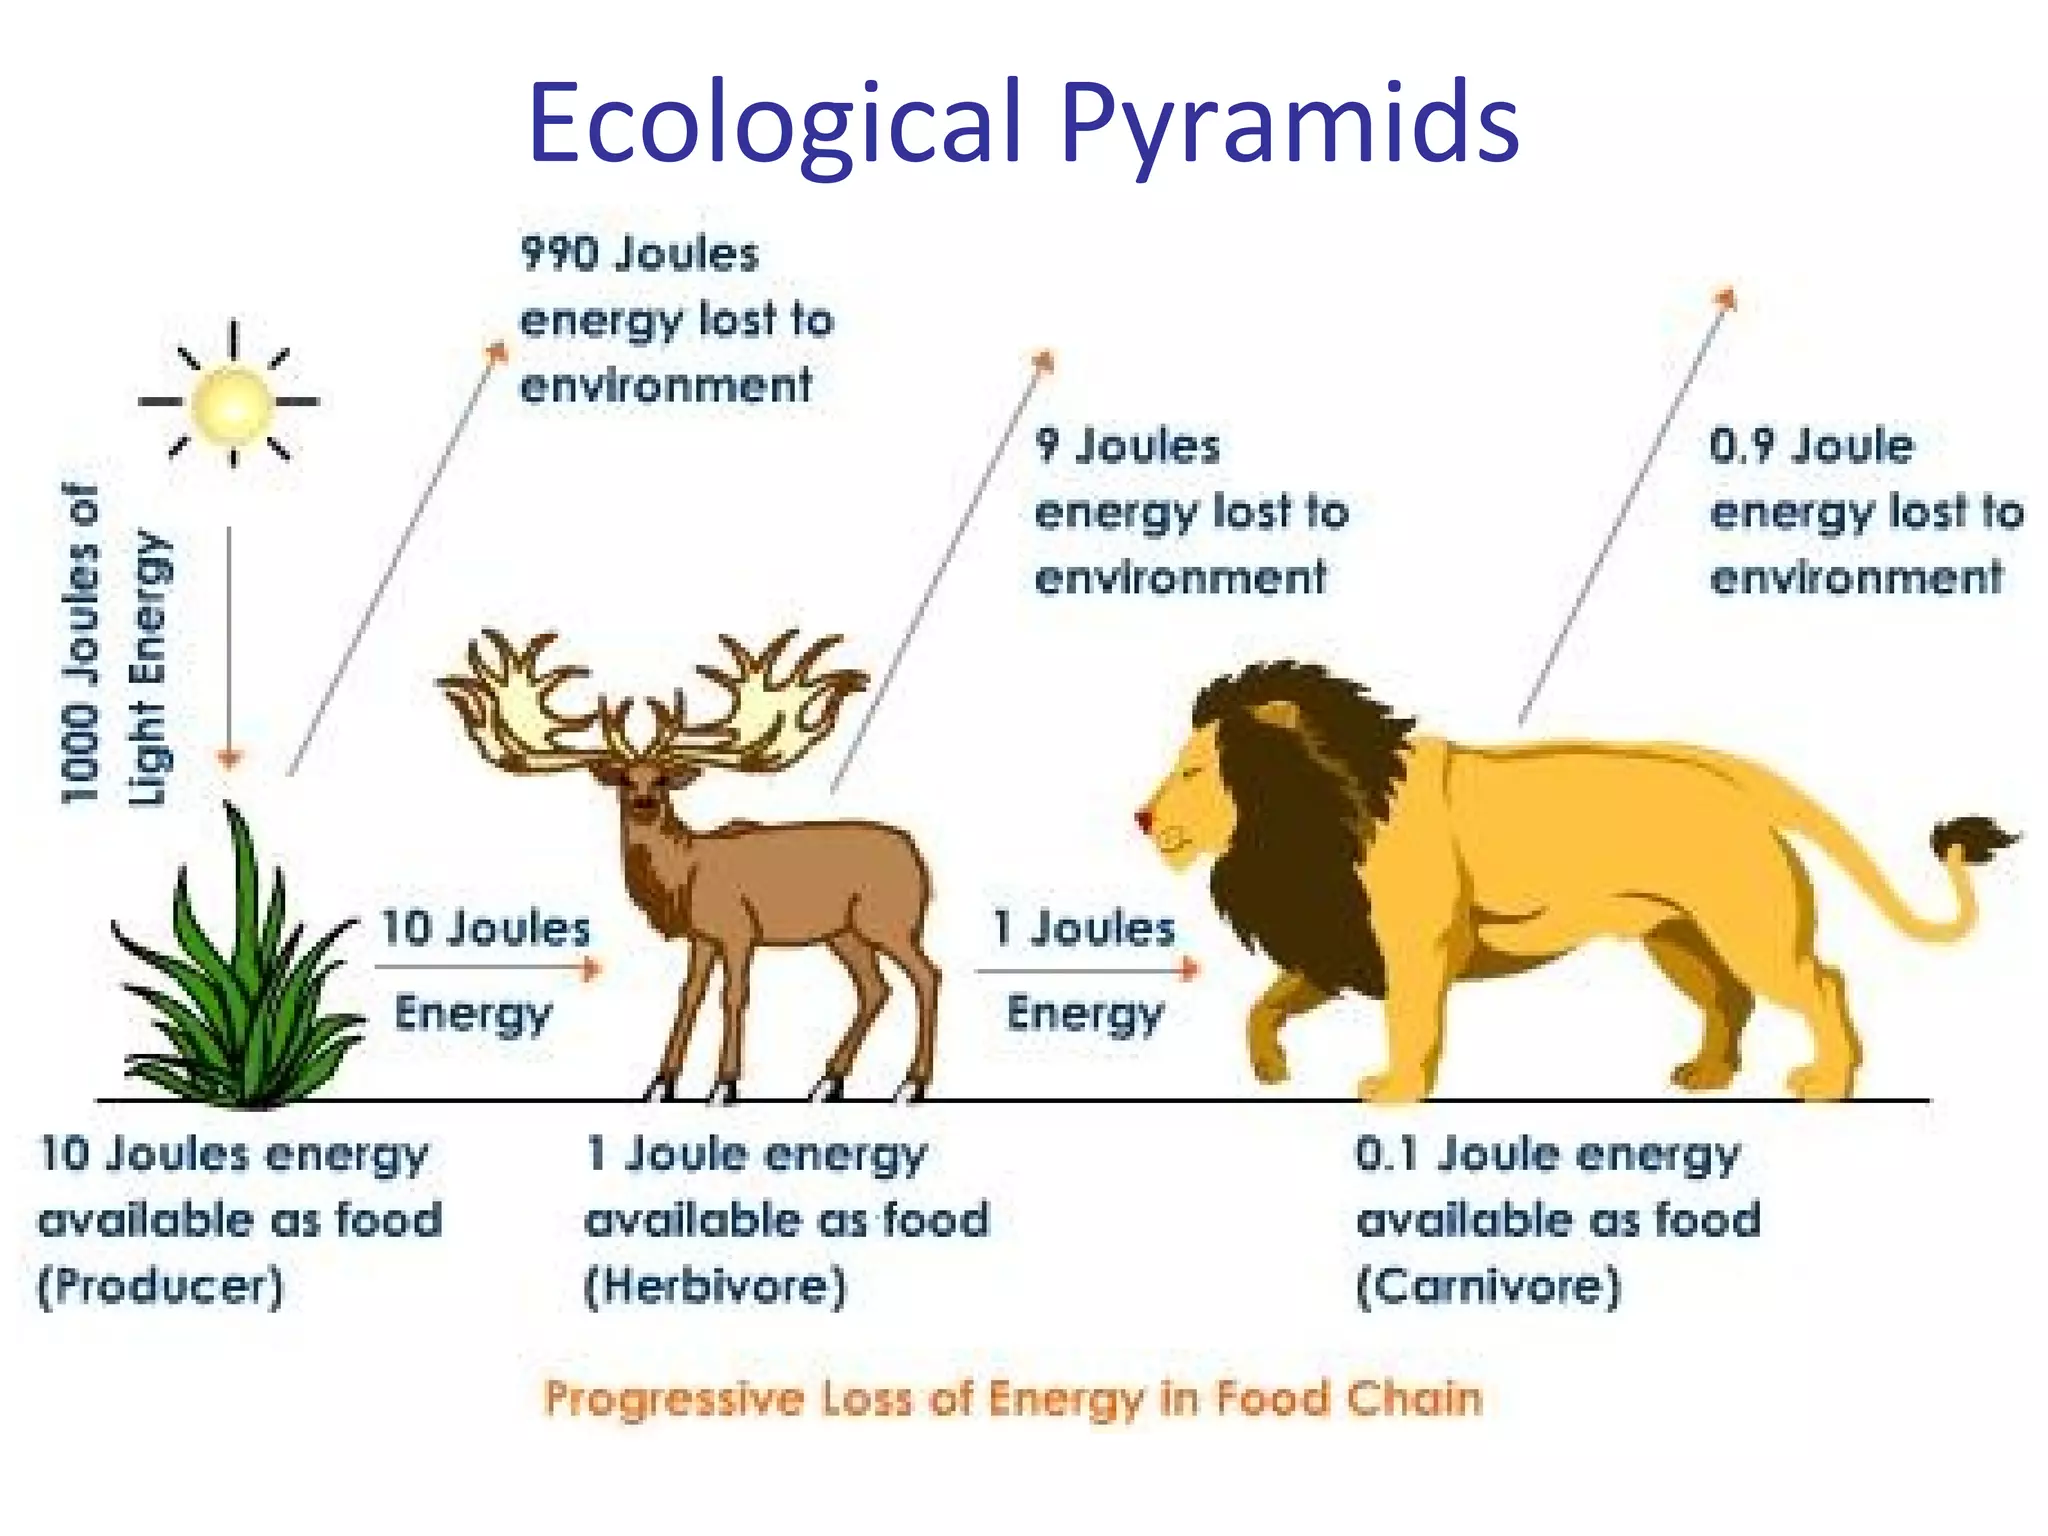
Energy Flow in Ecosystems
Terms to know:
Producers (autotrophs):
Organisms, like green plants, that
produce organic compounds
from inorganic compounds.
Consumers (heterotrophs):
Organisms that obtain nutrients
from other organisms.
Decomposers:
Organisms that break down the remains
of dead animals and plants, releasing the
substances that can be used by other
members of the ecosystem.
Energy Flow in Ecosystems
Almost all energy on
Earth comes from
radiant energy – the
energy from our sun.
Energy Flow in Ecosystems
Radiant energy that is
absorbed by land and
water is called thermal
energy. It keeps Earth
at its present
temperature range.
Energy Flow in Ecosystems
The portion of radiant energy we can see is called light
energy.
Energy Flow in Ecosystems
Producers can collect this energy and turn it into
chemical energy.
Energy Flow in Ecosystems
This process is called photosynthesis:
carbon dioxide + water + light energy  sugar + oxygen
Sugar is a source of high energy.
Energy Flow in Ecosystems
When a consumer eats a producer, it releases the energy
from the sugar in a process called cellular respiration:
sugar + oxygen  carbon dioxide + water + energy
Food Chains
"There's always a bigger fish."
– Qui-Gon Jinn
Food Chains
A food chain is a diagram which shows how organisms
are linked together by feeding relationships.
seed  mouse  cat
Food Chains
A food chain is a diagram which shows how organisms
are linked together by feeding relationships.
Food Chains
They always begin with a producer.
Food Chains
The arrows point in the direction of energy (food) flow.
Food Chains
Other Abiotic
Components
When organisms die, they are eaten by scavengers
(ex. vultures, crabs, hyenas).
Food Chains
Then they are
broken down by
decomposers
and detritivores
(bacteria and
fungi).
Food Chains
Food Chains
Other Abiotic
Components
Food Webs
- the connection of several
food chains.
- more realistic view of
energy transfer.
- show organisms as part of
an interlocking relationship.
Food Webs:
Food Webs
Food Webs
Trophic Levels
Trophic Levels
Are the feeding levels that describe the positions of
organisms along a food chain.
Trophic Levels
1st
tropic 
level
2nd
tropic 
level
3rd
tropic 
level
4th
tropic 
level
Producer primary
consumer
secondary
consumer
tertiary
consumer
secondary
Name an organism that:
- eats rabbits
- is on trophic level 2
- is an autotroph
- is a top carnivore
Think. Pair. Share.
Impacts on Food Webs
What would happen if an organism in a food chain
suddenly has a drastic change in population?
Think. Pair. Share.
What would happen if all
of the mangroves in this
ecosystem were cut down
by humans?
There would be no food
for the fish or crabs to
eat, so they would all die
off.
After the fish and crabs die,
the seabirds and pied
oyster catchers would also
starve.
What would happen
if a virus invaded
this ecosystem and
killed-off all of the
seabirds?
There would be no
predators to eat the
fish and the fish
population would
become very large.
If there are too many
fish in the ocean, they
may out-compete the
pied oyster catchers
for crabs and drive
them to starvation.
Think. Pair. Share.
Ecological Pyramids
Ecological Pyramids
No organism EVER receives all of the energy
from the organism they just consumed.
Ecological Pyramids
Only 10% of the energy from one trophic level is
transferred to the next (most of the energy is
lost as heat)
Ecological Pyramids
An ecological pyramid shows the relationship between
producers and consumers at different trophic levels in
an ecosystem by relative amounts of energy or matter
1) Pyramid of Numbers:
- show number of organisms in each trophic level
- usually numbers decrease as one moves up food chain
10 000 grass
900 ants
5 birds
Ecological Pyramids
Sometimes, it does not produce a proper pyramid in all
cases
1500 lice
4000 caterpillars
1 tree
5 birds
Ecological Pyramids
2) Pyramid of Biomass:
- The total mass of the organic matter at each trophic
level is called biomass
- Biomass is just another term for potential energy –
energy that is to be eaten and used.
Ecological Pyramids
2 kg lice
15 kg birds
200 kg caterpillars
2000 kg apple tree
10 kJ birds
100 kJ caterpillars
1000 kJ apple tree
1 kJ lice
3) Pyramid of Energy:
- show the total energy of organisms in a food chain
- this is the best way to show flow of energy through a
food chain
approx. 90% energy is lost with each transfer in the food web
Ecological Pyramids
Ecological Pyramids

04 energy flow in ecosystems

  • 1.
    Energy Flow inEcosystems
  • 2.
    Energy Flow inEcosystems Terms to know: Producers (autotrophs): Organisms, like green plants, that produce organic compounds from inorganic compounds. Consumers (heterotrophs): Organisms that obtain nutrients from other organisms. Decomposers: Organisms that break down the remains of dead animals and plants, releasing the substances that can be used by other members of the ecosystem.
  • 3.
    Energy Flow inEcosystems Almost all energy on Earth comes from radiant energy – the energy from our sun.
  • 4.
    Energy Flow inEcosystems Radiant energy that is absorbed by land and water is called thermal energy. It keeps Earth at its present temperature range.
  • 5.
    Energy Flow inEcosystems The portion of radiant energy we can see is called light energy.
  • 6.
    Energy Flow inEcosystems Producers can collect this energy and turn it into chemical energy.
  • 7.
    Energy Flow inEcosystems This process is called photosynthesis: carbon dioxide + water + light energy  sugar + oxygen Sugar is a source of high energy.
  • 8.
    Energy Flow inEcosystems When a consumer eats a producer, it releases the energy from the sugar in a process called cellular respiration: sugar + oxygen  carbon dioxide + water + energy
  • 9.
    Food Chains "There's alwaysa bigger fish." – Qui-Gon Jinn
  • 10.
    Food Chains A foodchain is a diagram which shows how organisms are linked together by feeding relationships. seed  mouse  cat
  • 11.
    Food Chains A foodchain is a diagram which shows how organisms are linked together by feeding relationships.
  • 12.
    Food Chains They alwaysbegin with a producer.
  • 13.
    Food Chains The arrowspoint in the direction of energy (food) flow.
  • 14.
  • 15.
    When organisms die,they are eaten by scavengers (ex. vultures, crabs, hyenas). Food Chains
  • 16.
    Then they are brokendown by decomposers and detritivores (bacteria and fungi). Food Chains
  • 17.
  • 18.
  • 19.
    - the connectionof several food chains. - more realistic view of energy transfer. - show organisms as part of an interlocking relationship. Food Webs:
  • 20.
  • 21.
  • 22.
  • 23.
    Trophic Levels Are thefeeding levels that describe the positions of organisms along a food chain.
  • 24.
  • 25.
    1st tropic  level 2nd tropic  level 3rd tropic level 4th tropic  level Producer primary consumer secondary consumer tertiary consumer secondary
  • 26.
    Name an organismthat: - eats rabbits - is on trophic level 2 - is an autotroph - is a top carnivore Think. Pair. Share.
  • 27.
    Impacts on FoodWebs What would happen if an organism in a food chain suddenly has a drastic change in population?
  • 28.
    Think. Pair. Share. Whatwould happen if all of the mangroves in this ecosystem were cut down by humans? There would be no food for the fish or crabs to eat, so they would all die off. After the fish and crabs die, the seabirds and pied oyster catchers would also starve.
  • 29.
    What would happen ifa virus invaded this ecosystem and killed-off all of the seabirds? There would be no predators to eat the fish and the fish population would become very large. If there are too many fish in the ocean, they may out-compete the pied oyster catchers for crabs and drive them to starvation. Think. Pair. Share.
  • 30.
  • 31.
    Ecological Pyramids No organismEVER receives all of the energy from the organism they just consumed.
  • 32.
    Ecological Pyramids Only 10%of the energy from one trophic level is transferred to the next (most of the energy is lost as heat)
  • 33.
    Ecological Pyramids An ecologicalpyramid shows the relationship between producers and consumers at different trophic levels in an ecosystem by relative amounts of energy or matter
  • 34.
    1) Pyramid ofNumbers: - show number of organisms in each trophic level - usually numbers decrease as one moves up food chain 10 000 grass 900 ants 5 birds Ecological Pyramids
  • 35.
    Sometimes, it doesnot produce a proper pyramid in all cases 1500 lice 4000 caterpillars 1 tree 5 birds Ecological Pyramids
  • 36.
    2) Pyramid ofBiomass: - The total mass of the organic matter at each trophic level is called biomass - Biomass is just another term for potential energy – energy that is to be eaten and used. Ecological Pyramids 2 kg lice 15 kg birds 200 kg caterpillars 2000 kg apple tree
  • 37.
    10 kJ birds 100kJ caterpillars 1000 kJ apple tree 1 kJ lice 3) Pyramid of Energy: - show the total energy of organisms in a food chain - this is the best way to show flow of energy through a food chain approx. 90% energy is lost with each transfer in the food web Ecological Pyramids
  • 38.

Editor's Notes