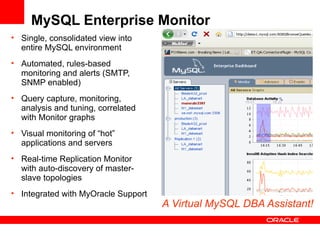
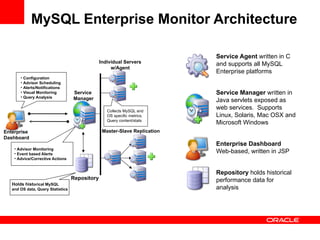
<Insert Picture Here>


MySQL Enterprise Monitor

Luca Olivari
Sales Consulting Leader - MySQL
DBAs and Developers Challenges


•   Expensive SQL?
•   Scalability and Performance Issues?
•   Scale DBAs to manage more servers?
•   Where, When, How to ...?
MySQL Enterprise Monitor
• Single, consolidated view into
  entire MySQL environment
• Automated, rules-based
  monitoring and alerts (SMTP,
  SNMP enabled)
• Query capture, monitoring,
  analysis and tuning, correlated
  with Monitor graphs
• Visual monitoring of “hot”
  applications and servers
• Real-time Replication Monitor
  with auto-discovery of master-
  slave topologies
• Integrated with MyOracle Support
                                     A Virtual MySQL DBA Assistant!
MySQL Enterprise Monitor Architecture

                                                                            Service Agent written in C
                                                Individual Servers          and supports all MySQL
                                                     w/Agent
                                                                            Enterprise platforms
       • Configuration
       • Advisor Scheduling
       • Alerts/Notifications
       • Visual Monitoring         Service                                  Service Manager written in
       • Query Analysis            Manager                                  Java servlets exposed as
                                                   Collects MySQL and
                                                                            web services. Supports
                                                   OS specific metrics,     Linux, Solaris, Mac OSX and
                                                   Query content/stats
                                                                            Microsoft Windows
Enterprise                                       Master-Slave Replication
Dashboard
                                                                            Enterprise Dashboard
    • Advisor Monitoring
    • Event based Alerts                                                    Web-based, written in JSP
    • Advice/Corrective Actions


                                                                            Repository holds historical
                                   Repository                               performance data for
   Holds historical MySQL
   and OS data, Query Statistics                                            analysis
Monitoring Queries with Connector/J, NET
       Application Server                                                                           MySQL Database

                                                  (SQL statements & result sets)‫‏‬
                3. Connector/J, NET                                                              3306

                    4. Plugin for Connector/J,
                    NET


                                                                                                        2. MySQL Agent

             (SQL performance data: statements,
             examples, EXPLAINs, aggregated
             stats)‫‏‬
                                                                             (MySQL & OS
                                                                             monitoring data)‫‏‬
                                                        18080


                                                                    1. MySQL Enterprise Monitor
                                                                    (Service Manager, Dashboard)‫‏‬


List of components to download & configure:

1.    MySQL Enterprise Monitor & Query Analyzer
2.    MySQL Agent
3.    Connector/J v5.1 or newer/ Connector/NET v6.2 or newer
4.    New! MySQL Enterprise Plugin for Connector/J, NET
Monitoring with Rules
MySQL Enterprise Advisors
                                              Administration
                 MySQL Cluster                                             Performance
                                          • Monitors and Advises on
         • Monitors and Advises on          Optimal Configuration       • Monitors and Advises
           status/ performance of                                         on Optimal
           MySQL Cluster Data                                             Performance Variable
           Nodes.                                                         Settings

           Custom                                                                  Replication
     • Built by DBA to
                                                                               • Monitors and Advises on
       Enforce Organization
       specific best practices.                                                  Master/Slave Latency.

           Upgrade                                                                  Security
      • Monitors and Advises on                                               • Monitors and Advises
        Bugs/Upgrades that affect                                               on Unplanned Security
        current installation                                                    Changes/Loopholes

                                      Schema                          Memory Usage
                                  • Monitors and Advises    • Monitors and advises
                                    on Unplanned Schema       on optimal
                                    Change                    memory/cache settings

                                  140+ Rules, 40+ Graphs
Save you time writing, deploying, versioning, maintaining custom scripts.
Visualize problems and tuning opportunities you cannot find yourself.
Graphs
    • 40+ graphs immediately virtualize system behavior
    • MySQL and OS data available


Binlog Cache - Connections - CPU – DB Activity – Transactions – Disk IO – Disk Space – Hit Ratios – InnoDB … - Load – Memory
Usage – MyISAM … - Network – Opened Tables – Query Cache – Row Access – Table Locks - ...
Automated Replication Monitor
• Auto-detects, groups/maintains
  Master/Slave topologies

• Consolidated, real time
  status/sync check

• Notification of any sync issues

• Saves you time by monitoring and
  collecting replication status/sync
  data from MySQL command line.
Integration with MyOracle Support


MySQL Enterprise Monitor
• Collect MySQL diagnostics and upload to MOS SR
• Track SRs from Enterprise Dashboard
• Saves DBA time
   • collecting data for Support team, tracking status
MySQL Query Analyzer
• Centralized monitoring of
  queries across all servers

• No need to rely on Slow Query
  Logs, SHOW PROCESSLIST,
  VMSTAT, etc.

• Aggregated view of query
  execution counts, time, and
  rows

• Saves time parsing atomic
  executions for total query
  expense

• Visual “grab and go” correlation
  with Monitor graphs
Query Execution Drill Downs
                  Example query exec
                     with variable
                      substitution

                   Trace query exec
                  back to source code


                             Full exec EXPLAIN
Relief for Administrators

Easy browser UI and Integration in SNMP frameworks
• quick overview, easy to use, same tools as always
140+ pre-defined rules enforce best-practice administration
• No more waste of time to develop monitoring, adapt to new version, …
Regular rule updates to monitor new features
• Fast adoption of new features without much effort
Comprehensive documentation
• Assistance for junior MySQL admins
Query Analyzer
• Easier to spot application problems
Support integration
• Save time in handling support issues, faster solution, better uptime
Thank You!

Making MySQL Better Everyday

02 -my_sql_roma-may2011

  • 1.
    <Insert Picture Here> MySQLEnterprise Monitor Luca Olivari Sales Consulting Leader - MySQL
  • 2.
    DBAs and DevelopersChallenges • Expensive SQL? • Scalability and Performance Issues? • Scale DBAs to manage more servers? • Where, When, How to ...?
  • 3.
    MySQL Enterprise Monitor •Single, consolidated view into entire MySQL environment • Automated, rules-based monitoring and alerts (SMTP, SNMP enabled) • Query capture, monitoring, analysis and tuning, correlated with Monitor graphs • Visual monitoring of “hot” applications and servers • Real-time Replication Monitor with auto-discovery of master- slave topologies • Integrated with MyOracle Support A Virtual MySQL DBA Assistant!
  • 4.
    MySQL Enterprise MonitorArchitecture Service Agent written in C Individual Servers and supports all MySQL w/Agent Enterprise platforms • Configuration • Advisor Scheduling • Alerts/Notifications • Visual Monitoring Service Service Manager written in • Query Analysis Manager Java servlets exposed as Collects MySQL and web services. Supports OS specific metrics, Linux, Solaris, Mac OSX and Query content/stats Microsoft Windows Enterprise Master-Slave Replication Dashboard Enterprise Dashboard • Advisor Monitoring • Event based Alerts Web-based, written in JSP • Advice/Corrective Actions Repository holds historical Repository performance data for Holds historical MySQL and OS data, Query Statistics analysis
  • 5.
    Monitoring Queries withConnector/J, NET Application Server MySQL Database (SQL statements & result sets)‫‏‬ 3. Connector/J, NET 3306 4. Plugin for Connector/J, NET 2. MySQL Agent (SQL performance data: statements, examples, EXPLAINs, aggregated stats)‫‏‬ (MySQL & OS monitoring data)‫‏‬ 18080 1. MySQL Enterprise Monitor (Service Manager, Dashboard)‫‏‬ List of components to download & configure: 1. MySQL Enterprise Monitor & Query Analyzer 2. MySQL Agent 3. Connector/J v5.1 or newer/ Connector/NET v6.2 or newer 4. New! MySQL Enterprise Plugin for Connector/J, NET
  • 6.
  • 7.
    MySQL Enterprise Advisors Administration MySQL Cluster Performance • Monitors and Advises on • Monitors and Advises on Optimal Configuration • Monitors and Advises status/ performance of on Optimal MySQL Cluster Data Performance Variable Nodes. Settings Custom Replication • Built by DBA to • Monitors and Advises on Enforce Organization specific best practices. Master/Slave Latency. Upgrade Security • Monitors and Advises on • Monitors and Advises Bugs/Upgrades that affect on Unplanned Security current installation Changes/Loopholes Schema Memory Usage • Monitors and Advises • Monitors and advises on Unplanned Schema on optimal Change memory/cache settings 140+ Rules, 40+ Graphs Save you time writing, deploying, versioning, maintaining custom scripts. Visualize problems and tuning opportunities you cannot find yourself.
  • 8.
    Graphs • 40+ graphs immediately virtualize system behavior • MySQL and OS data available Binlog Cache - Connections - CPU – DB Activity – Transactions – Disk IO – Disk Space – Hit Ratios – InnoDB … - Load – Memory Usage – MyISAM … - Network – Opened Tables – Query Cache – Row Access – Table Locks - ...
  • 9.
    Automated Replication Monitor •Auto-detects, groups/maintains Master/Slave topologies • Consolidated, real time status/sync check • Notification of any sync issues • Saves you time by monitoring and collecting replication status/sync data from MySQL command line.
  • 10.
    Integration with MyOracleSupport MySQL Enterprise Monitor • Collect MySQL diagnostics and upload to MOS SR • Track SRs from Enterprise Dashboard • Saves DBA time • collecting data for Support team, tracking status
  • 11.
    MySQL Query Analyzer •Centralized monitoring of queries across all servers • No need to rely on Slow Query Logs, SHOW PROCESSLIST, VMSTAT, etc. • Aggregated view of query execution counts, time, and rows • Saves time parsing atomic executions for total query expense • Visual “grab and go” correlation with Monitor graphs
  • 12.
    Query Execution DrillDowns Example query exec with variable substitution Trace query exec back to source code Full exec EXPLAIN
  • 13.
    Relief for Administrators Easybrowser UI and Integration in SNMP frameworks • quick overview, easy to use, same tools as always 140+ pre-defined rules enforce best-practice administration • No more waste of time to develop monitoring, adapt to new version, … Regular rule updates to monitor new features • Fast adoption of new features without much effort Comprehensive documentation • Assistance for junior MySQL admins Query Analyzer • Easier to spot application problems Support integration • Save time in handling support issues, faster solution, better uptime
  • 14.
    Thank You! Making MySQLBetter Everyday