Simple Kaplan-Meier Chart in plain JavaScript and HTML 20171031
•Download as DOCX, PDF•
0 likes•354 views

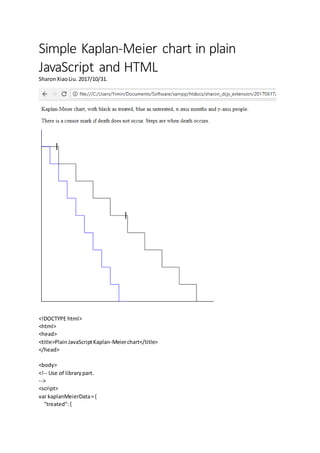
Kaplan-Meier chart.
!["xMonths":[0,50, 100, 150, 200, 250, 300, 350, 400, 450, 500],
"yPeople":[0,50, 100, 150, 200, 250, 300, 350, 400, 450, 500]
},
"treatedCensorMarks":{
"xMonths":[45, 245],
"yPeople":[50,250]
},
"untreated":{
"xMonths":[0,25, 50, 75, 100, 125, 150, 175, 200, 225, 250],
"yPeople":[0,50, 100, 150, 200, 250, 300, 350, 400, 450, 500]
}
};
</script>
<!-- Library part.
-->
<p>Kaplan-Meierchart,withblackastreated, blue asuntreated,x-axismonthsandy-axis
people.</p>
<p>There is a censormark if deathdoesnot occur. Stepsare whendeathoccurs.</p>
<svg height="500" width="500"id="kaplanMeierSvg">
<line x1="0" y1="500" x2="500" y2="500" style="stroke:rgb(0,0,0);stroke-width:2"
id="xAxis"/>
<line x1="0" y1="0" x2="0" y2="500" style="stroke:rgb(0,0,0);stroke-width:2"id="yAxis"/>
<polyline id="treated_steps_svg"/>
<polyline id="nonTreatedStepsSvg"/>
</svg>
<script>
window.onload=function(){
var getKaplanMeierSvg=document.getElementById('kaplanMeierSvg');
var kaplanMeierSvgHeight=kaplanMeierData.treated.yPeople[10];
var kaplanMeierSvgWidthTreated=kaplanMeierData.treated.xMonths[10];
var kaplanMeierSvgWidthUntreated=kaplanMeierData.untreated.xMonths[10];
if (kaplanMeierSvgWidthTreated>=kaplanMeierSvgWidthUntreated) {
var kaplanMeierSvgWidth=kaplanMeierSvgWidthTreated;
} else {
var kaplanMeierSvgWidth=kaplanMeierSvgWidthUntreated;
}
var getXAxis=document.getElementById('xAxis');
//The heightandwidthof the graph are determinedbythe data.
getXAxis.setAttribute("x2",kaplanMeierSvgWidth);
getXAxis.setAttribute("y1",kaplanMeierSvgHeight);
getXAxis.setAttribute("y2",kaplanMeierSvgHeight);
var getYAxis=document.getElementById('yAxis');
getYAxis.setAttribute("y2",kaplanMeierSvgHeight);
//Above all working.
var treatedSteps="";](data:image/gif;base64,R0lGODlhAQABAIAAAAAAAP///yH5BAEAAAAALAAAAAABAAEAAAIBRAA7)
Recommended
Recommended
More Related Content
More from Sharon Liu
More from Sharon Liu (20)
Recently uploaded
Recently uploaded (20)
Simple Kaplan-Meier Chart in plain JavaScript and HTML 20171031
- 1. Simple Kaplan-Meier chart in plain JavaScript and HTML SharonXiaoLiu. 2017/10/31. <!DOCTYPE html> <html> <head> <title>PlainJavaScriptKaplan-Meierchart</title> </head> <body> <!-- Use of librarypart. --> <script> var kaplanMeierData={ "treated":{
- 2. "xMonths":[0,50, 100, 150, 200, 250, 300, 350, 400, 450, 500], "yPeople":[0,50, 100, 150, 200, 250, 300, 350, 400, 450, 500] }, "treatedCensorMarks":{ "xMonths":[45, 245], "yPeople":[50,250] }, "untreated":{ "xMonths":[0,25, 50, 75, 100, 125, 150, 175, 200, 225, 250], "yPeople":[0,50, 100, 150, 200, 250, 300, 350, 400, 450, 500] } }; </script> <!-- Library part. --> <p>Kaplan-Meierchart,withblackastreated, blue asuntreated,x-axismonthsandy-axis people.</p> <p>There is a censormark if deathdoesnot occur. Stepsare whendeathoccurs.</p> <svg height="500" width="500"id="kaplanMeierSvg"> <line x1="0" y1="500" x2="500" y2="500" style="stroke:rgb(0,0,0);stroke-width:2" id="xAxis"/> <line x1="0" y1="0" x2="0" y2="500" style="stroke:rgb(0,0,0);stroke-width:2"id="yAxis"/> <polyline id="treated_steps_svg"/> <polyline id="nonTreatedStepsSvg"/> </svg> <script> window.onload=function(){ var getKaplanMeierSvg=document.getElementById('kaplanMeierSvg'); var kaplanMeierSvgHeight=kaplanMeierData.treated.yPeople[10]; var kaplanMeierSvgWidthTreated=kaplanMeierData.treated.xMonths[10]; var kaplanMeierSvgWidthUntreated=kaplanMeierData.untreated.xMonths[10]; if (kaplanMeierSvgWidthTreated>=kaplanMeierSvgWidthUntreated) { var kaplanMeierSvgWidth=kaplanMeierSvgWidthTreated; } else { var kaplanMeierSvgWidth=kaplanMeierSvgWidthUntreated; } var getXAxis=document.getElementById('xAxis'); //The heightandwidthof the graph are determinedbythe data. getXAxis.setAttribute("x2",kaplanMeierSvgWidth); getXAxis.setAttribute("y1",kaplanMeierSvgHeight); getXAxis.setAttribute("y2",kaplanMeierSvgHeight); var getYAxis=document.getElementById('yAxis'); getYAxis.setAttribute("y2",kaplanMeierSvgHeight); //Above all working. var treatedSteps="";
- 3. for (vari = 0; i < kaplanMeierData.treated.xMonths.length;i++) { treatedSteps+=kaplanMeierData.treated.xMonths[i] +","+ kaplanMeierData.treated.yPeople[i] +" "; if (i != kaplanMeierData.treated.xMonths.length-1){ treatedSteps+=kaplanMeierData.treated.xMonths[i] +"," + kaplanMeierData.treated.yPeople[i+1] + " "; } } get_treated_steps_svg=document.getElementById('treated_steps_svg'); get_treated_steps_svg.setAttribute("points",treatedSteps); get_treated_steps_svg.setAttribute("style","fill:none;stroke:black;stroke-width:1"); //0,0 0,50 50,50 50,100 100,100 var untreatedSteps=""; for (varj = 0; j < kaplanMeierData.untreated.xMonths.length;j++) { untreatedSteps+=kaplanMeierData.untreated.xMonths[j] +","+ kaplanMeierData.untreated.yPeople[j] +" "; if (j != kaplanMeierData.untreated.xMonths.length-1){ untreatedSteps+=kaplanMeierData.untreated.xMonths[j] +"," + kaplanMeierData.untreated.yPeople[j+1] +" "; } } document.getElementById("nonTreatedStepsSvg").setAttribute("points",untreatedSteps); document.getElementById("nonTreatedStepsSvg").setAttribute("style", "fill:none;stroke:blue;stroke-width:1"); //(0,0) 0,50 (25,50) 25,100 (50,100) var censorMarksLength= kaplanMeierData.treatedCensorMarks.xMonths.length; var censorMarks= ""; for (vari = 0; i<censorMarksLength;i++) { censorMarks += "<line x1=""; var verticalCensorMarkX =kaplanMeierData.treatedCensorMarks.xMonths[i]; censorMarks+= verticalCensorMarkX; censorMarks+= "" y1=""; var verticalCensorMarkYStart=kaplanMeierData.treatedCensorMarks.yPeople[i]-10; censorMarks+= verticalCensorMarkYStart; censorMarks+= "" x2=""; censorMarks+= verticalCensorMarkX; censorMarks+= "" y2=""; var verticalCensorMarkYFinish=kaplanMeierData.treatedCensorMarks.yPeople[i]+10; censorMarks+= verticalCensorMarkYFinish; censorMarks+= "" style="stroke:black;stroke-width:2;"/>"; } //Appendthe censormarkstogetKaplanMeierSvg. getKaplanMeierSvg.innerHTML+= censorMarks; }; </script>