S&P 500 + Gdp 1970 2009
•Download as PPTX, PDF•
0 likes•223 views

I wanted to look at how the S&P and GDP figures align (or don't align) over the years. Again, I didn't quickly find the charts I was looking for, so I created my own.

Recommended
Recommended
More Related Content
What's hot
What's hot (19)
Recently uploaded
Recently uploaded (20)
S&P 500 + Gdp 1970 2009
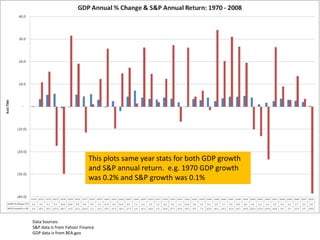
- 1. This plots same year stats for both GDP growth and S&P annual return. e.g. 1970 GDP growth was 0.2% and S&P growth was 0.1% Data Sources:S&P data is from Yahoo! FinanceGDP data is from BEA.gov
- 2. This plots current year S&P stats along side next year’s GDP stats. e.g. 1970’s S&P growth was 0.1% and 1971’s GDP growth was 3.4% Data Sources:S&P data is from Yahoo! FinanceGDP data is from BEA.gov